


Características


¿Tienes alguna pregunta?
Recomendar


7 diapositivas
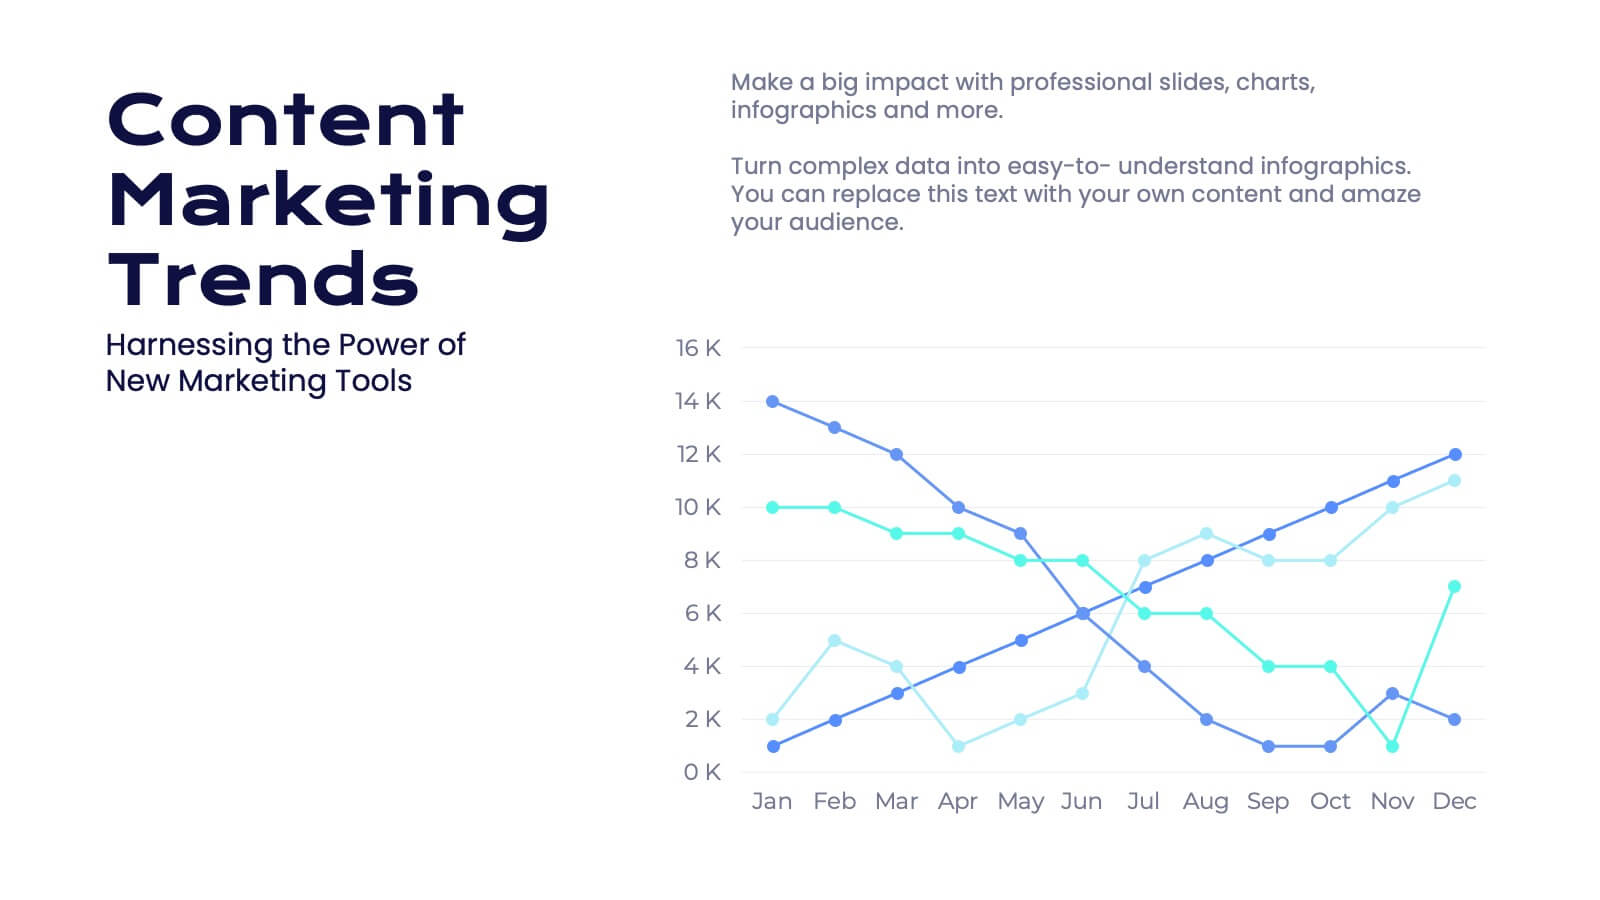
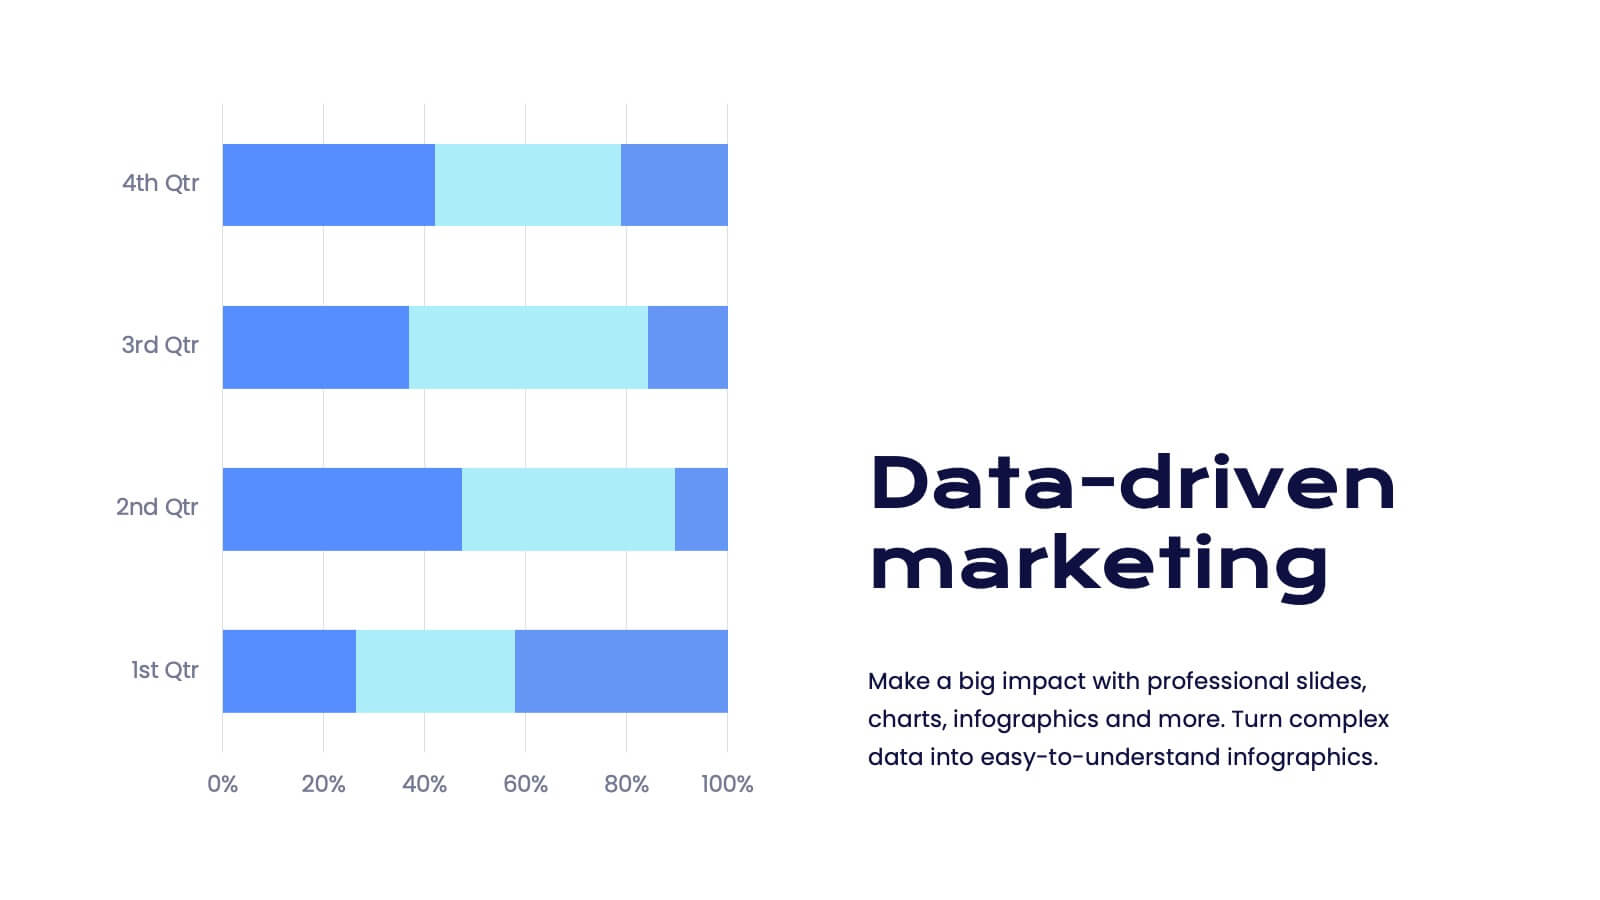
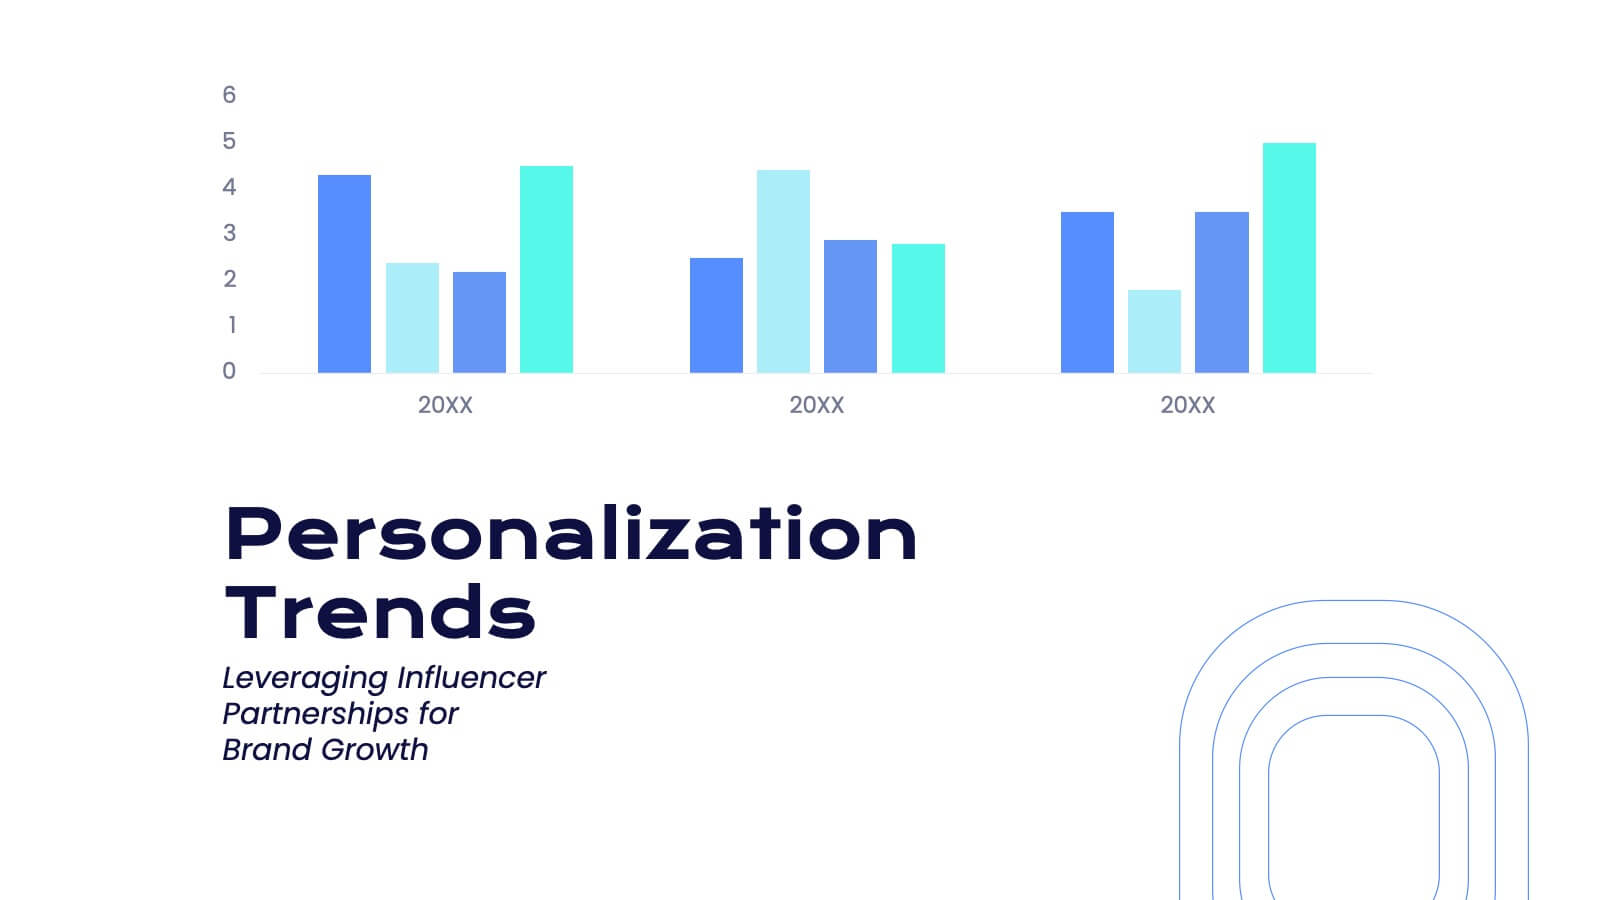
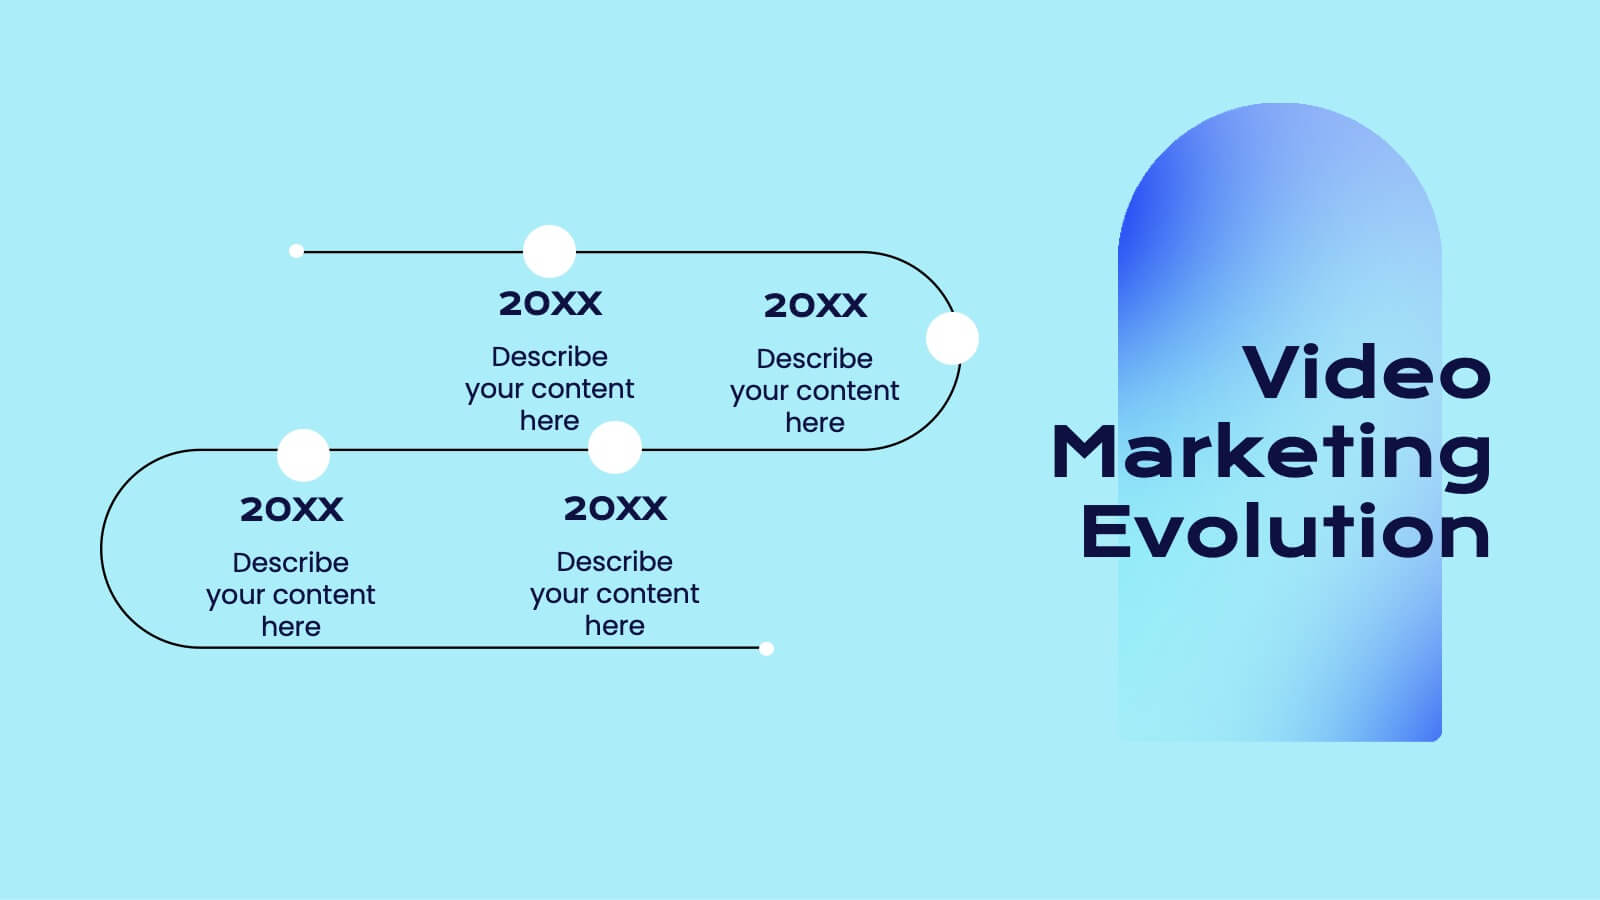
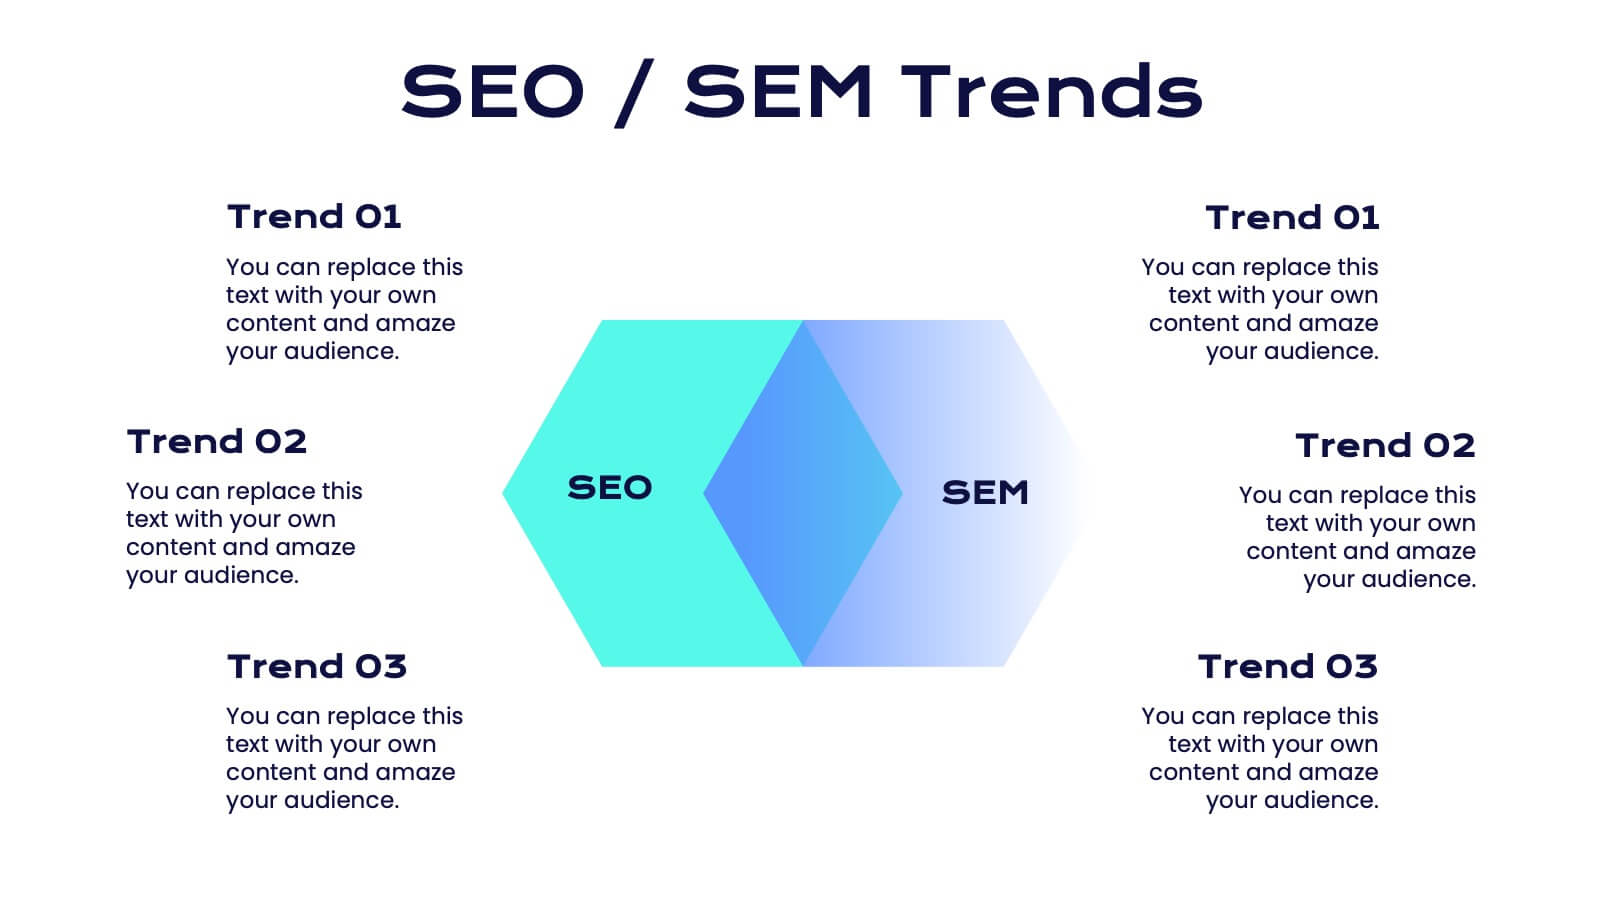
Technology Infographic Presentation Template
A technology infographic is a visual representation of information or data related to technology. The purpose of this template is to present your complex information in a simple, easy-to-understand manner. This template contains pre-designed layouts and images that can be used to structure your content in a variety of ways. This template is perfect to use to help explain technology-related topics such as software, hardware, cybersecurity, and more. Infographics are commonly used in the technology industry to help educate people about the latest trends, products, and services.


4 diapositivas
Annual Calendar Layout for Projects
Plan your year like a pro with this clean and colorful visual layout—it’s designed to help you stay focused, organized, and on track month by month. Whether you're mapping out team projects, campaign milestones, or business goals, this annual calendar format makes it easy to see everything at a glance. Fully compatible with PowerPoint, Keynote, and Google Slides.


5 diapositivas
Business Investment in Africa Map Presentation
Explore promising markets with the "Business Investment in Africa Map" template, designed to provide a visual overview of investment opportunities across the continent. It features a map with marked regions, each linked to specific data points about business prospects. Ideal for investors or companies looking at market penetration or expansion within Africa, this layout helps in making data-driven decisions by providing a clear, concise visual representation of key information.


26 diapositivas
Natlea Presentation Template
Need help presenting your next travel destination? This template is a unique and sophisticated way to present your travel destination. The Natlea travel template is a fun, surprisingly sophisticated and easy to use template that allows you to list all the details of your trip. With bold colors, charts, budget slides and venn diagrams this template has it all. It's simple yet fun design makes it stand out and at the same time keep your audience engaged. This is the perfect choice for marketers, tourism professionals or anyone who needs to make a great looking presentation on their next trip.


6 diapositivas
Creative Geometric Infographic
Showcase interconnected ideas with this sleek, six-part 3D geometric ring. Designed for clarity and impact, this layout is perfect for processes, cycles, or strategic segments. Compatible with PowerPoint, Keynote, and Google Slides.


5 diapositivas
5 Module Online Training Content Presentation
Kick off your training session with a clean, engaging visual that maps out each module in a clear, easy-to-follow flow. This presentation helps you organize lessons, outline learning goals, and guide learners through a structured digital program. Fully compatible with PowerPoint, Keynote, and Google Slides.


2 diapositivas
Detailed Buyer Profile Analysis Layout Presentation
Showcase a clear snapshot of your customer insights with this Detailed Buyer Profile Analysis Layout. This modern slide helps you outline bios, goals, and key traits using labeled icons, progress bars, and a visual profile section. Ideal for marketing teams, persona development, and product targeting. Fully editable in PowerPoint, Keynote, and Google Slides.


6 diapositivas
Targeted Segment Analysis and Mapping Presentation
Highlight your market focus with the Targeted Segment Analysis and Mapping Presentation. This circular layout is perfect for breaking down five audience segments, using subtle icons and visual emphasis for clarity. Ideal for marketers, strategists, and business analysts presenting niche targeting. Fully editable in Canva, PowerPoint, Keynote, and Google Slides.


5 diapositivas
User Experience Survey Findings Presentation
Present key insights from your user research in a clean and impactful way with this survey findings slide. Designed to highlight percentages and categories clearly, it helps your audience quickly understand what users value most. Ideal for UX reports and product feedback reviews. Fully compatible with PowerPoint, Keynote, and Google Slides.


7 diapositivas
Organizational Change with 7S Framework Presentation
Visualize organizational transformation with the Organizational Change with 7S Framework Presentation. This slide highlights each element of the McKinsey 7S model—Structure, Strategy, Systems, Shared Values, Skills, Style, and Staff—along an S-shaped flow. Ideal for consulting, internal alignment, and strategic planning discussions. Fully editable in Canva, PowerPoint, Keynote, and Google Slides.


6 diapositivas
RAPID Framework for Business Strategy Presentation
Unveil a dynamic approach to strategic decision-making with the RAPID Framework for Business Strategy template. This structured layout covers the Recommend, Agree, Perform, Input, and Decide stages, offering a comprehensive toolkit for business planning and execution. This versatile template is essential for teams aiming to enhance strategic planning and is compatible with PowerPoint, Keynote, and Google Slides, making it accessible for a wide range of business professionals.


5 diapositivas
Project Boundaries and Deliverables Presentation
Visualize key checkpoints with the Project Boundaries and Deliverables Presentation. This flag-style timeline infographic clearly marks each phase of your project journey—ideal for outlining scope, goals, and delivery milestones. Designed for clarity and progress tracking, this template works seamlessly in PowerPoint, Keynote, and Google Slides.


5 diapositivas
Mind and Brain Creativity Concept Diagram Presentation
Ignite fresh thinking with the Mind and Brain Creativity Concept Diagram Presentation—a smart and visually engaging template that maps out five core concepts around a central brain icon. Each idea is linked with intuitive visuals and labeled A through E, ideal for creative strategy, innovation pitches, or mental model breakdowns. Fully customizable in PowerPoint, Keynote, and Google Slides.


20 diapositivas
Oracle Startup Strategy Presentation
Launch your startup strategy with this sleek template! Perfect for detailing your mission, vision, business model, and market analysis. Ideal for entrepreneurs aiming to impress investors and stakeholders. Compatible with PowerPoint, Keynote, and Google Slides, this template ensures your startup strategy is professional, clear, and compelling. Secure your path to success!


20 diapositivas
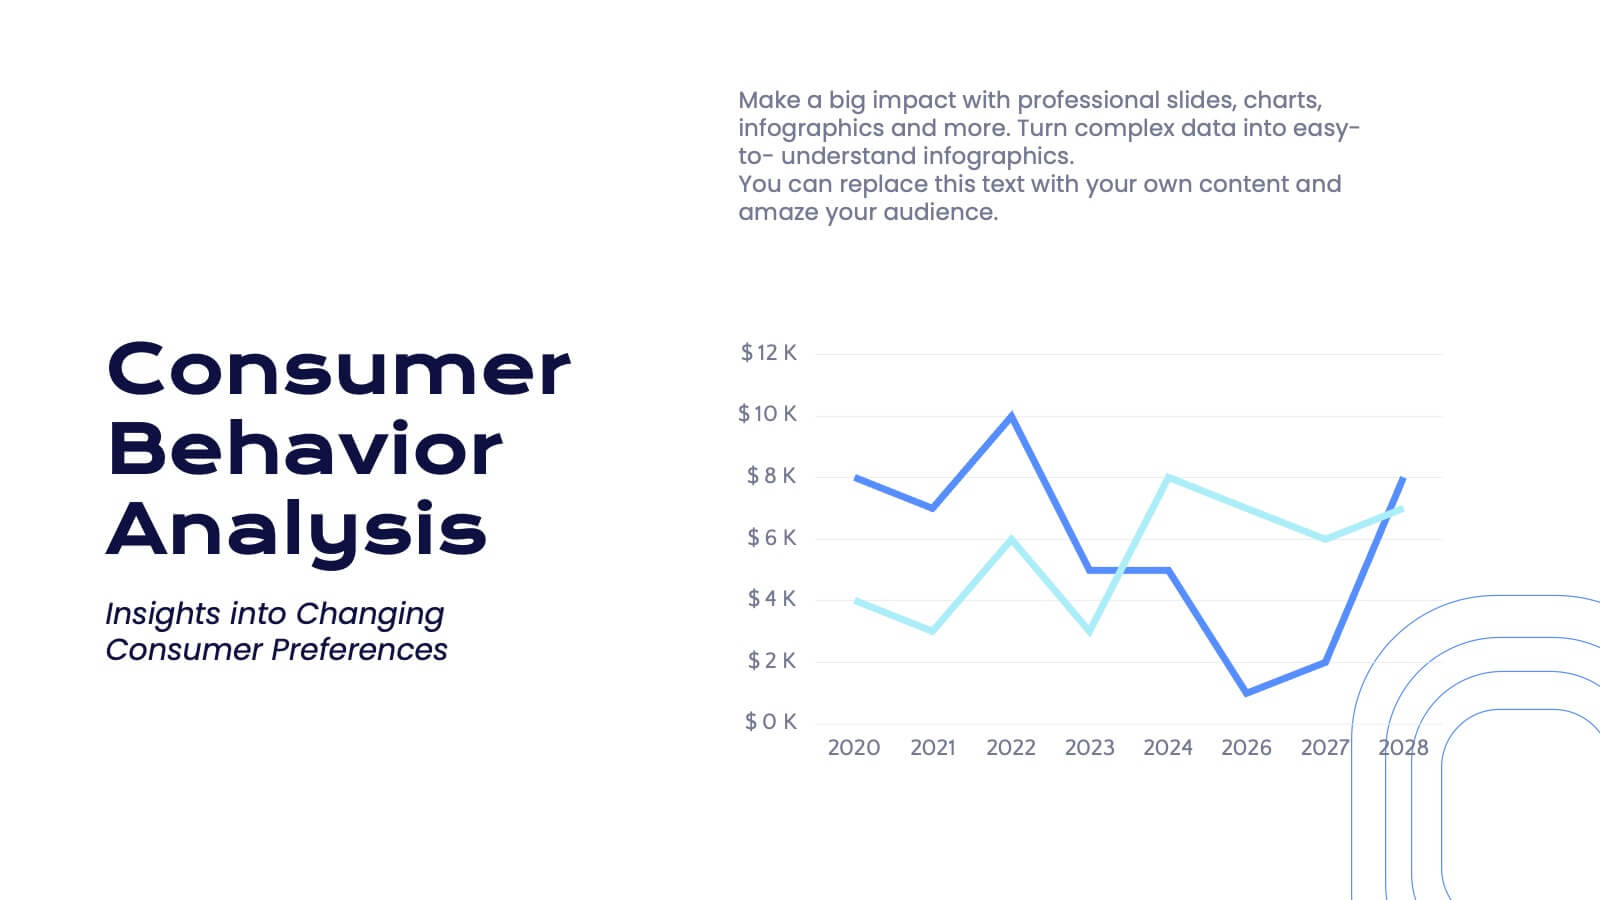
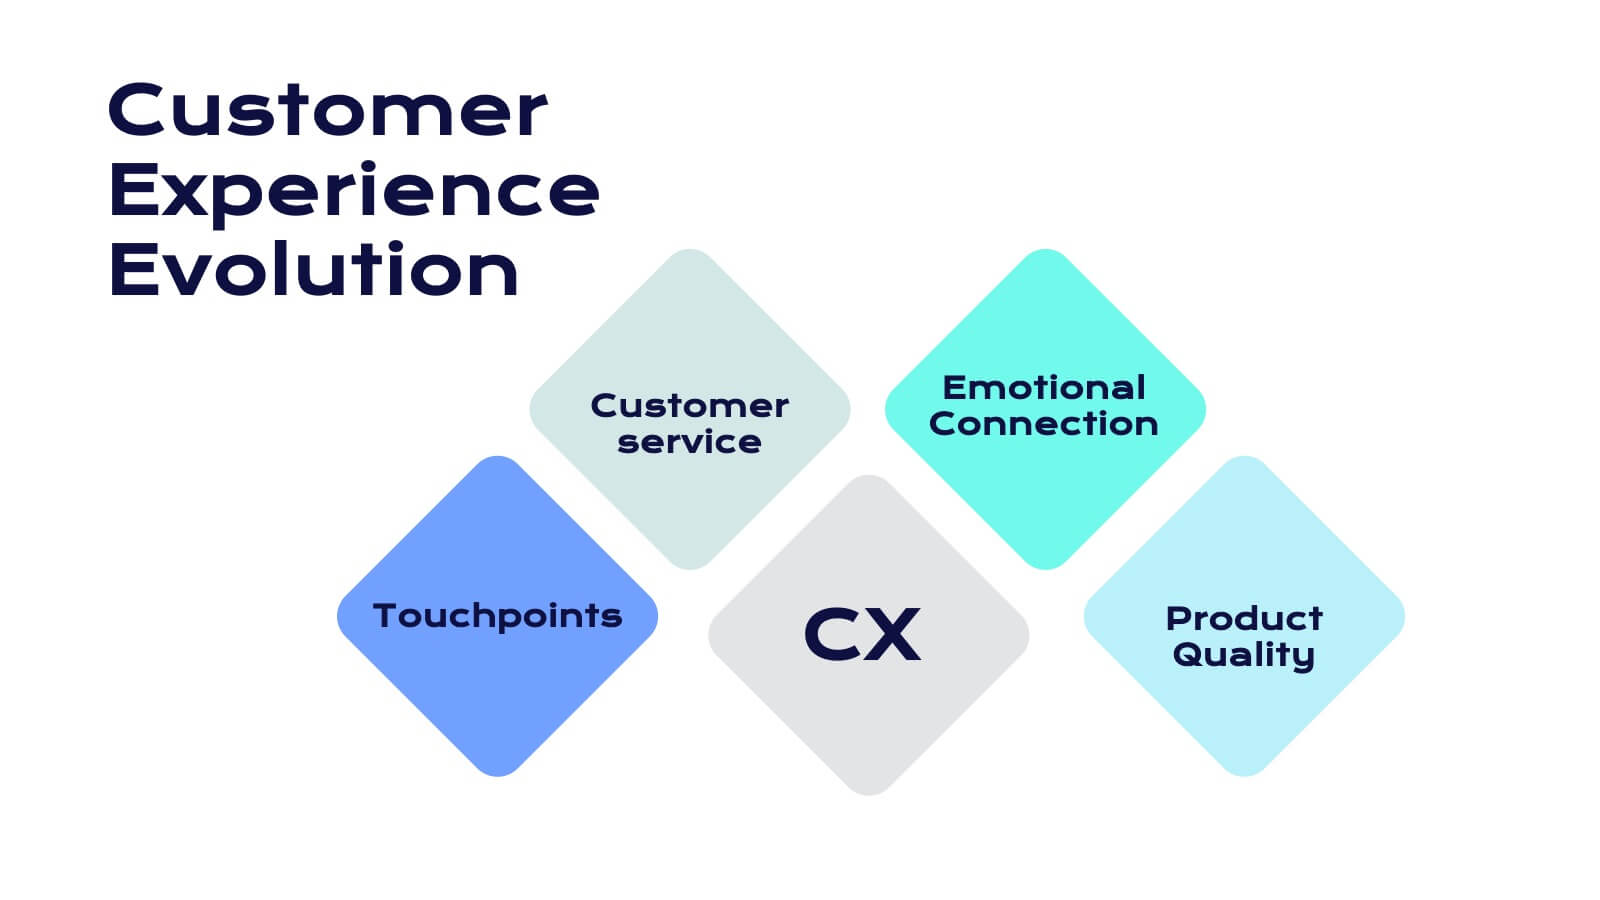
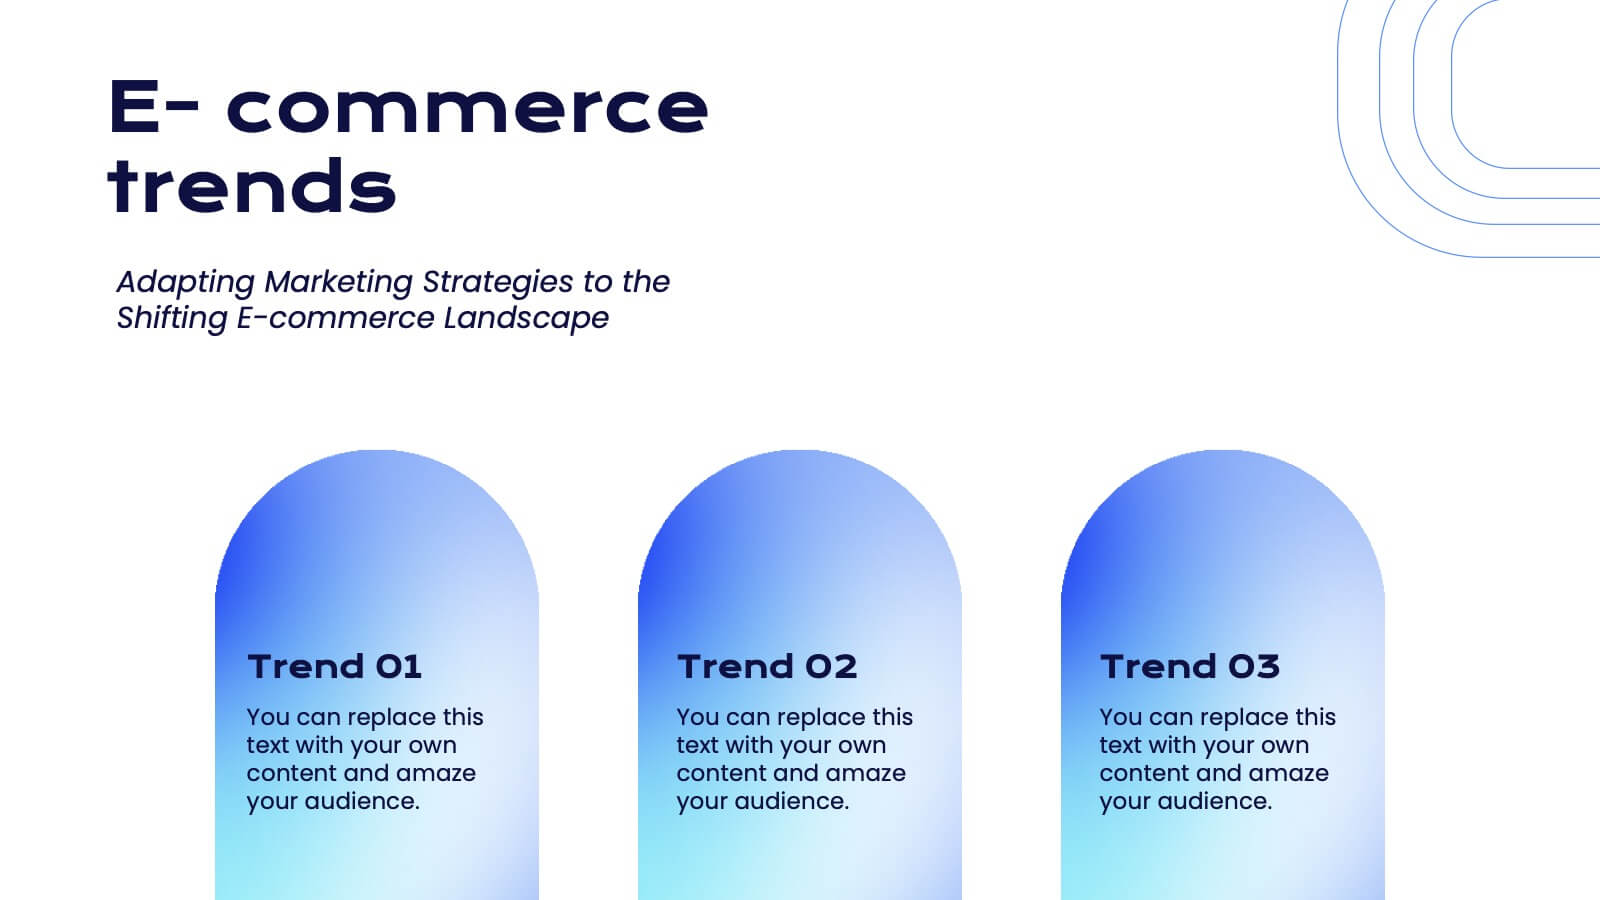
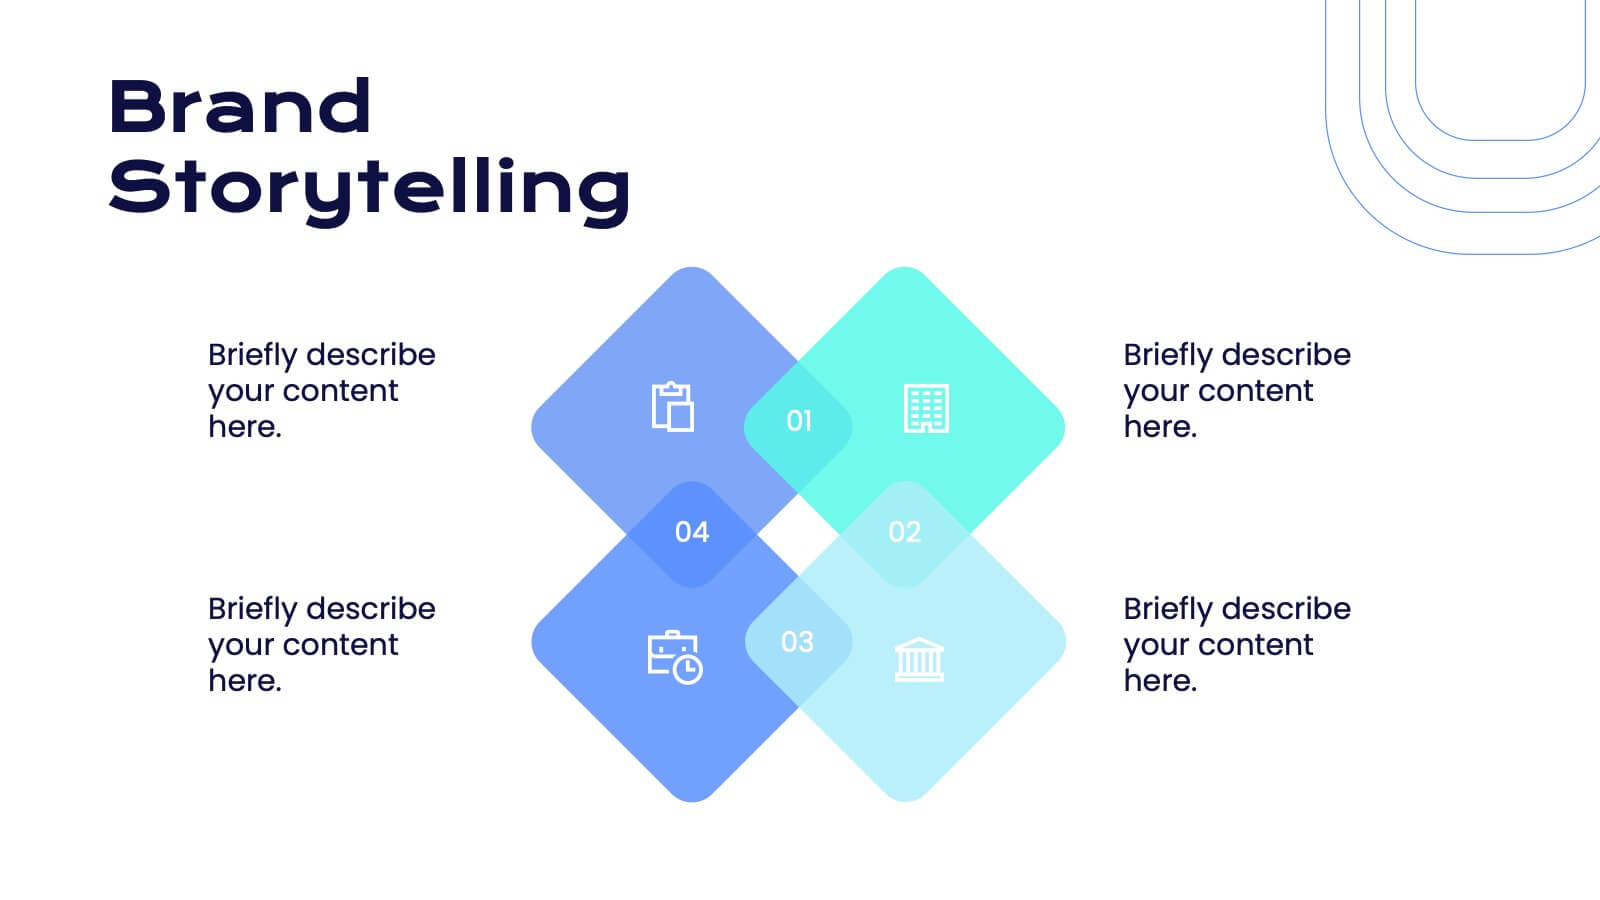
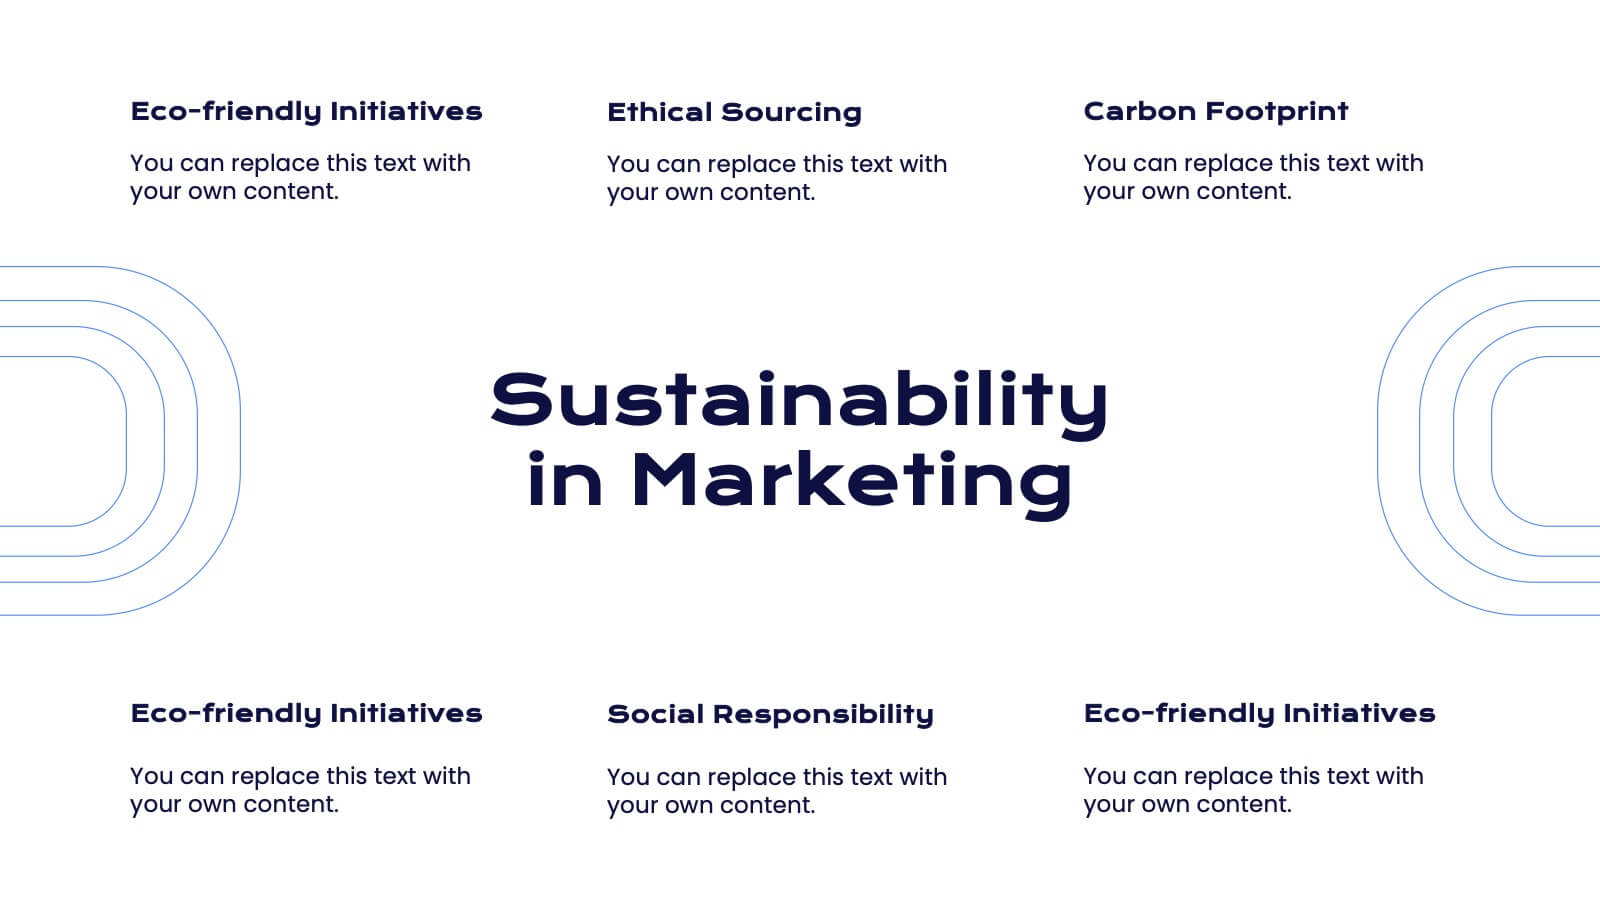
Faerie Digital Marketing Strategy Plan Presentation
Create a compelling marketing strategy with this sleek, modern template! It covers key topics like consumer behavior, social media strategies, and emerging trends. Perfect for showcasing insights in a clear, data-driven format. Fully customizable, it works seamlessly with PowerPoint, Keynote, and Google Slides for effective presentations.


5 diapositivas
Tiered Strategy Framework Pyramid Presentation
Break down your plan into clear, actionable steps with this Tiered Strategy Framework Pyramid presentation. Each arrow-shaped tier helps visualize hierarchical strategies, workflows, or growth levels. Use this layout to communicate priorities, initiatives, or milestones in a sleek and modern format. Fully editable in Canva, PowerPoint, or Google Slides.


8 diapositivas
Environmental and Social Sustainability
Showcase your sustainability efforts with this layered pyramid slide, perfect for visualizing tiered environmental or social responsibility strategies. Ideal for ESG reporting, sustainability workshops, or stakeholder presentations. Fully customizable in PowerPoint, Keynote, and Google Slides to match your brand and message.