


Características


¿Tienes alguna pregunta?
Recomendar


5 diapositivas
Opportunity Mapping with Market Segments Presentation
Spot untapped potential with the Opportunity Mapping with Market Segments Presentation. This strategic quadrant chart helps visualize market segments by plotting quality against size, ideal for identifying where to focus efforts. Customize each section with your data in PowerPoint, Keynote, or Google Slides for a clean, professional pitch.


6 diapositivas
Business Risk Identification and Management Presentation
Identify, analyze, and mitigate business risks with ease. This Business Risk Identification and Management template helps teams visualize potential risks, assess their impact, and implement mitigation strategies. Perfect for corporate leaders, project managers, and financial analysts. Fully customizable and compatible with PowerPoint, Keynote, and Google Slides for seamless presentation use.


6 diapositivas
Peak Flow Chart Infographic
A flowchart is a visual representation of a process or workflow using various symbols, arrows, and connectors to show the sequence of steps and decisions involved in that process. This infographic template is a powerful tool for illustrating complex processes in a clear and easy-to-understand manner. Compatible with Powerpoint, Keynote, and Google Slides. The flowcharts featured consist of various shapes or symbols that represent different process steps or activities. The infographic depicts the sequential order of steps in a process, showing the logical progression from one step to another. Each step is connected to the next step using arrows.


6 diapositivas
Task Management Checklist
Stay on top of your workflow with this visually engaging task management checklist slide. Designed to help teams track progress across multiple tasks or project stages, this layout includes six editable sections with icon markers and color-coded completion states. Fully compatible with PowerPoint, Keynote, and Google Slides.


6 diapositivas
Target Market Analysis Infographics
Present your target market analysis with our vibrant and professional infographic template. Tailored for PowerPoint, Keynote, and Google Slides, this template is an ideal choice for marketers, business analysts, and entrepreneurs who aim to communicate their market insights effectively. The design of this template is focused on showcasing market demographics, consumer behaviors, and segmentation in a visually compelling manner. Its modern layout and vibrant color scheme are crafted to capture attention while maintaining a professional tone. This makes it perfect for presentations that need to convey complex market data in an understandable and engaging way. What sets this template apart is its versatility and ease of use. It allows you to highlight key aspects of your target market analysis, from demographic breakdowns to consumer preferences. Whether you're presenting to stakeholders, team members, or at a conference, this infographic template will help you deliver your message with impact and clarity.


6 diapositivas
Europe Regions Infographic
Europe is a diverse continent with various regions that have their own unique characteristics and cultural identities. This infographic provides an overview of the different regions in Europe. It is designed to help viewers understand the diverse geography, culture, and characteristics of each region within Europe. The template features a map of Europe that highlights the various regions. Viewers can easily identify and explore each region on the map. The template includes slides dedicated to providing key information such as capital cities and major landmarks. The template incorporates statistical data to showcase key facts and figures about each region.


7 diapositivas
SCRUM Master Infographic Presentation
A Scrum infographic provides an overview of all the key components of the Scrum framework and helps teams and individuals understand this powerful agile methodology. This Infographic template is fully editable and can be easily customized to reflect your business, company or organization. It’s a great way to present your ideas in a clear and efficient manner. Full of charts and diagrams, this template creates an impactful visual effect. The blue color scheme will help create a fresh look in your presentations. This template is designed for use in Powerpoint, Google Sheets or Keynote.


5 diapositivas
Digital Marketing Plan Presentation
Build momentum for your online strategy with a clean, structured layout that turns complex ideas into clear, stackable steps. This presentation helps outline goals, channels, and campaign actions in a visual flow that’s easy to follow and adapt. Fully customizable for PowerPoint, Keynote, and Google Slides.


7 diapositivas
Safety Training Infographic Presentation
Safety infographics present important safety information in a clear and concise way, making it easier for people to understand and follow the recommended safety practices. This safety template can be used to provided information and guidelines related to safety in different settings, such as workplaces, schools, public spaces, and homes. This infographic is designed to cover a wide range of topics and personal safety. It include various elements such as icons, illustrations, text, and color-coding. Designed in Powerpoint, Keynote and Google Slides this template is ready for you to edit.


5 diapositivas
Solution Building with Puzzle Framework Presentation
Present integrated strategies with the Solution Building with Puzzle Framework Presentation. This visually compelling layout uses a four-piece puzzle cross to represent interconnected ideas or components—perfect for mapping out project phases, strategic solutions, or department contributions. Fully customizable in Canva, PowerPoint, or Google Slides for easy content editing.


7 diapositivas
Data Analysis Process Infographic
Illuminate the intricacies of the data-driven world with our Data Analysis Process Infographic. Set against the crisp backdrop of white and accented with the brilliance of yellow, the growth-centric green, and the depth of blue, our template brings clarity to the complex realm of data analytics. Outfitted with sharp infographics, intuitive icons, and adaptable image placeholders, it translates raw data into actionable insights. Exquisitely crafted for Powerpoint, Keynote, or Google Slides. A crucial tool for data scientists, business analysts, strategists, or any organization looking to harness the power of data. Analyze with precision; let every slide unravel the stories data tells.


4 diapositivas
Business Strategy Puzzle Graphic Presentation
Bring your ideas together with a design that snaps every strategic point into place. This presentation turns complex planning into a clear, engaging visual puzzle that highlights key insights, goals, and outcomes. Ideal for business reviews, team alignment, and decision-making sessions. Fully compatible with PowerPoint, Keynote, and Google Slides.


6 diapositivas
Tiered Pricing Plan Layout Presentation
Clearly compare features across your service levels with this Tiered Pricing Plan Layout Presentation. Ideal for showcasing Basic, Regular, and Premium options in a side-by-side table with checkmarks and pricing. Great for SaaS, product subscriptions, or membership tiers. Fully editable in Canva, PowerPoint, Google Slides, and Keynote.


6 diapositivas
Data Trends and Statistical Overview Presentation
Present your insights clearly with the Data Trends and Statistical Overview presentation. This template features a clean combination of bar charts and half-pie graphs to showcase metrics, comparisons, and progress at a glance. Ideal for monthly analytics, business reviews, or performance tracking. Fully editable in PowerPoint, Keynote, and Google Slides.


22 diapositivas
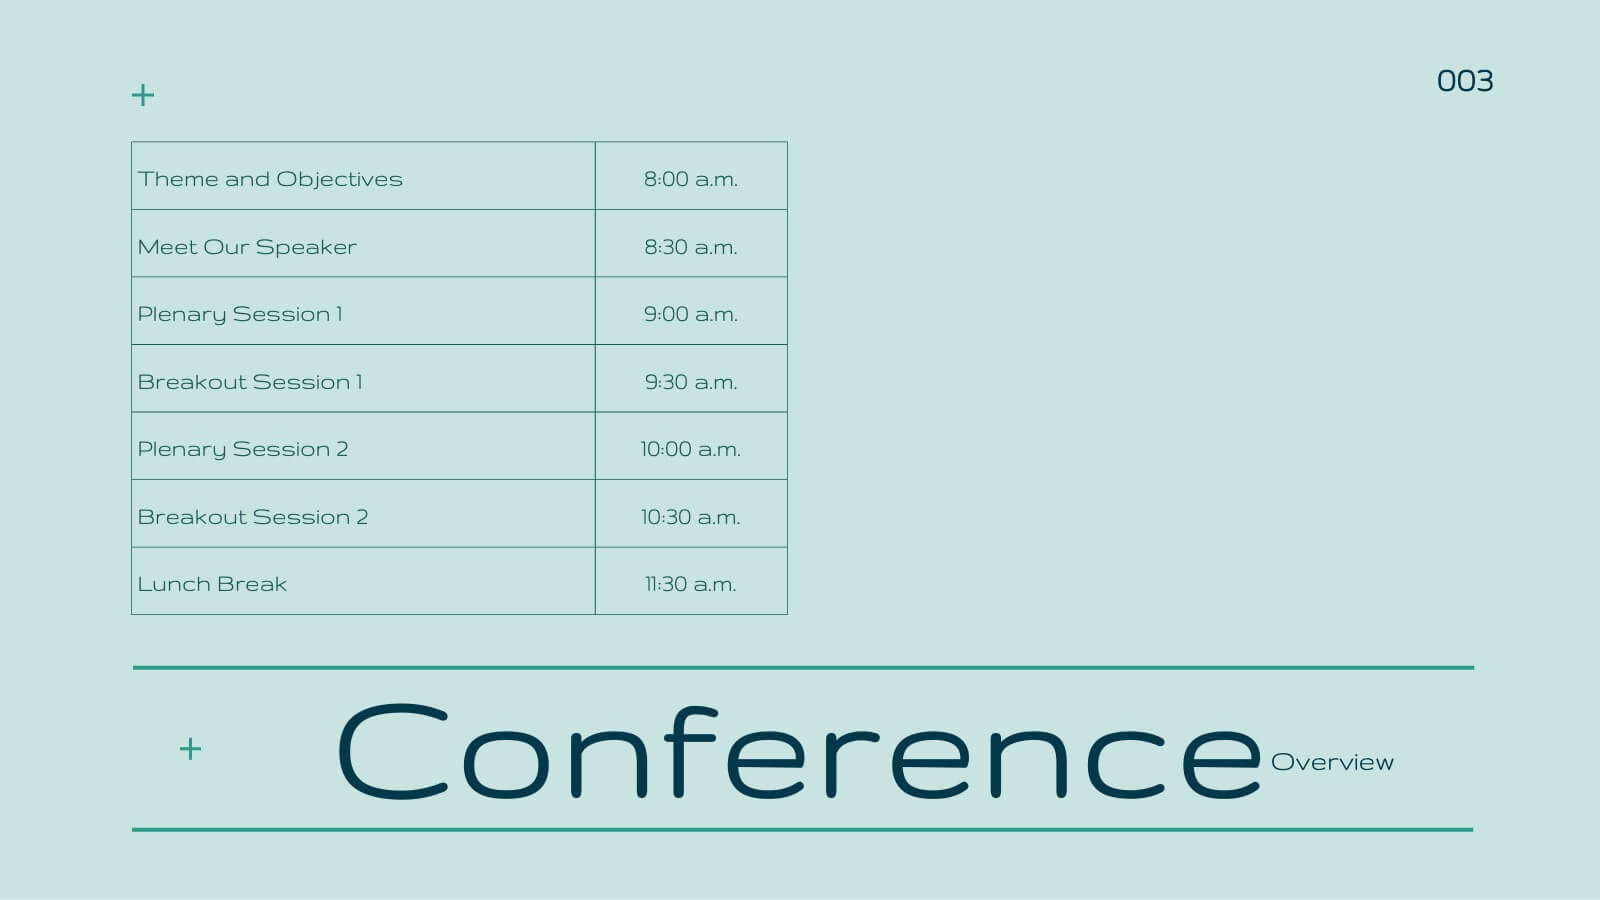
Blaze Business Operations Plan Presentation
Elevate your business presentations with this elegant, modern template designed for comprehensive business operations. Perfect for covering themes, objectives, workshops, and panel discussions, it ensures a professional and engaging delivery. The clean design and structured layout enhance clarity and impact. Compatible with PowerPoint, Keynote, and Google Slides, it’s versatile for any platform.
8 diapositivas
Directional Arrow Timeline Flow
Highlight key milestones or project phases with this smooth, flowing arrow timeline layout. Designed for project managers, team leads, and strategists to showcase sequential steps, launch plans, or performance stages. Fully customizable in PowerPoint, Keynote, and Google Slides—change icons, colors, and text to match your brand style.


4 diapositivas
Core Company Value Mapping Presentation
Spotlight your business strengths with the Core Company Value Mapping Presentation. This slide design helps you break down and compare key value drivers using a structured visual format—ideal for internal strategy discussions, executive briefings, or stakeholder updates. Highlight metrics, priorities, or departments with side-by-side percentage comparisons and icon indicators. Fully editable in PowerPoint, Keynote, and Google Slides. A must-have for operations teams, consultants, and leadership presentations.