


Características


¿Tienes alguna pregunta?
Recomendar


6 diapositivas
Industry Analysis with Porter's Forces Presentation
The Industry Analysis with Porter's Forces Presentation offers a clean and strategic layout for visualizing competitive dynamics. This deck illustrates the five forces—Buyers, Suppliers, Competitors, Substitutions, and New Entry—in a semi-circular flow that makes relationships easy to understand. Each force is paired with editable text and icons for clarity. Ideal for market research, business strategy, or consulting work. Fully compatible with PowerPoint, Keynote, and Google Slides.


26 diapositivas
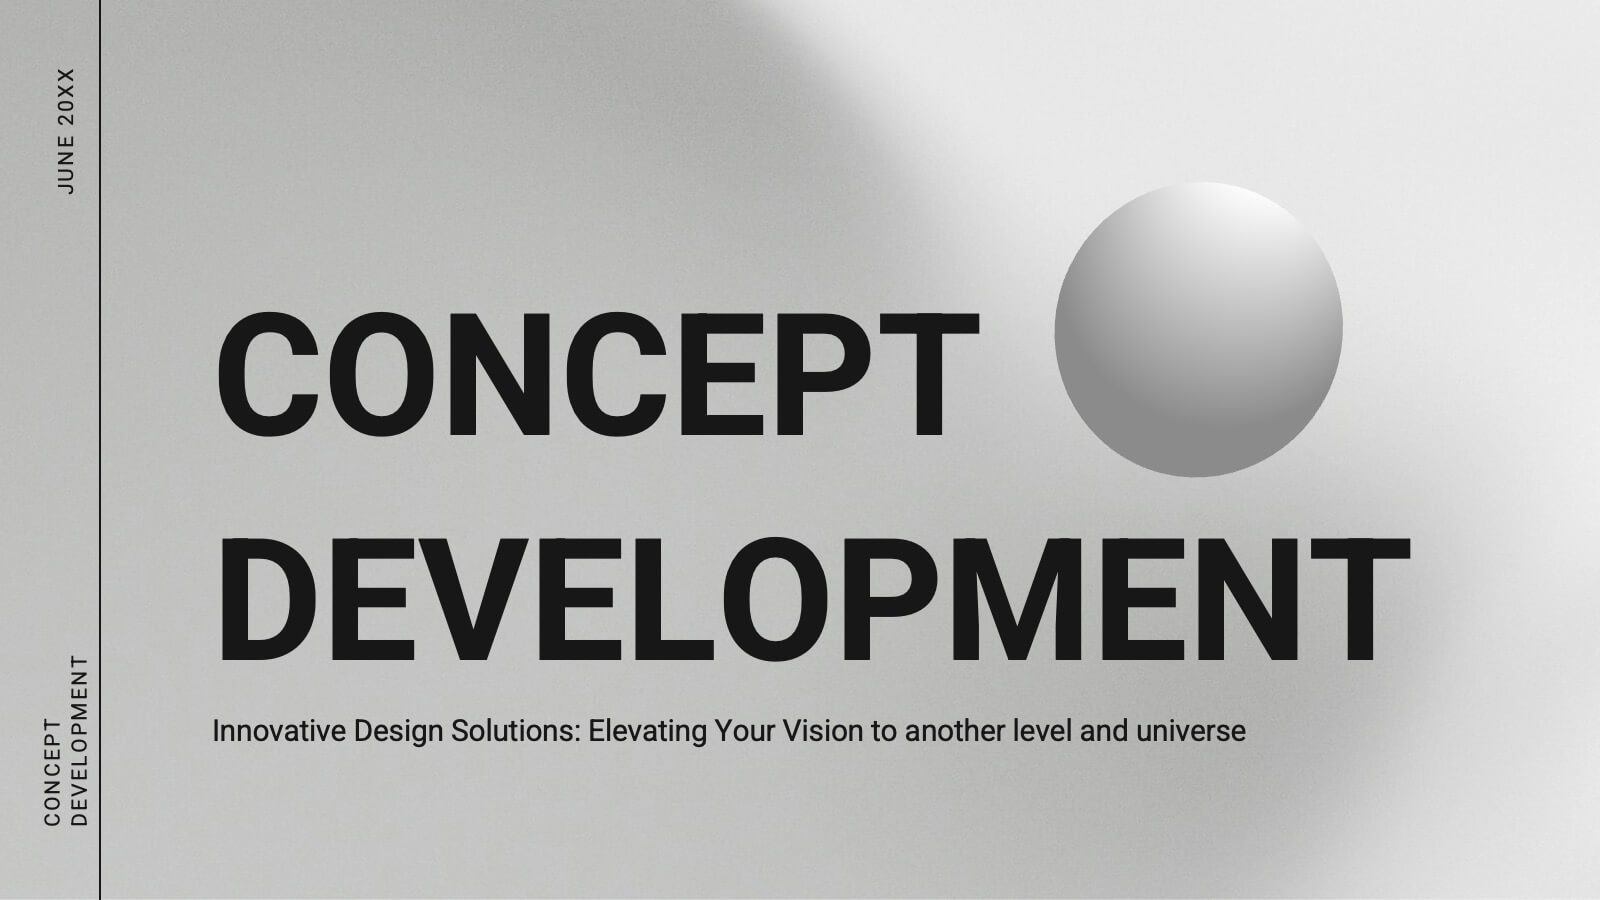
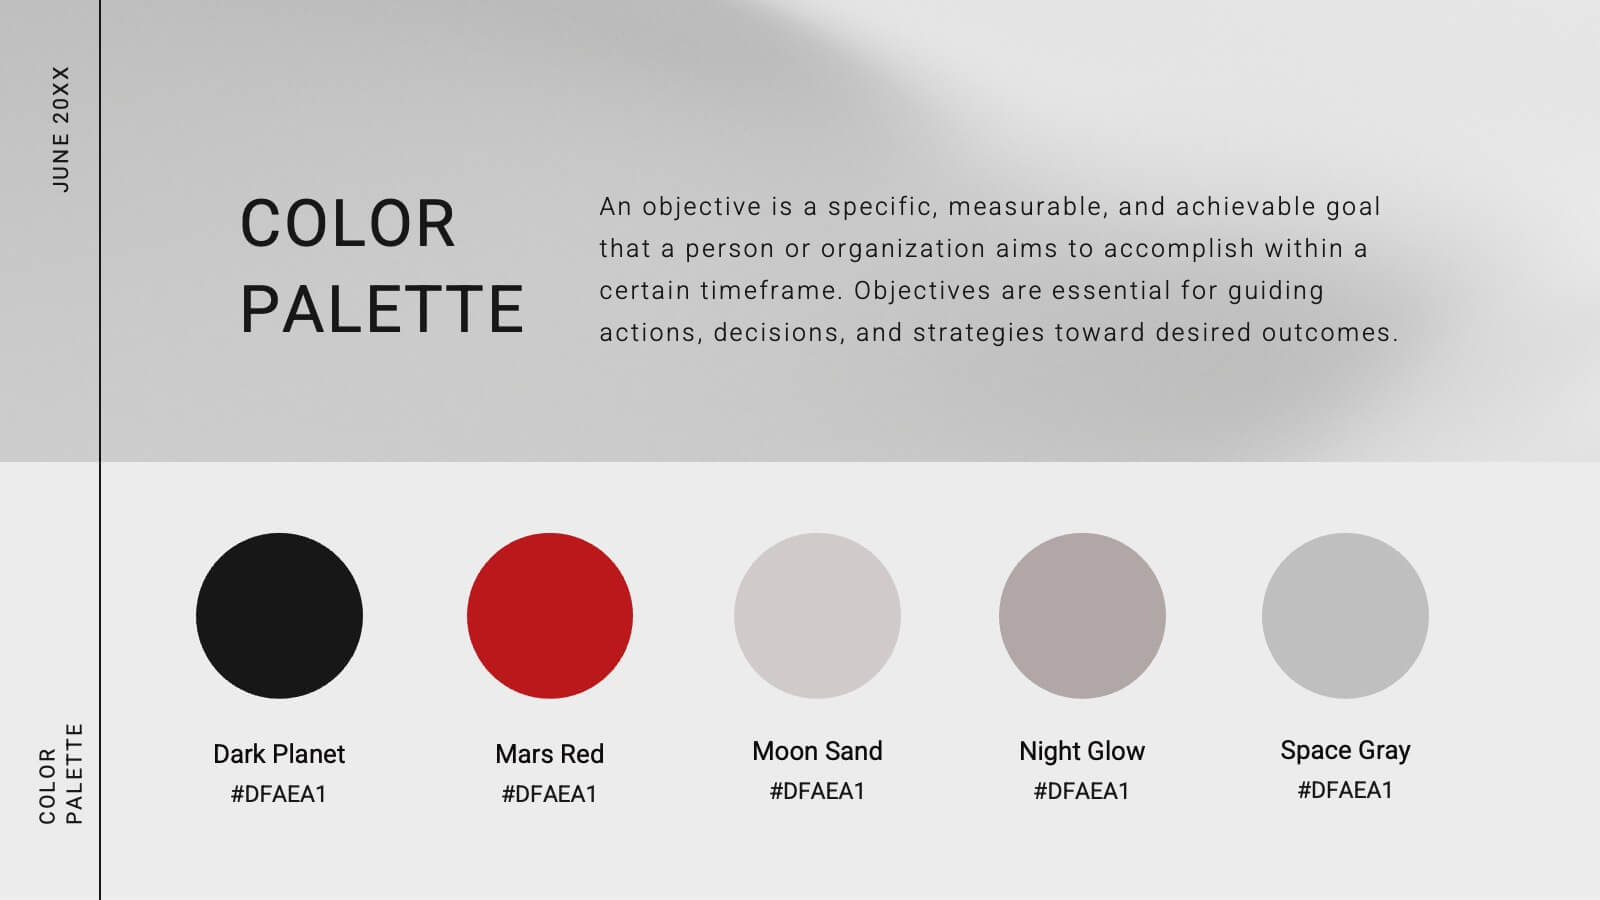
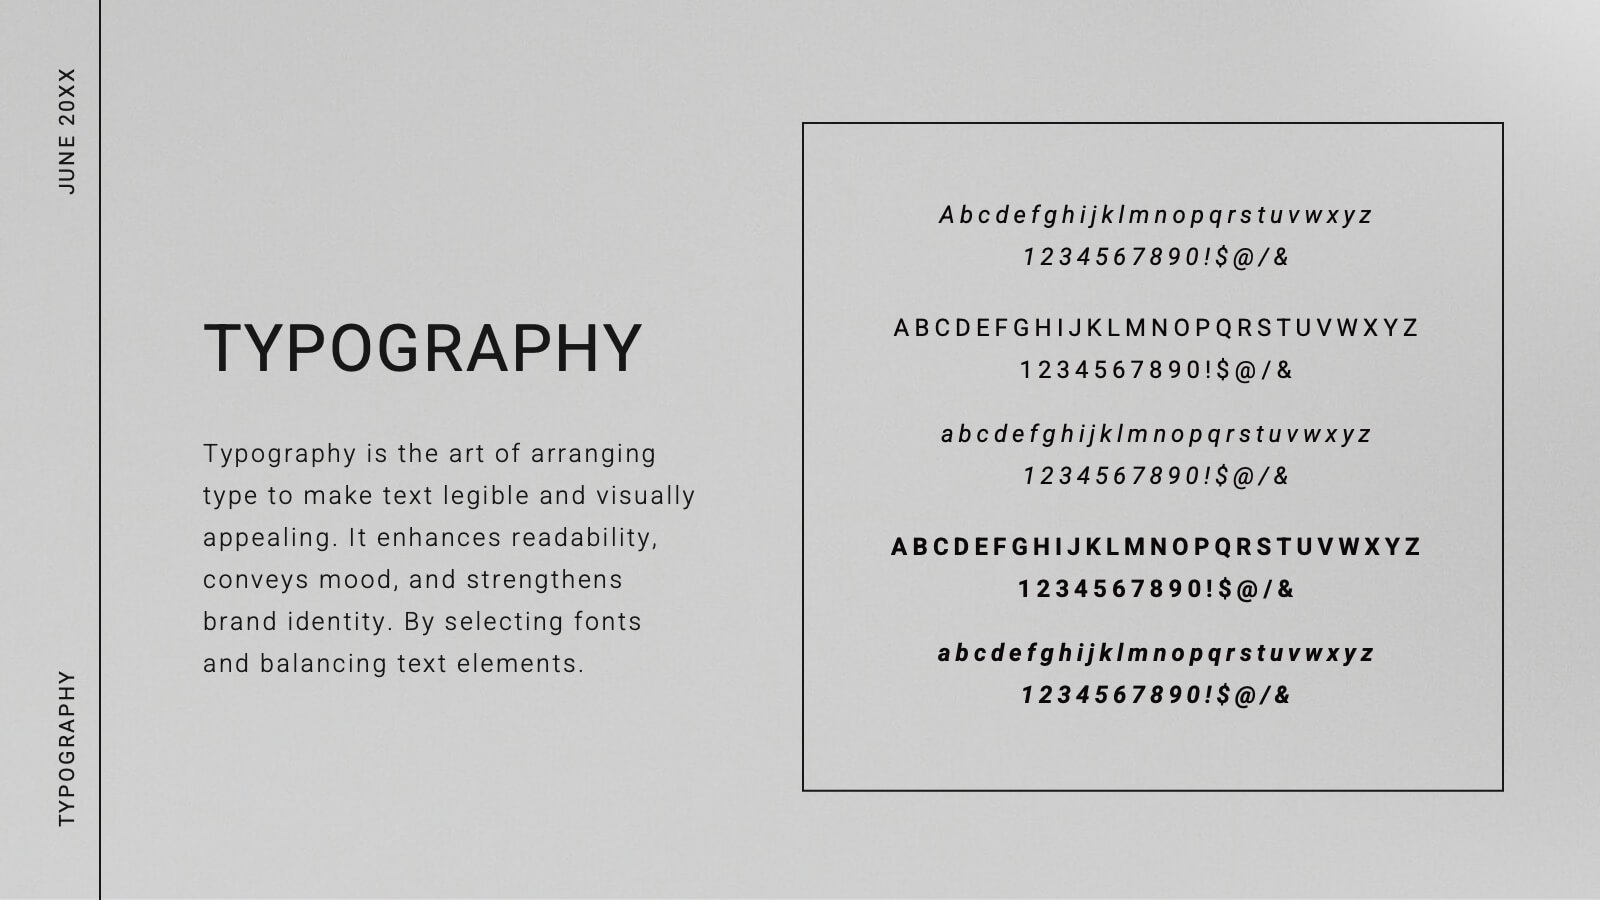
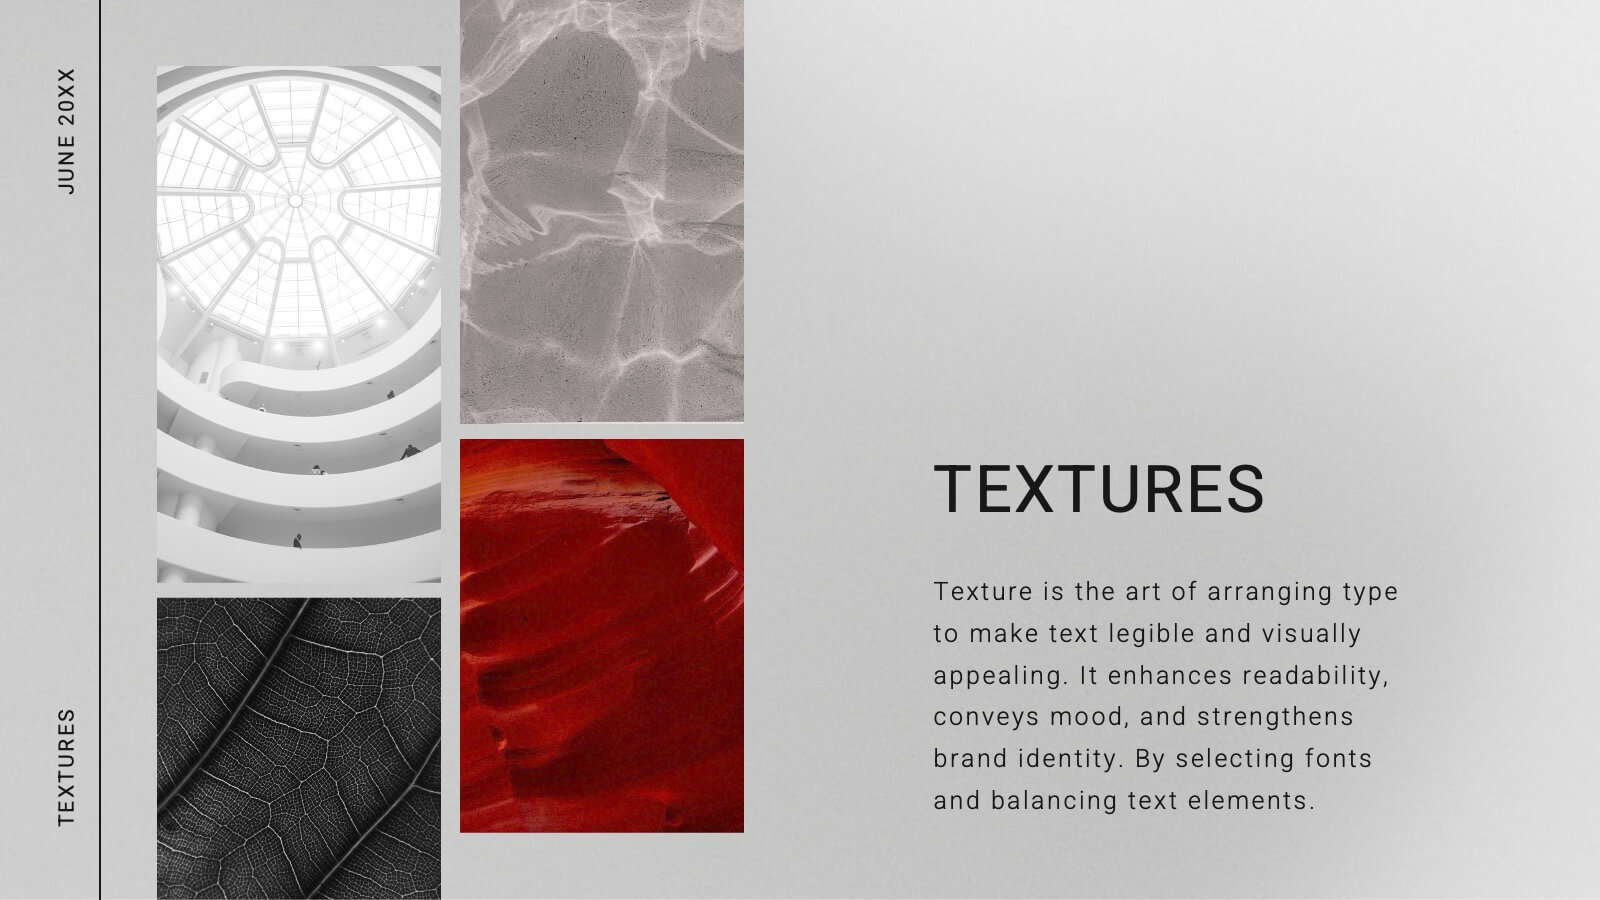
Minimalist Architecture Company Profile Presentation
Introducing our Minimalist Architecture Company Profile template, the ideal choice for your architecture firm's presentation needs. This template exudes professionalism and modernity. It's the perfect canvas to showcase your architectural expertise and design process. Compatible with Powerpoint, Keynote, and Google Slides. Whether your firm specializes in residential, commercial, or industrial architecture, this template will help you convey your professionalism and design expertise. Elevate your architectural company to new heights with this sleek template.


20 diapositivas
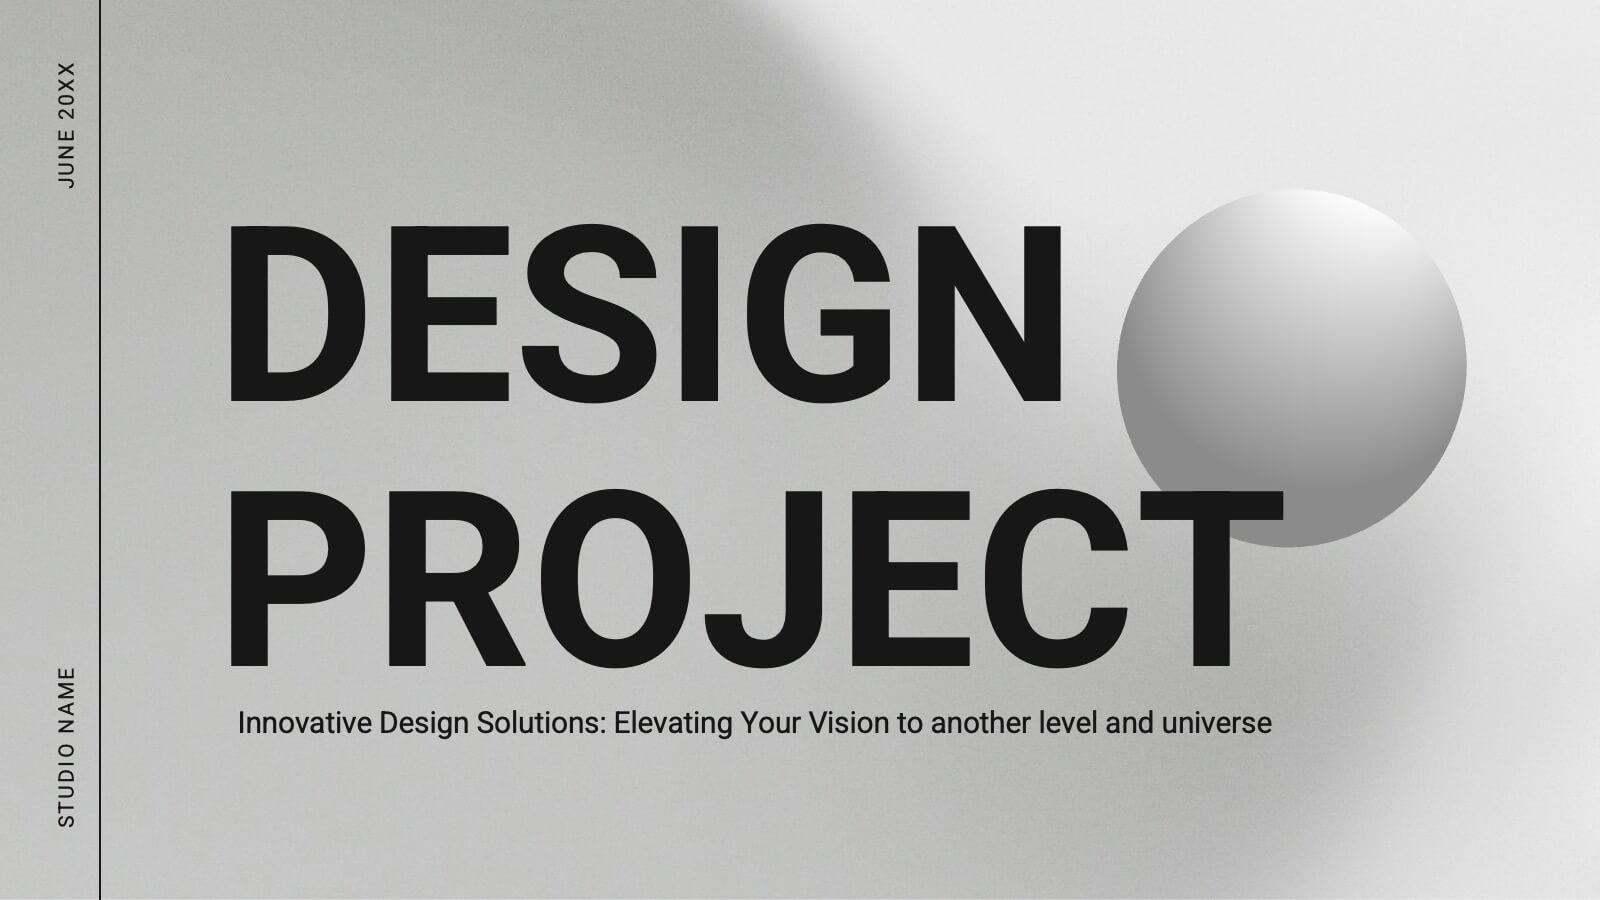
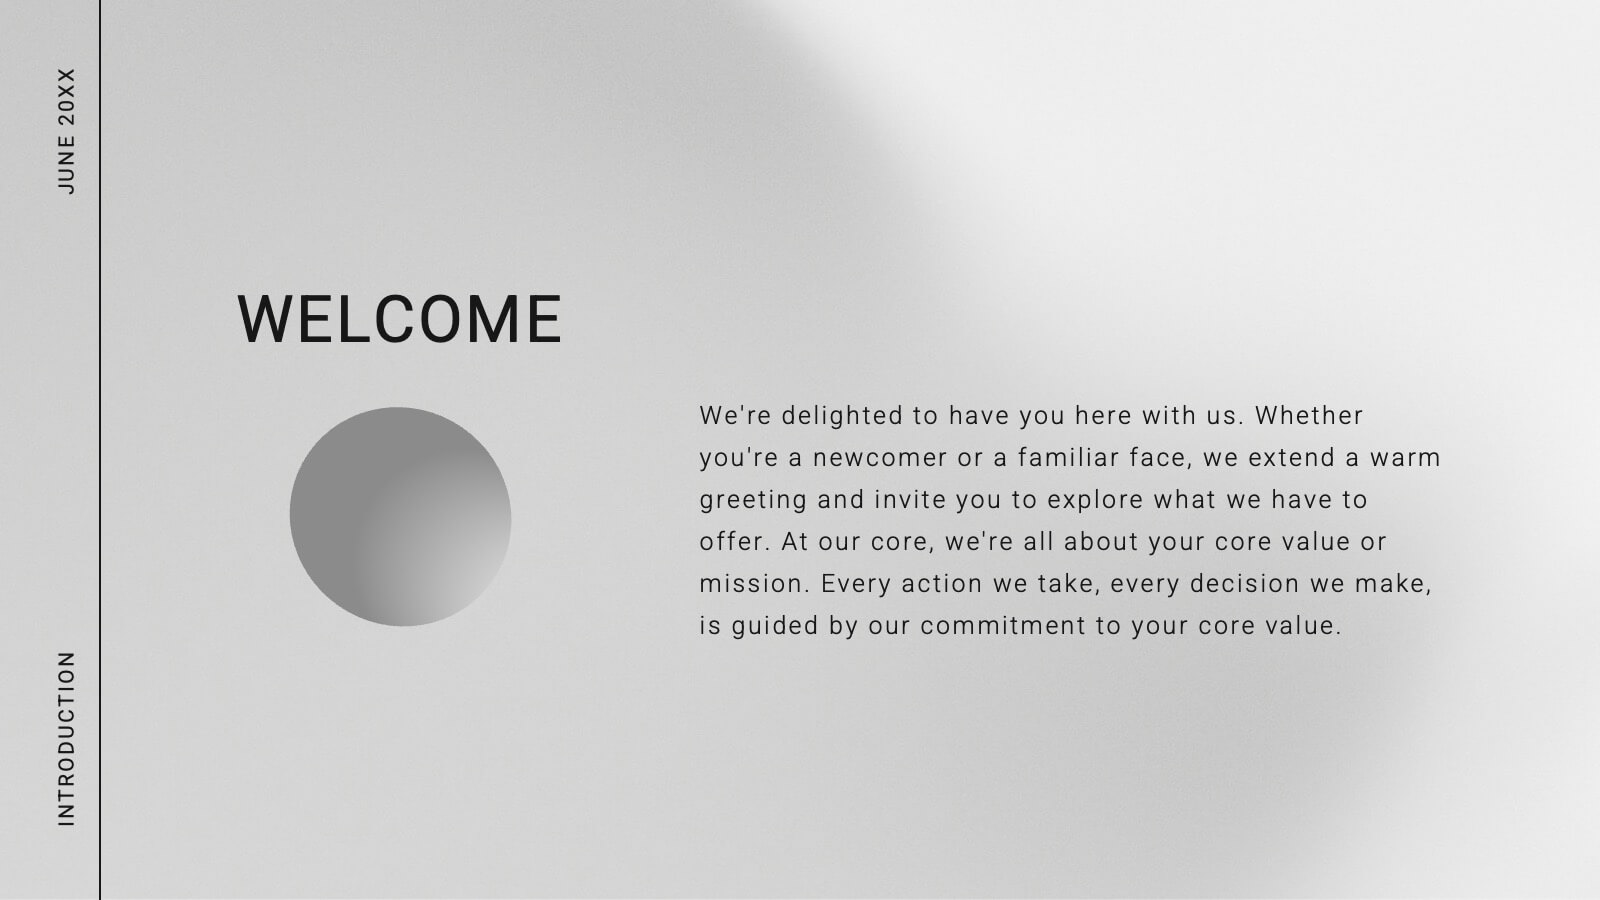
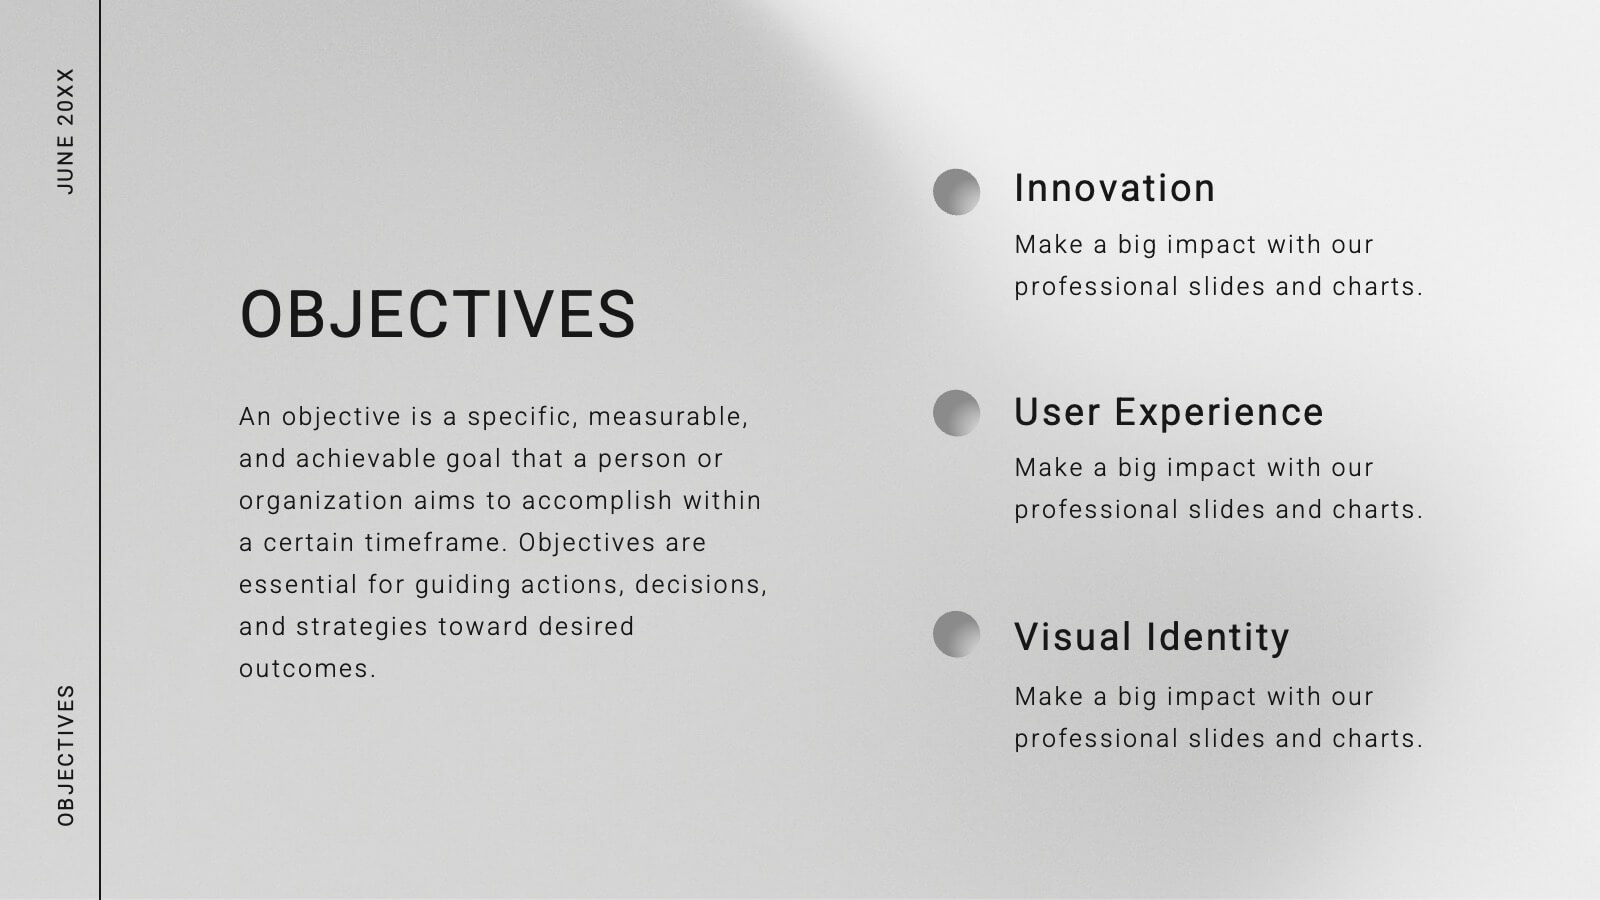
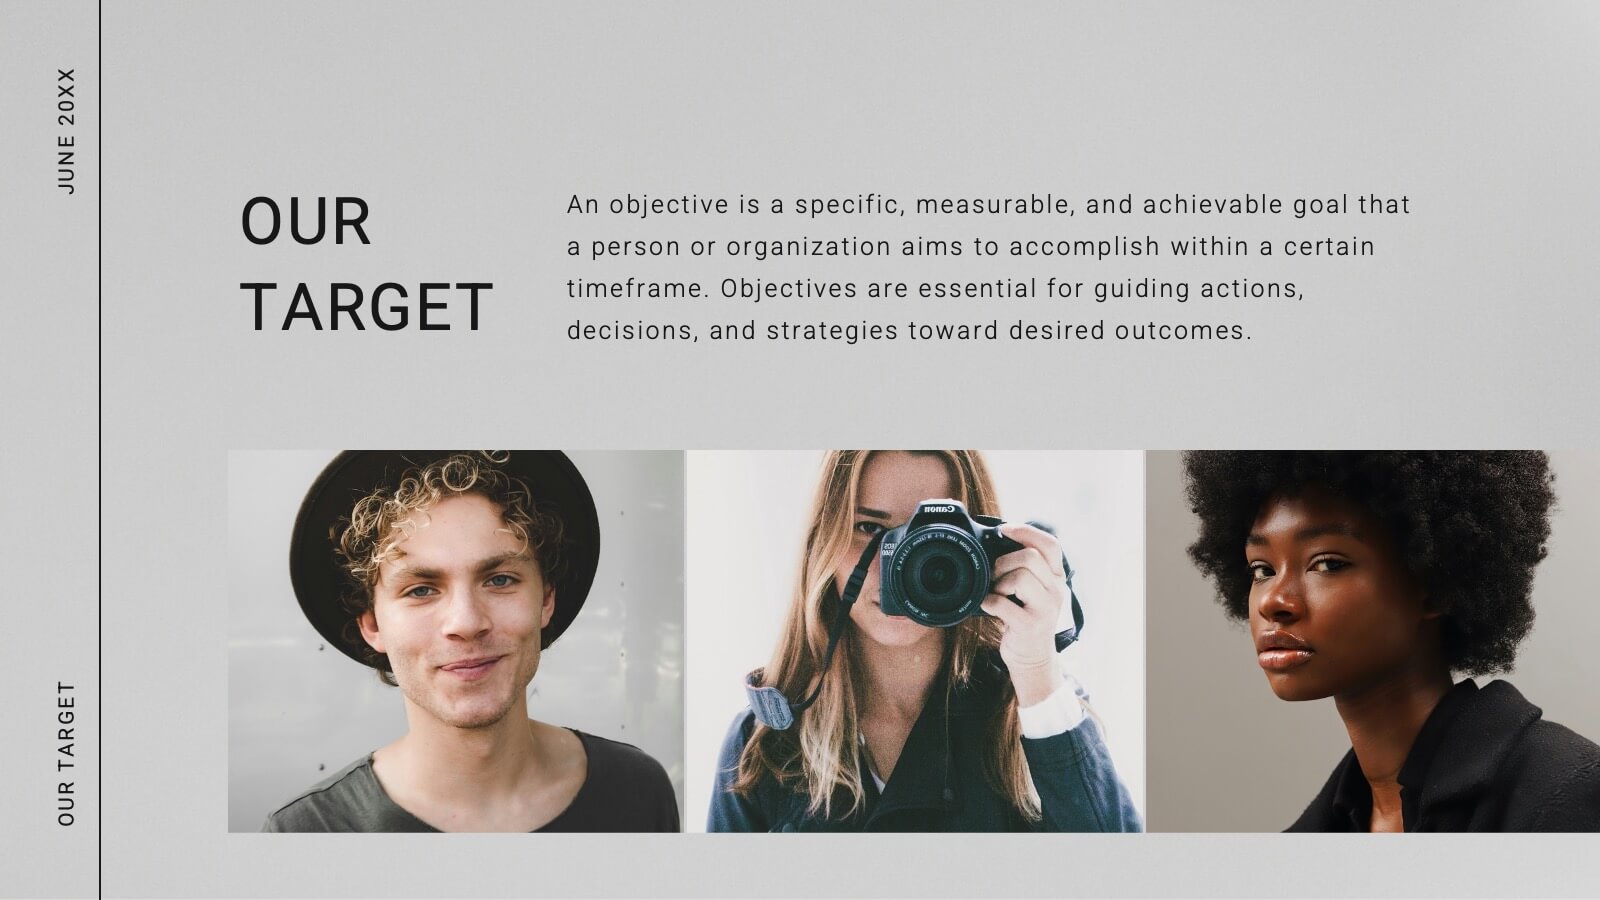
Comet Graphic Design Project Plan Presentation
Craft stunning design project presentations with this elegant template. Showcase objectives, processes, mood boards, and final designs effectively. Ideal for creative teams and clients. Fully compatible with PowerPoint, Keynote, and Google Slides.


10 diapositivas
Six Sigma Process Improvement
Visualize each stage of the Six Sigma DMAIC methodology—Define, Measure, Analyze, Improve, and Control—with this circular diagram layout. Perfect for quality control meetings, workflow optimization, and training sessions. Fully customizable in PowerPoint, Keynote, and Google Slides.


5 diapositivas
Company Hierarchical Structure Presentation
Effectively illustrate your company's hierarchy with this Company Hierarchical Structure infographic template. Designed to clarify leadership and team roles, this slide is ideal for corporate presentations, HR onboarding, and management reports. Fully customizable in PowerPoint, Keynote, and Google Slides, ensuring seamless integration with your branding and content needs.


5 diapositivas
Agribusiness Market Strategy Overview
Showcase your market plan with the Agribusiness Market Strategy Overview Presentation. This engaging slide uses fresh produce illustrations to symbolize market growth, distribution, and agricultural planning. Perfect for farm business proposals, supply chain discussions, or food sector reports. Fully customizable and works seamlessly in PowerPoint, Keynote, and Google Slides.


7 diapositivas
Sustainability Business Management Infographic Presentation
Sustainability Management presents information related to sustainable business practices and management strategies. The goal of this template is to help you create a balance between environmental factors to ensure long-term success for a business or organization. This infographic can cover a variety of topics, including sustainable supply chain management, energy, resource efficiency, and waste reduction. This template has different layouts including diagrams and graphs. It also includes icons, symbols, and color-coding to make the information more accessible and easier to understand.


26 diapositivas
Mazen Presentation Template
Mazen is a multi-purpose template that’s perfect for any business. The colors and layout are clean and chic, and it’s suitable for all types of businesses, from small business accounts to large corporate companies. It also has a hip aesthetic with nude warm tones, while pictures and charts are easy to edit and easy to read so users can easily understand the information in them. Easy to use, high quality and many features make this template suitable for all kinds of businesses. Pictures and charts are also made for easy editing as well as easy readability without too much confusion on reading.


6 diapositivas
Risk Assessment Spider Chart Presentation
Clearly visualize risk exposure across multiple criteria with the Risk Assessment Spider Chart Presentation. This template is perfect for comparing key risk factors in a visual, easy-to-understand format. Ideal for project managers, risk analysts, and consultants. Fully customizable and works seamlessly with PowerPoint, Keynote, and Google Slides.


3 diapositivas
Customer Relationship Mapping Presentation
Visualize connections across your supply chain with the Customer Relationship Mapping Presentation. This slide helps illustrate how your group interacts with suppliers and customers, making it ideal for operational overviews, relationship management, or partner presentations. Fully editable in PowerPoint, Keynote, and Google Slides.


6 diapositivas
Probability Venn Diagram Infographic
This infographic template displays a set of Probability Venn Diagrams. These are visual tools used to represent the logical relationships between different sets of items, commonly utilized in statistics. They are perfect for presentations to explain concepts like intersections, unions, and complements of sets. Each Venn diagram in the image varies in complexity and color scheme, providing a range of options to illustrate how individual sets overlap or differ, which is useful in showing probabilities, possible logical relations, and more. These diagrams can be especially helpful in business or academic settings where data relationships need to be clarified visually.


6 diapositivas
Corporate Profiles Layout Presentation
Bring your business story to life with a clean, modern layout that makes every detail feel polished and professional. This presentation is designed to showcase company highlights, key services, and essential profile information with clarity and impact. Fully editable and easy to customize in PowerPoint, Keynote, and Google Slides.


5 diapositivas
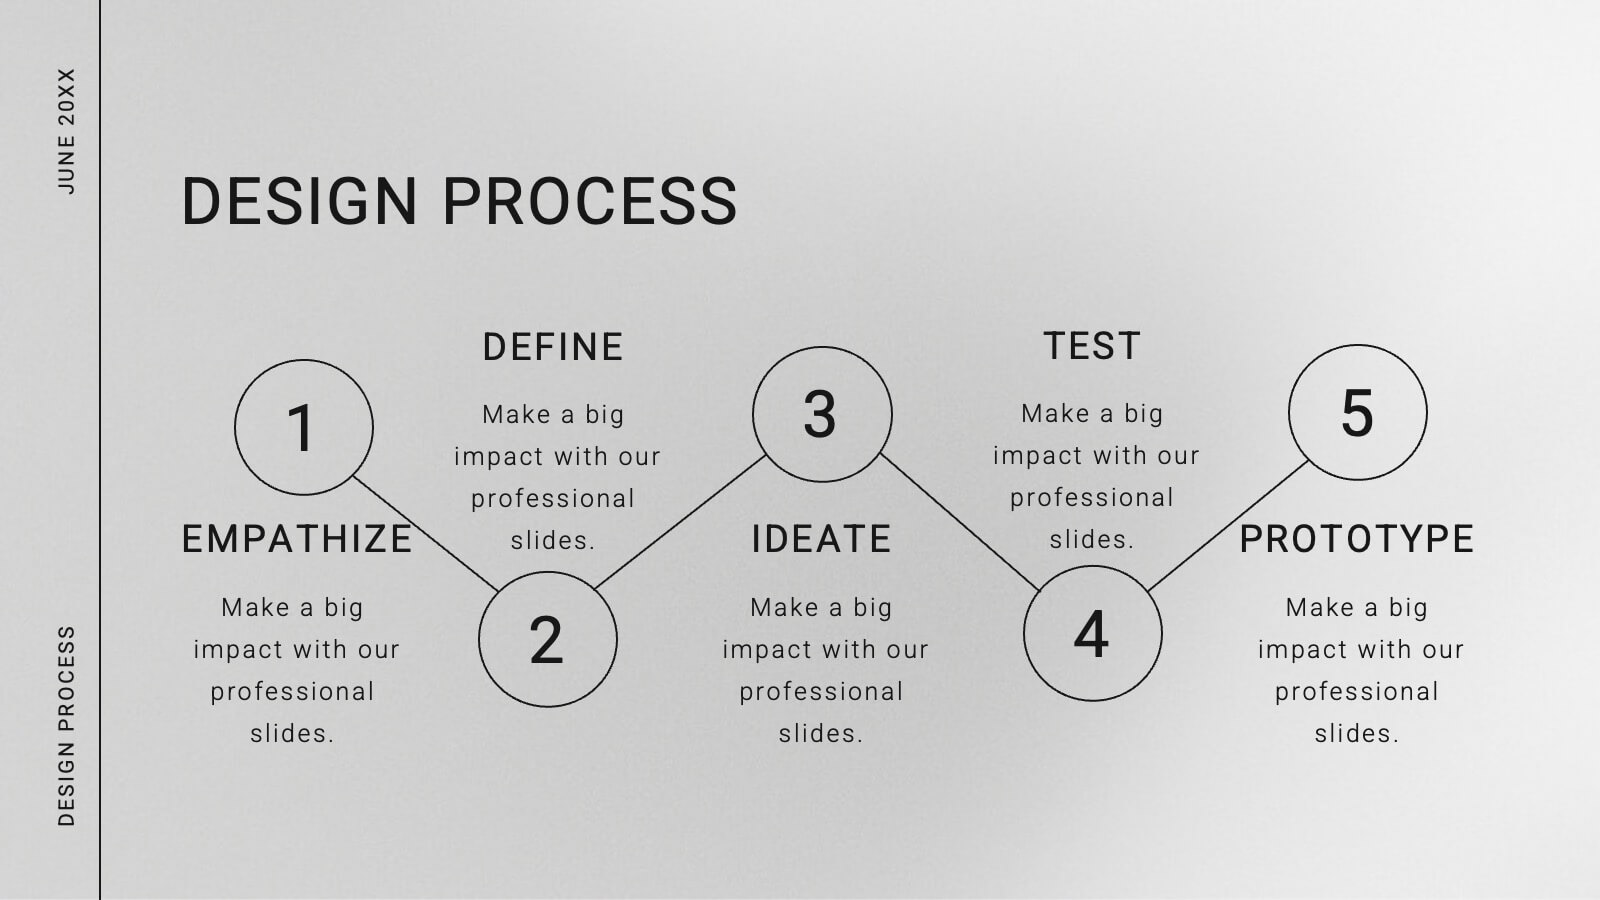
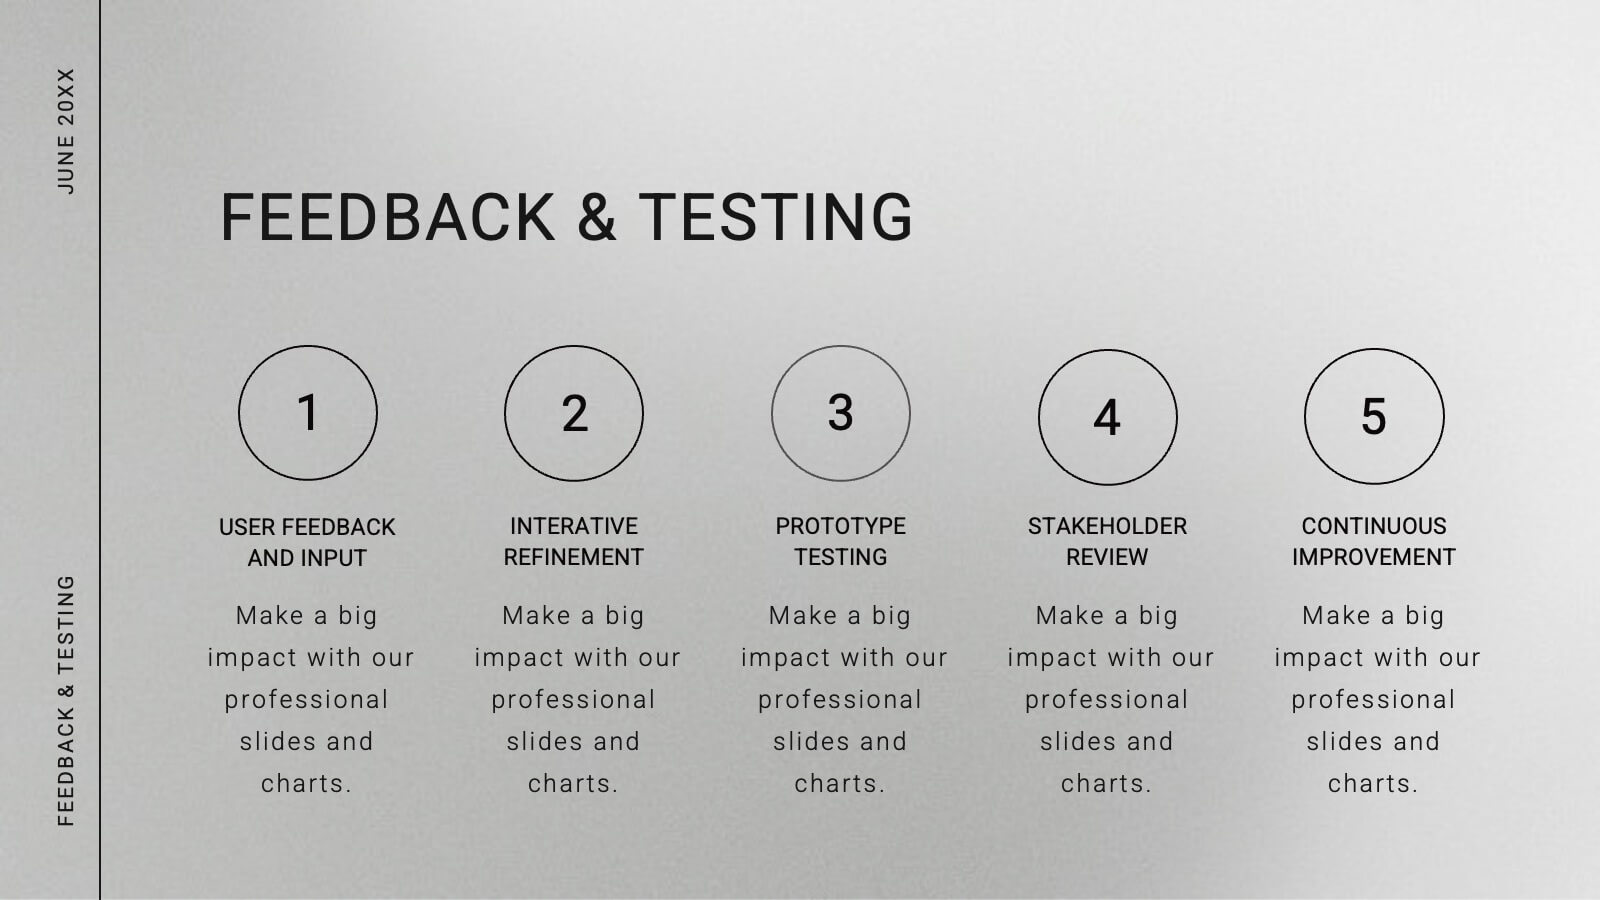
Five-Step Process Improvement Presentation
Streamline operations with the Five-Step Process Improvement presentation. This template visually maps out key phases of business optimization, using a structured timeline to highlight each step's purpose and impact. Perfect for project managers, consultants, and corporate strategists, this design helps teams track progress and refine workflows effectively. Fully editable and compatible with PowerPoint, Keynote, and Google Slides for effortless customization.


6 diapositivas
Tree Diagram for Process Mapping
Visualize workflows with clarity using this Tree Diagram slide. Designed to map six key process steps branching from a central trunk, it's ideal for illustrating strategic plans, organizational flows, or project lifecycles. Fully editable in PowerPoint, Keynote, and Google Slides for cross-platform flexibility.


7 diapositivas
3D Modeling Infographic
3D modeling is the process of creating three-dimensional representations of objects or scenes using specialized computer software. This infographic template is crafted to demystify the world of 3D modeling, providing a comprehensive understanding of the techniques, applications, and the creative process that brings ideas to life in the third dimension. Compatible with Powerpoint, Keynote, and Google Slides. This infographic is an invitation to the captivating universe of 3D artistry and innovation. Use this template to step into the realm where imagination meets the third dimension.


5 diapositivas
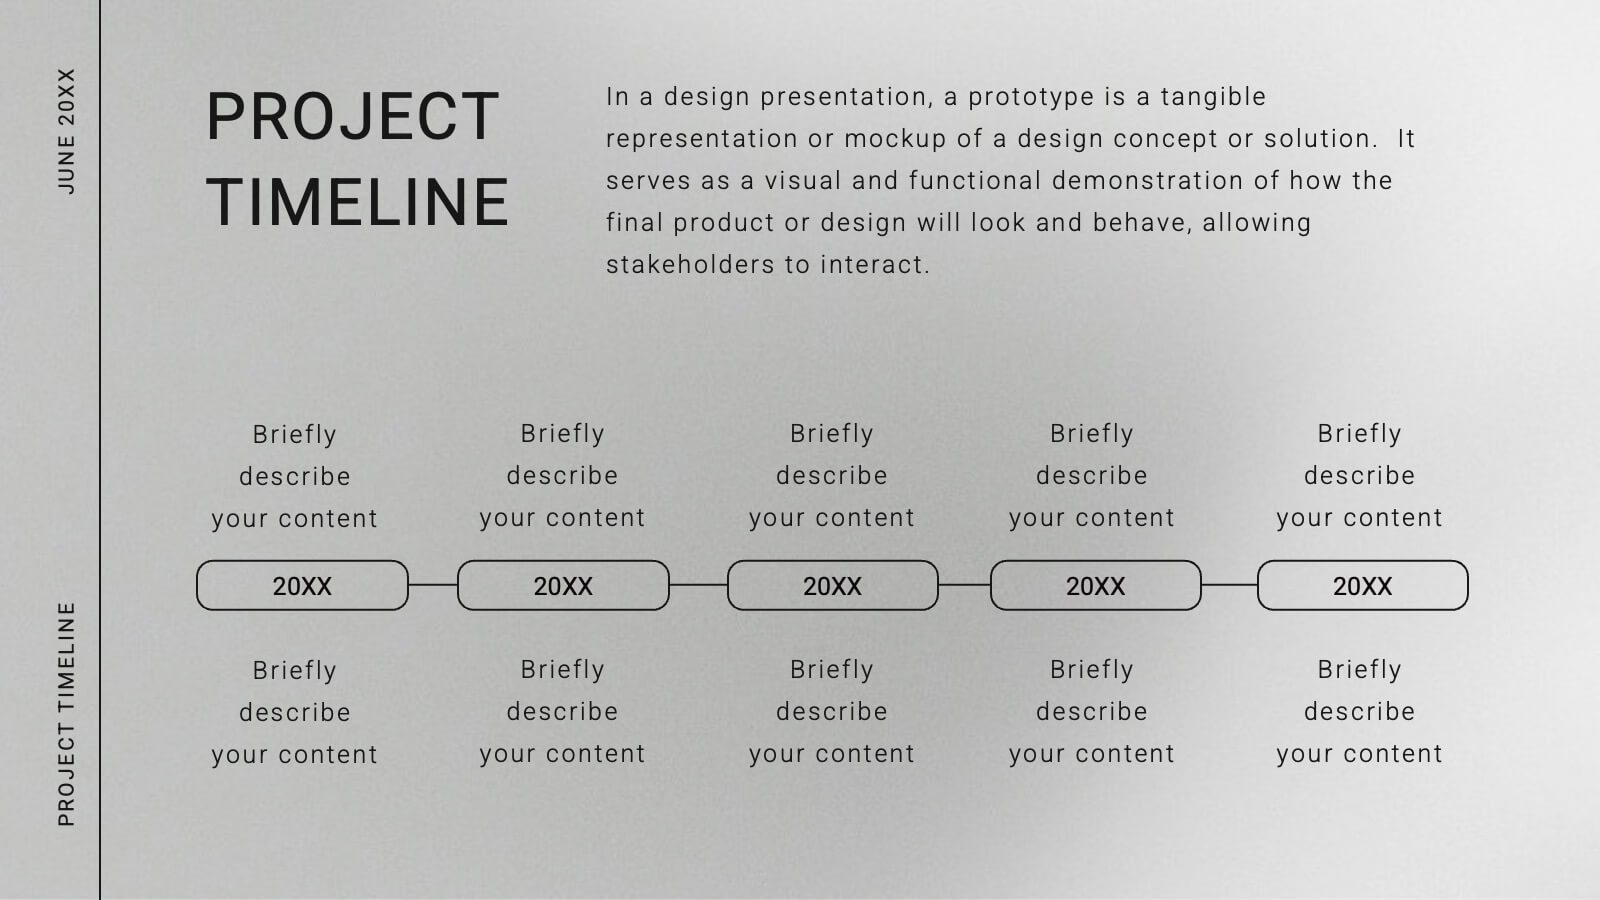
Annual Business Performance Year in Review Presentation
Present your metrics with clarity using the Annual Business Performance Year in Review Presentation. This visual slide showcases key data points and financial highlights through an ascending, step-based layout — perfect for reflecting growth, comparing yearly results, or visualizing KPIs. Ideal for year-end reviews or stakeholder updates. Easy to edit and compatible with PowerPoint, Keynote, and Google Slides.


7 diapositivas
Mind Map Process Infographic
A Mind Map Process Infographic is a visual representation that illustrates a process or a series of steps using the structure and principles of a mind map. This template diagram is a dynamic visual guide to help individuals and teams harness the true potential of mind mapping. This is used to visually organize information in a hierarchical and interconnected manner, often starting with a central concept or theme and branching out into related ideas or subtopics. Mind maps are the ultimate tool for brainstorming, planning, and innovating, and this template is your gateway to unlocking their full potential.