
Características


¿Tienes alguna pregunta?
Recomendar


7 diapositivas
Future Vision Infographic
Chart a course towards a visionary future with our Future Vision Infographic Template. This dynamic template is designed to help organizations articulate and visualize their long-term goals and strategies in a clear and compelling way. Each slide offers a unique blend of geometric designs and bold color palettes, ideal for engaging stakeholders and inspiring action. Perfect for corporate presentations, strategic meetings, or digital showcases, this template allows you to lay out your vision with precision. It guides viewers through your roadmap to success, highlighting key milestones and the innovative steps you plan to take. Customize each element to echo your organizational identity and values, ensuring that your future aspirations resonate deeply with your audience. Whether you're aiming to motivate your team, attract investors, or inform your partners, our Future Vision template provides a robust foundation for powerful storytelling and strategic clarity.


26 diapositivas
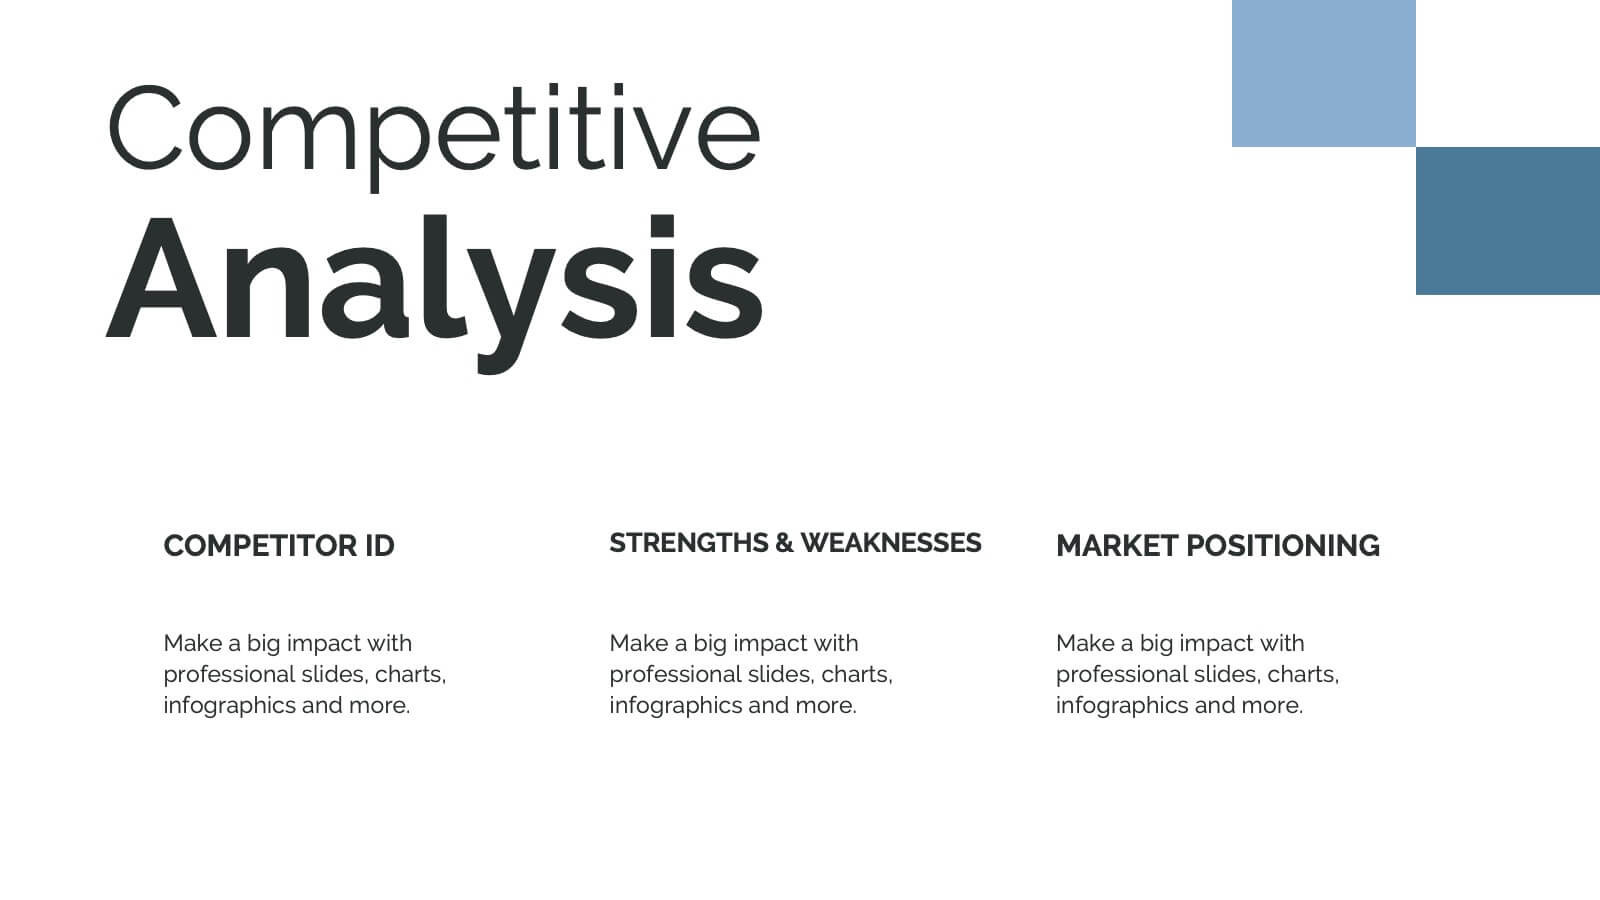
Competitive Market Analysis Professional Presentation
Navigate the complex landscape of market competition with this comprehensive presentation template, designed to illustrate competitive market analysis with clarity and impact. The sleek slides are steeped in a modern color palette, artfully combining cool purples and warm corals to capture attention and highlight key insights. Strategic use of infographics brings data to life, from SWOT analyses to market segmentation, ensuring the delivery of information is both visually appealing and easily digestible. It's a template that offers professionals and students alike the ability to dissect and present competitive dynamics with precision, whether it’s for a business plan, academic project, or strategic meeting. Each slide is a blueprint for understanding market forces, customer segmentation, and competitive positioning. This template is fully compatible with PowerPoint, Keynote, and Google Slides, making it a versatile and indispensable tool for those seeking to make informed decisions and craft compelling market narratives.


4 diapositivas
Fishbone Diagram for Root Cause Analysis
Dive into the source of any problem—literally. This fishbone diagram template offers a smart and visual way to map out causes leading to a business issue, helping teams brainstorm solutions effectively. Ideal for workshops, meetings, and audits. Easily editable in PowerPoint, Keynote, and Google Slides.


20 diapositivas
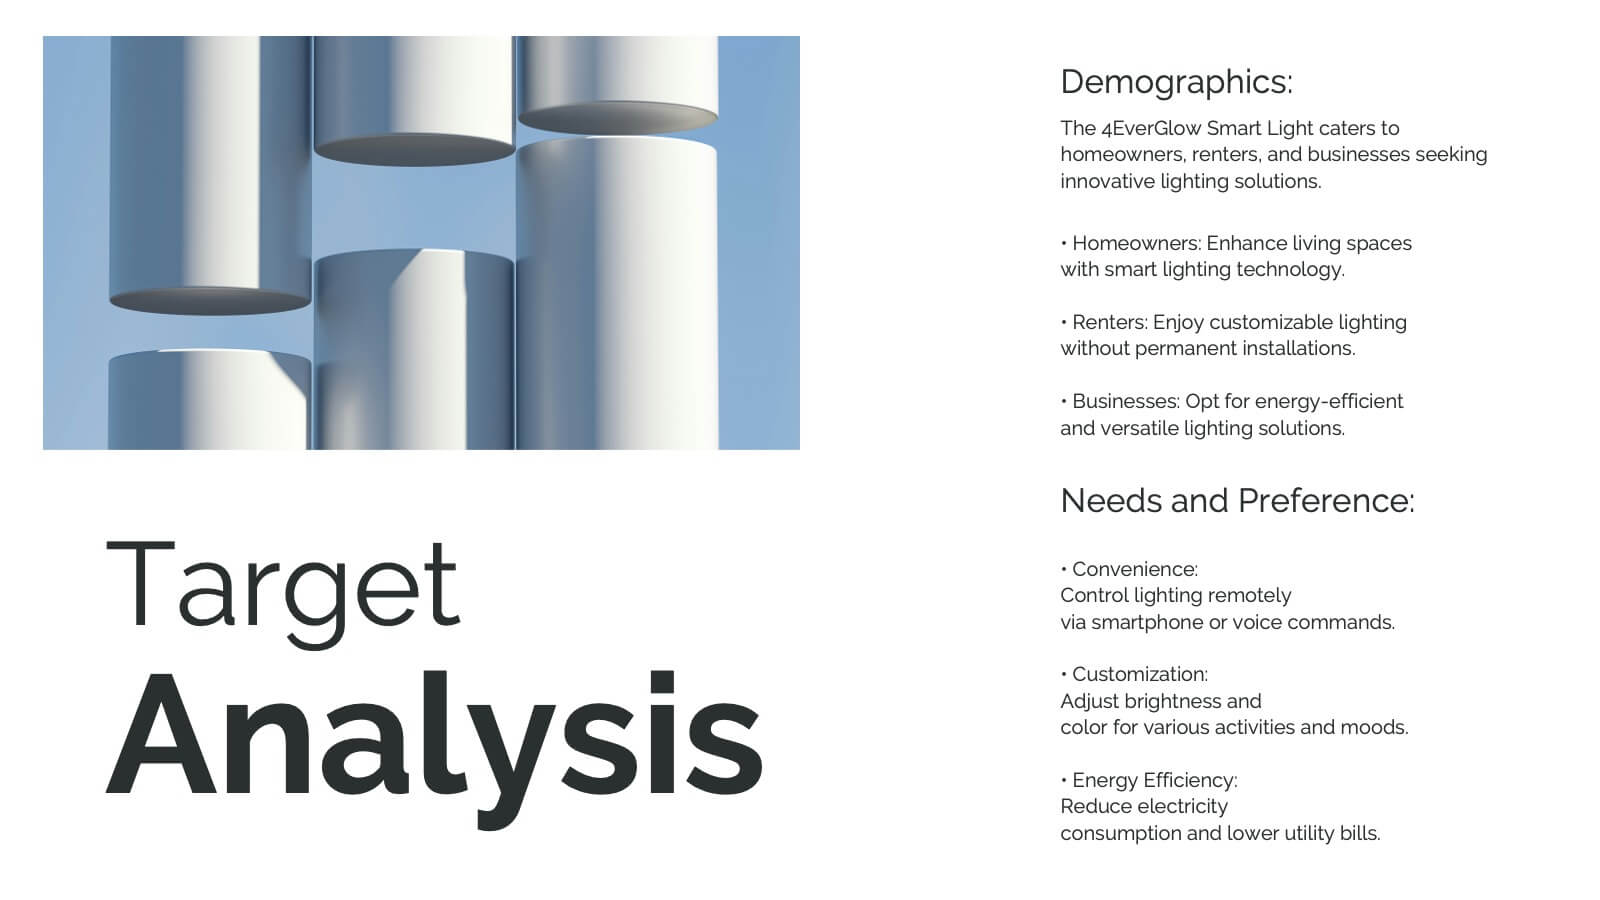
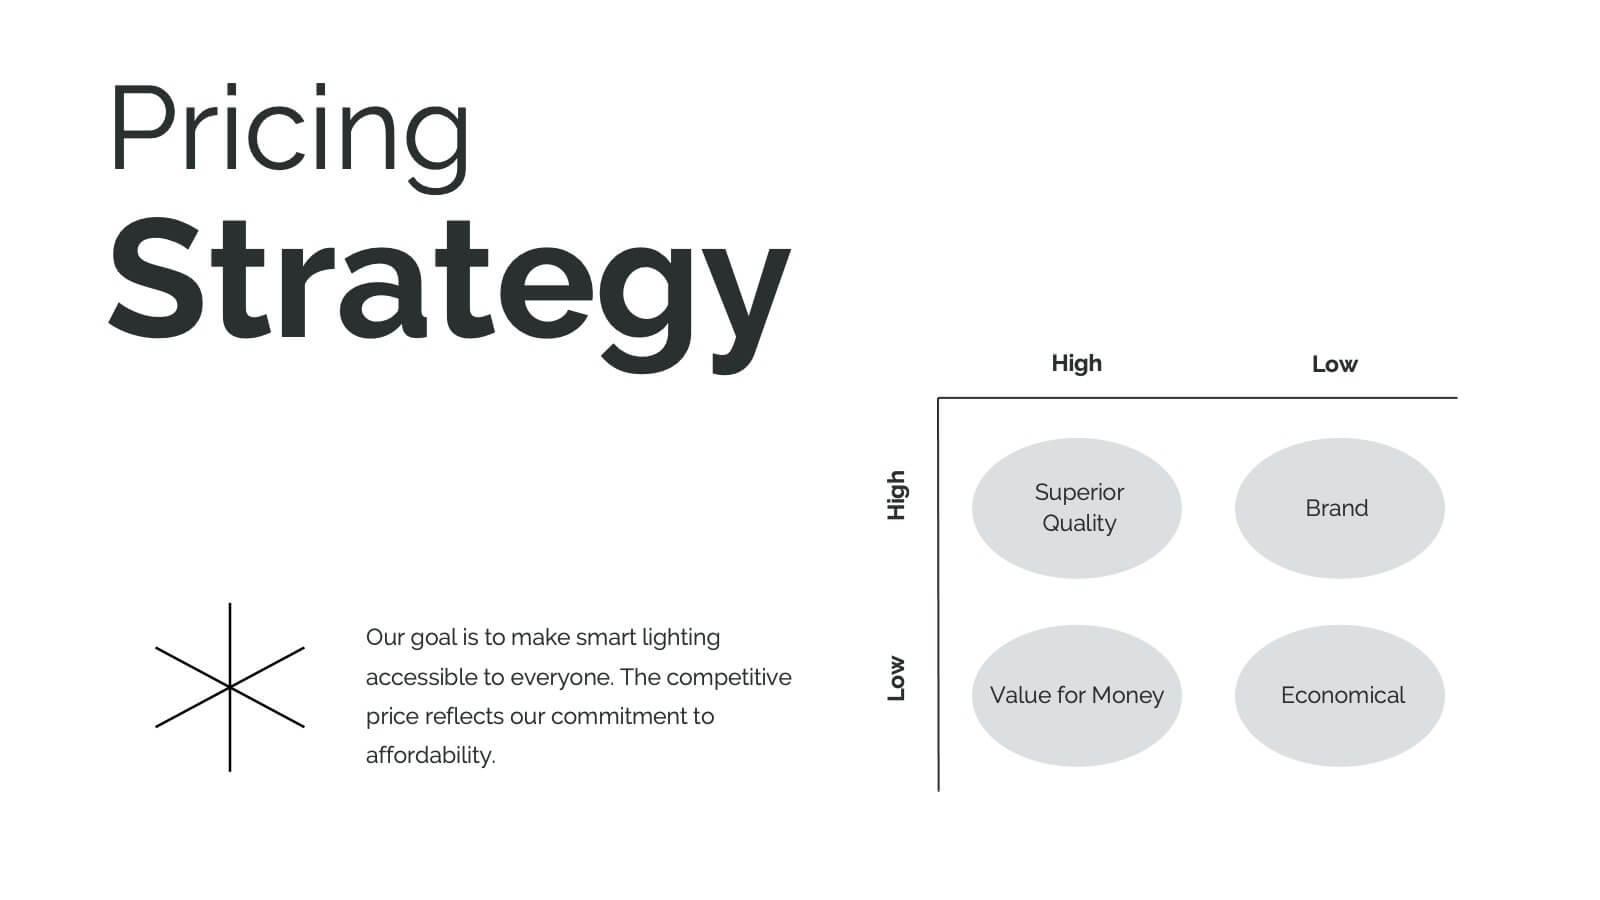
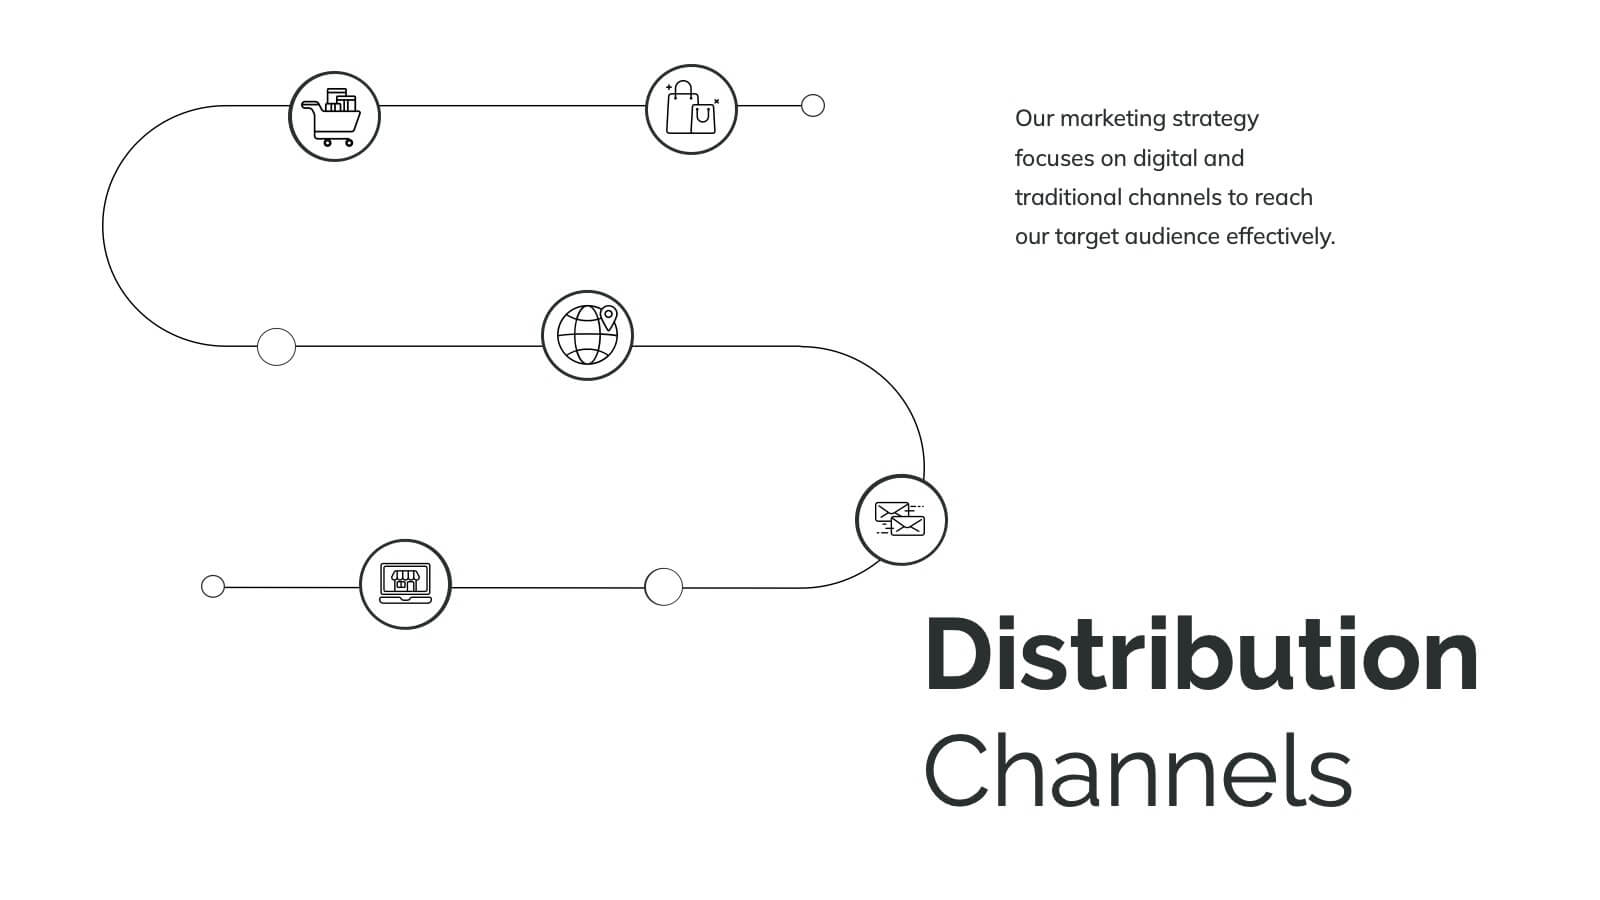
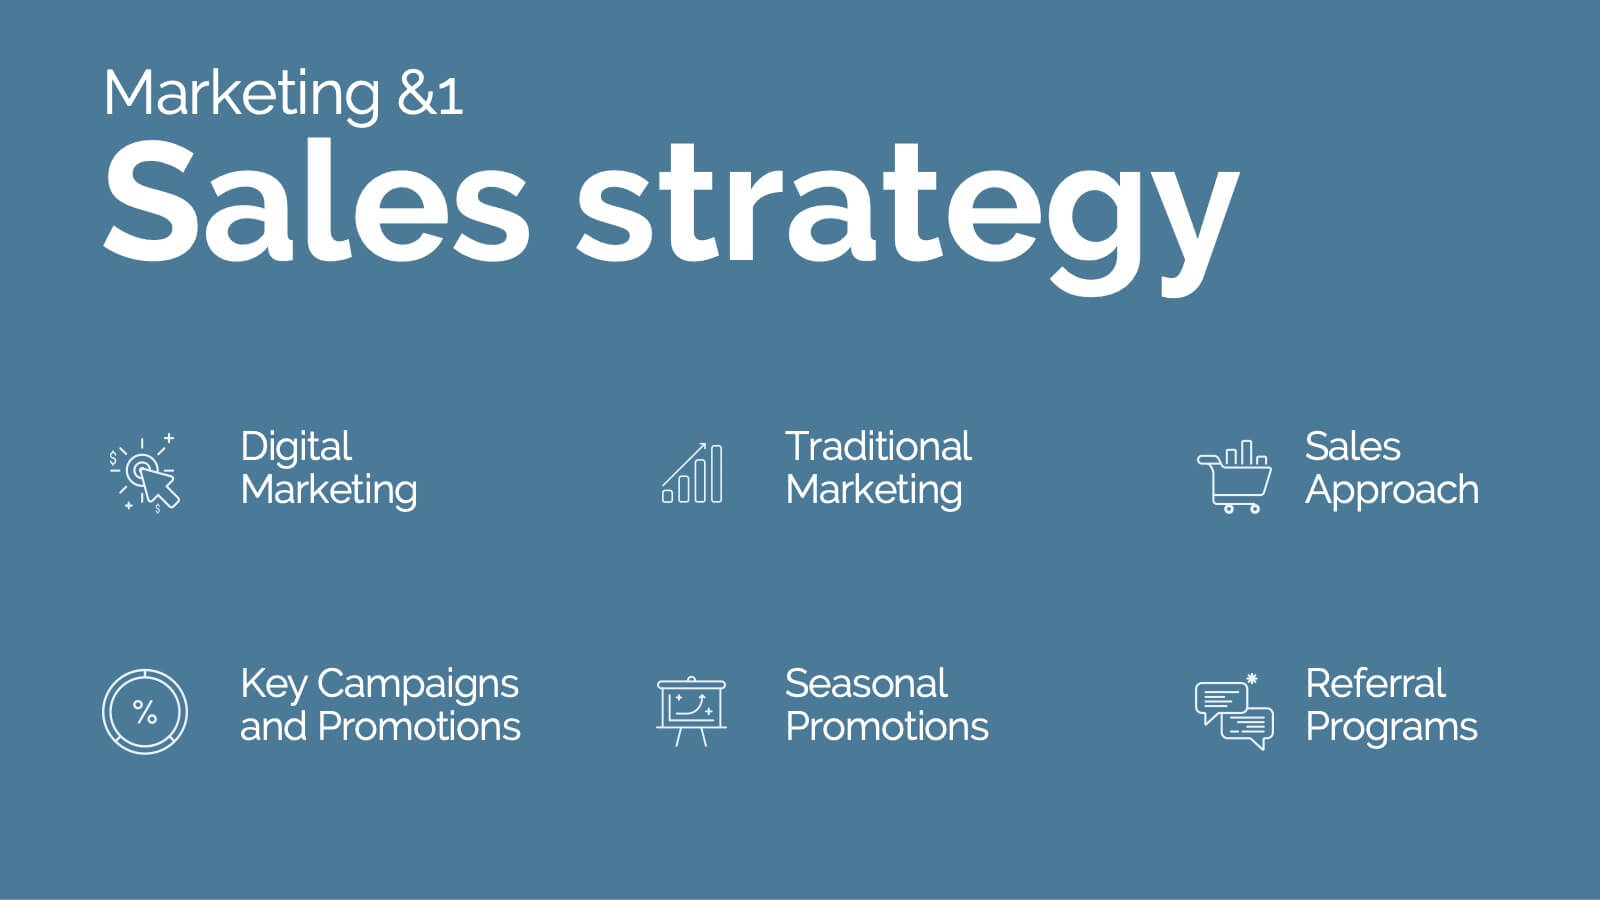
Hydra Product Launch Presentation
Unveiling your latest product has never been easier or more captivating! This comprehensive presentation template covers every aspect of your product's journey—from launch to competitive analysis. Engage your audience with detailed slides on features, target analysis, and pricing strategy. Seamlessly compatible with PowerPoint, Keynote, and Google Slides for maximum flexibility and impact.

21 diapositivas
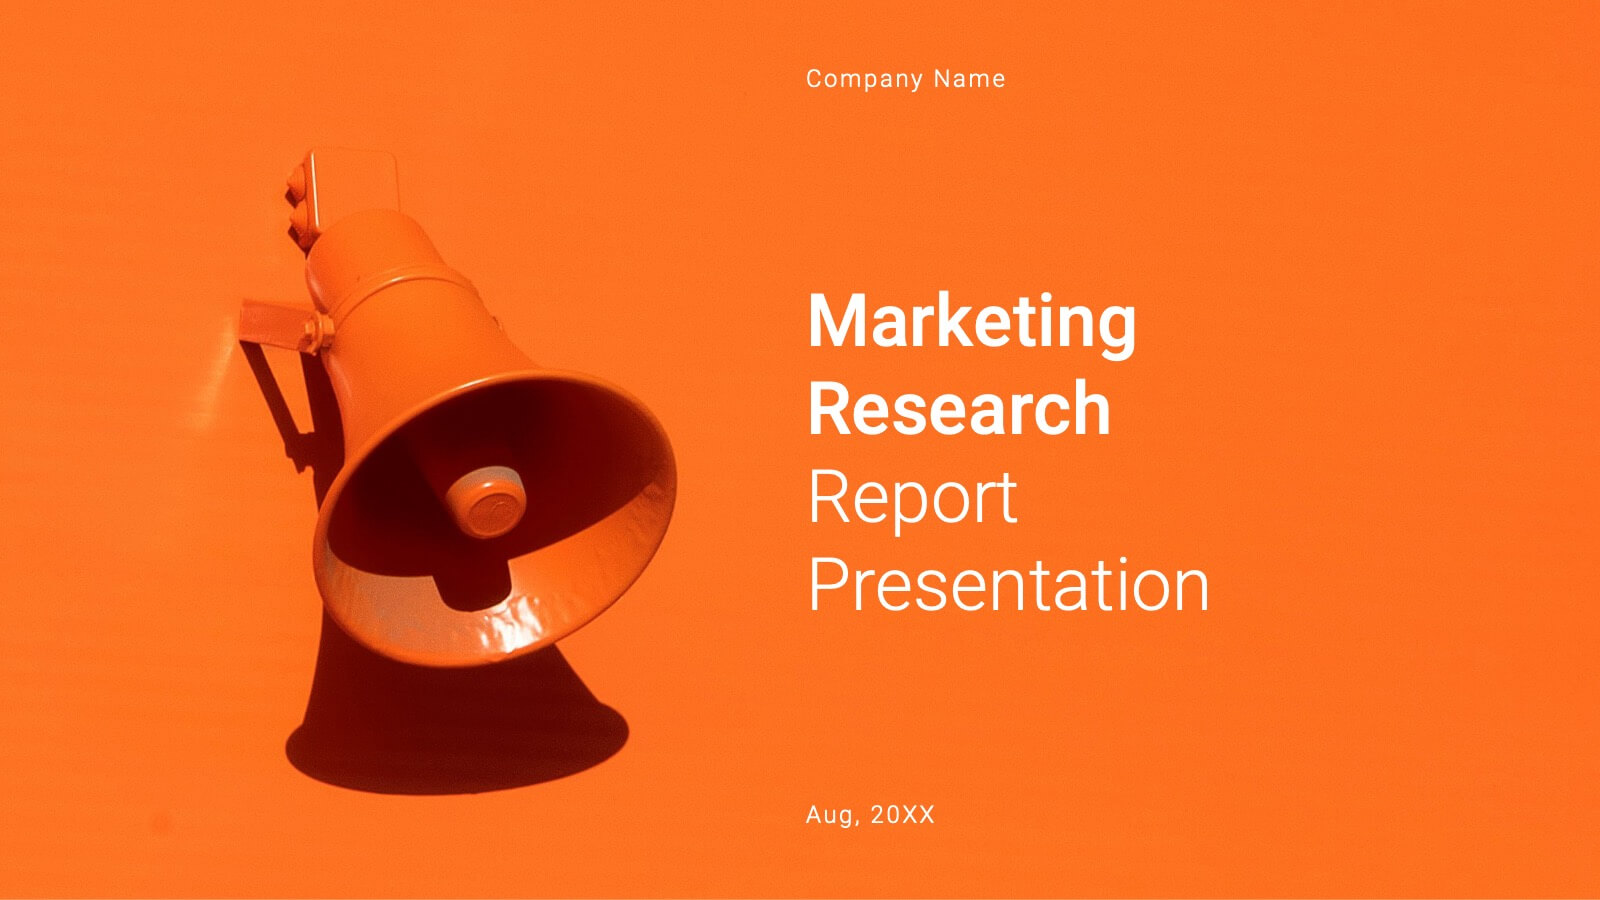
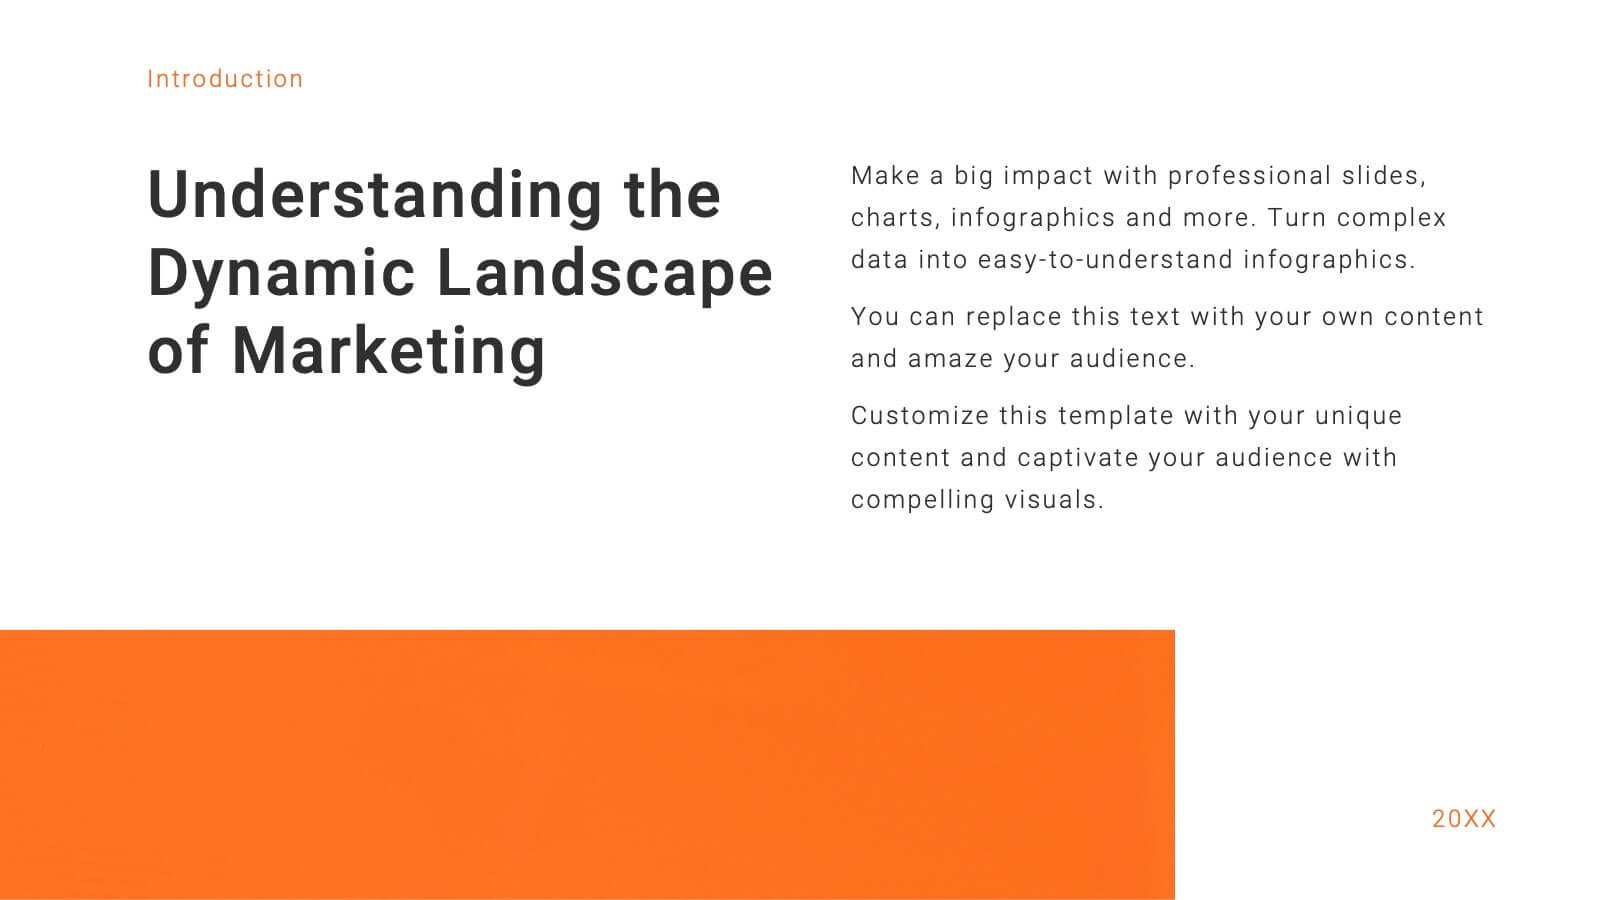
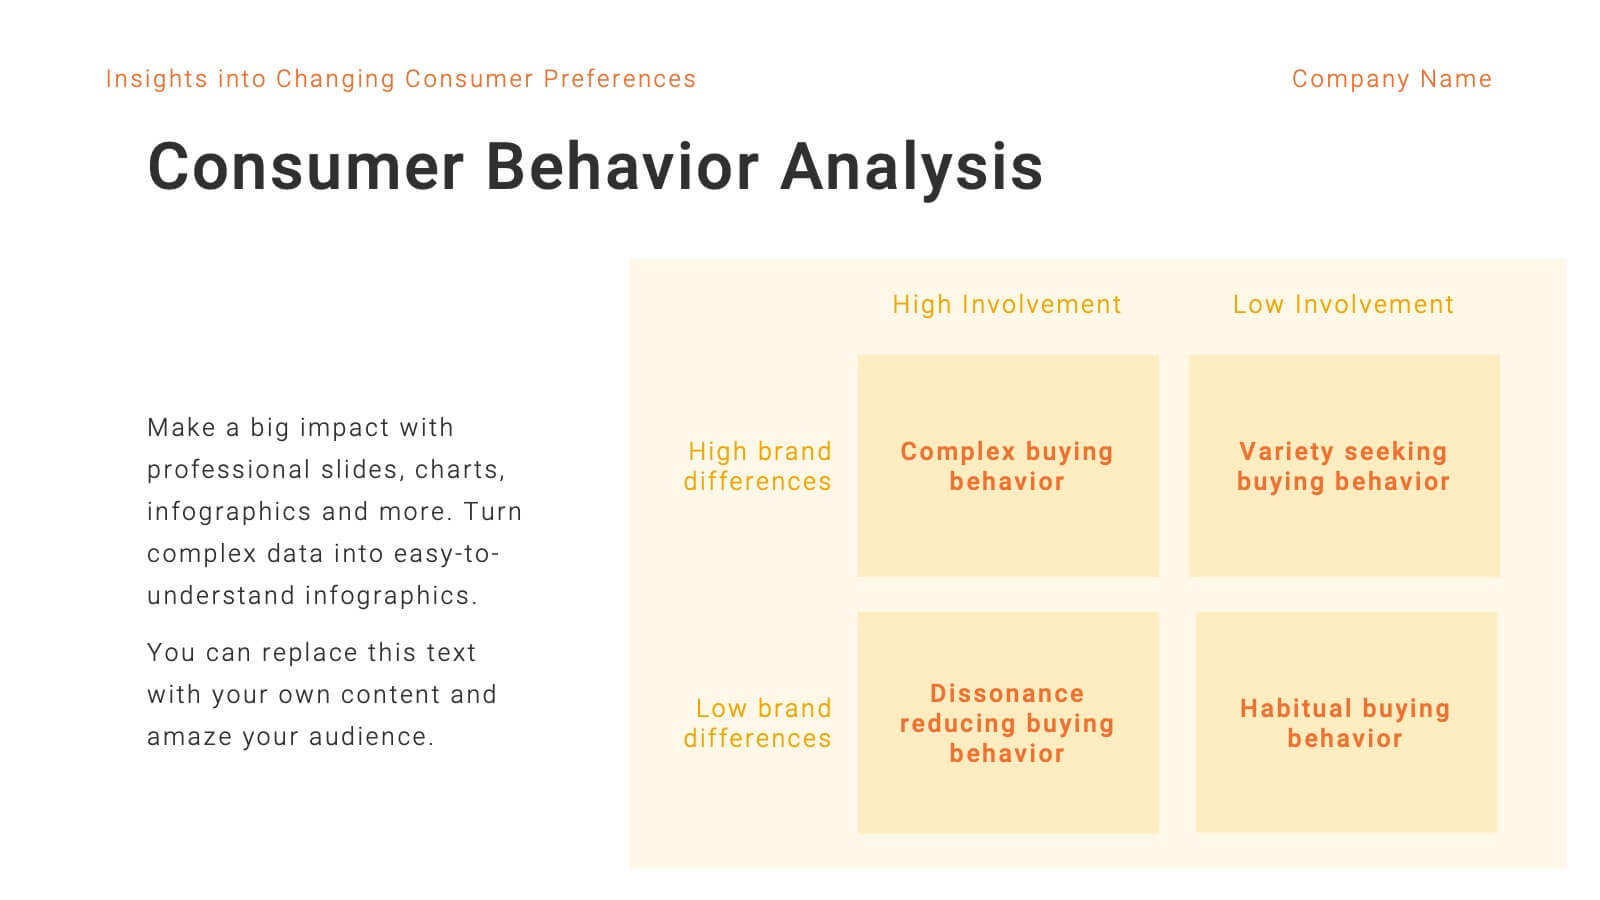
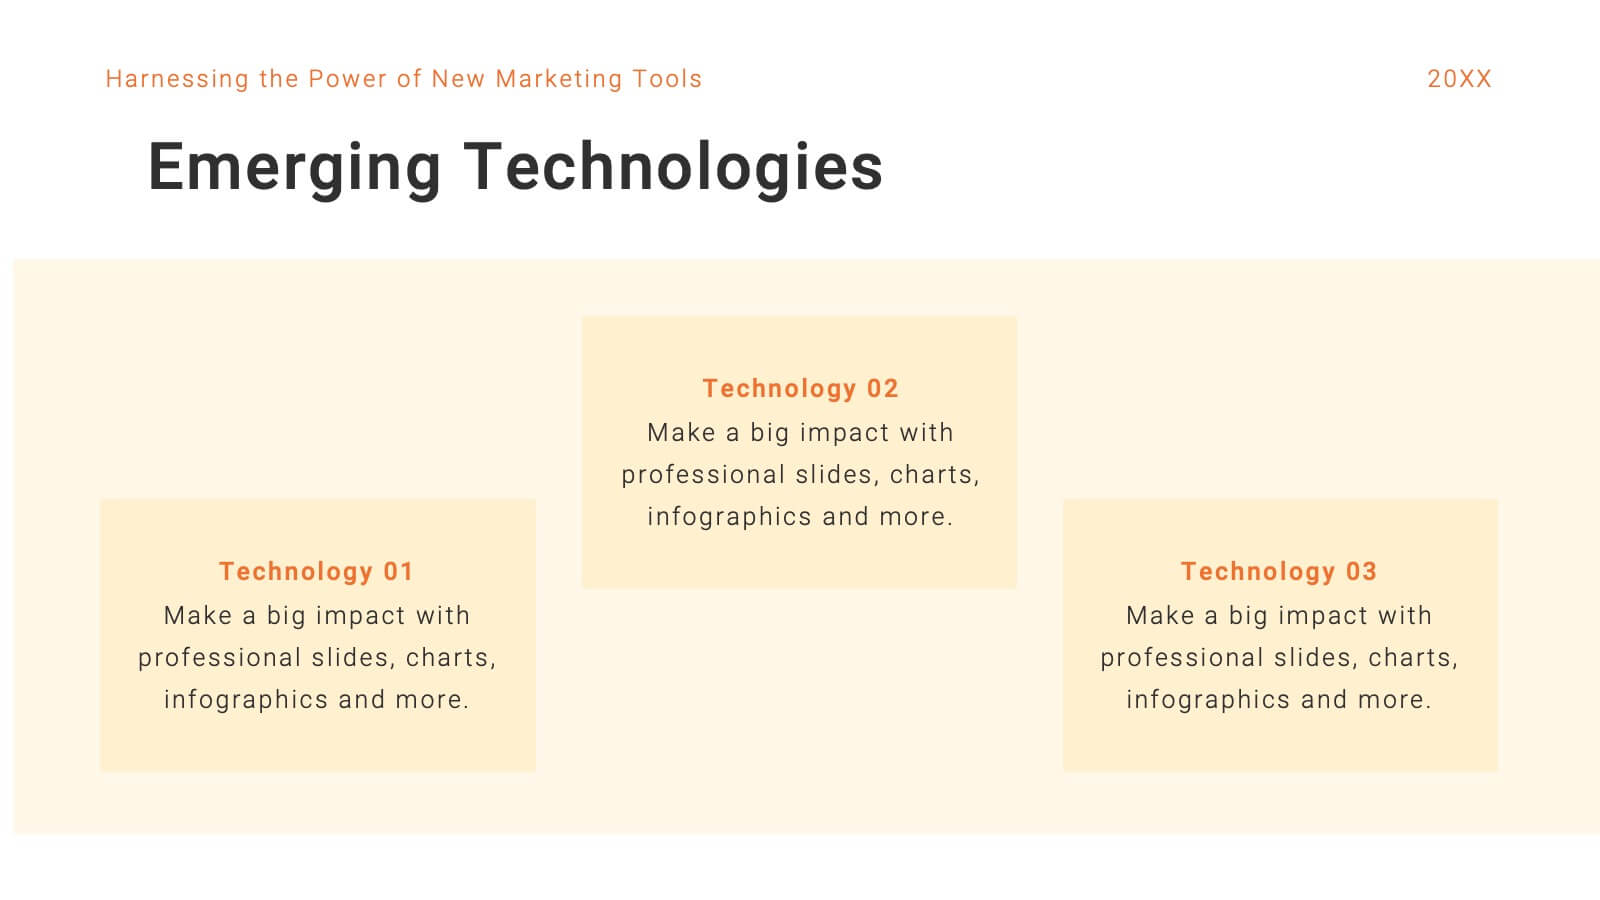
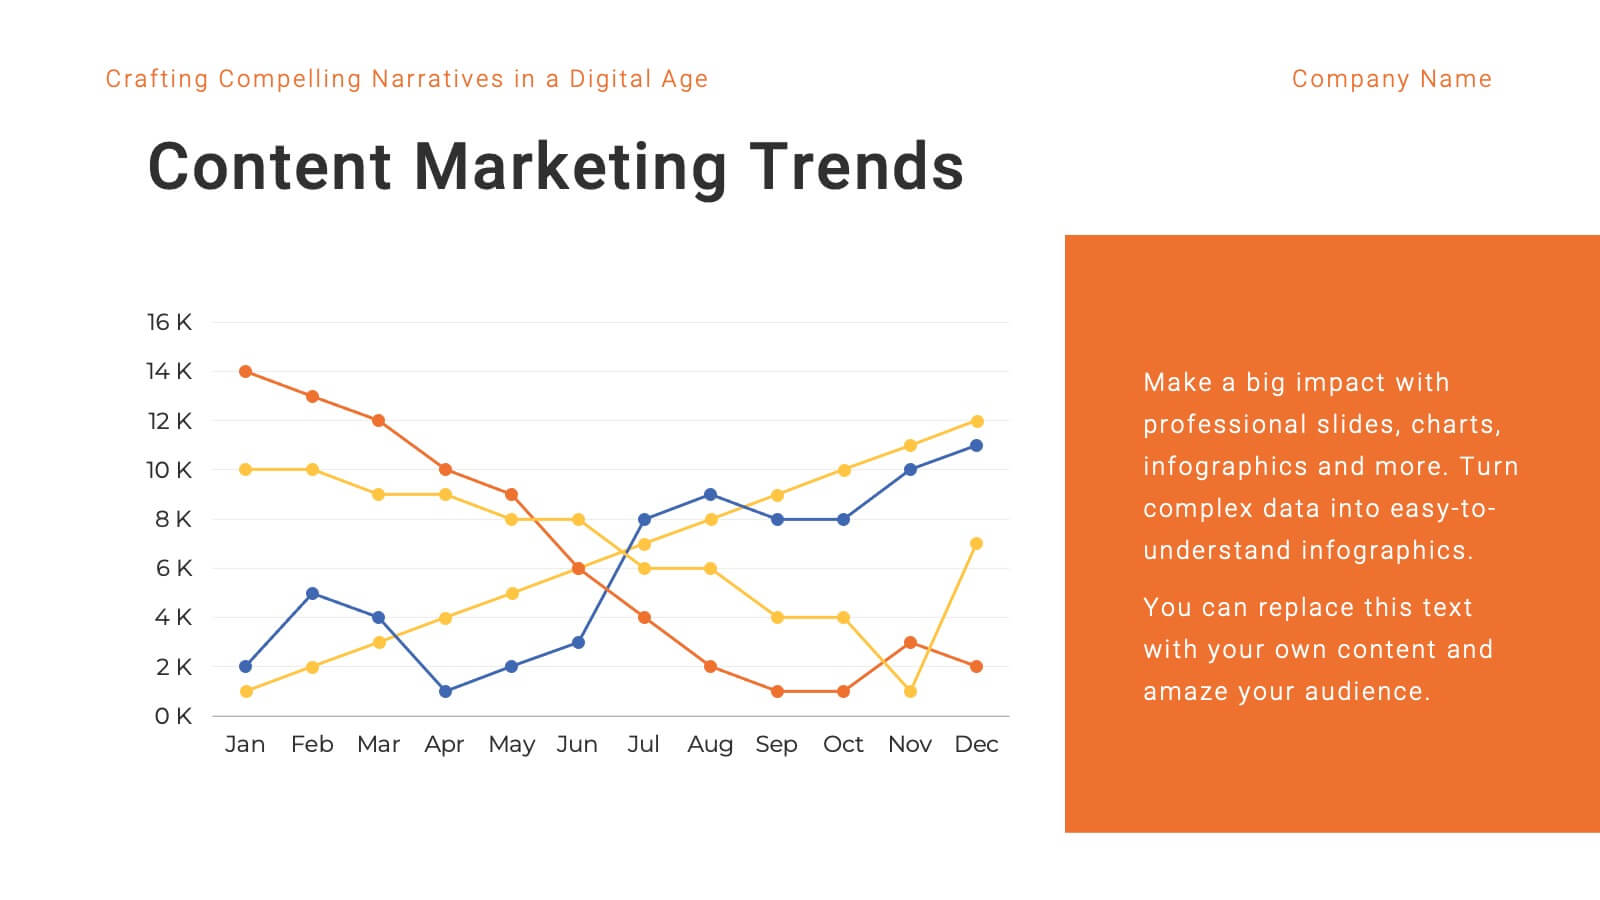
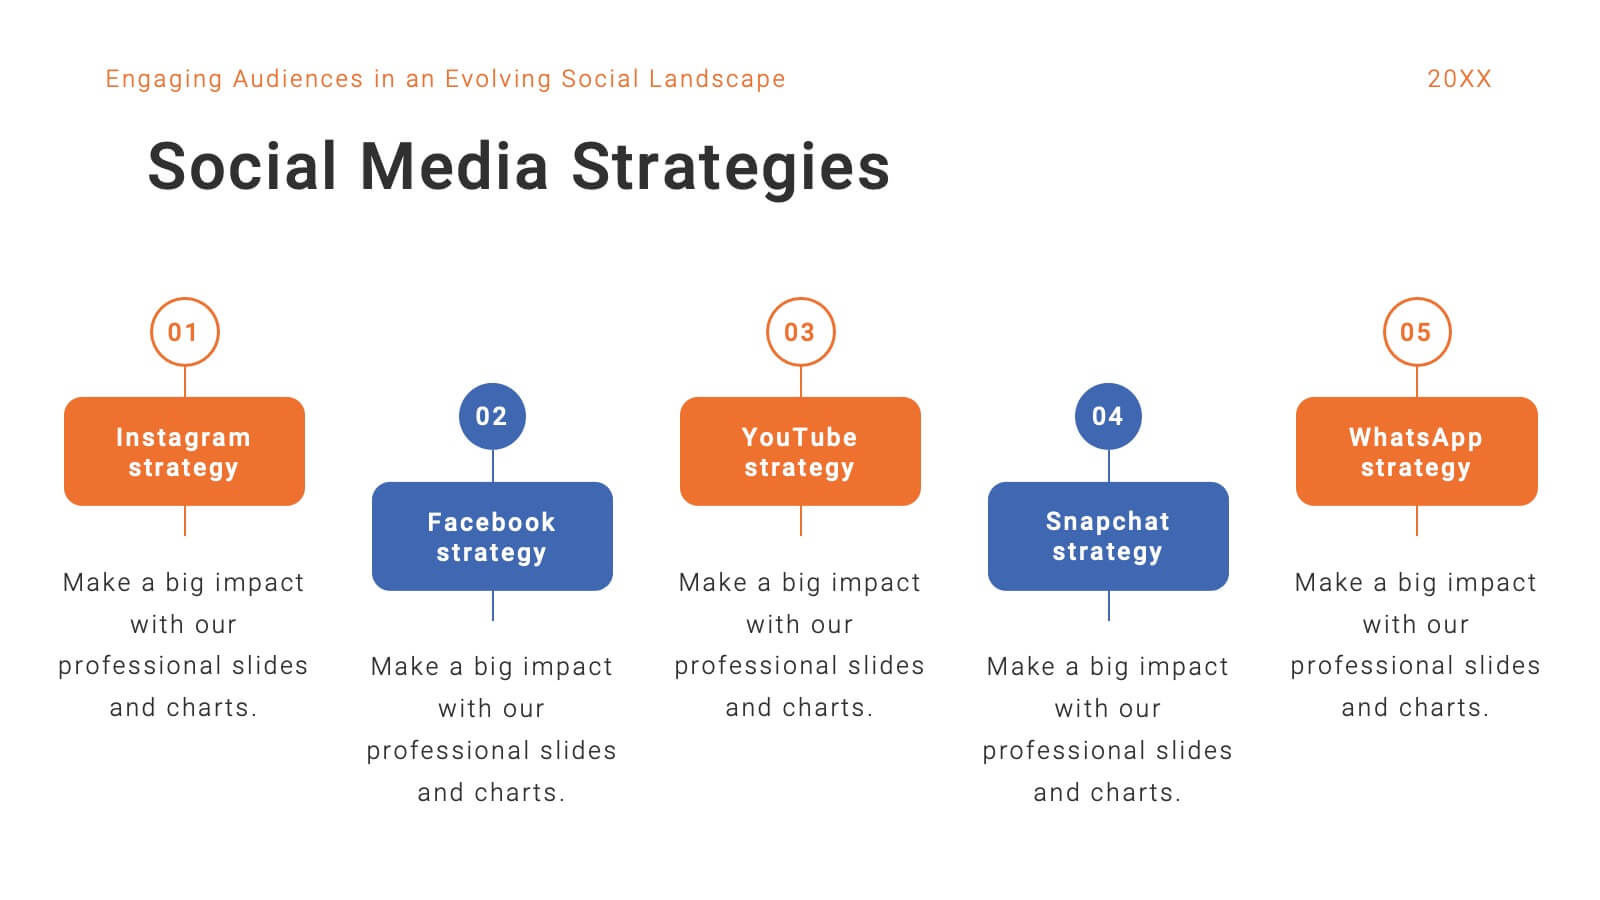
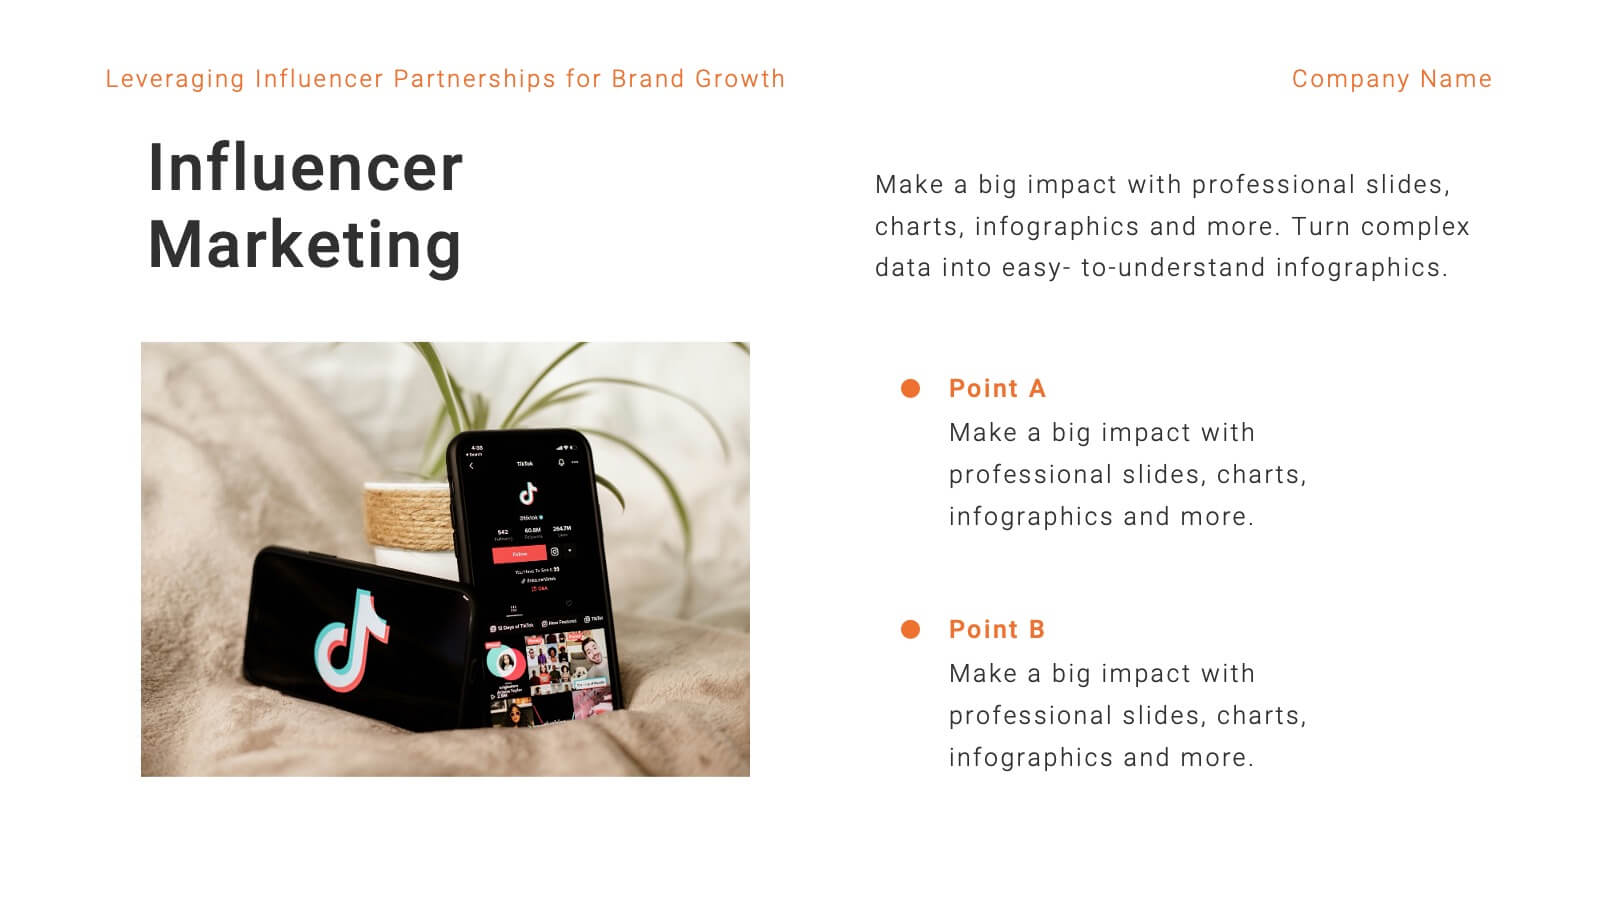
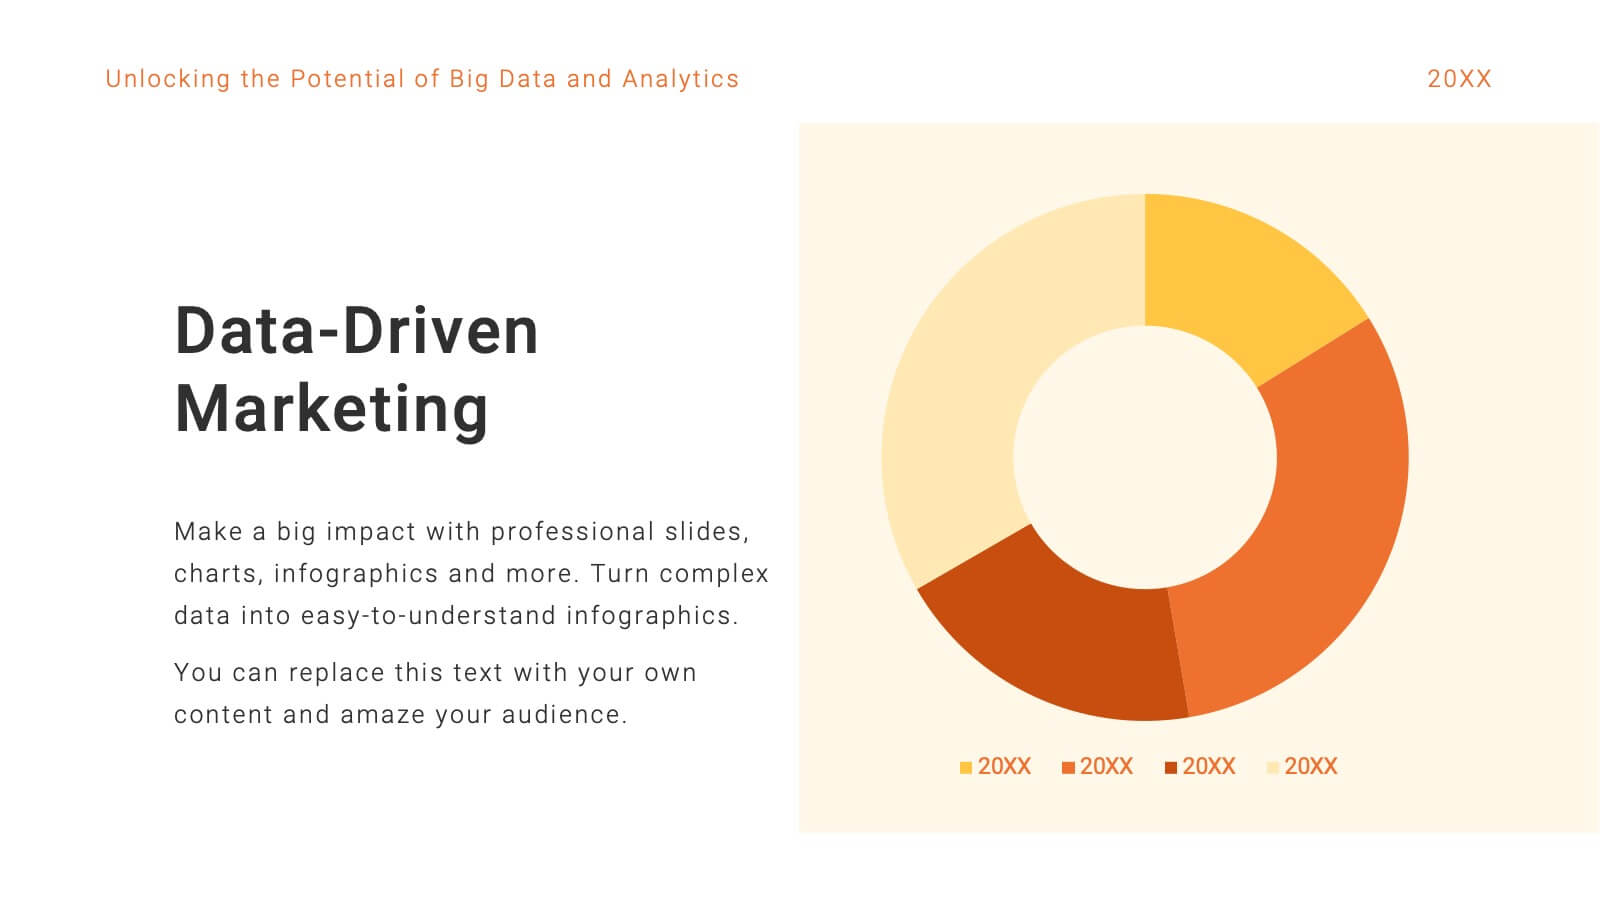
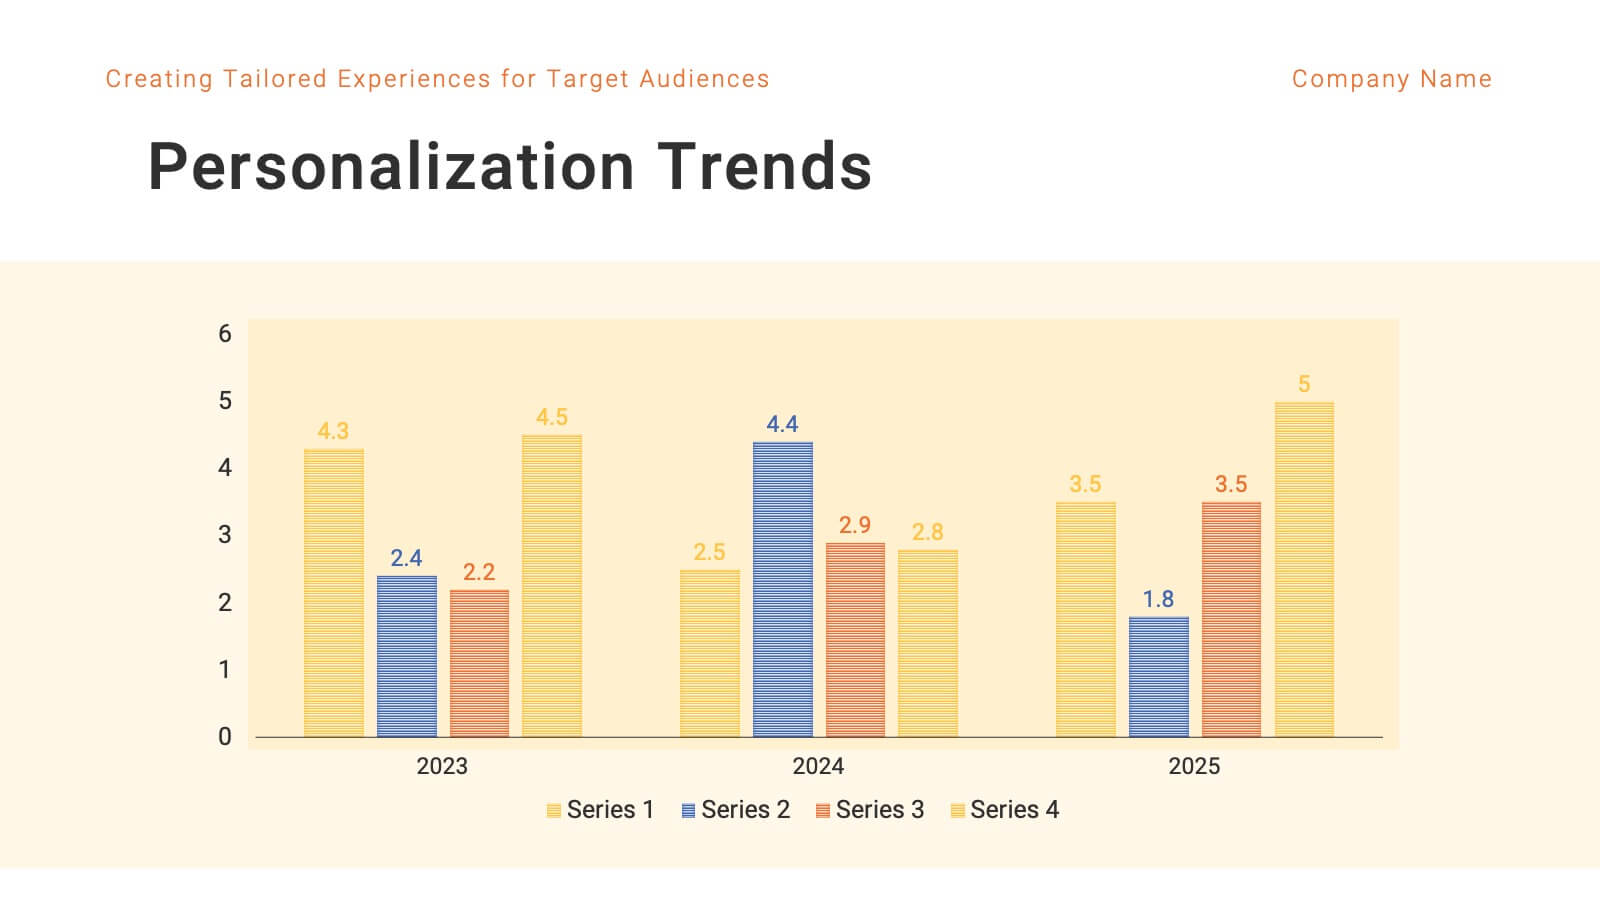
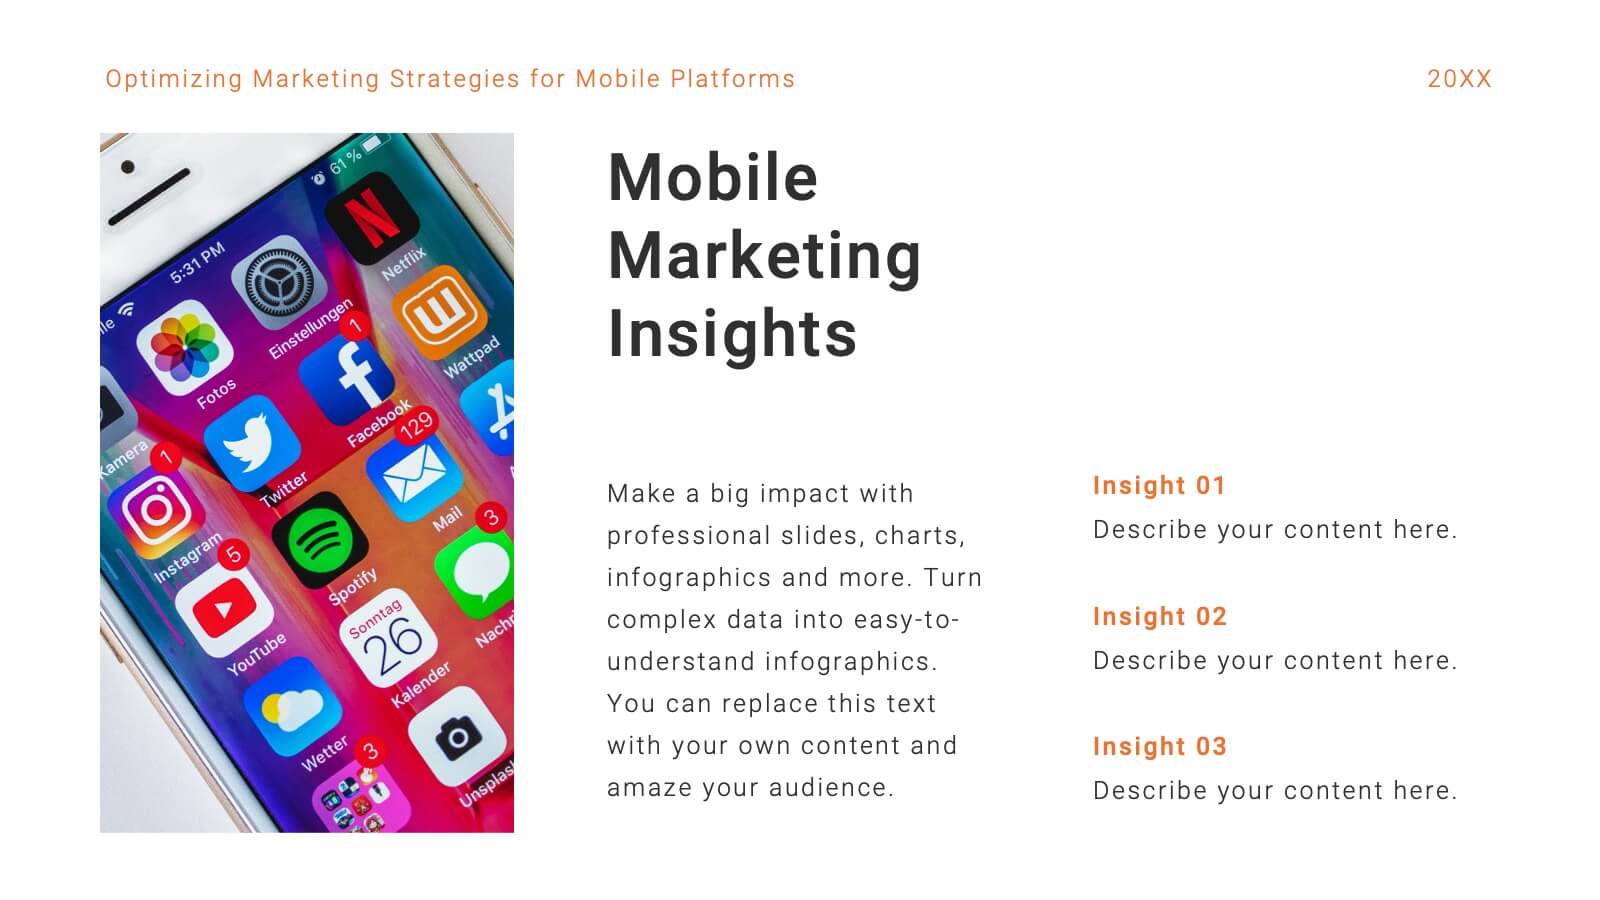
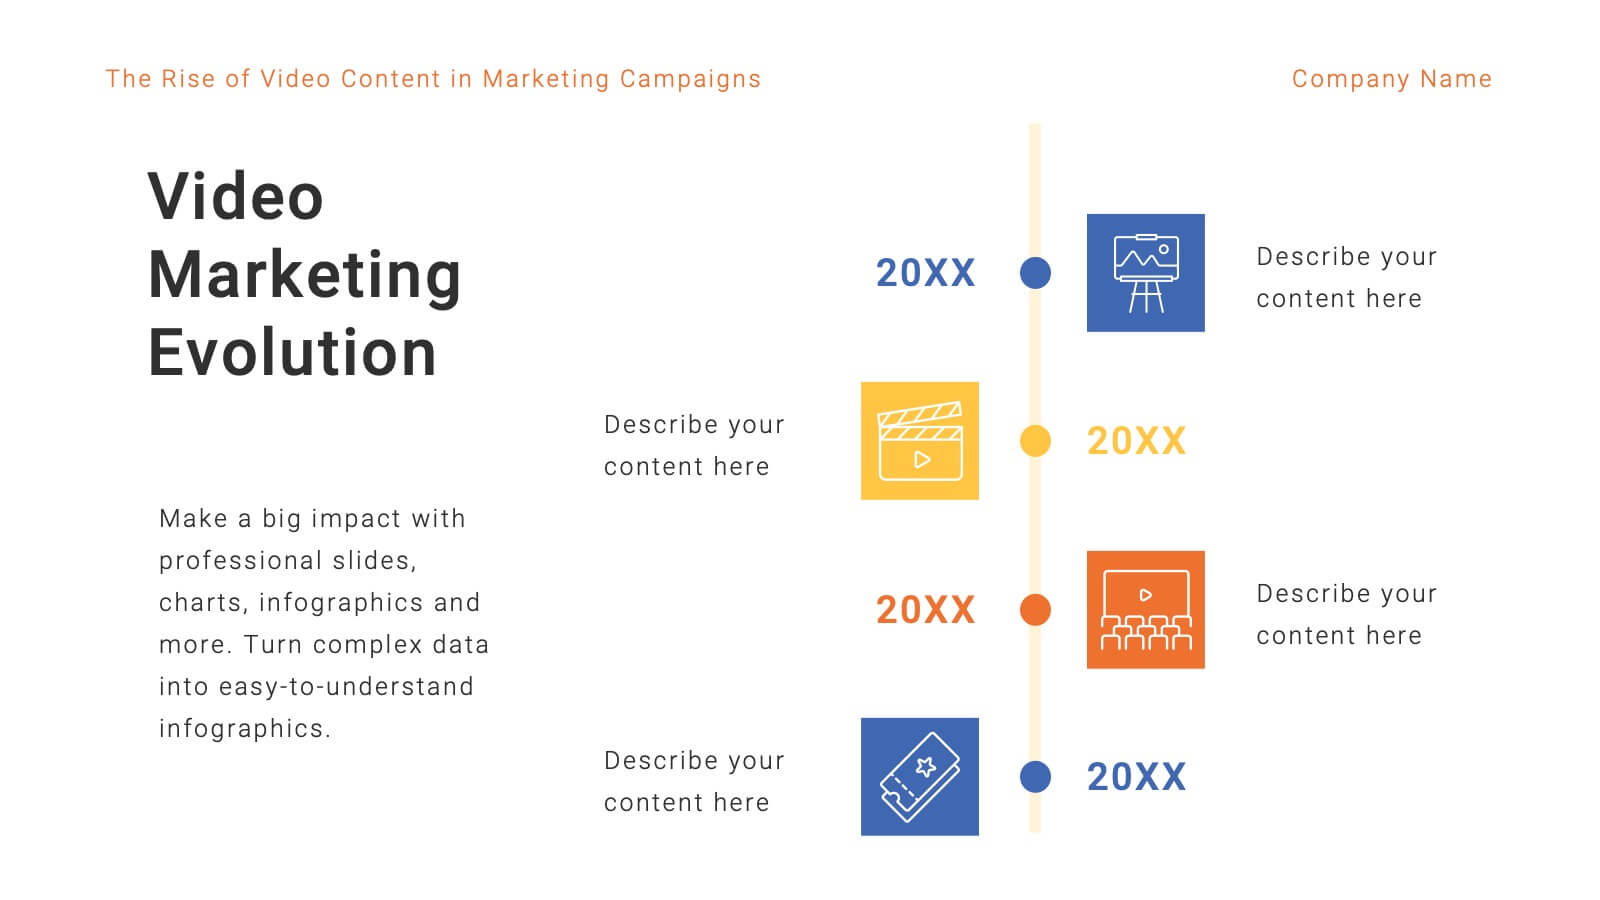
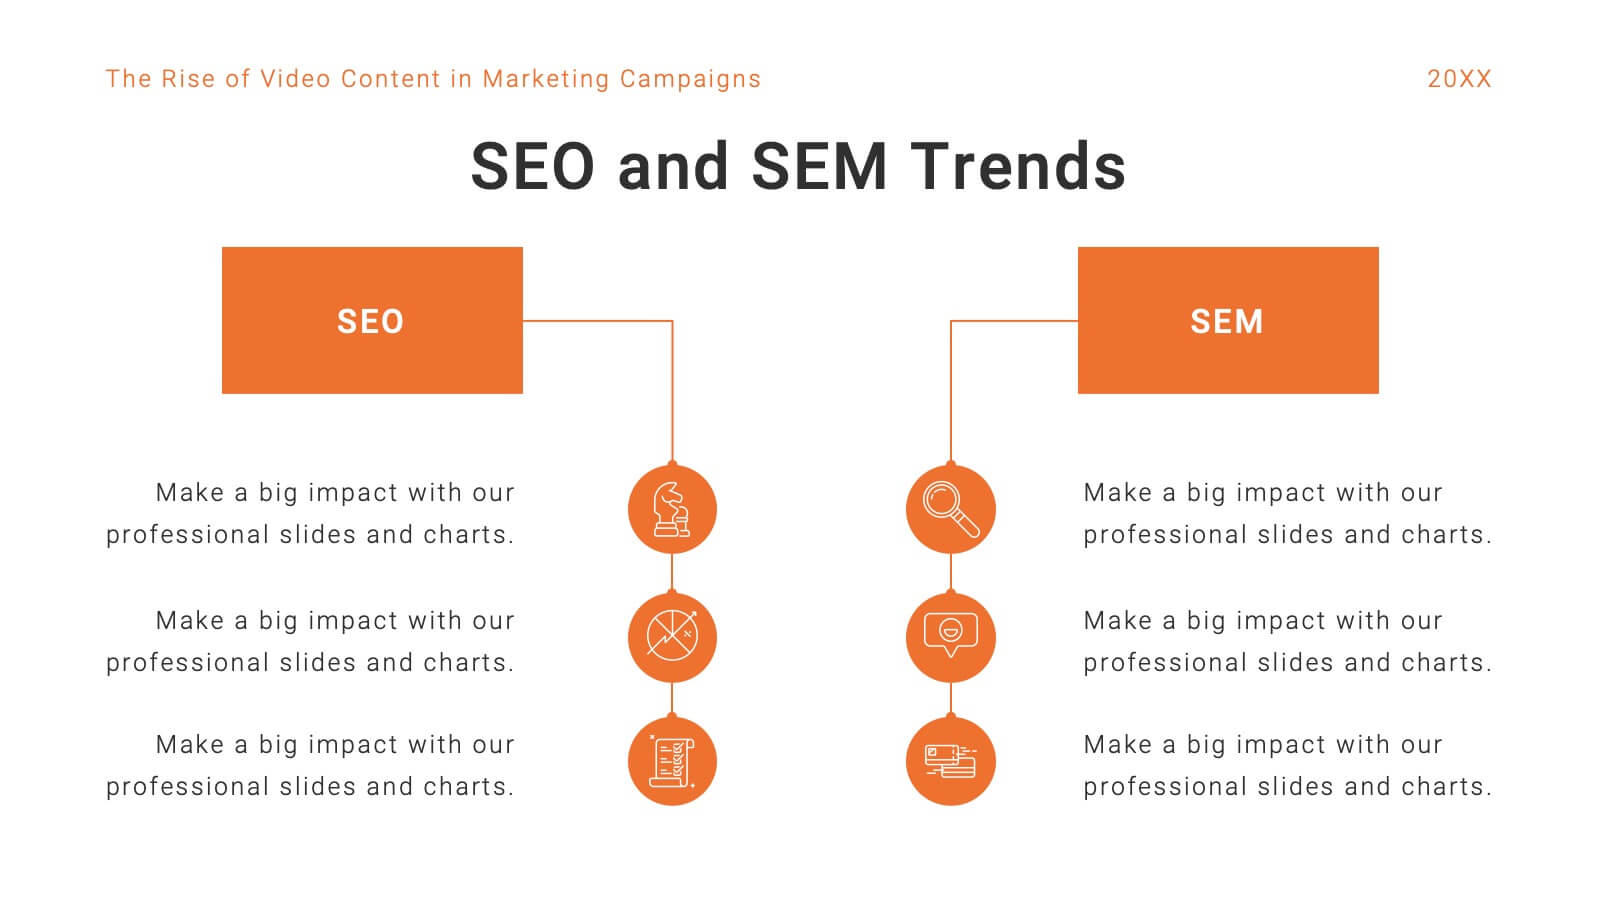
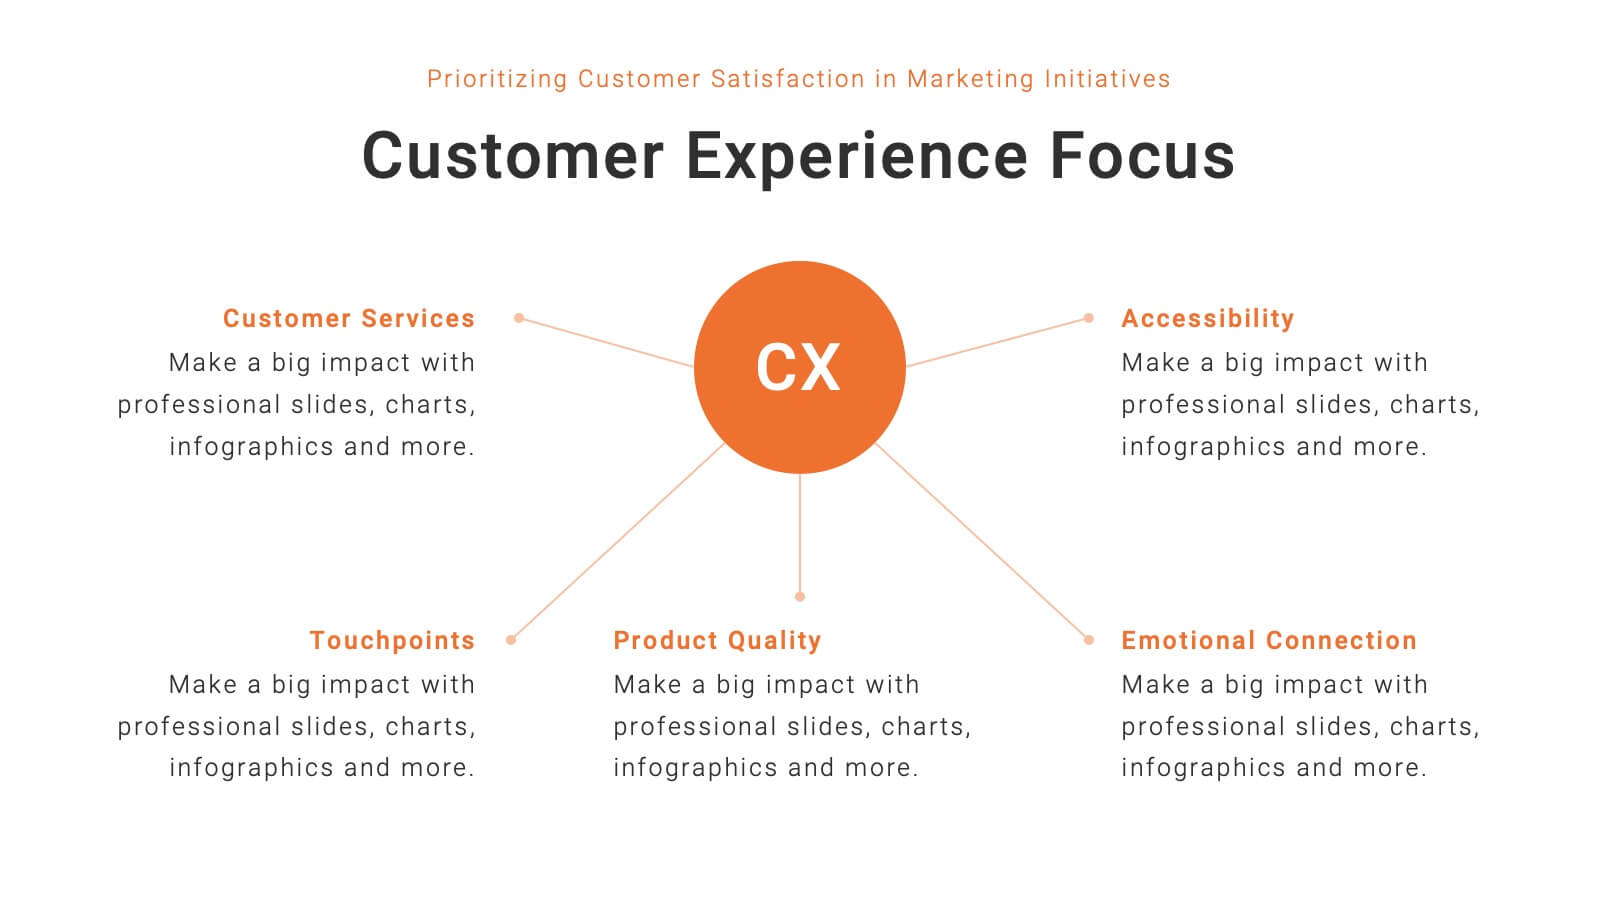
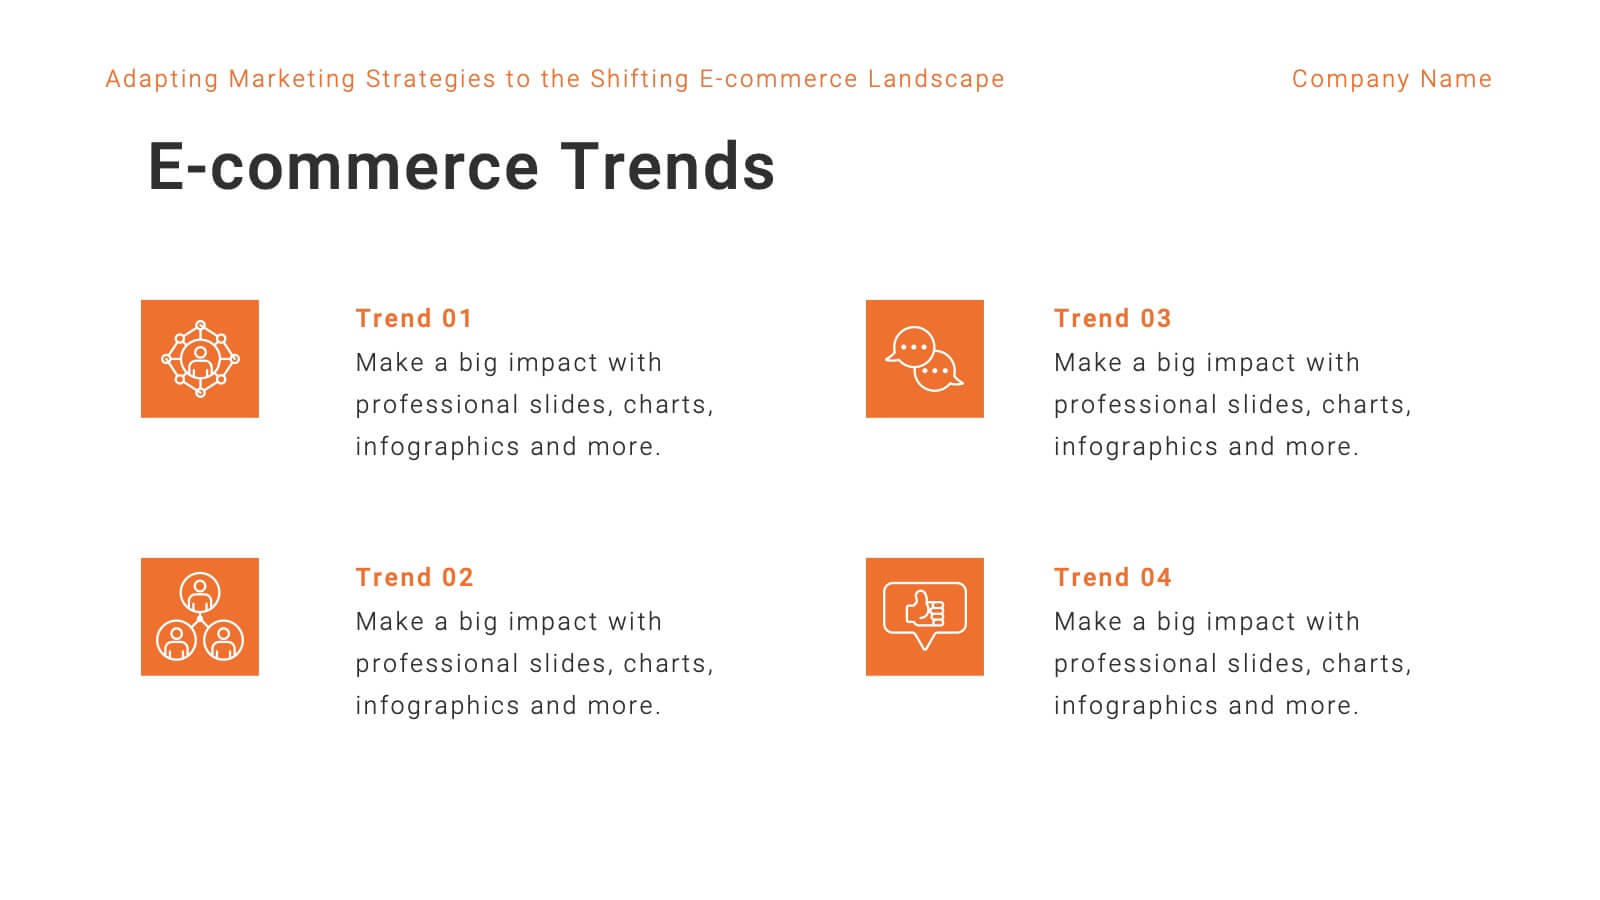
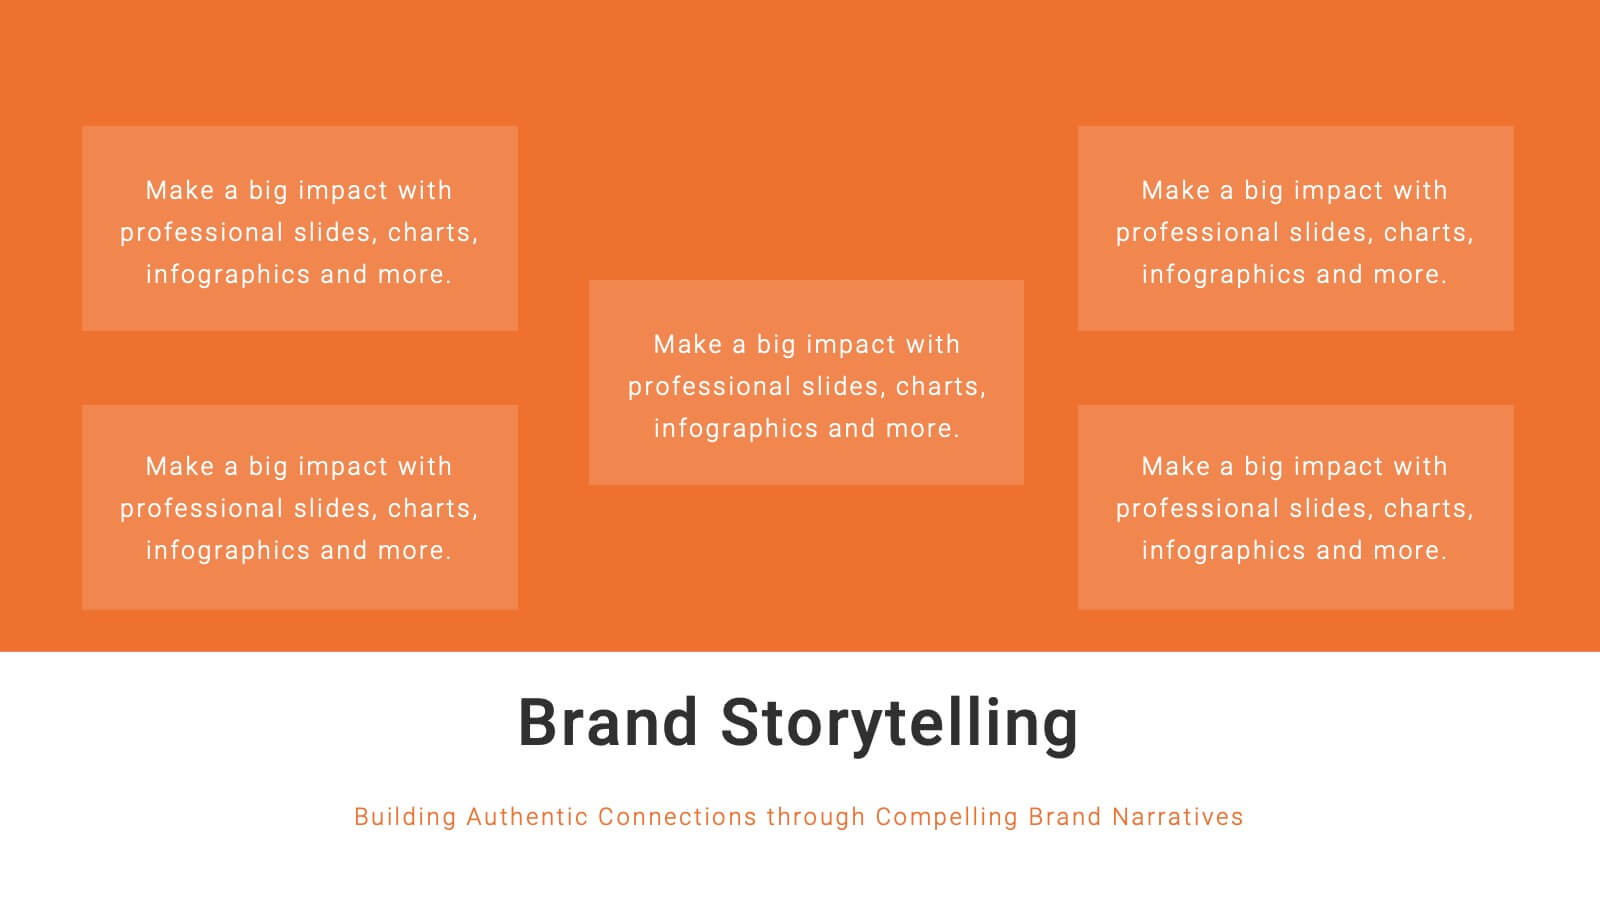
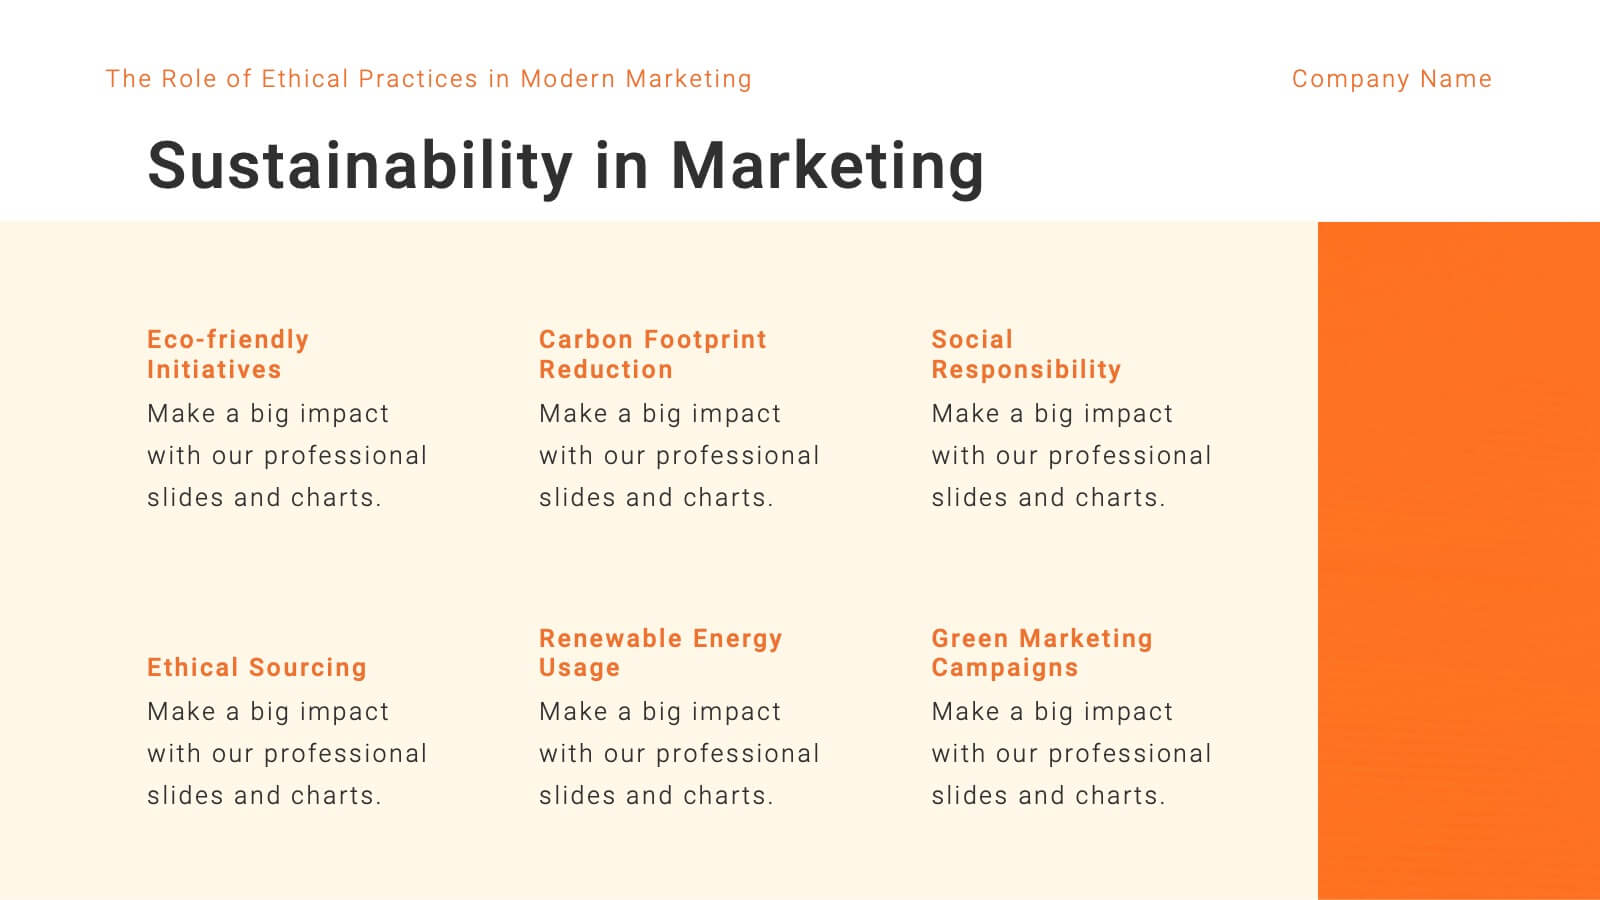
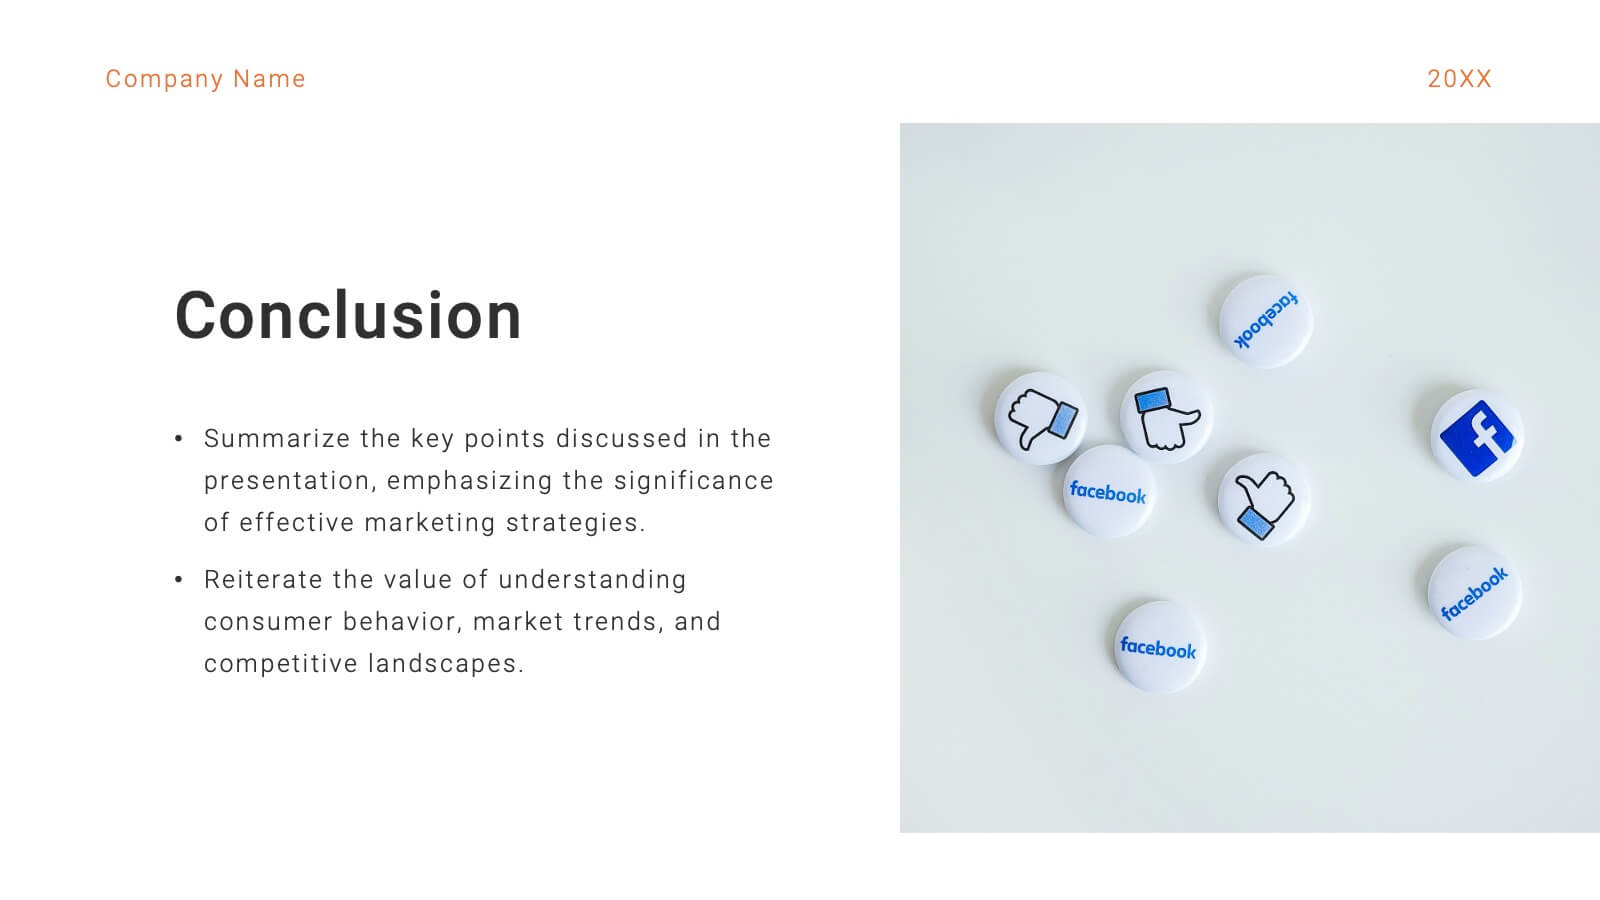
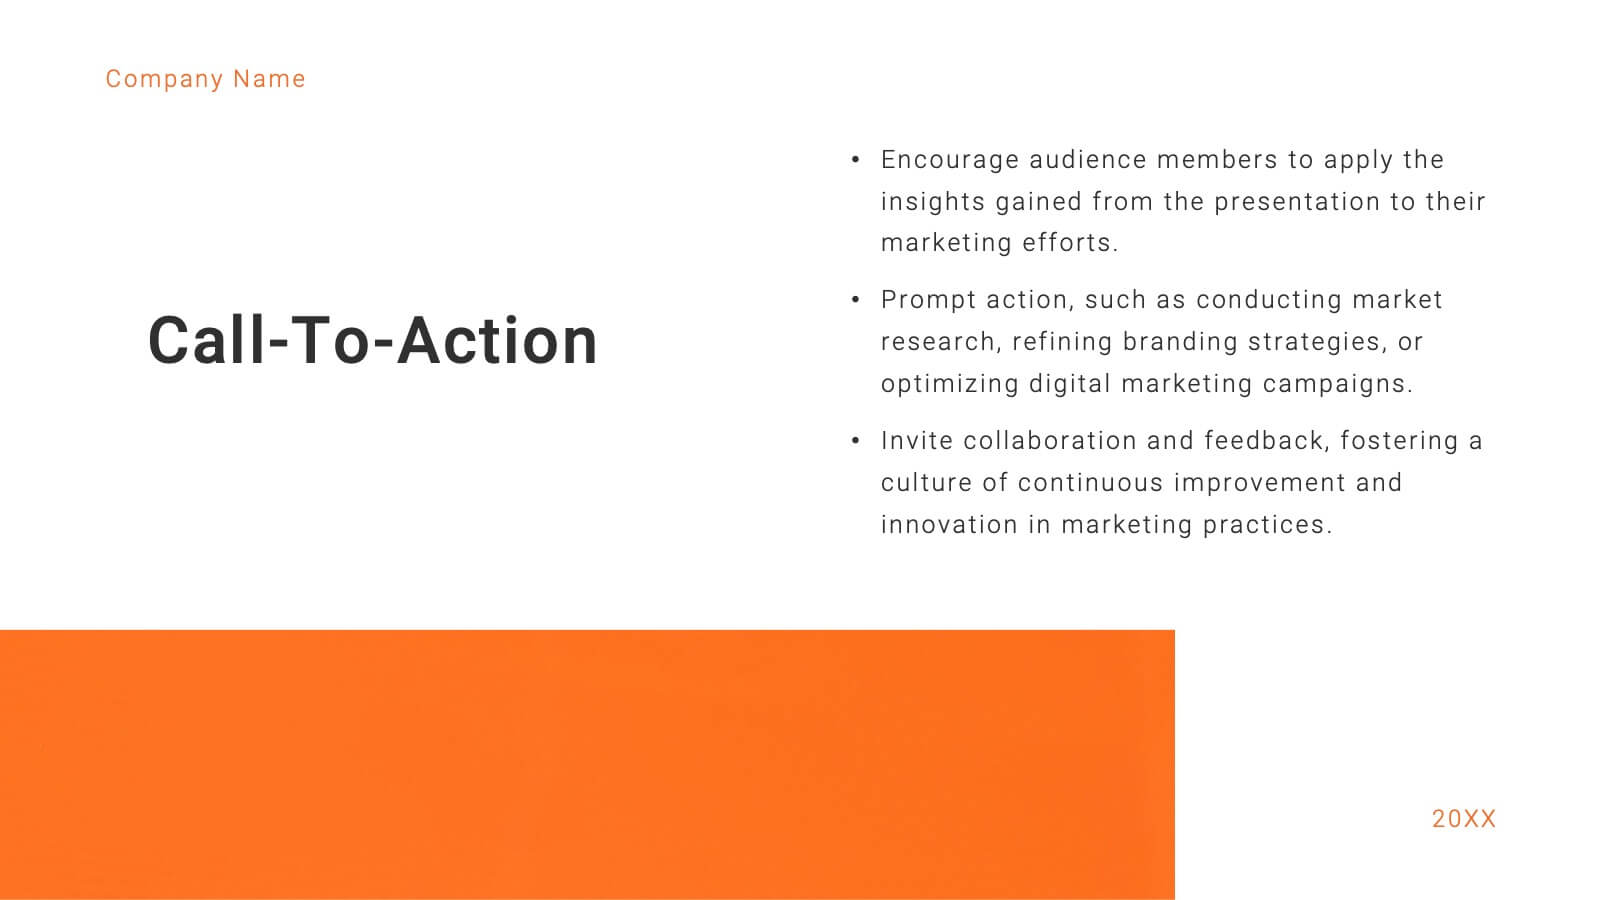
Mercury Marketing Research Report Presentation
Elevate your marketing strategy with this insightful and data-driven presentation template! Perfect for analyzing trends, consumer behavior, and emerging technologies, this template provides a thorough overview of today’s marketing landscape. From social media strategies to e-commerce trends, it covers all key areas. Fully customizable and compatible with PowerPoint, Keynote, and Google Slides for easy use.


5 diapositivas
Human Resource Management Infographics
Human Resources Management is a critical function within organizations that focuses on managing and developing the human capital of an organization. These infographic templates are designed to showcase key concepts and strategies related to HR management. These infographics are in vertical form and offer a range of slide layouts to cover various aspects of HR. This offers a visually appealing and informative way to present key concepts and strategies. Compatible with Powerpoint, Keynote, and Google slides, Its customizable features and logical structure make it an effective tool for HR presentations or educational purposes related to HR management.


6 diapositivas
Circular Business Wheel Model Presentation
Break down your strategy into dynamic segments with this Circular Business Wheel Model. This layout is ideal for showcasing interconnected business areas like sustainability, innovation, monetization, and market appeal. Perfect for strategy decks, business planning, and growth presentations. Compatible with PowerPoint, Keynote, and Google Slides—fully editable for your needs.


5 diapositivas
Cyber Security Risk Management Presentation
Effectively visualize your digital defense strategy with this cyber security-themed presentation layout. Featuring a sleek laptop illustration and circular infographic design, this template helps you outline five critical areas of risk management with matching icons and editable text sections. Ideal for IT teams, consultants, or training sessions. Fully customizable and compatible with PowerPoint, Keynote, and Google Slides.


4 diapositivas
Financial Overview Slide Presentation
Kick off your presentation with a clean, modern visual that makes financial insights easy to grasp at a glance. This slide helps you summarize key metrics, compare performance areas, and highlight important business trends in a simple, structured layout. Fully compatible with PowerPoint, Keynote, and Google Slides.


5 diapositivas
Yoga Poses Infographics
Yoga Poses, also known as asanas, are physical postures practiced in the discipline of yoga. They are designed to promote strength, flexibility, balance, and mindfulness. These infographic templates focuses on illustrating various yoga poses and their benefits. It is designed to help individuals understand and practice different yoga poses effectively. This template features beautifully designed infographics with icons and illustrations that showcase different yoga poses. These covers a wide range of yoga, including balancing poses, Chakra yoga, standing poses, and yoga for pregnancy.


5 diapositivas
Client Success Story Presentation
Celebrate achievements and highlight results with a vibrant, storytelling layout that turns client wins into memorable visuals. Perfect for showcasing success milestones, project outcomes, and impact metrics, this presentation helps build trust and credibility. Fully compatible with PowerPoint, Keynote, and Google Slides for easy editing and smooth professional delivery.


20 diapositivas
Unity New Product Proposal Presentation
Unveil your product strategy with this modern, comprehensive template! Highlight your company overview, product features, and unique selling proposition. Perfect for presenting market analysis, pricing strategy, and technical specifications. Ideal for product managers and developers. Compatible with PowerPoint, Keynote, and Google Slides.


5 diapositivas
Customer Satisfaction Survey Ratings Presentation
Present customer insights with clarity using this Customer Satisfaction Survey Ratings slide. Designed with a vertical timeline beside a thumbs-up icon, it’s perfect for showcasing key survey data, feedback percentages, or sentiment trends. Each rating step includes editable text and color-coded markers for easy comparison. Compatible with PowerPoint, Canva, and Google Slides.


5 diapositivas
Construction Processes Infographics
Dive into the construction industry with this detailed infographic template that provides a comprehensive overview of construction processes, careers, and competitive strategies. Ideal for professionals, educators, and students involved in construction, this resource offers a clear and structured presentation of various aspects of the field. The infographic is divided into sections detailing key areas such as industry sectors, job roles, and strategic approaches for sustainable competitiveness. It highlights important segments like planning, finance, legal aspects, and on-site construction activities, all designed to give a well-rounded view of the construction process. Additionally, it includes data on job growth, employment statistics, and future projections, which are crucial for understanding labor market trends within the construction sector. Vibrant colors and easy-to-understand layouts make this template not only informative but also visually appealing. Whether used in training sessions, academic courses, or professional presentations, this infographic is a valuable tool for conveying the dynamic and multifaceted nature of the construction industry.


5 diapositivas
Scrum Workflow Roles & Sprints Presentation
Simplify your agile presentations with this Scrum Workflow Roles & Sprints Template. Designed to visualize sprint cycles, team roles, and process flow, this layout makes Scrum methodology easy to grasp. Ideal for product managers and agile teams. Fully editable in PowerPoint, Keynote, and Google Slides for seamless customization.


6 diapositivas
Product Launch Pitch Deck
Make your product debut unforgettable with this dynamic pitch deck slide. Featuring clean visuals, pie chart stats, and a mobile app mockup, it’s ideal for tech startups and innovative brands. Fully customizable in PowerPoint, Keynote, and Google Slides, it's perfect for presenting key product benefits and performance highlights.


5 diapositivas
Strategic Planning with Concentric Circles Presentation
Visualize Your Strategy with Clarity using this Strategic Planning with Concentric Circles Presentation template. Designed to illustrate layered processes, decision-making frameworks, and business growth strategies, this concentric model helps communicate core ideas with structured, expanding details. Fully customizable and compatible with PowerPoint, Keynote, and Google Slides, this template is perfect for business leaders, strategists, and consultants aiming for clear and impactful presentations.