


Características


¿Tienes alguna pregunta?
Recomendar


4 diapositivas
Oceania Region Editable Map Slide Presentation
Highlight your insights across Australia and the Pacific with a clean, modern map layout designed for clarity and engagement. Ideal for visualizing market regions, travel data, or geographic comparisons, this slide combines style with precision. Fully compatible with PowerPoint, Keynote, and Google Slides for effortless customization and presentation.


6 diapositivas
Organizational Structure Framework Presentation
Unlock the potential of your organization with our Organizational Structure Framework template. This versatile tool is designed to help you present and analyze various business structures, from chain-of-command to functional divisions. Ensure clear, concise communication of strategies across your organization. Perfect for use in PowerPoint, Keynote, and Google Slides, this template supports a professional presentation of your organizational strategy, ensuring alignment and clarity in your business processes.


21 diapositivas
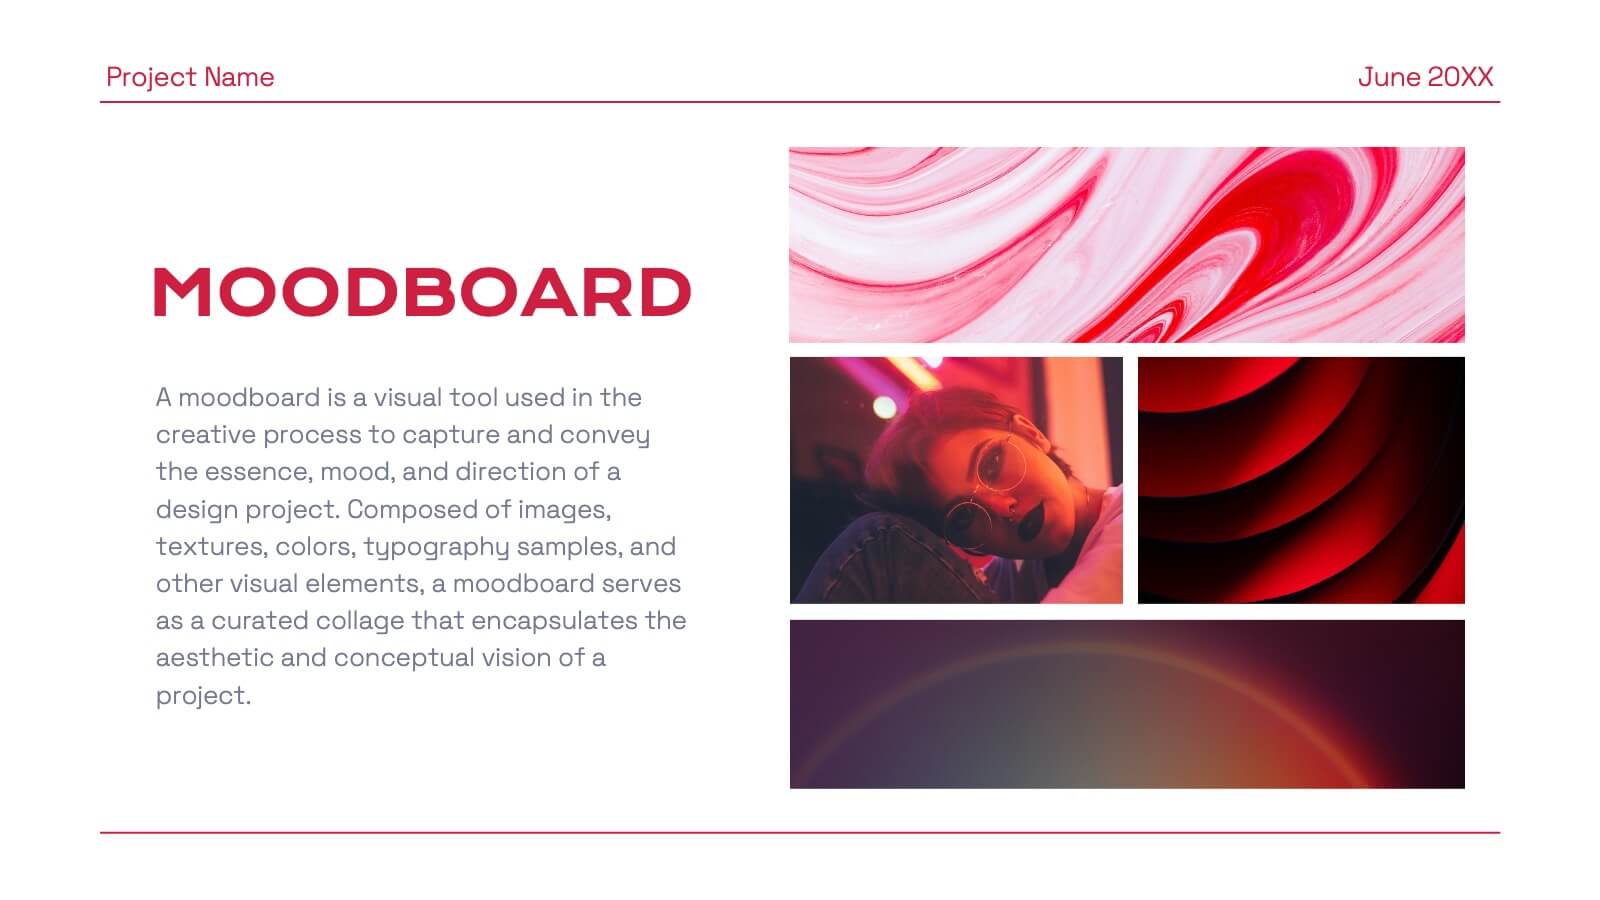
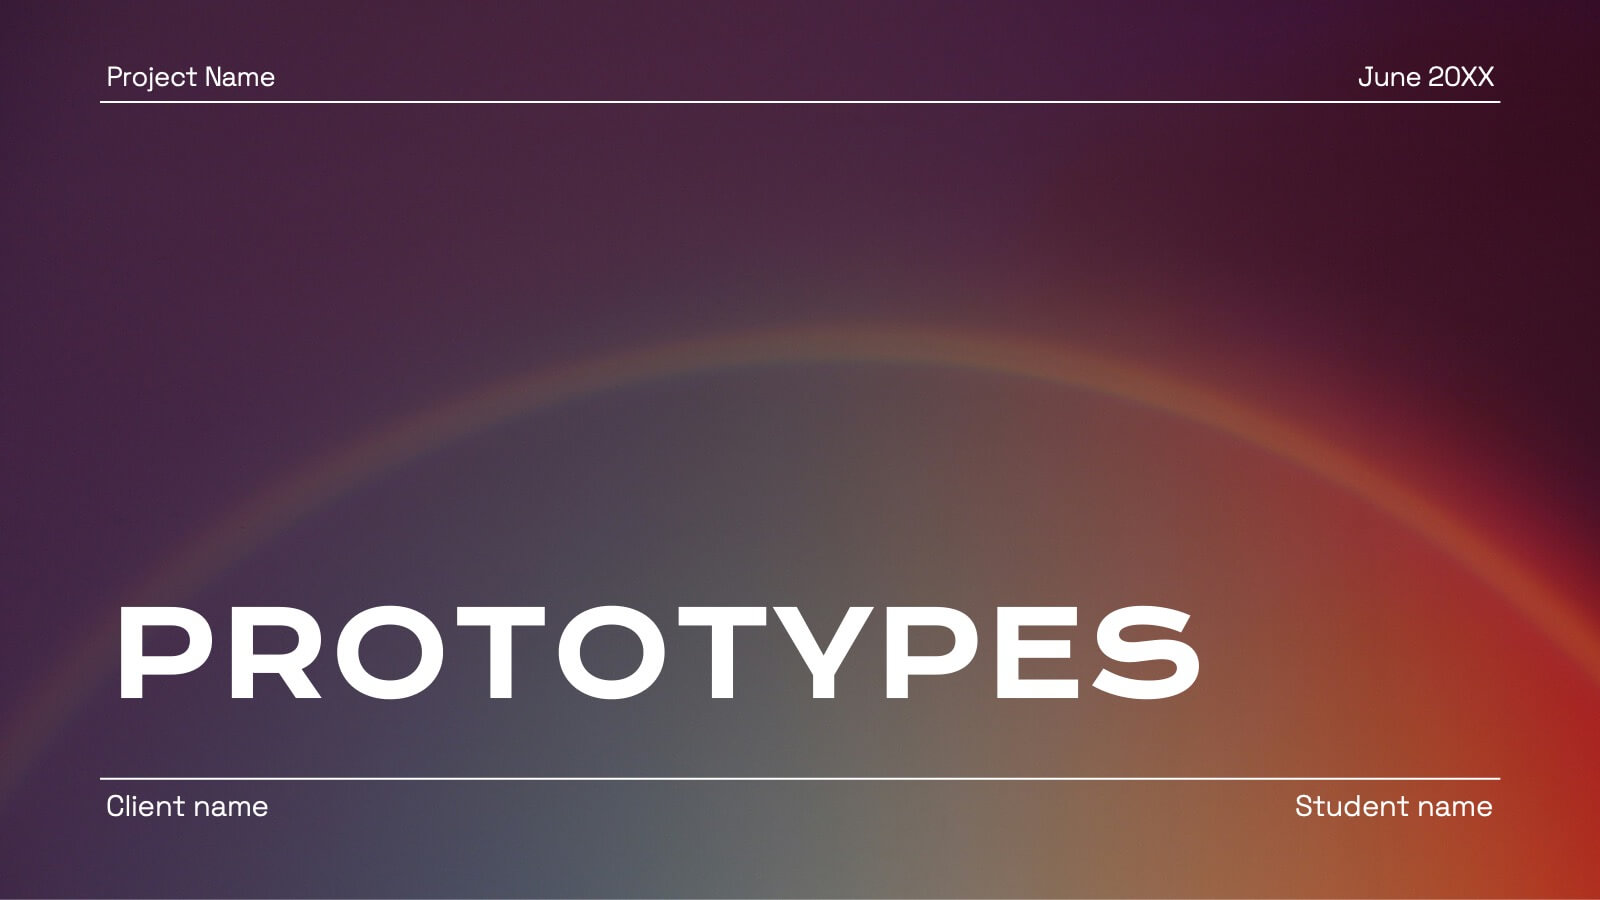
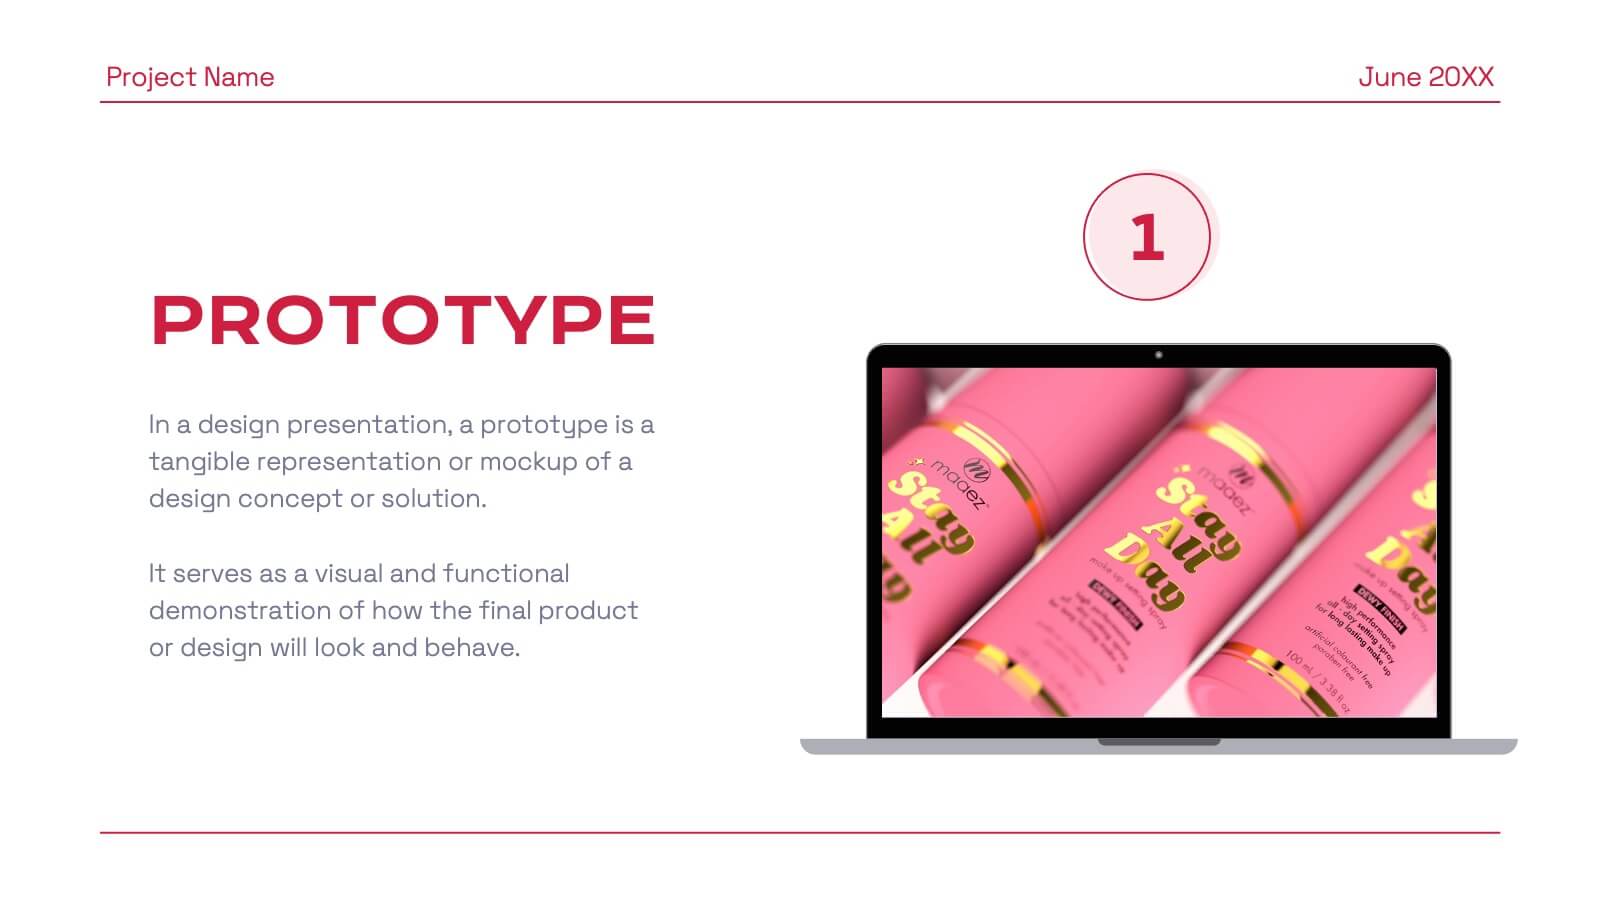
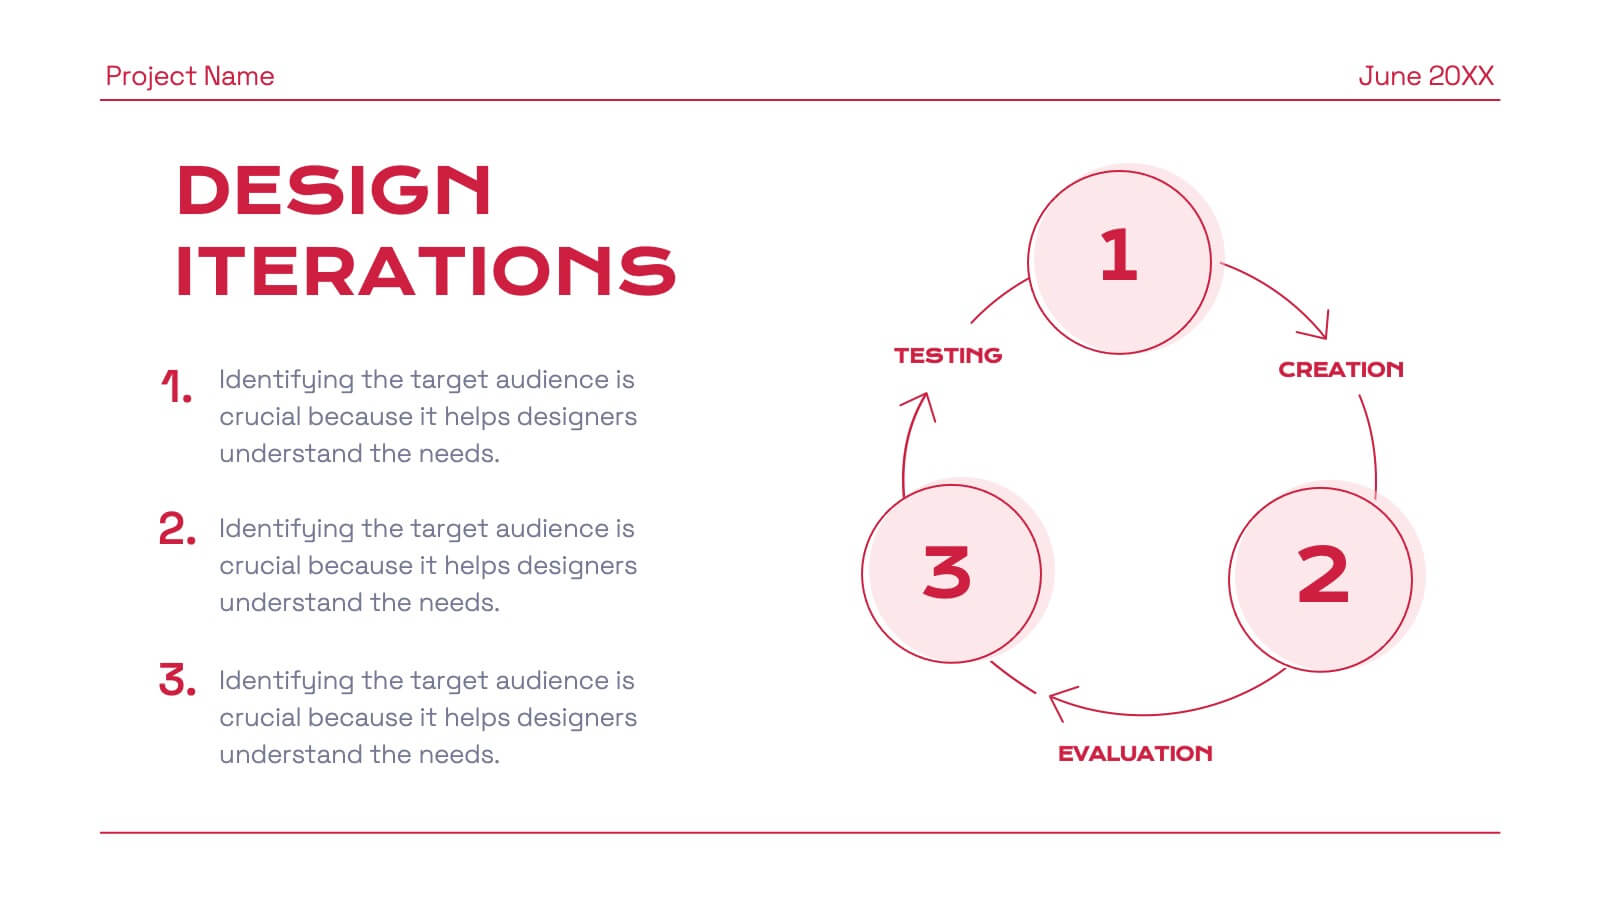
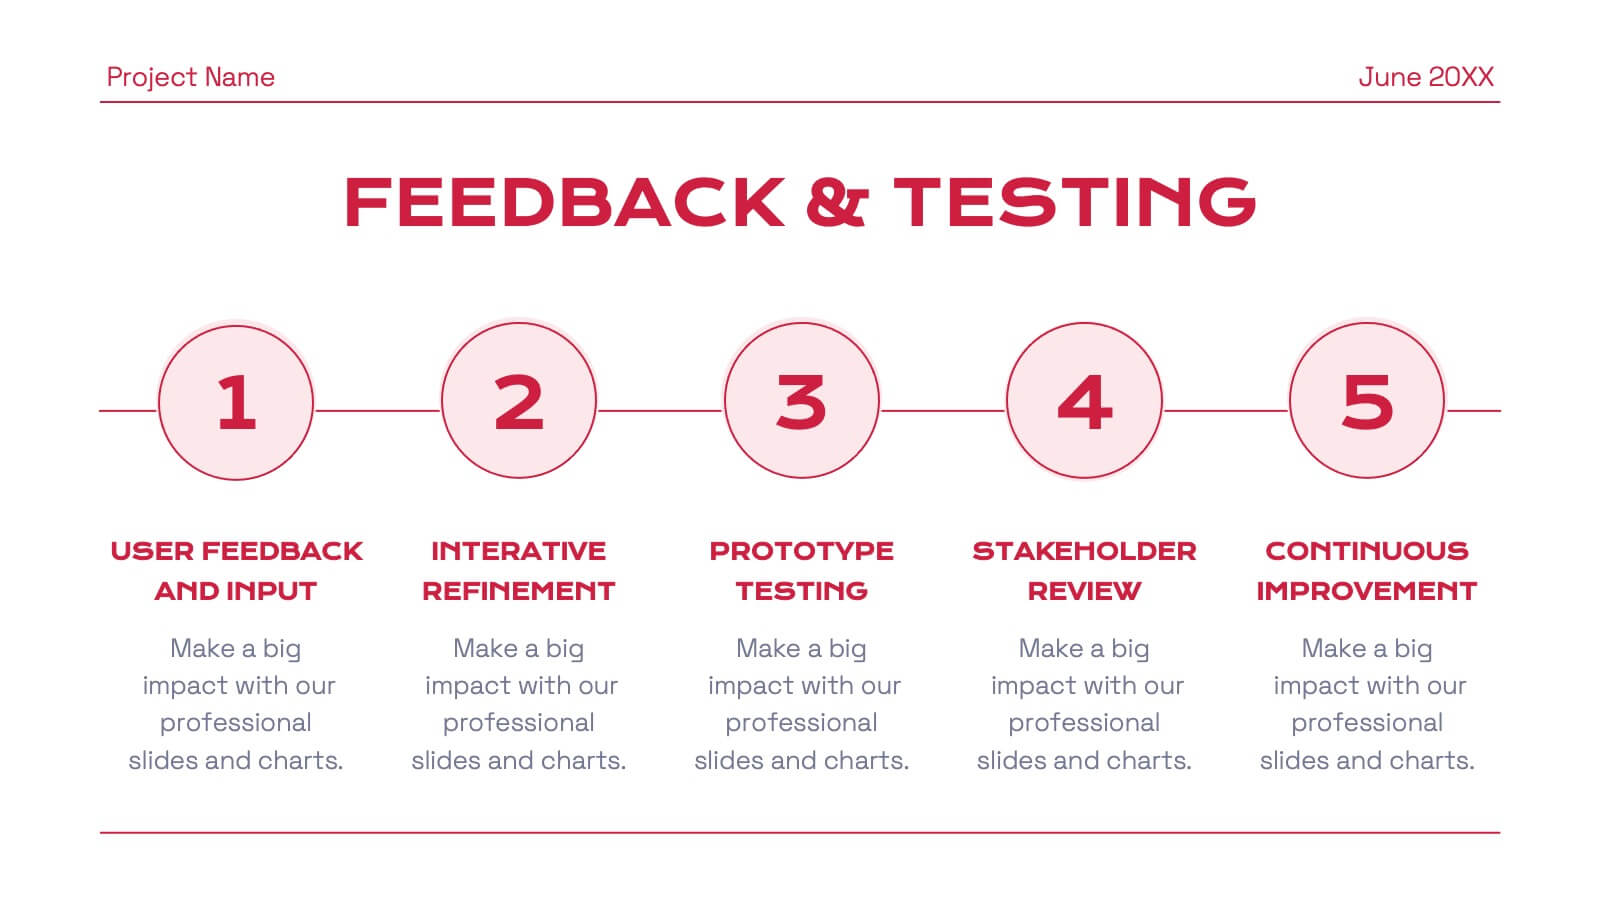
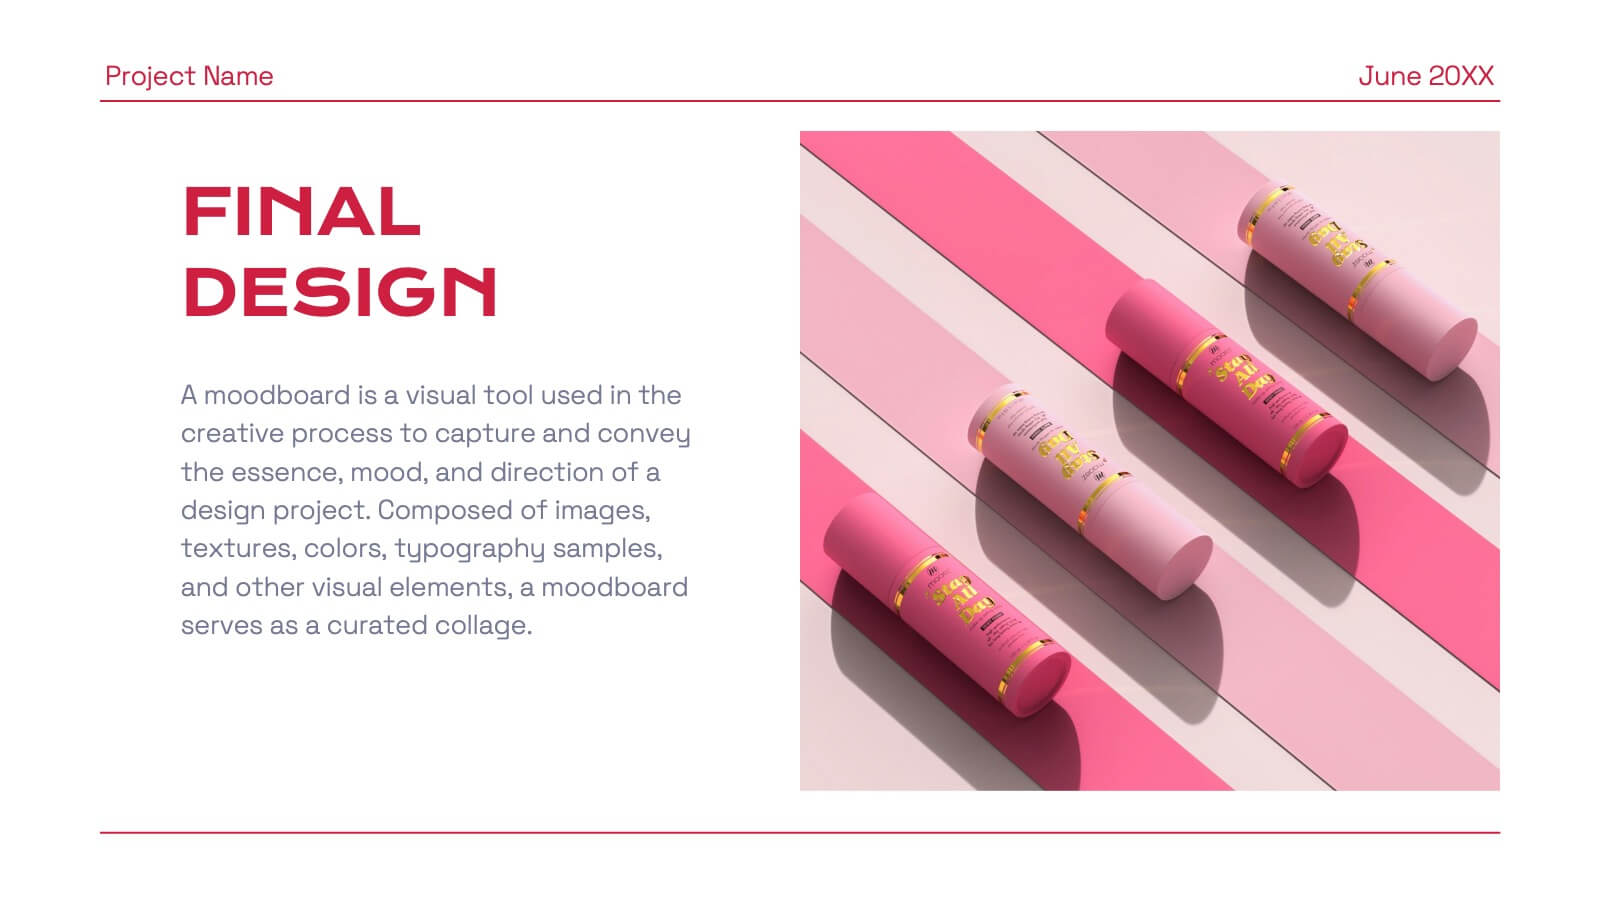
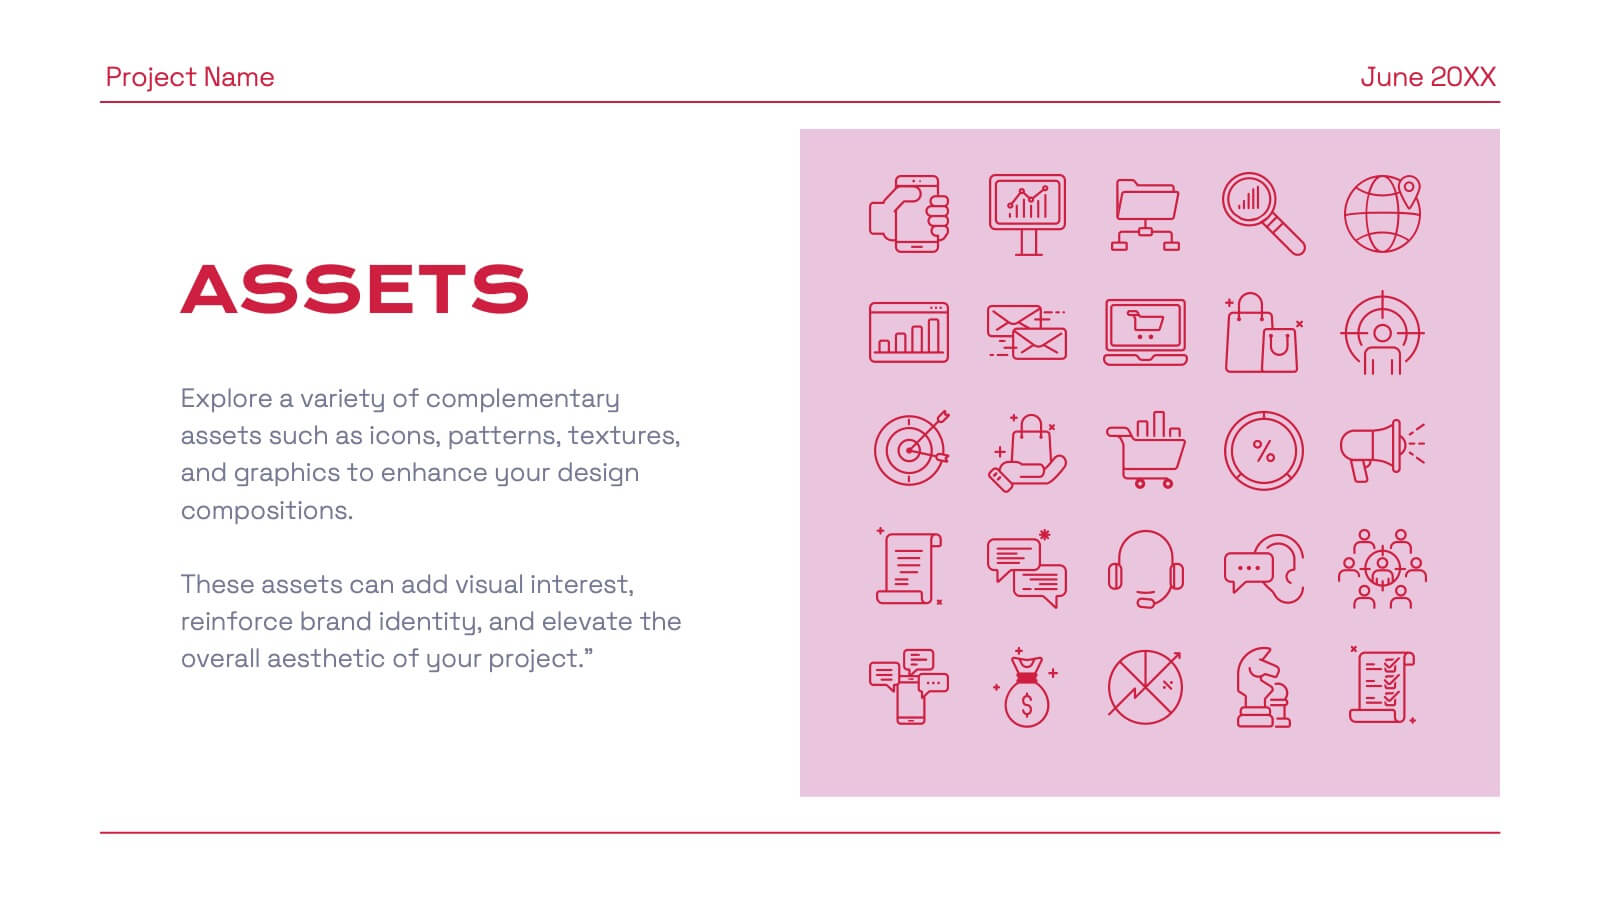
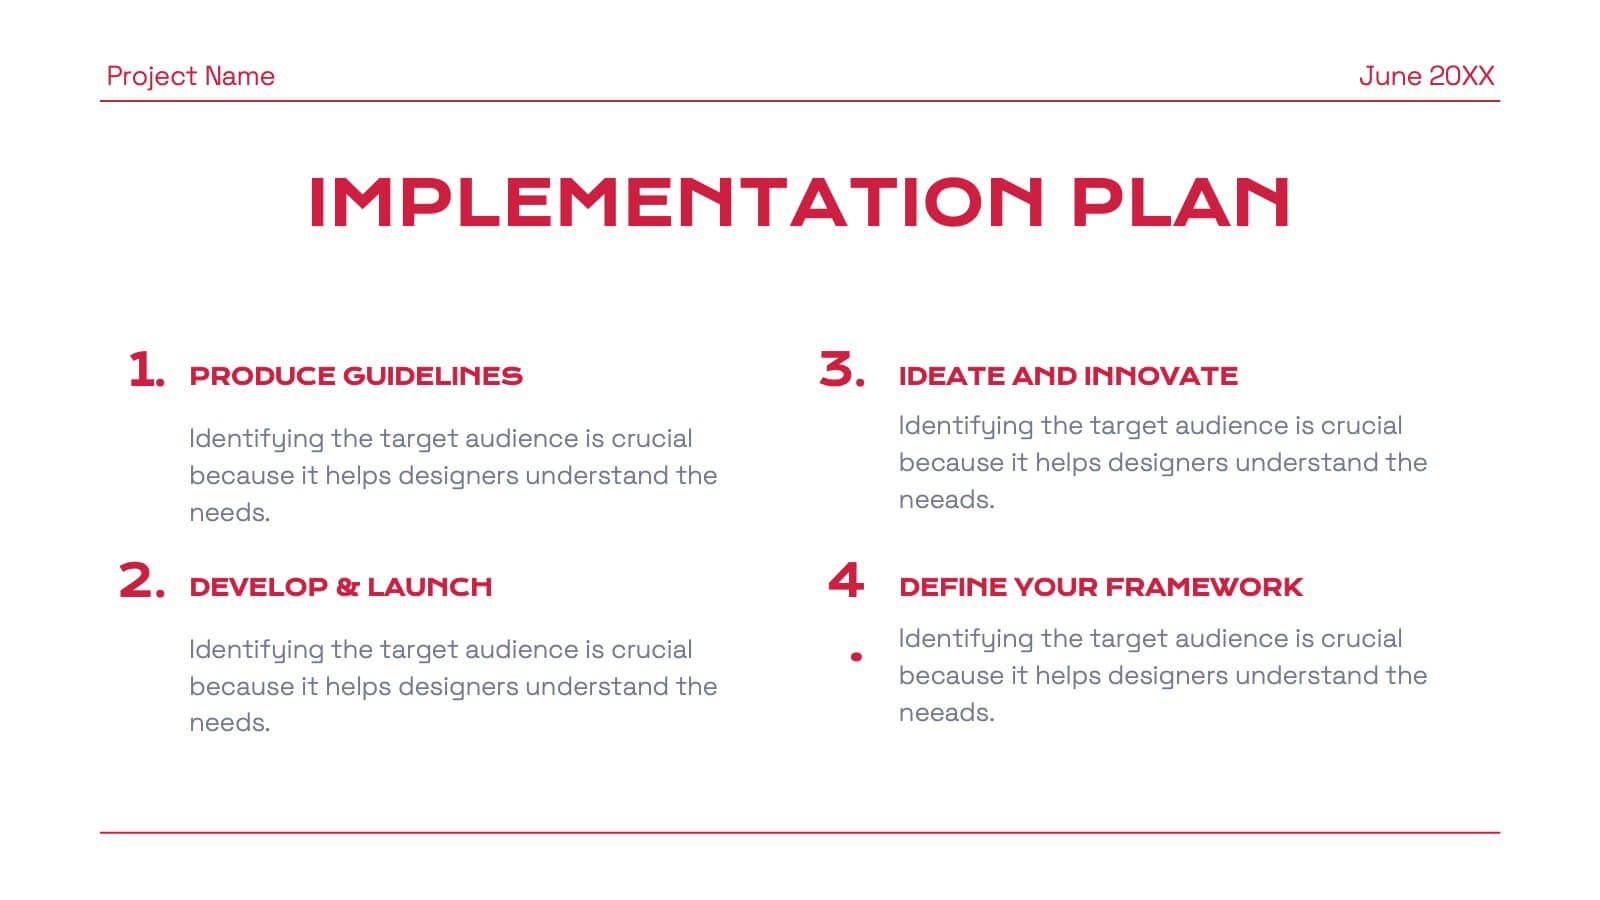
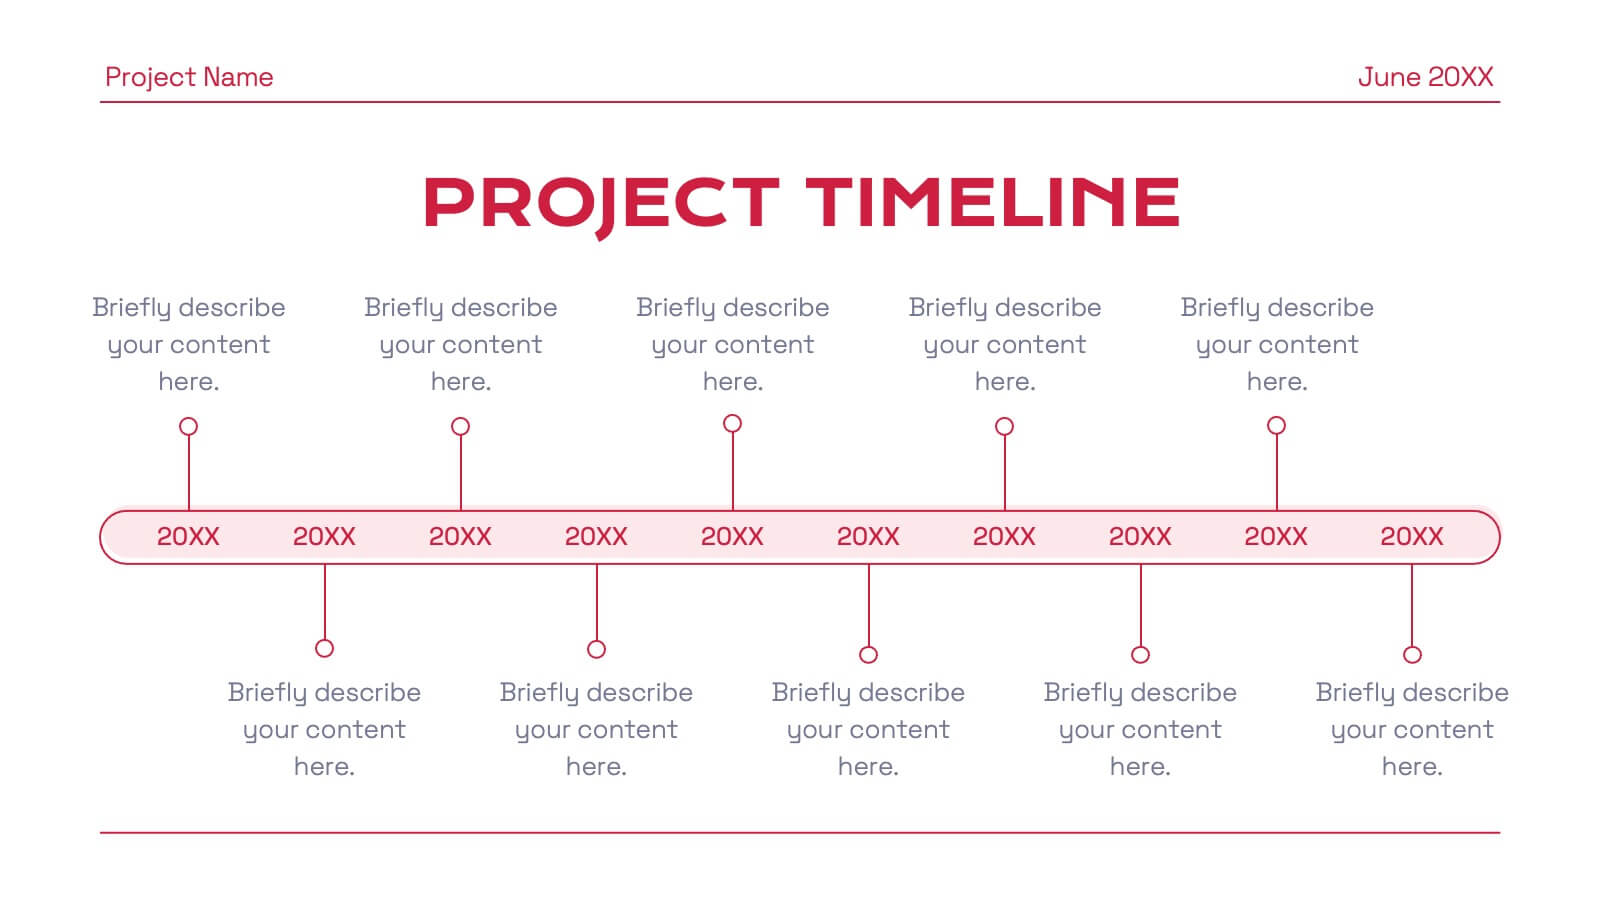
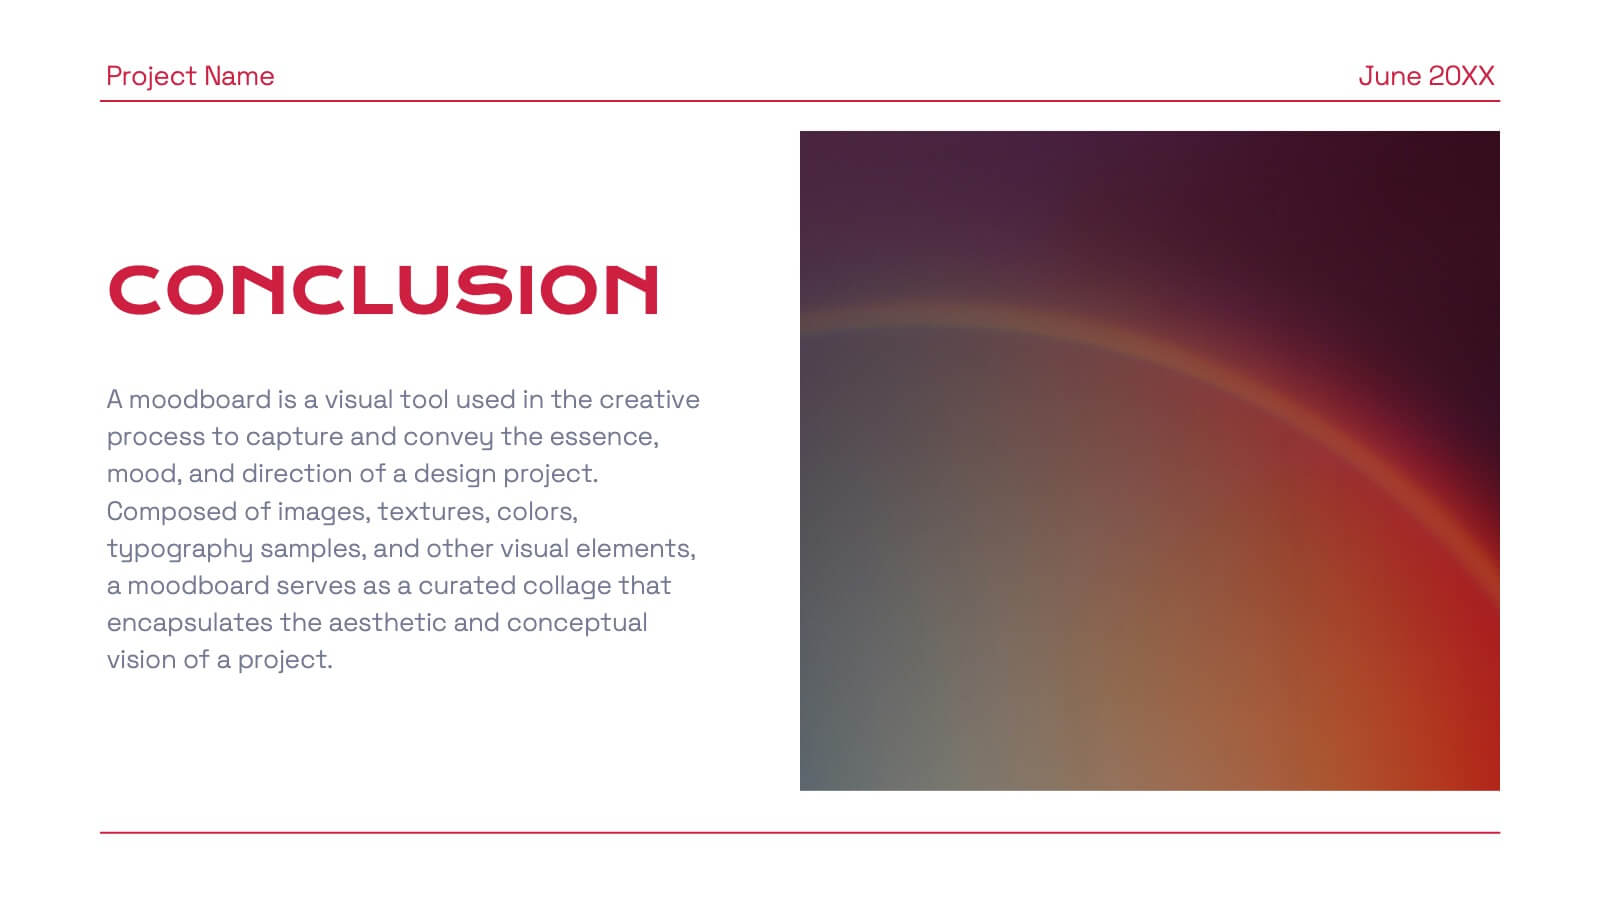
Phoenix Design Portfolio Presentation
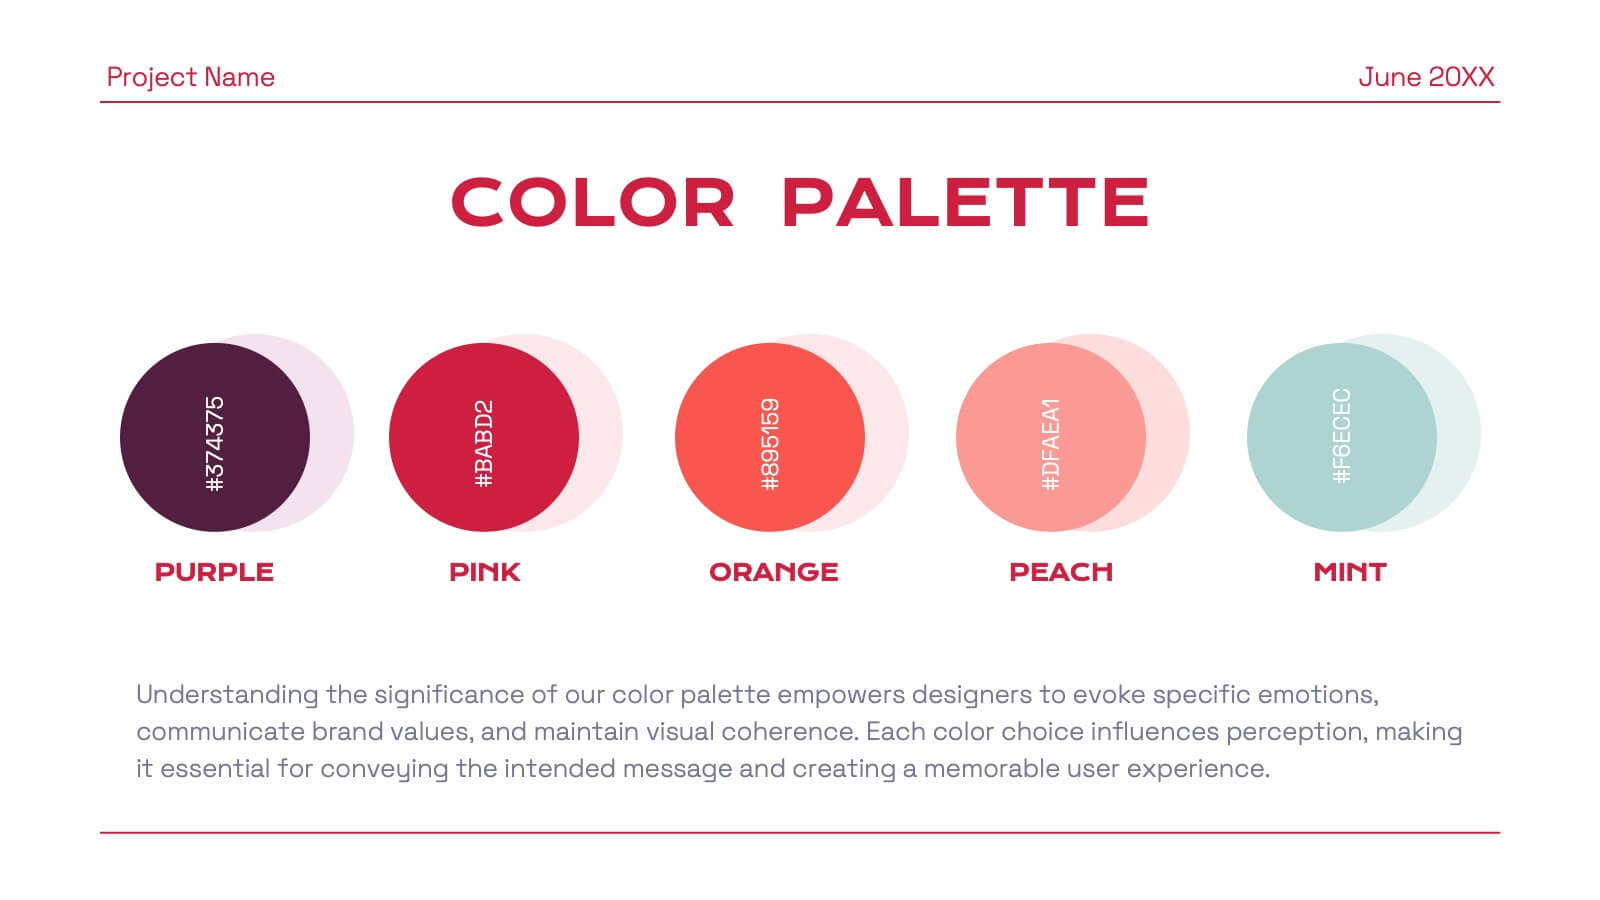
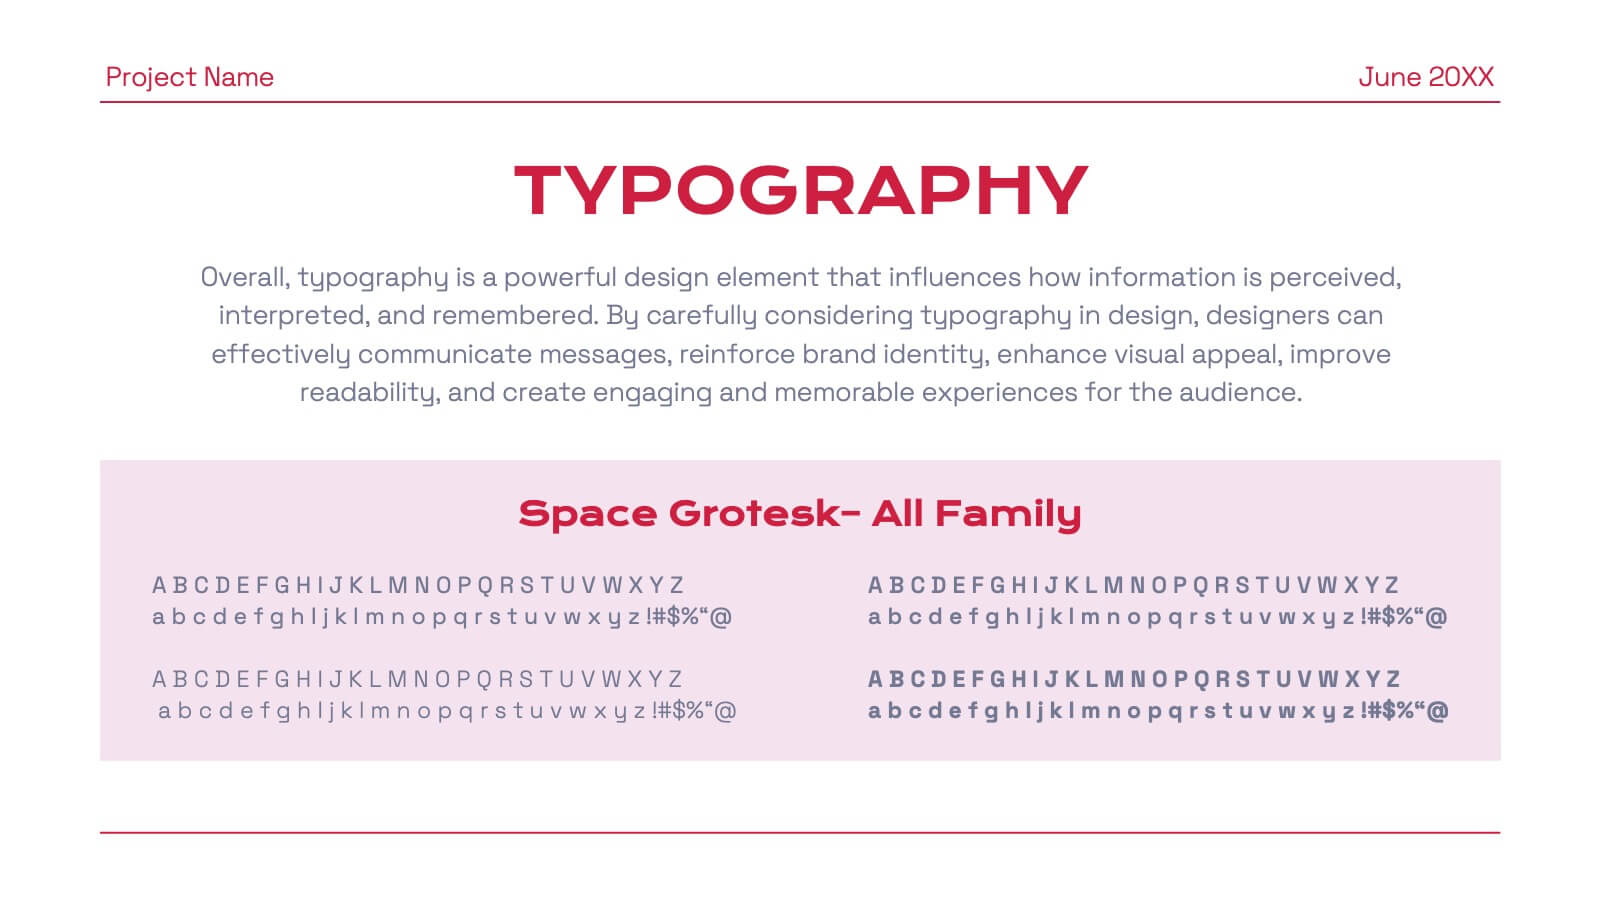
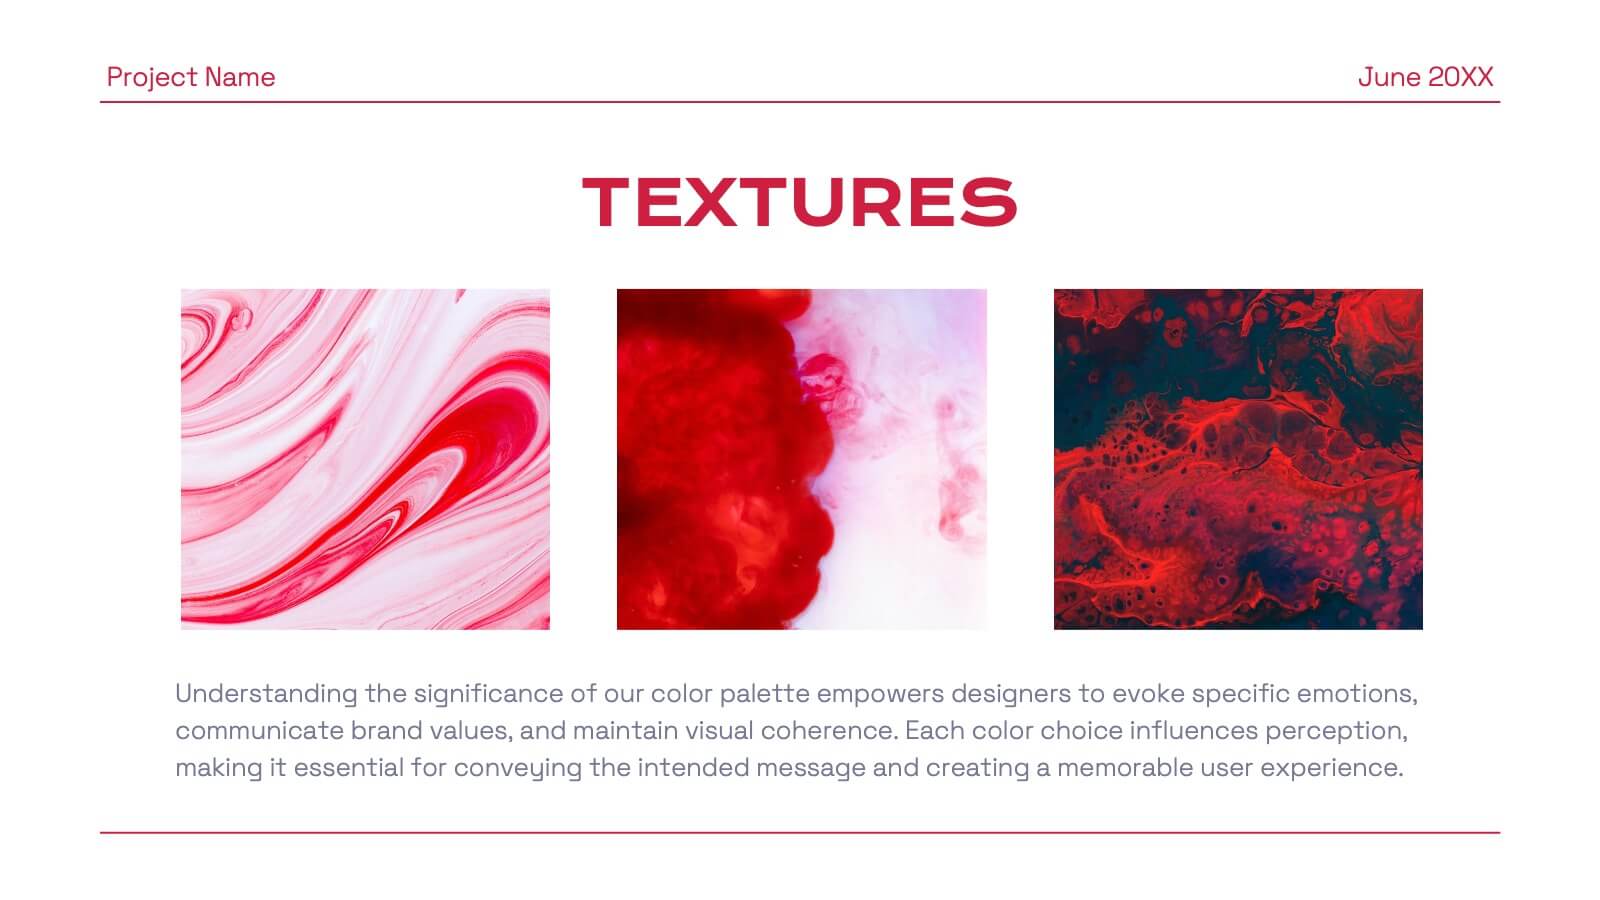
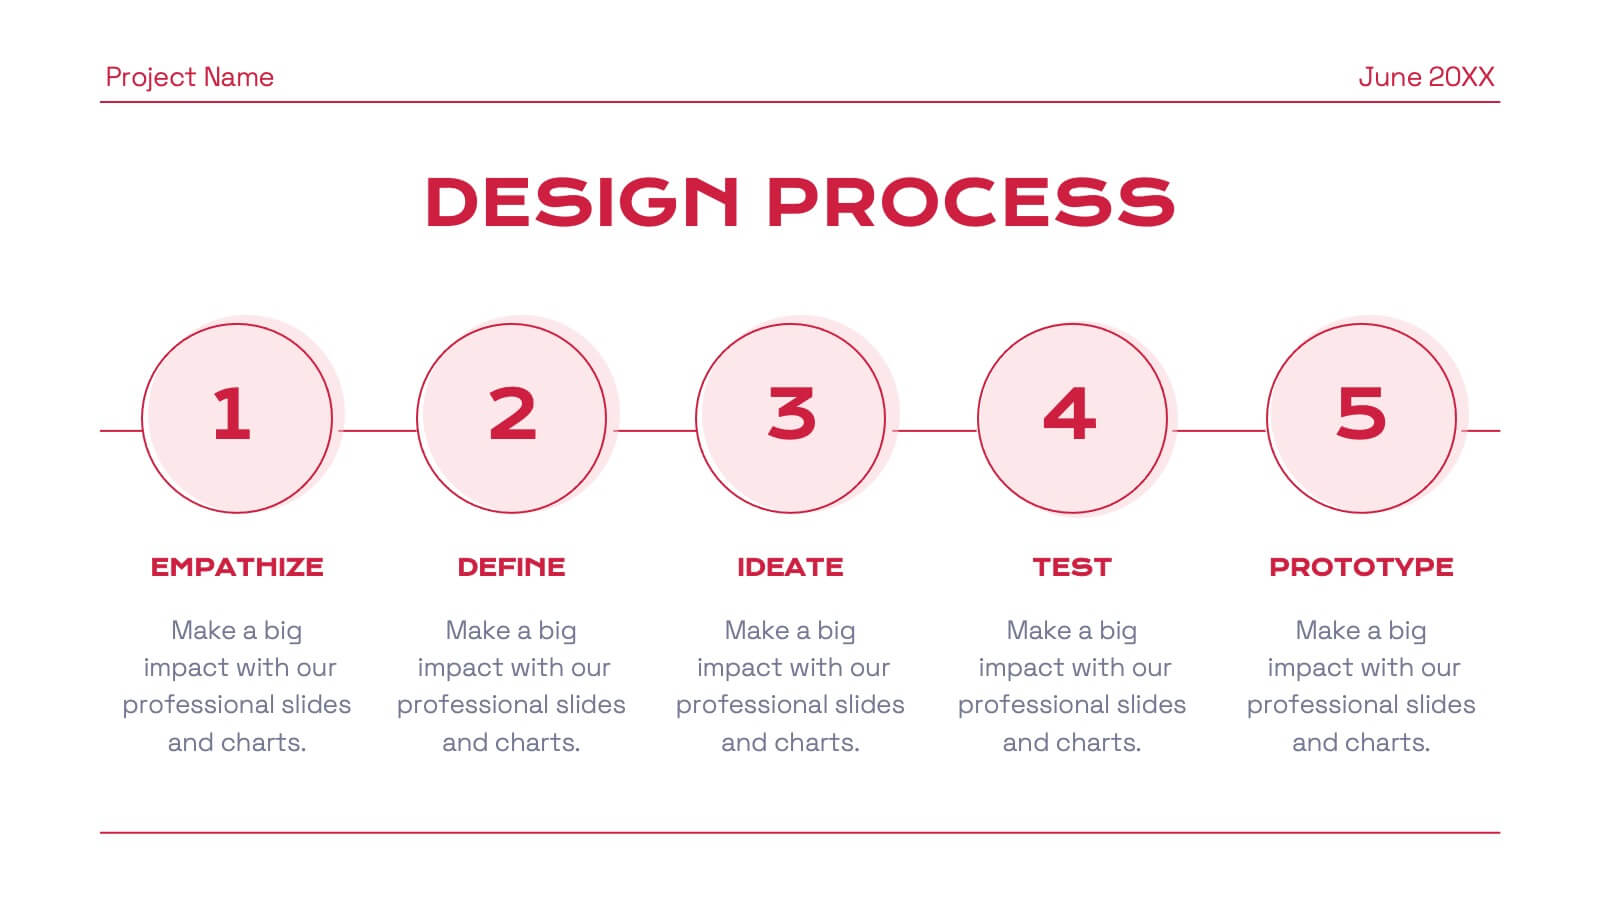
Elevate your design presentations with this stylish, contemporary template. Perfect for showcasing design portfolios, concept development, and project timelines, it features a modern layout with vibrant colors. Highlight key elements like color palettes, textures, and design processes to captivate your audience. Compatible with PowerPoint, Keynote, and Google Slides, it ensures seamless presentations on any platform.


4 diapositivas
Business Operations Office Theme Presentation
Make your workflow feel effortless with this sleek, illustrated office layout designed to simplify complex business operations. Ideal for presenting processes, responsibilities, or resource planning, the clean visuals and structured format help communicate your message clearly. Fully editable and compatible with PowerPoint, Keynote, and Google Slides for seamless customization.

22 diapositivas
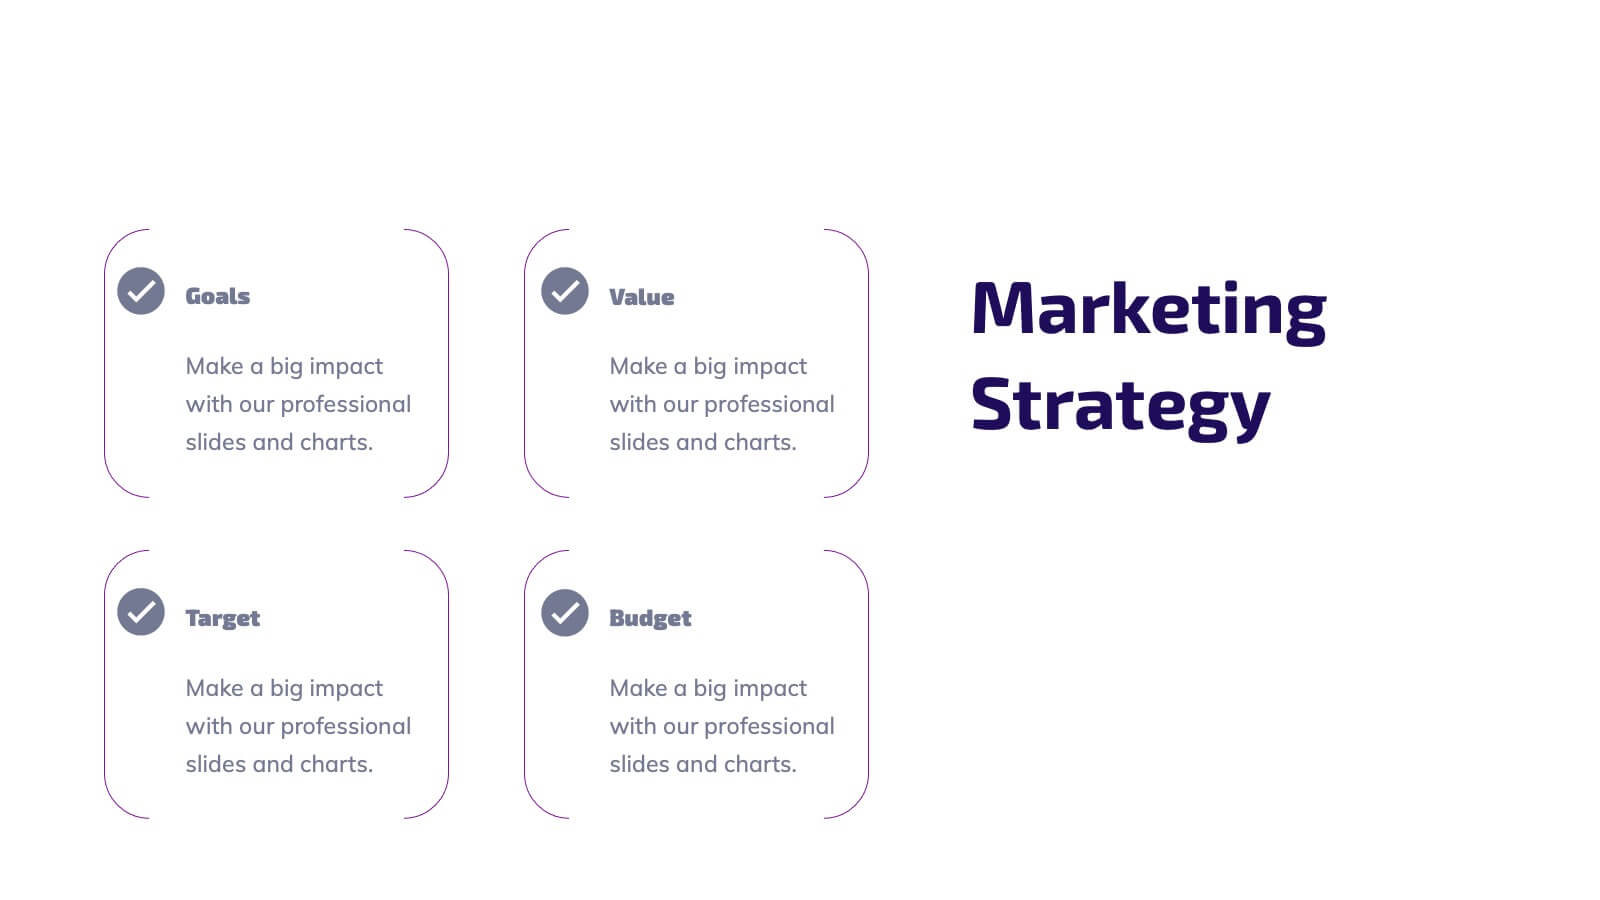
Eclipse Graphic Design Project Plan Presentation
Develop a winning marketing strategy with this dynamic template. Dive into current trends, consumer behavior, and innovative techniques. Perfect for social media, influencer marketing, and data-driven campaigns. Fully compatible with PowerPoint, Keynote, and Google Slides.


7 diapositivas
Brain Balance Infographic
Introducing our brain infographic template, it's a colorful, engaging and professional brain diagram. This template is designed for a wide range of applications such as education, blogging, social media, marketing, presentations and other types of projects. This infographic is very easy to edit and customize. Fully customizable and compatible with Powerpoint, Keynote, and Google Slides, you can change text, colors and shapes with just one click. This infographic is perfect for any company that wants to show off their colorful personality. Create an infographic that will get people excited about your brand filled with facts and important information!


23 diapositivas
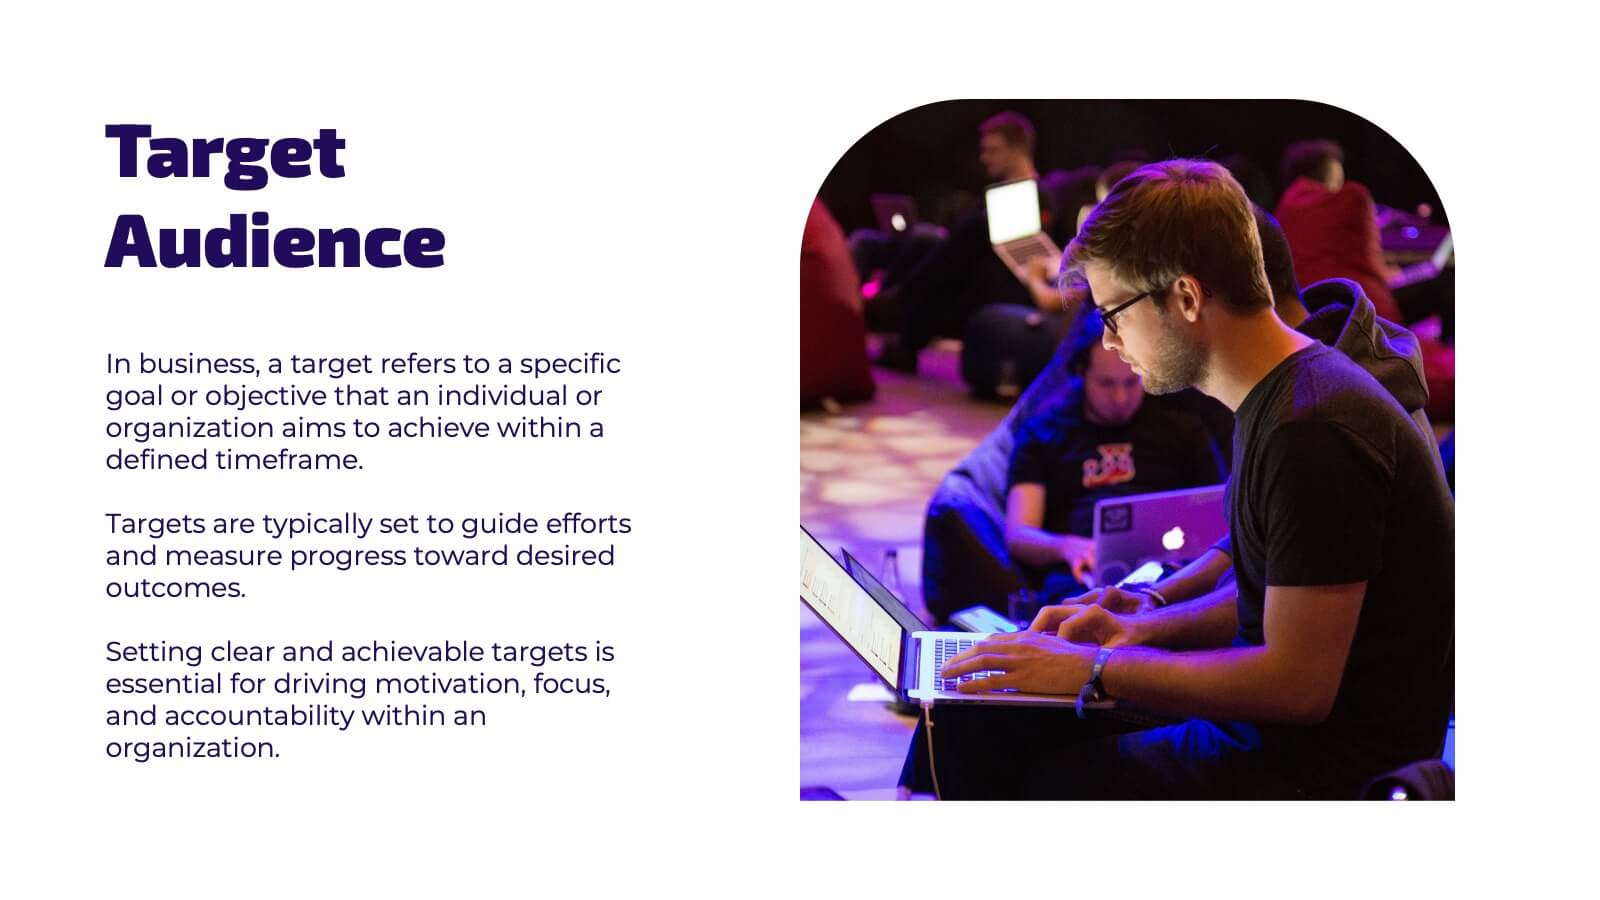
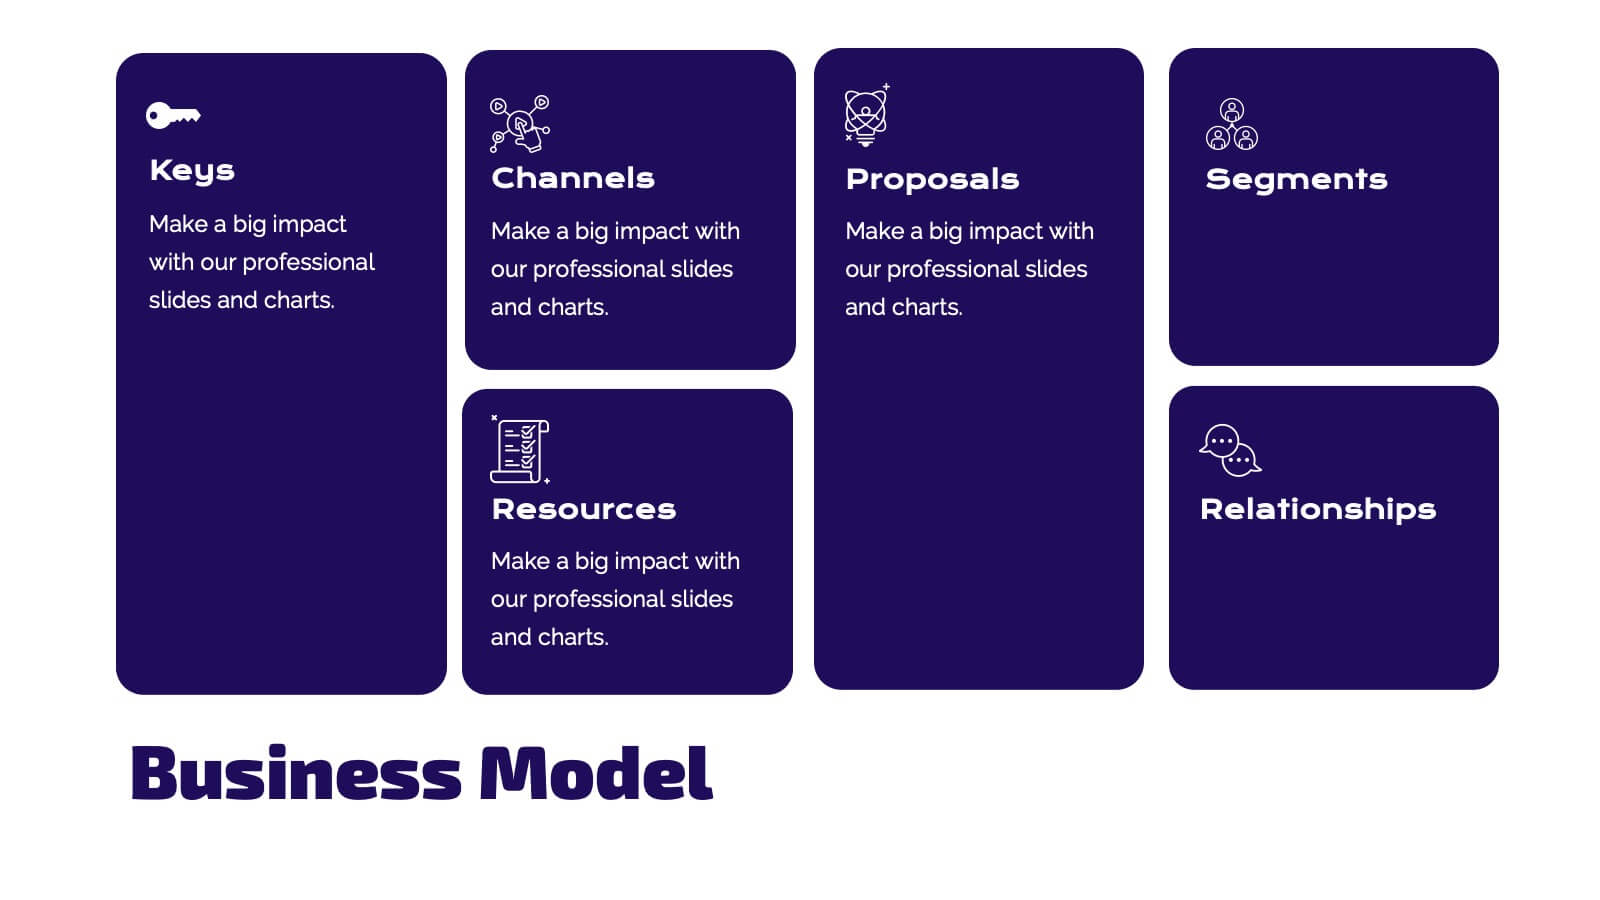
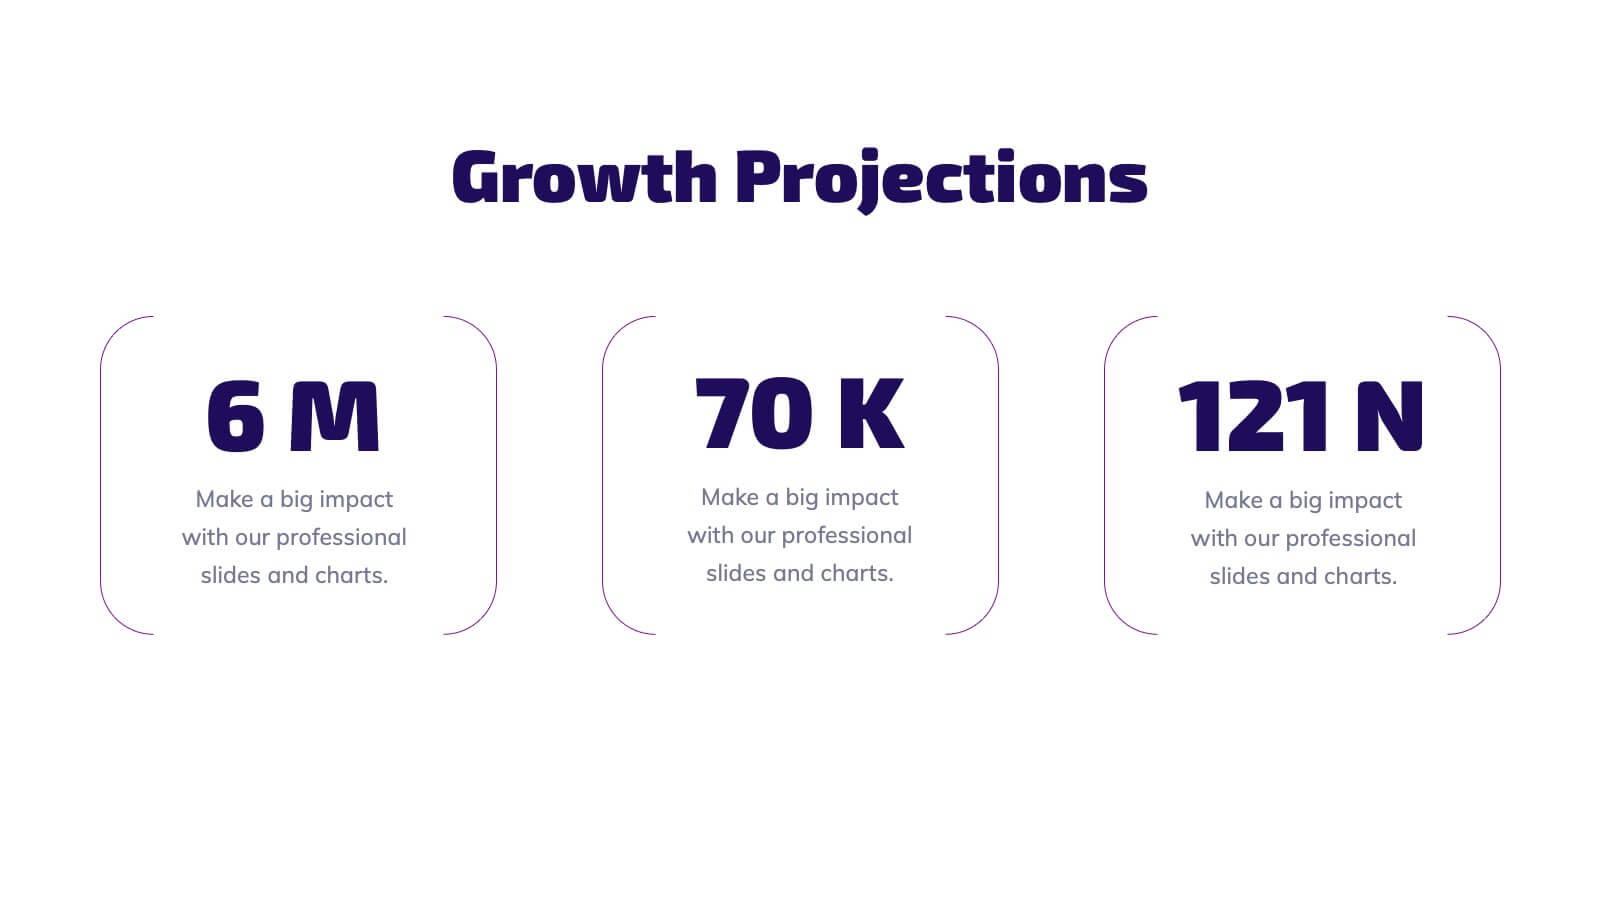
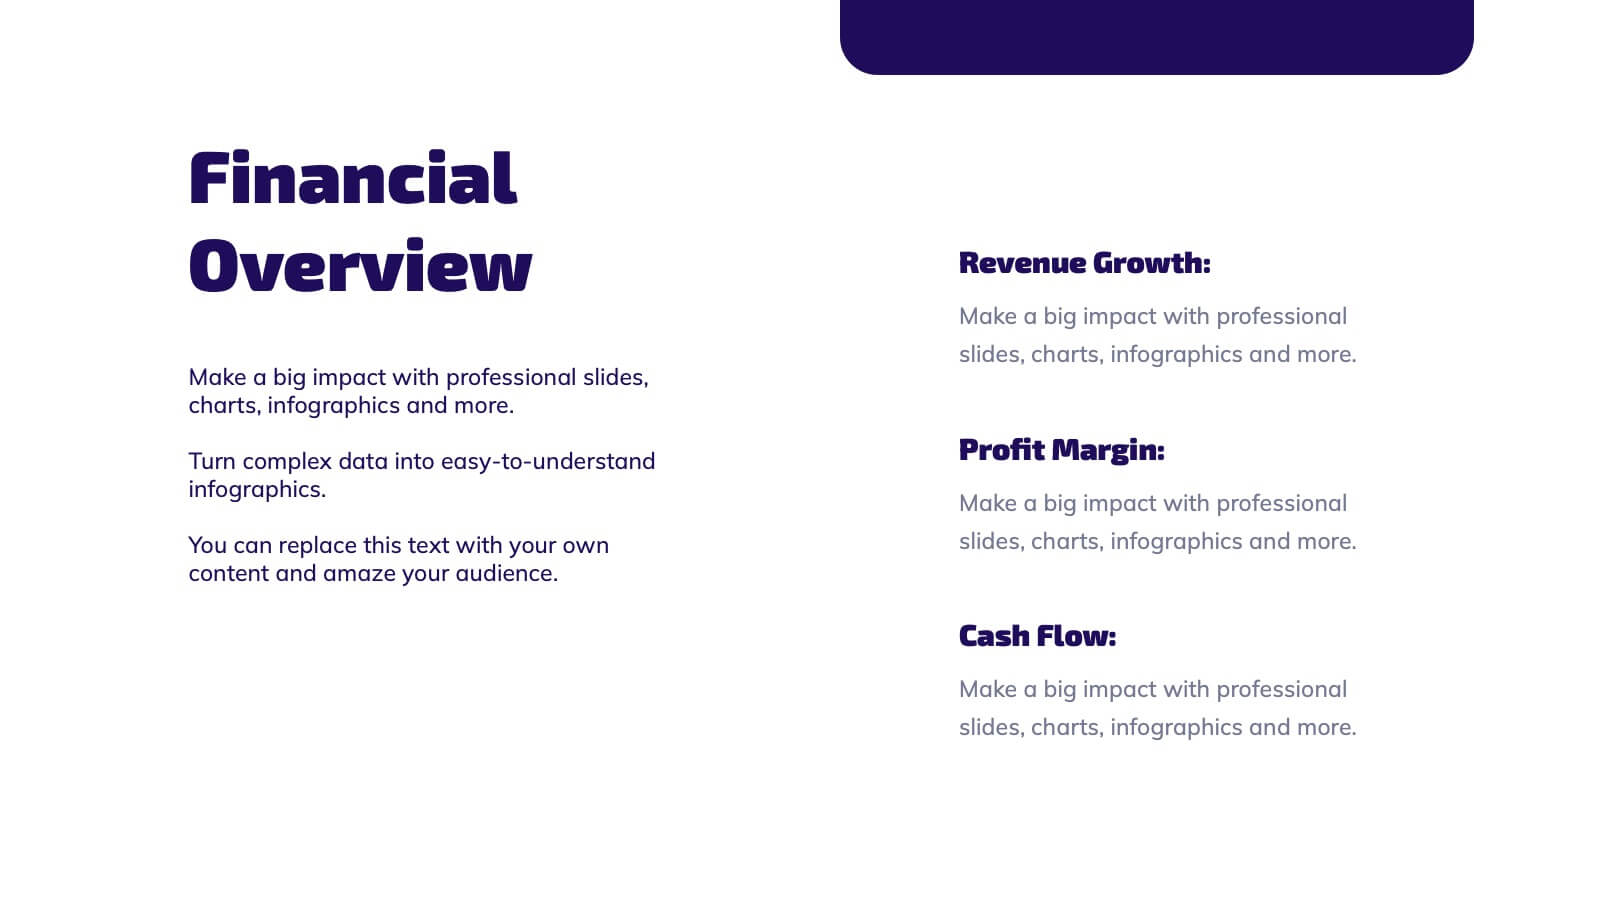
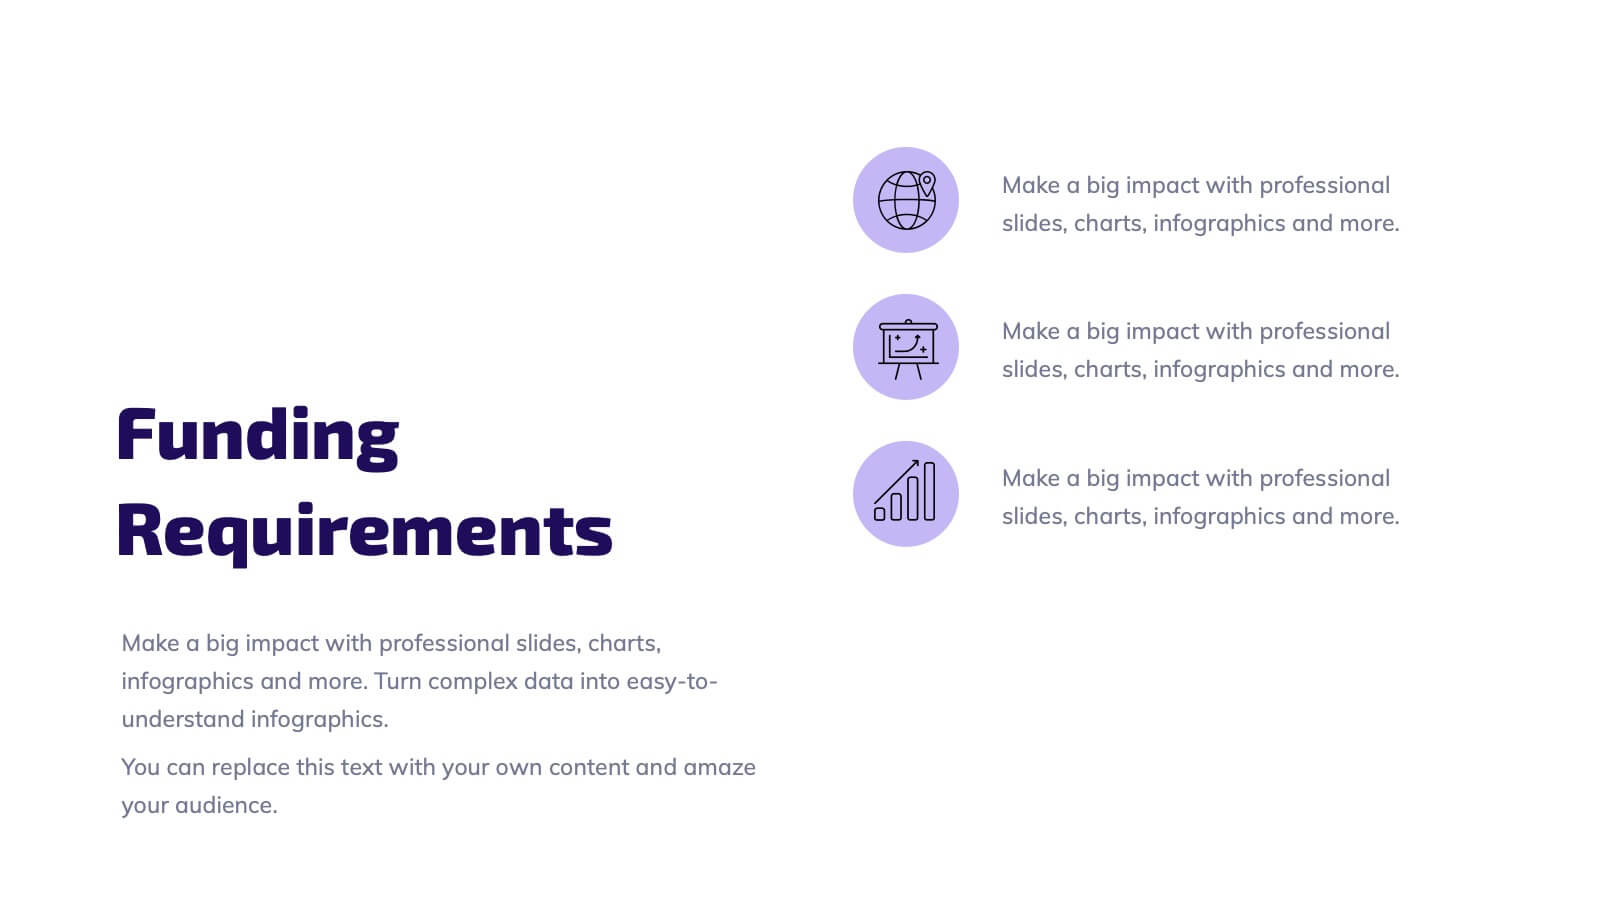
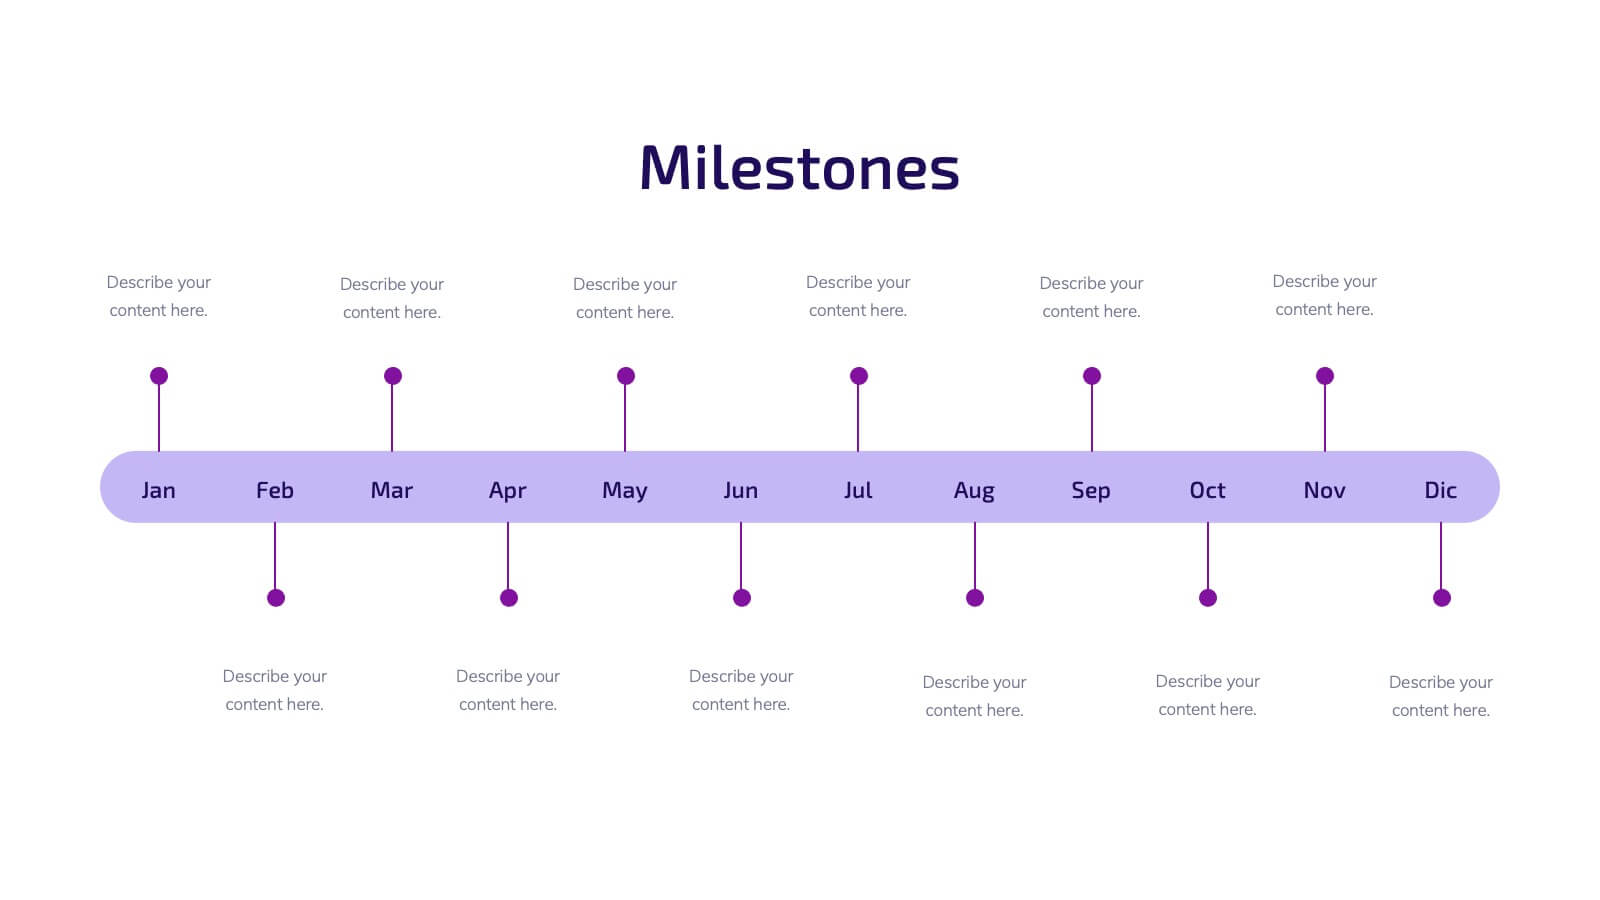
Illume Startup Pitch Deck Presentation
Light up your startup journey with this captivating presentation template! Perfect for pitching your business idea, it guides you through key elements like market analysis, financial projections, and growth strategies. With a modern design that grabs attention, this template will help you shine in front of investors. Compatible with PowerPoint, Keynote, and Google Slides.


21 diapositivas
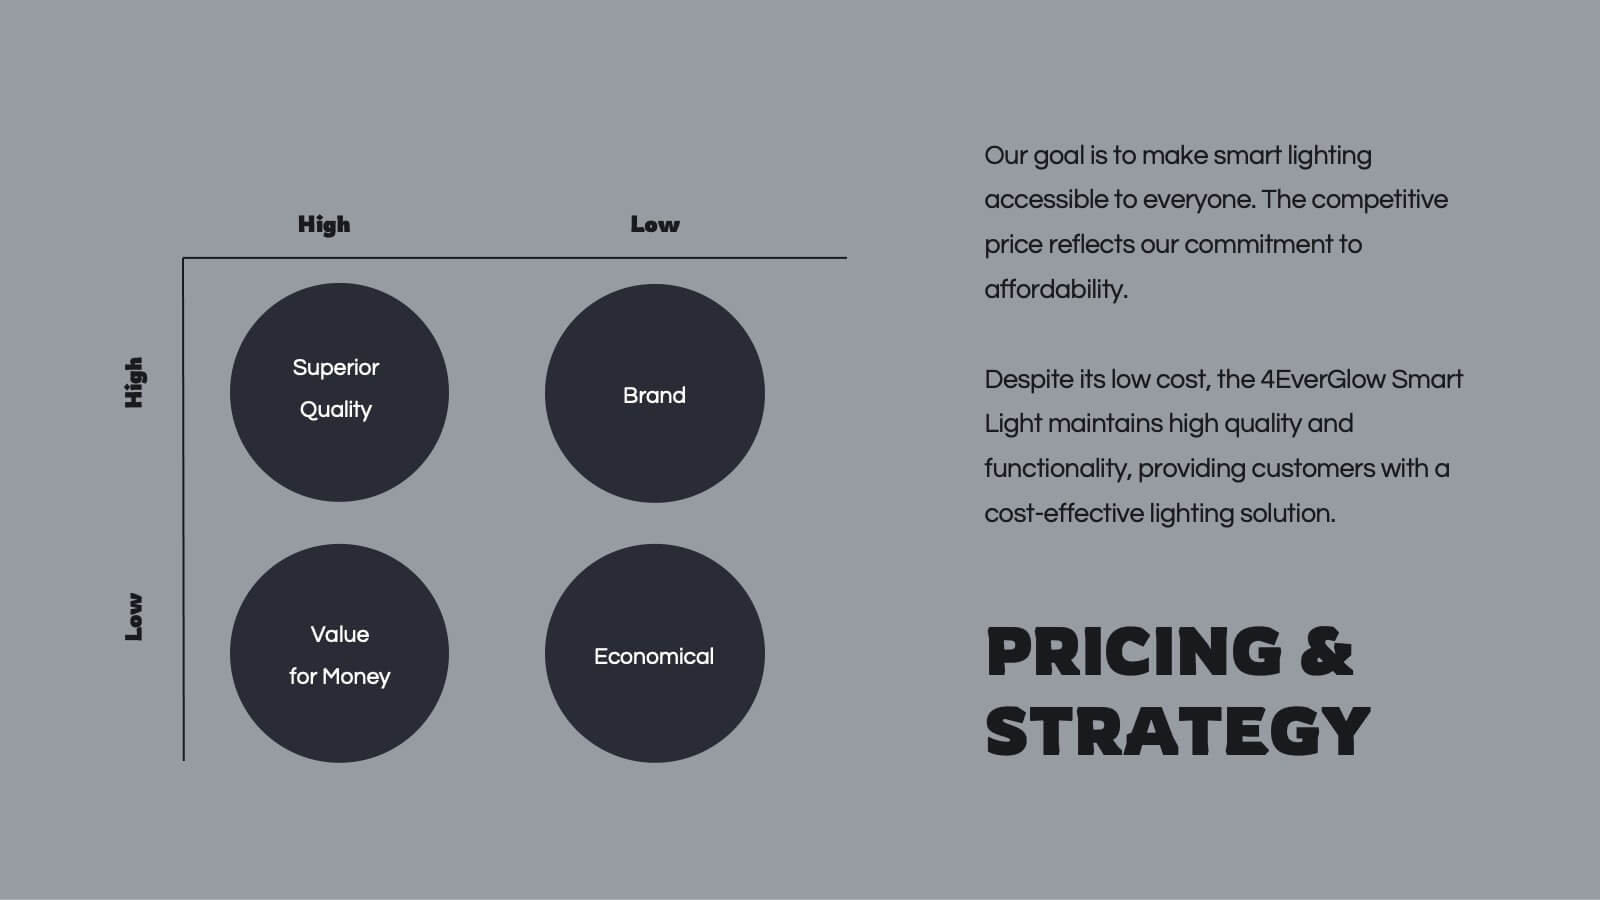
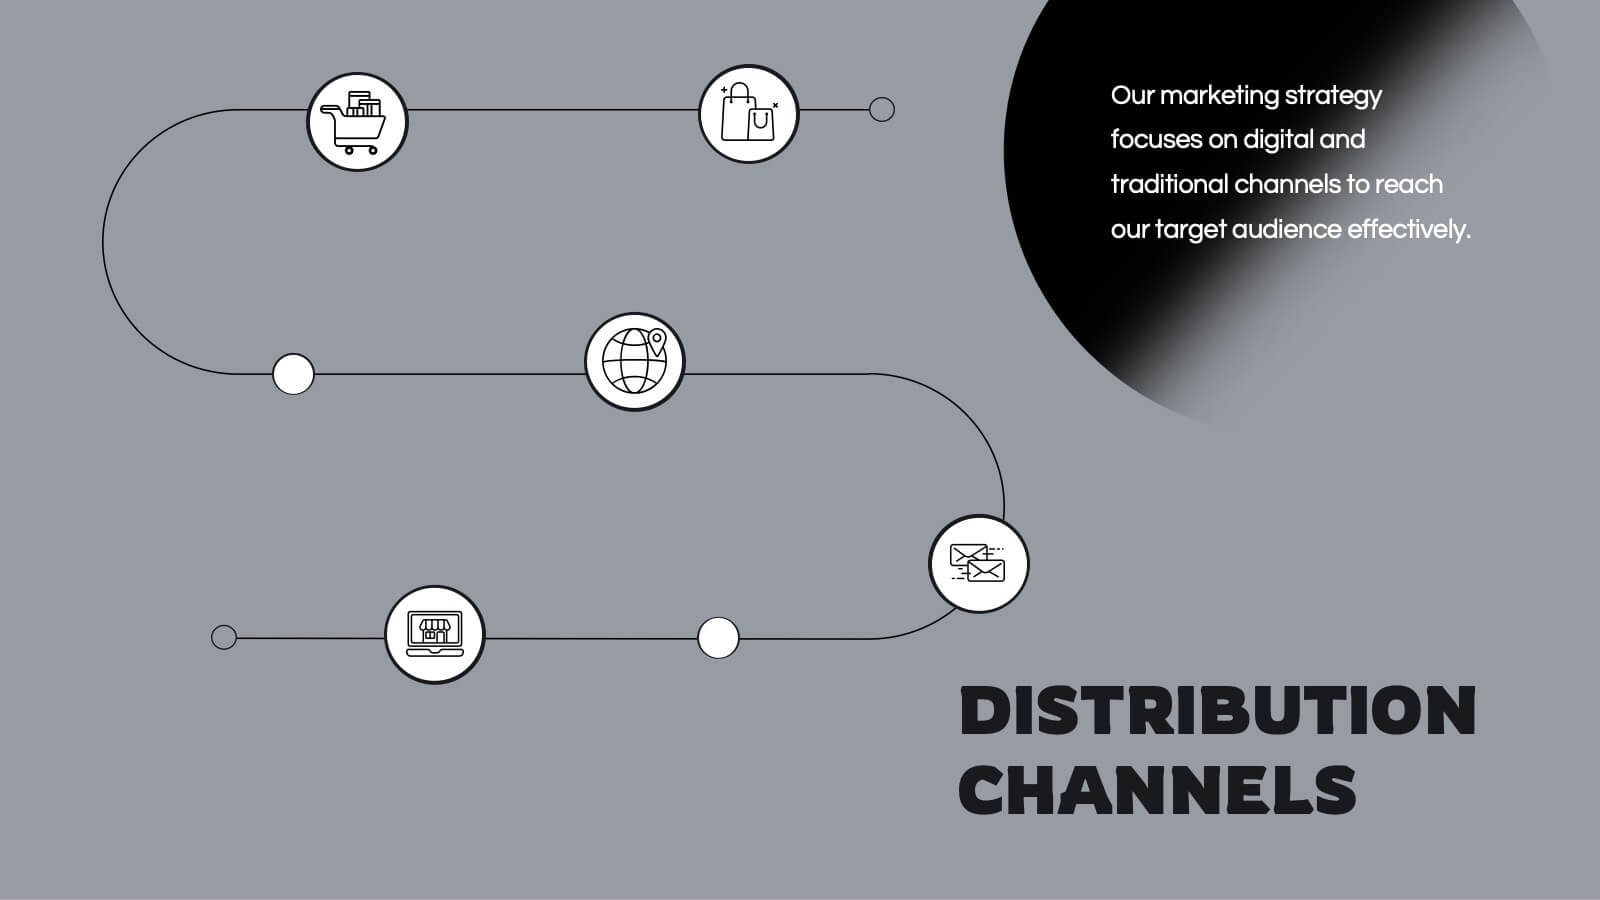
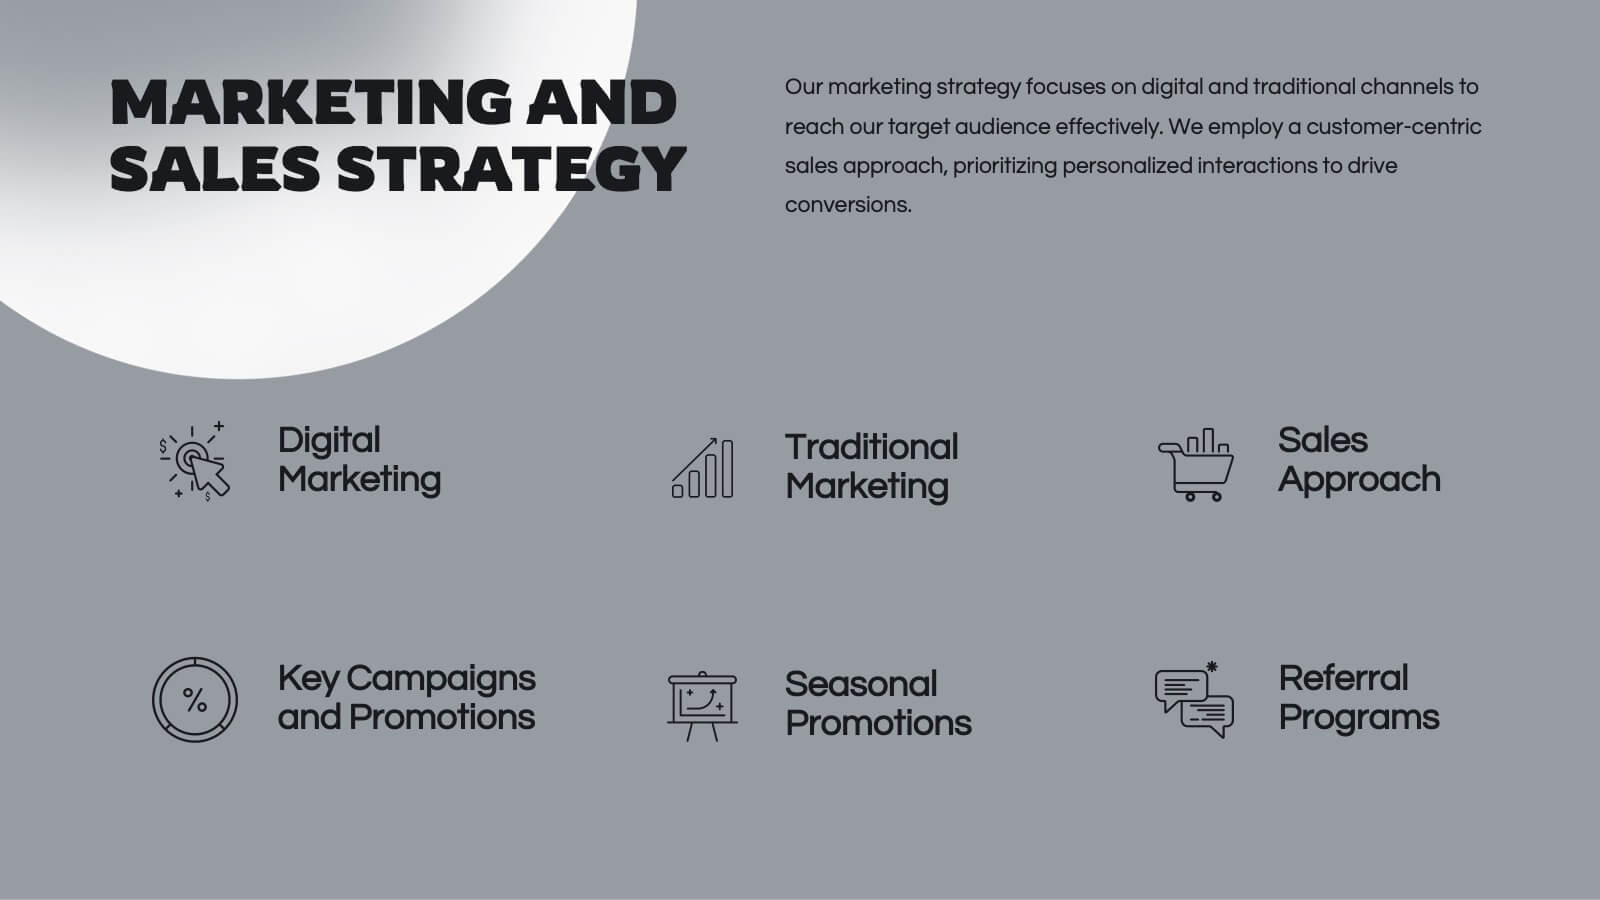
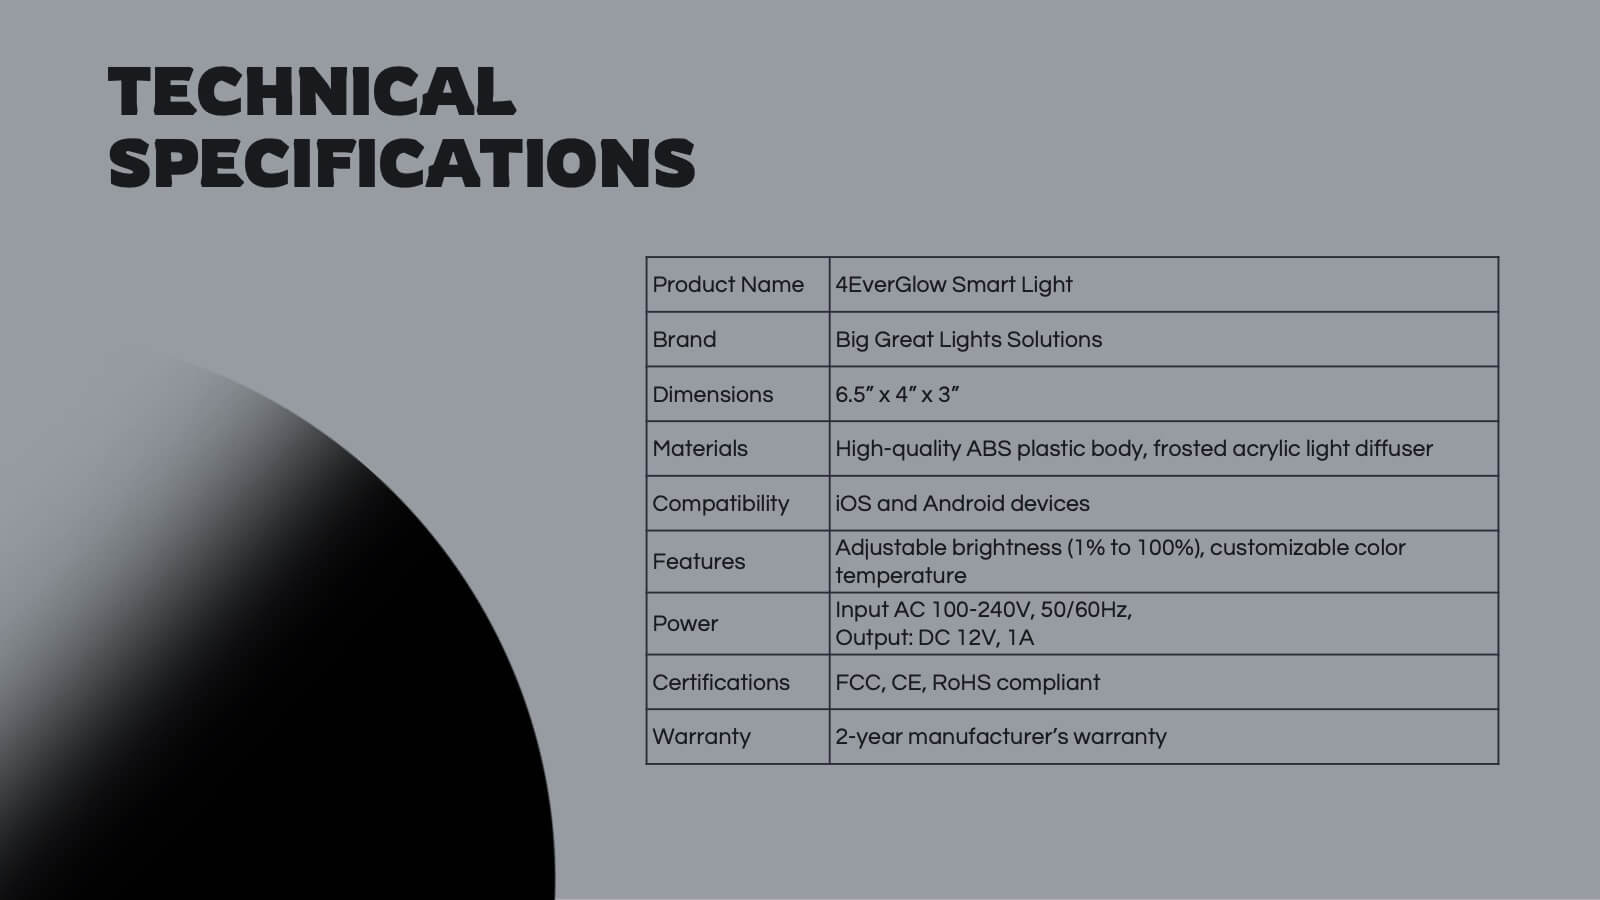
Spinel Product Strategy Report Presentation
Take your product strategy to the next level with this polished, spinel-inspired presentation! Designed to effectively communicate your product's goals, market analysis, and strategy roadmap, this template is both visually striking and easy to navigate. Its sharp design ensures a professional touch. Compatible with PowerPoint, Keynote, and Google Slides.


5 diapositivas
New Hire Onboarding Roadmap Presentation
Guide new employees with clarity using the New Hire Onboarding Roadmap Presentation. This visual roadmap features a timeline layout with icons resembling briefcases, each representing a stage in the onboarding process. Ideal for HR professionals or team leads, it helps outline milestones such as orientation, training, and integration steps. Fully editable in Canva, PowerPoint, Google Slides, and Keynote.


6 diapositivas
Stock Market Investment and Analysis Presentation
Showcase your market insights with this dynamic zigzag arrow diagram—perfect for highlighting bullish vs. bearish trends, financial analysis, and investment milestones. The slide features a split-path layout with icons and editable text areas to clearly compare strategies or illustrate turning points. Fully customizable in PowerPoint, Keynote, and Google Slides.


7 diapositivas
Simple Schedule Infographic
Effortlessly structure your time with our simple schedule infographic. Rendered in a clean white canvas, enhanced with dependable blue tones and anchored with timeless black, our template is the epitome of clarity and organization. Equipped with streamlined infographics, universal icons, and adaptable image placeholders, it facilitates easy time management and daily planning. Seamlessly tailored for Powerpoint, Keynote, or Google Slides. A fundamental tool for project managers, event planners, educators, or any professional aiming to efficiently allocate their time. Plan with ease; let every slide bring order to your daily chaos.


7 diapositivas
Comparison Infographic Presentation Template
A comparison Infographic is a visual representation that compares two or more things. It's used to show the similarities and differences between items, ideas, or concepts. It can be used to compare different products, services, options, or even facts and figures. This template works with Powerpoint, Keynote and Google Slides, so you can use it on any computer. This template includes fun pictures and allows you to add your own. This template also has many different charts, graphs and boxes so you can enter your own information. Use this comparison template to compare anything you need.


5 diapositivas
User Experience Empathy Map Strategy Presentation
Step into the user’s mindset with the User Experience Empathy Map Strategy Presentation. This template helps you visualize your audience’s thoughts, feelings, behaviors, and perceptions using a structured empathy map format. Ideal for UX workshops, customer journey analysis, or product design strategy sessions. Fully customizable in PowerPoint, Keynote, Canva, and Google Slides.


5 diapositivas
Corporate Goal Alignment and Execution Presentation
Drive strategic clarity with this streamlined Corporate Goal Alignment and Execution slide. This template visually connects key initiatives with execution pathways and end goals, using a funnel-style layout that highlights the flow from strategic inputs to measurable outcomes. Perfect for aligning teams, reporting progress, or visualizing OKRs. Fully customizable in PowerPoint, Keynote, and Google Slides.


4 diapositivas
South America Growth Market Strategy Presentation
Showcase expansion potential with the South America Growth Market Strategy Presentation. This slide template visually maps out your business strategy across the continent using location markers, ranking indicators (A–D), and concise text sections for each market. Perfect for growth analysis, investment briefings, or sales planning. Fully editable in PowerPoint, Keynote, Google Slides, and Canva.


7 diapositivas
Corporate Training Infographic
Enhance your corporate training program with our engaging Infographic, designed to succinctly communicate the key elements of effective employee development. Ideal for HR managers and corporate trainers, this Infographic provides a visual summary of training strategies and success metrics. Our Corporate Training Infographic includes sections on training goals, interactive learning approaches, progress tracking, and feedback collection. It's crafted to facilitate quick comprehension and retention of corporate training concepts, making it a perfect tool for internal communication and team meetings. The customizable layout allows you to highlight specific training outcomes, participant engagement, and the benefits of ongoing professional development. This SEO-friendly Infographic is tailored to attract professionals focused on boosting their team's performance and skills. Implement our Infographic to streamline your training processes and showcase the value of learning and development within your organization.


7 diapositivas
Social Hierarchy Infographics
A Social Hierarchy is a way of organizing and ranking individuals or groups within a society based on factors such as social status, wealth, power, and prestige. This template features a powerful message about the difference in power between different groups, a stylish design and is fully customizable. Designed for use in Powerpoint, Google Slides and Keynote. Use this template to make your point clear in a meaningful way that really sticks with your audience. This hierarchy themed infographic is best suited for presentations about company structure, business hierarchies and office politics.