


Características


¿Tienes alguna pregunta?
Recomendar


4 diapositivas
Educational Infographic Slide Presentation
Ignite curiosity from the very first slide with a clear, classroom-style visual that makes explanations feel simple and engaging. This presentation helps break down lessons, key concepts, or training points in a way audiences instantly understand. Clean layouts keep the focus on your message. Fully compatible with PowerPoint, Keynote, and Google Slides.


5 diapositivas
AI for Business Innovation Presentation
The "AI in Business" presentation template showcases how AI can be applied across different business processes. It features a friendly robot icon that creatively represents AI's role in modern business, making it visually engaging. The four connected nodes A, B, C, and D likely detail specific applications or case studies of AI in business, such as data analysis, automation, customer interaction, and innovation. This layout is excellent for presentations that aim to explain complex technological implementations in a straightforward and accessible manner, perfect for corporate training or stakeholder briefings.


4 diapositivas
Task Automation Workflow Presentation
Streamline your operations with the Task Automation Workflow template, designed to visualize automated processes and optimize efficiency. Perfect for project managers and teams, this template helps clarify task dependencies, process flows, and automation impact. Fully customizable and compatible with PowerPoint, Keynote, and Google Slides for seamless workflow presentations.


6 diapositivas
McKinsey 7S Advantage Infographic
The McKinsey 7S model is a strategic management framework developed by consulting firm McKinsey & Company in the 1980s. This infographic template helps explain and understand the McKinsey 7S framework, a widely used management model for organizational effectiveness. This template provides an informative overview of the seven key elements of the framework, their interrelationships, and their impact on organizational performance. This template is designed for professionals, consultants, or anyone interested in understanding and applying the McKinsey 7S framework. Fully customizable and compatible with Powerpoint, Keynote, and Google Slides.


6 diapositivas
Business Tree Diagram Layout Presentation
Bring your ideas to life with a dynamic visual flow that connects every stage of your business strategy. Perfect for mapping growth, processes, or team structures, this clean and modern layout keeps your data clear and engaging. Fully compatible with PowerPoint, Keynote, and Google Slides for effortless customization.


5 diapositivas
Team Goals and Alignment Strategy Presentation
Align your team with clarity using the Team Goals and Alignment Strategy Presentation. This slide visually connects individual roles to a central target, making it ideal for showcasing strategic alignment, shared objectives, or team contributions. Fully customizable in Canva, PowerPoint, or Google Slides for seamless team planning.


7 diapositivas
Gap Analysis Process Infographic Presentation
A Gap Analysis is a process that helps identify the differences or gaps between where an organization or individual is currently and where they want to be in the future. This Template is a fun way to provide visual data and make your presentation more engaging. This template is designed for strategic planning, you can make a compelling case to your project teams. This template includes helpful illustrations and allows you to add tips compatible with Powerpoint, keynote and google slides. Guide your audience through the results with ease and impress them with cultivating infographics.


6 diapositivas
Logistics and Procurement Supply Chain Presentation
Optimize your supply chain strategy with the Logistics and Procurement Supply Chain template. Designed to illustrate key logistics processes, procurement flows, and operational efficiency, this structured layout helps you present crucial data with clarity. Fully customizable and compatible with PowerPoint, Keynote, and Google Slides for seamless business integration.


2 diapositivas
Designer Portfolio for Client Showcase Presentation
Showcase your creative work with the Designer Portfolio for Client Showcase Presentation. This sleek layout emphasizes visual storytelling, making it ideal for graphic designers, illustrators, and creatives presenting to potential clients. Highlight your projects in a clean, modern format. Compatible with Canva, PowerPoint, Keynote, and Google Slides for full customization.
8 diapositivas
3-Step Arrow Process Flow Presentation
Kickstart your message with a bold, directional visual that makes every step feel clear and intentional. This presentation showcases a simple three-stage progression ideal for explaining workflows, strategies, or business processes with clarity and impact. Easy to customize and fully compatible with PowerPoint, Keynote, and Google Slides.


6 diapositivas
Business Performance Pie Chart Presentation
Showcase key business insights with the Business Performance Pie Chart Presentation template. Designed for professionals, this fully editable slide deck allows you to present performance metrics, financial data, and strategic analysis using visually appealing pie charts. Ideal for business reports, investor meetings, and corporate presentations, it ensures clarity and engagement. Compatible with PowerPoint, Keynote, and Google Slides.


21 diapositivas
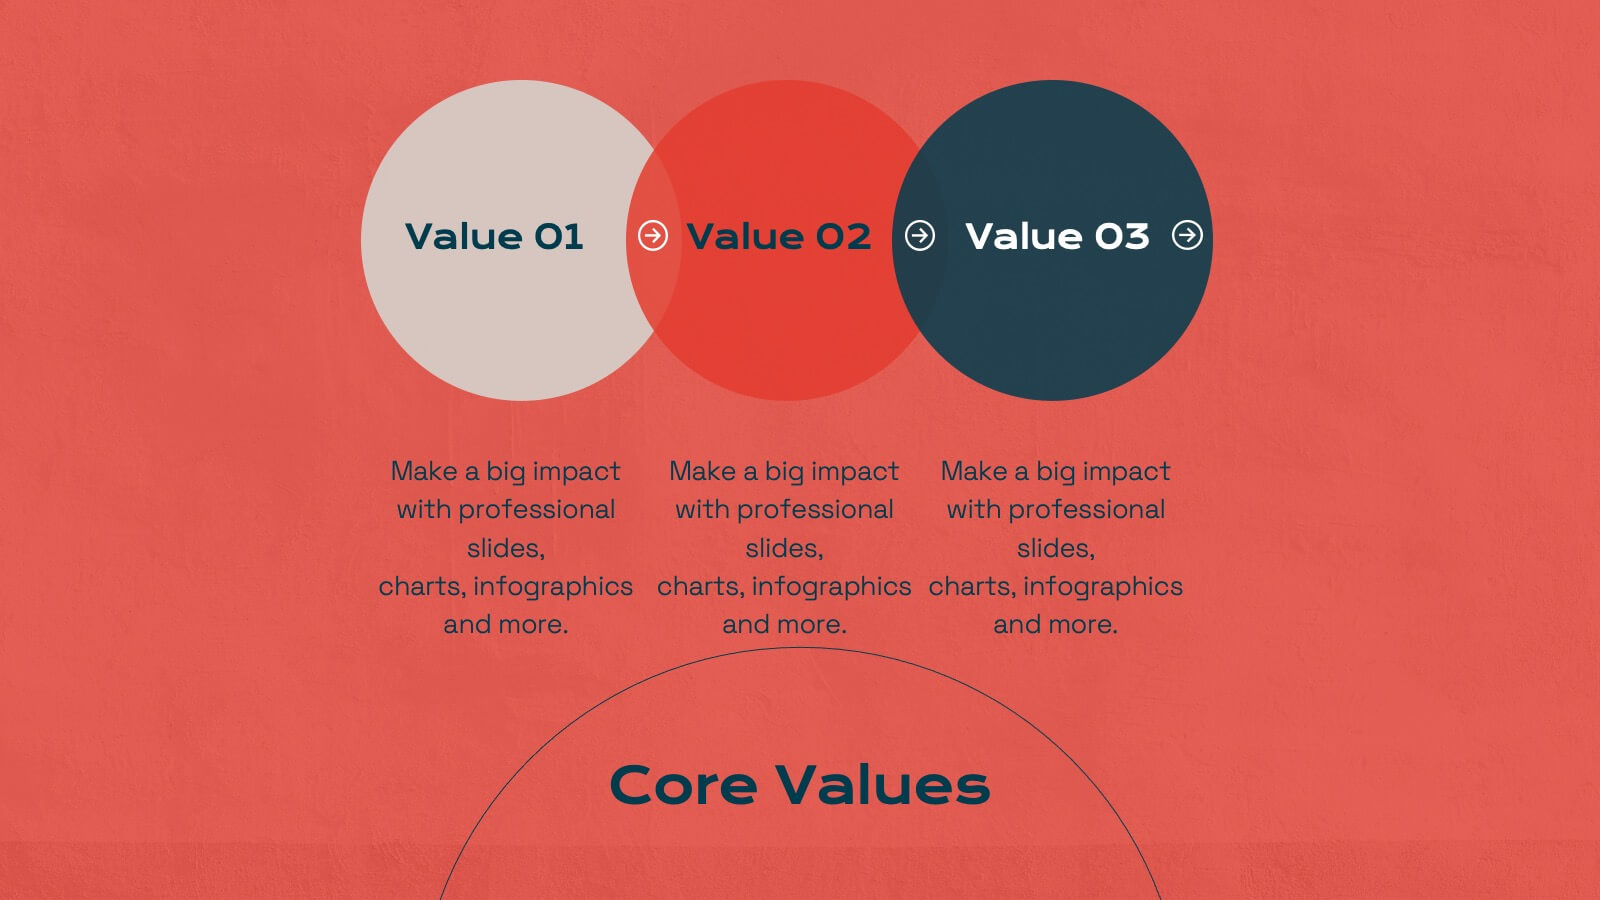
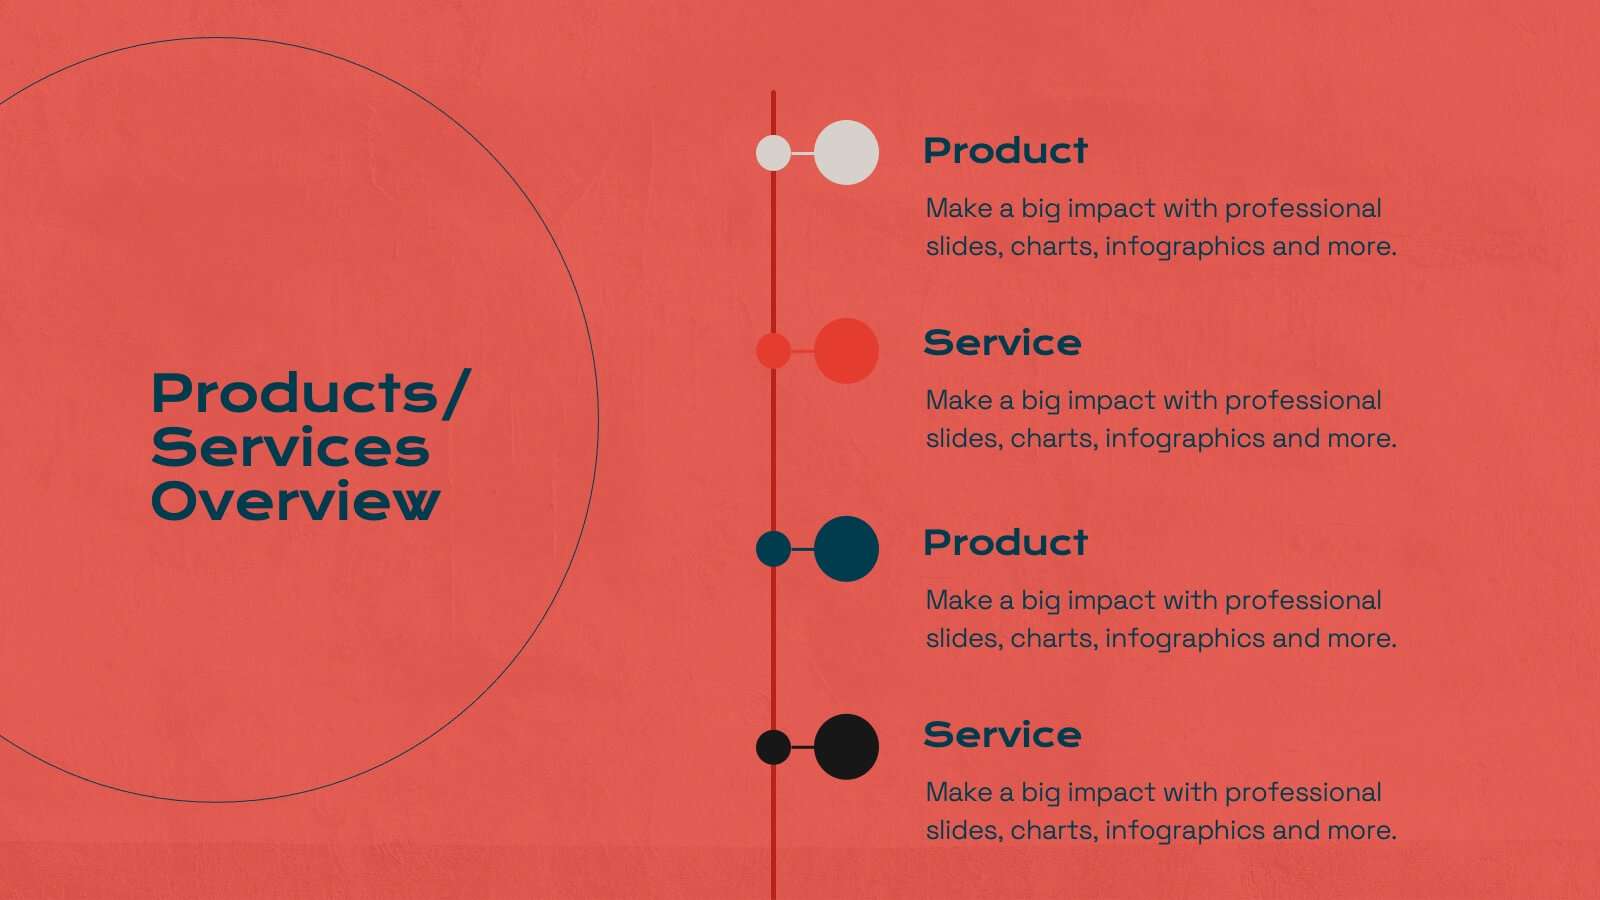
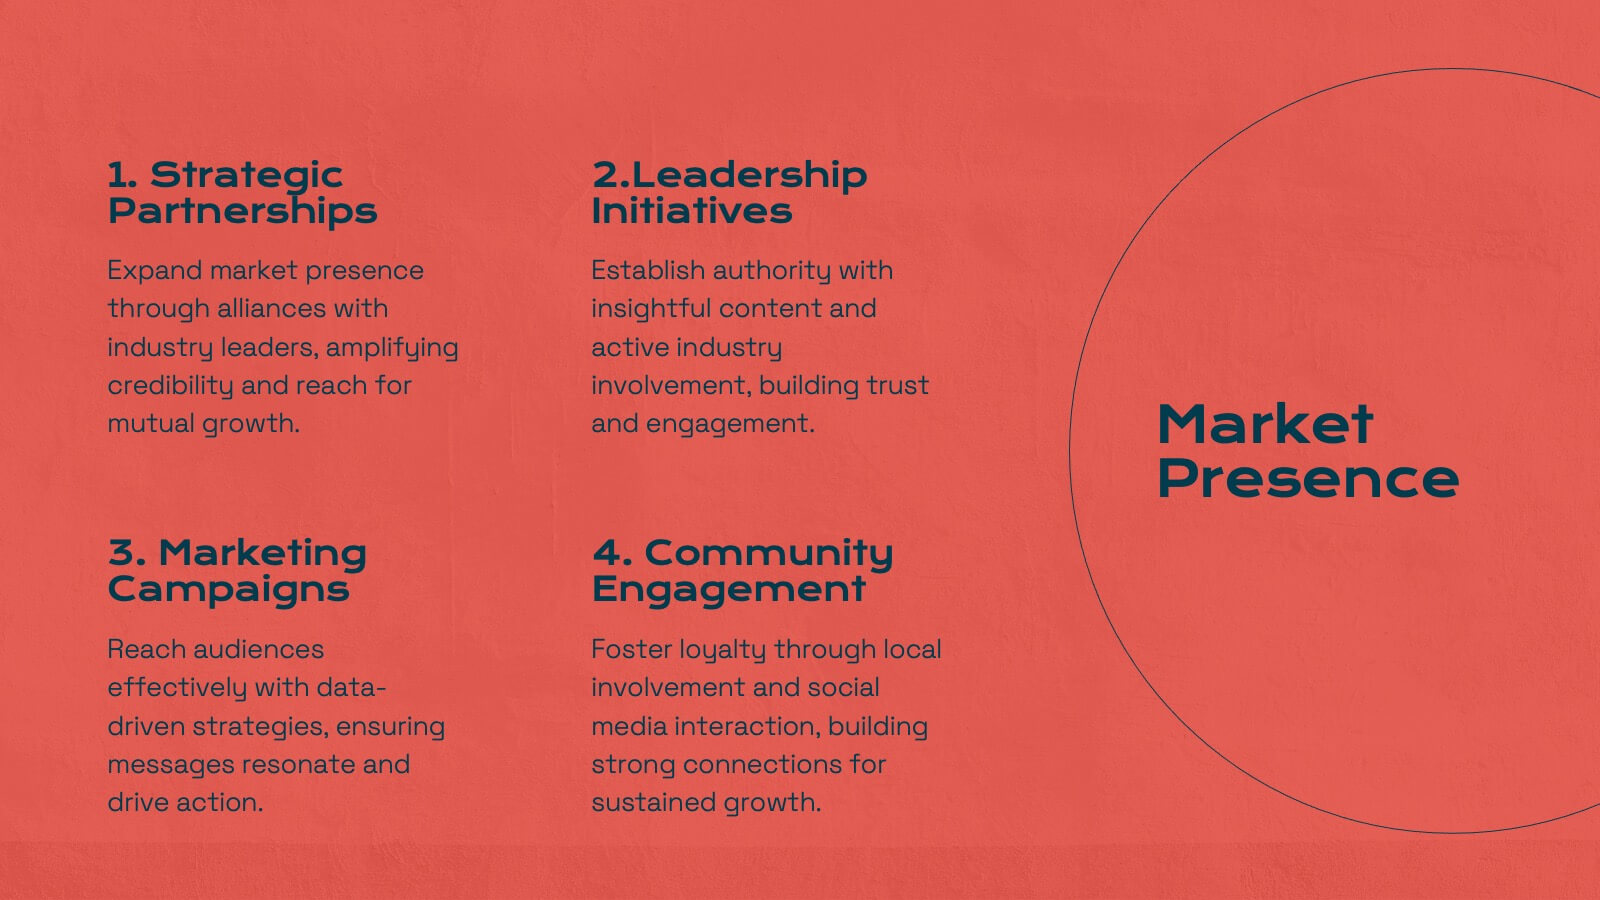
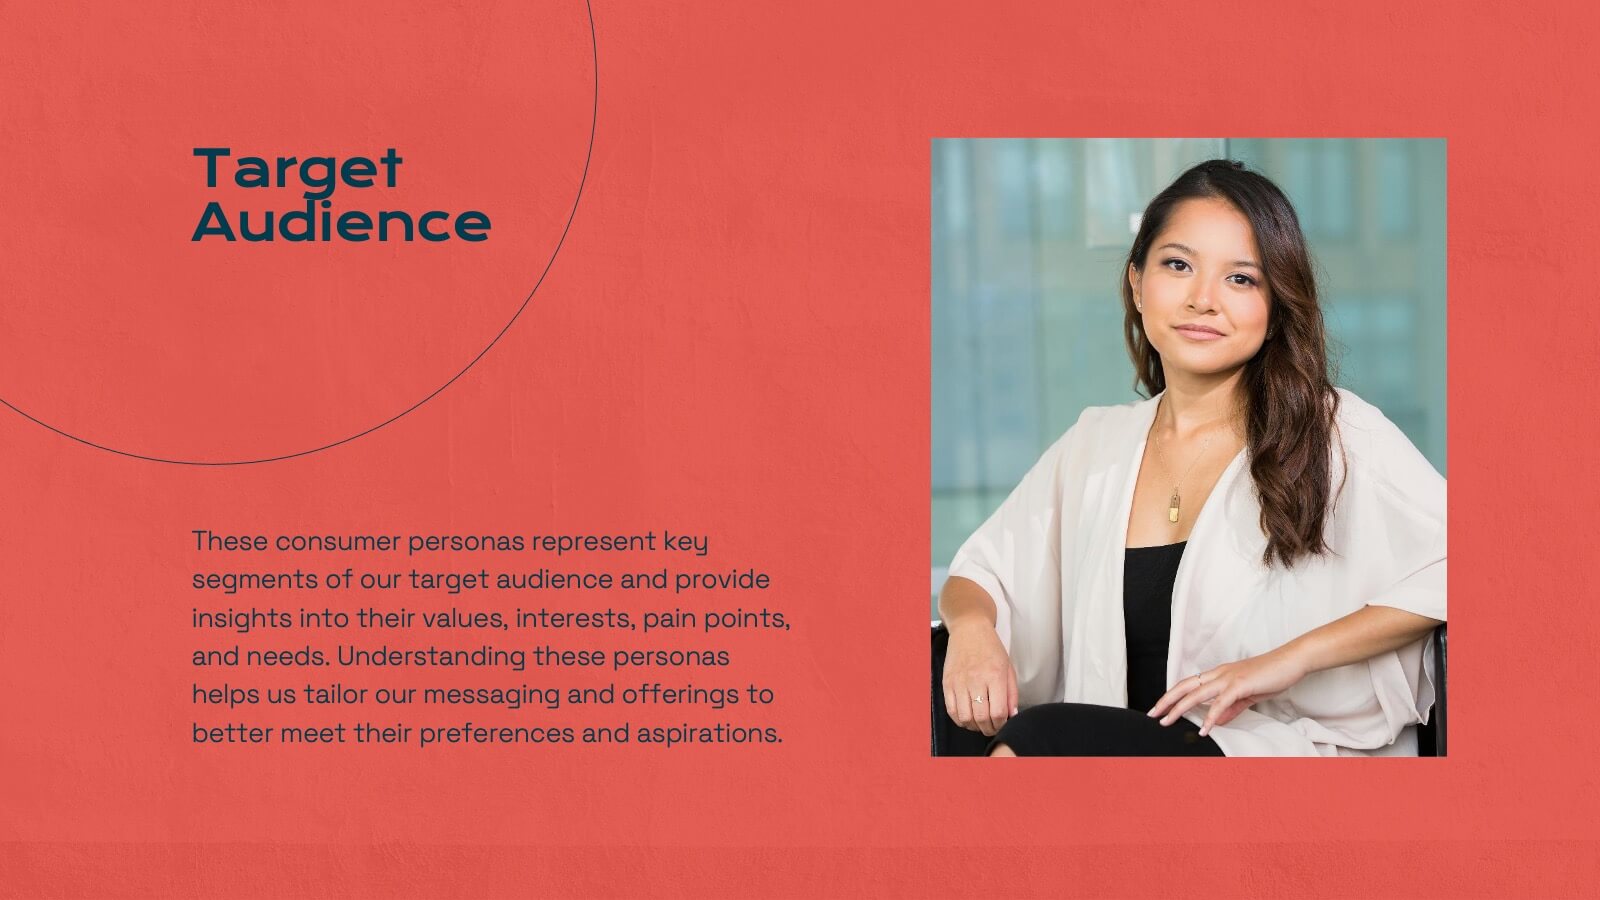
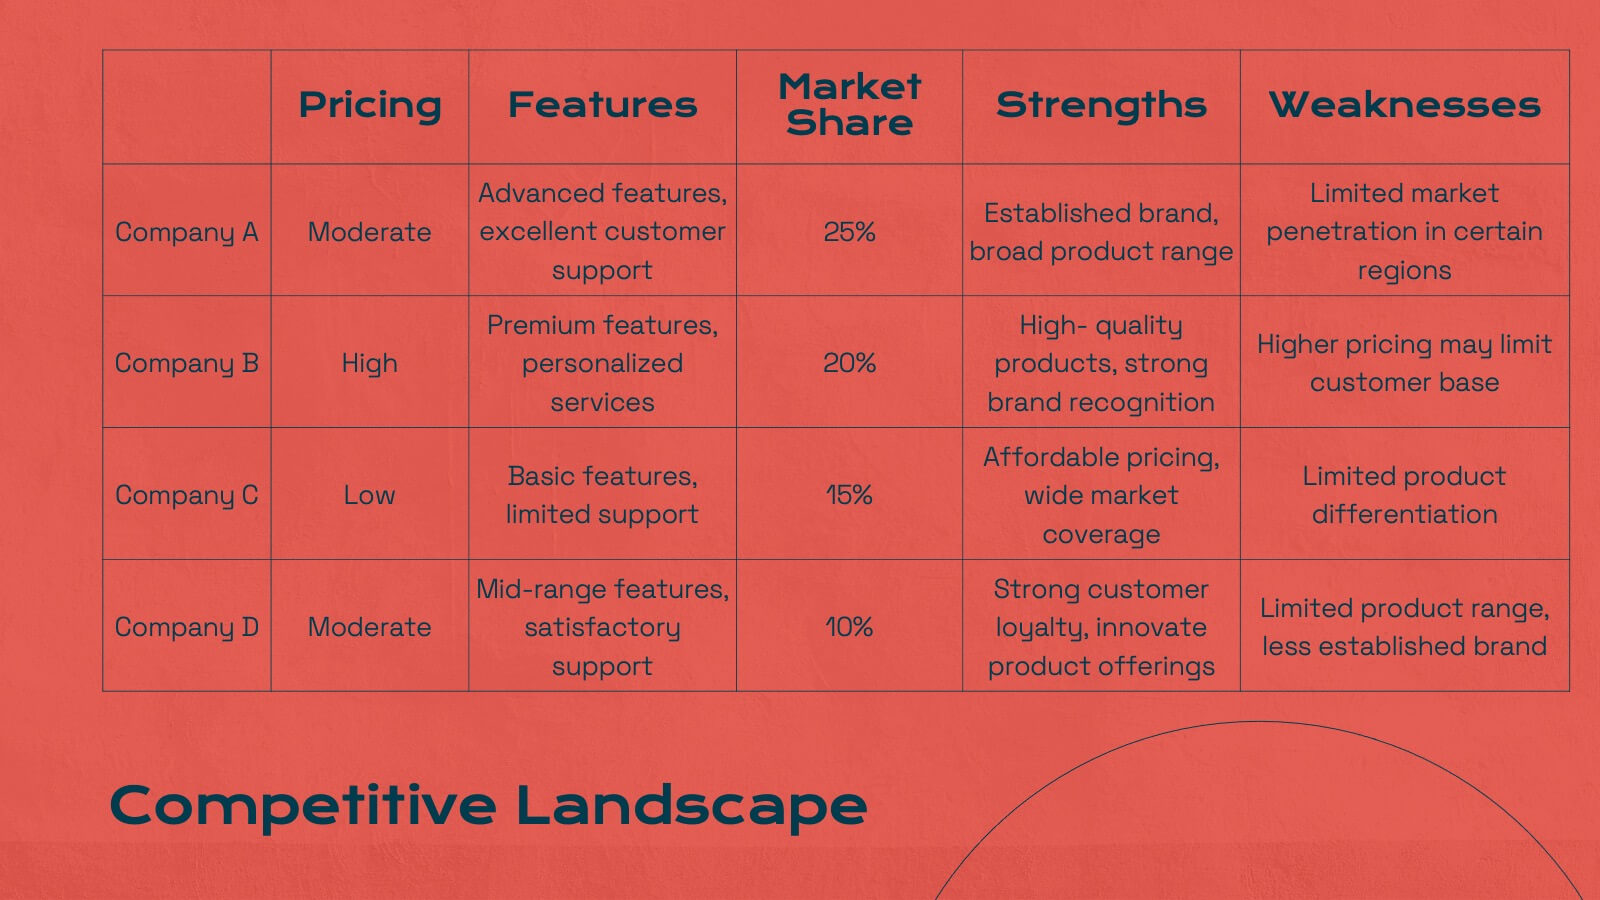
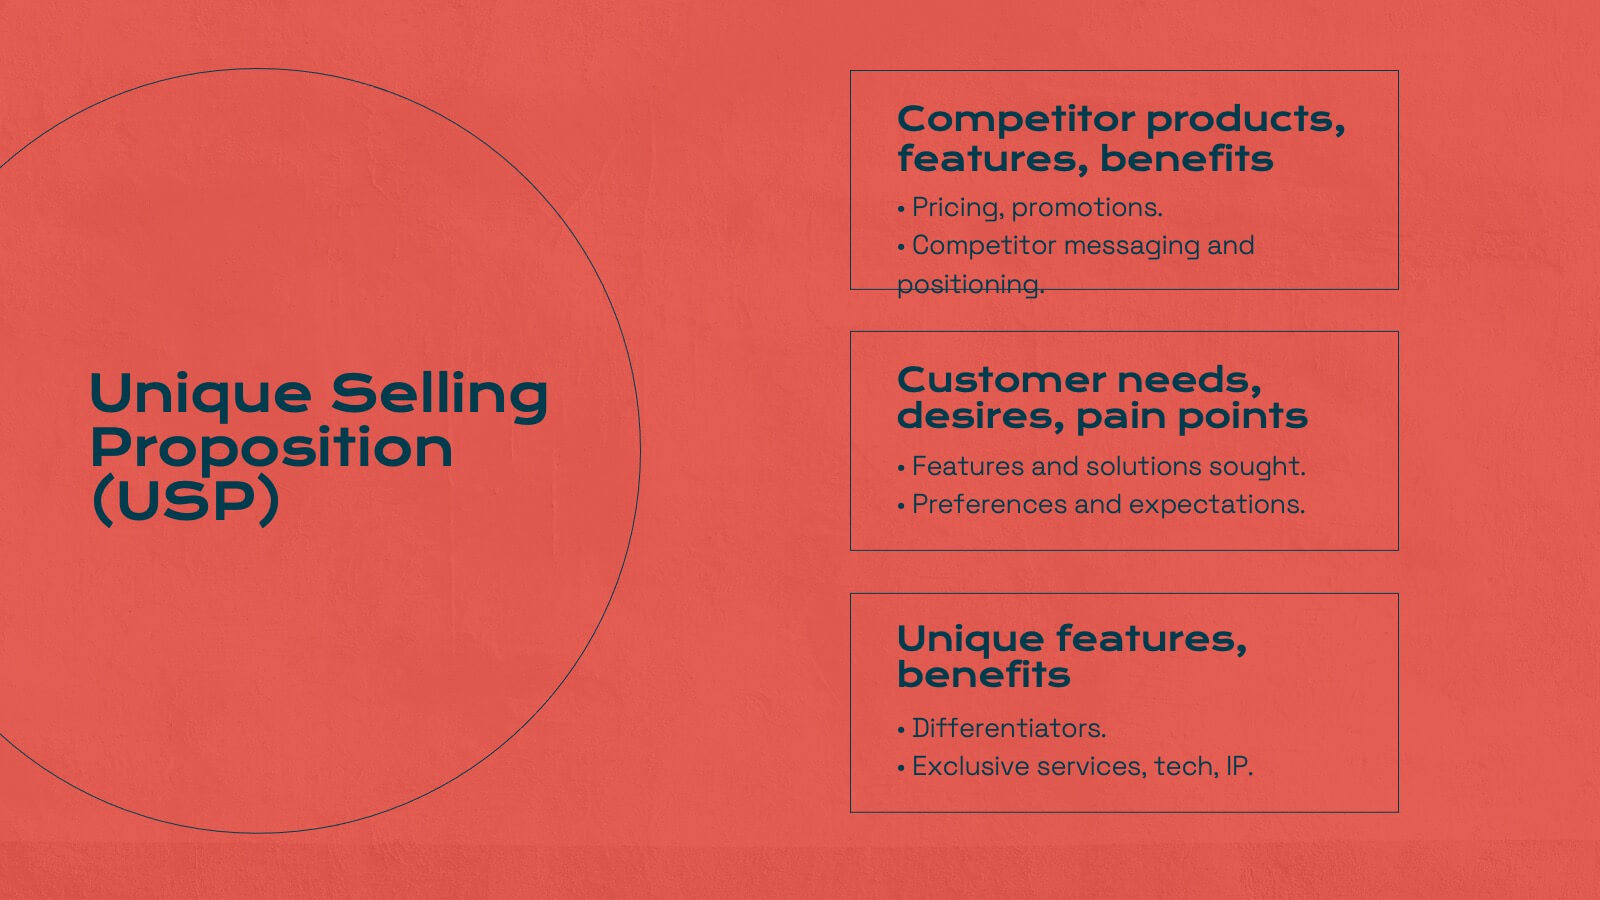
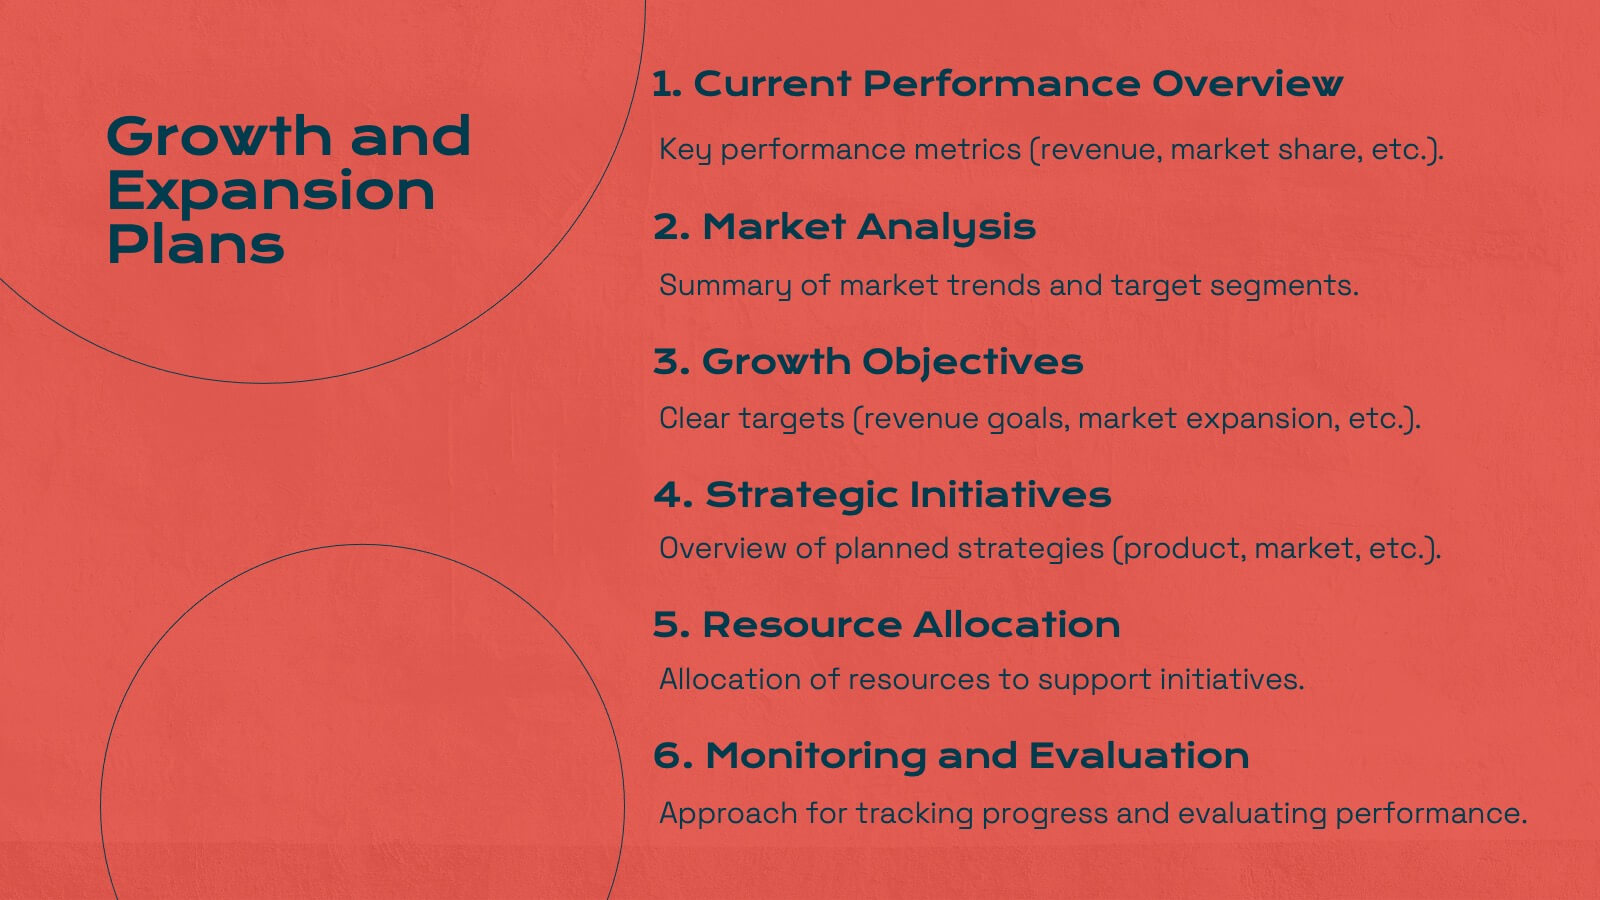
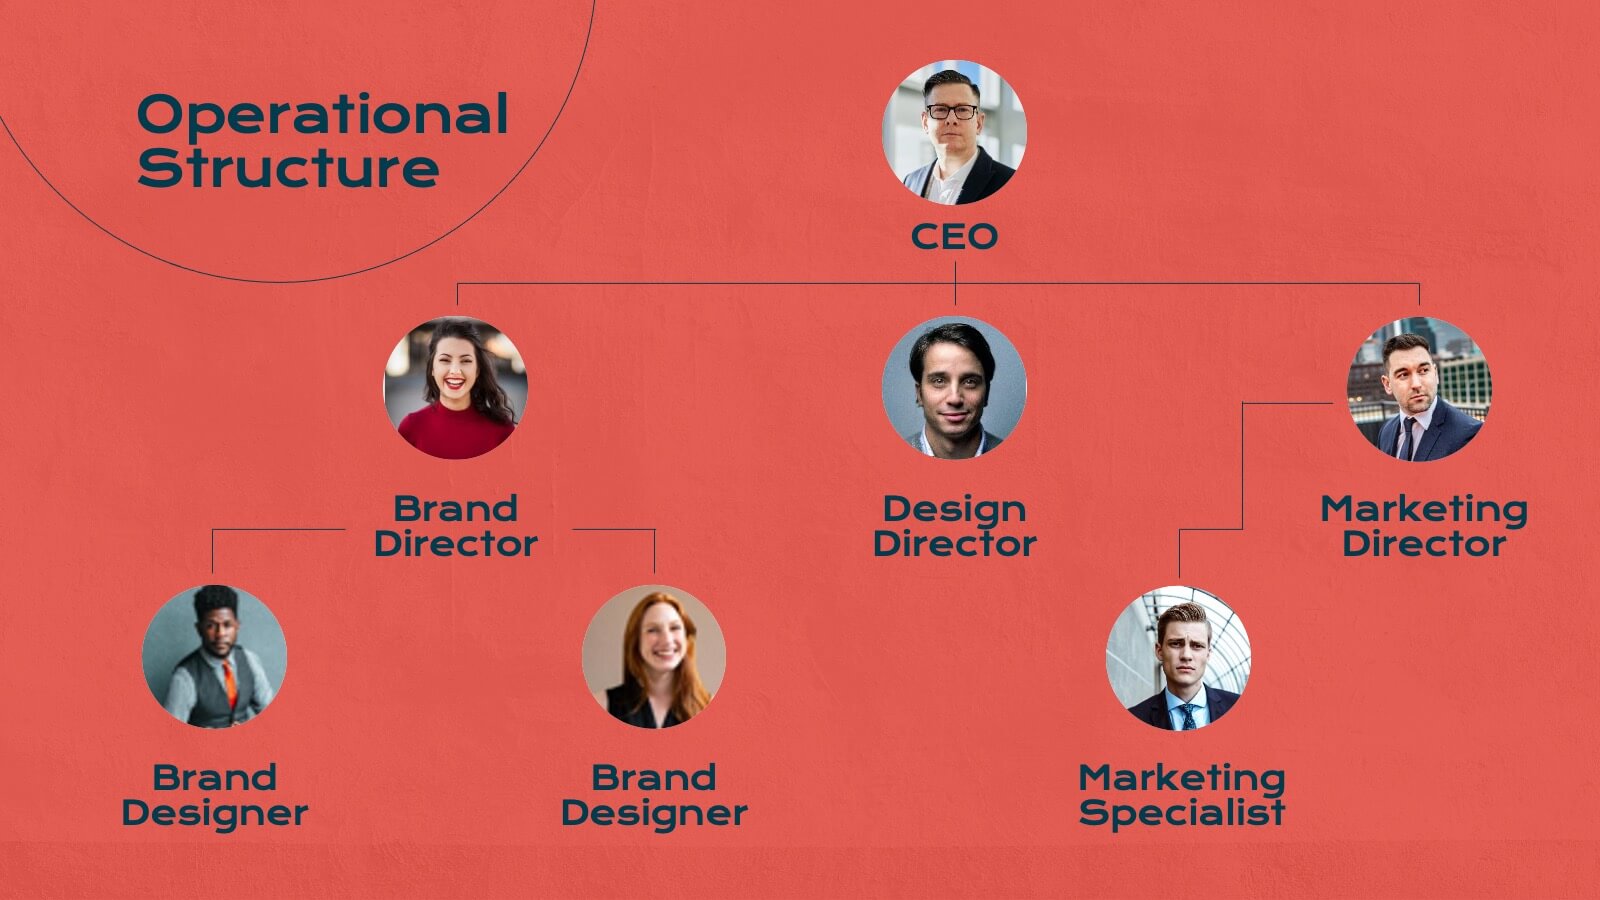
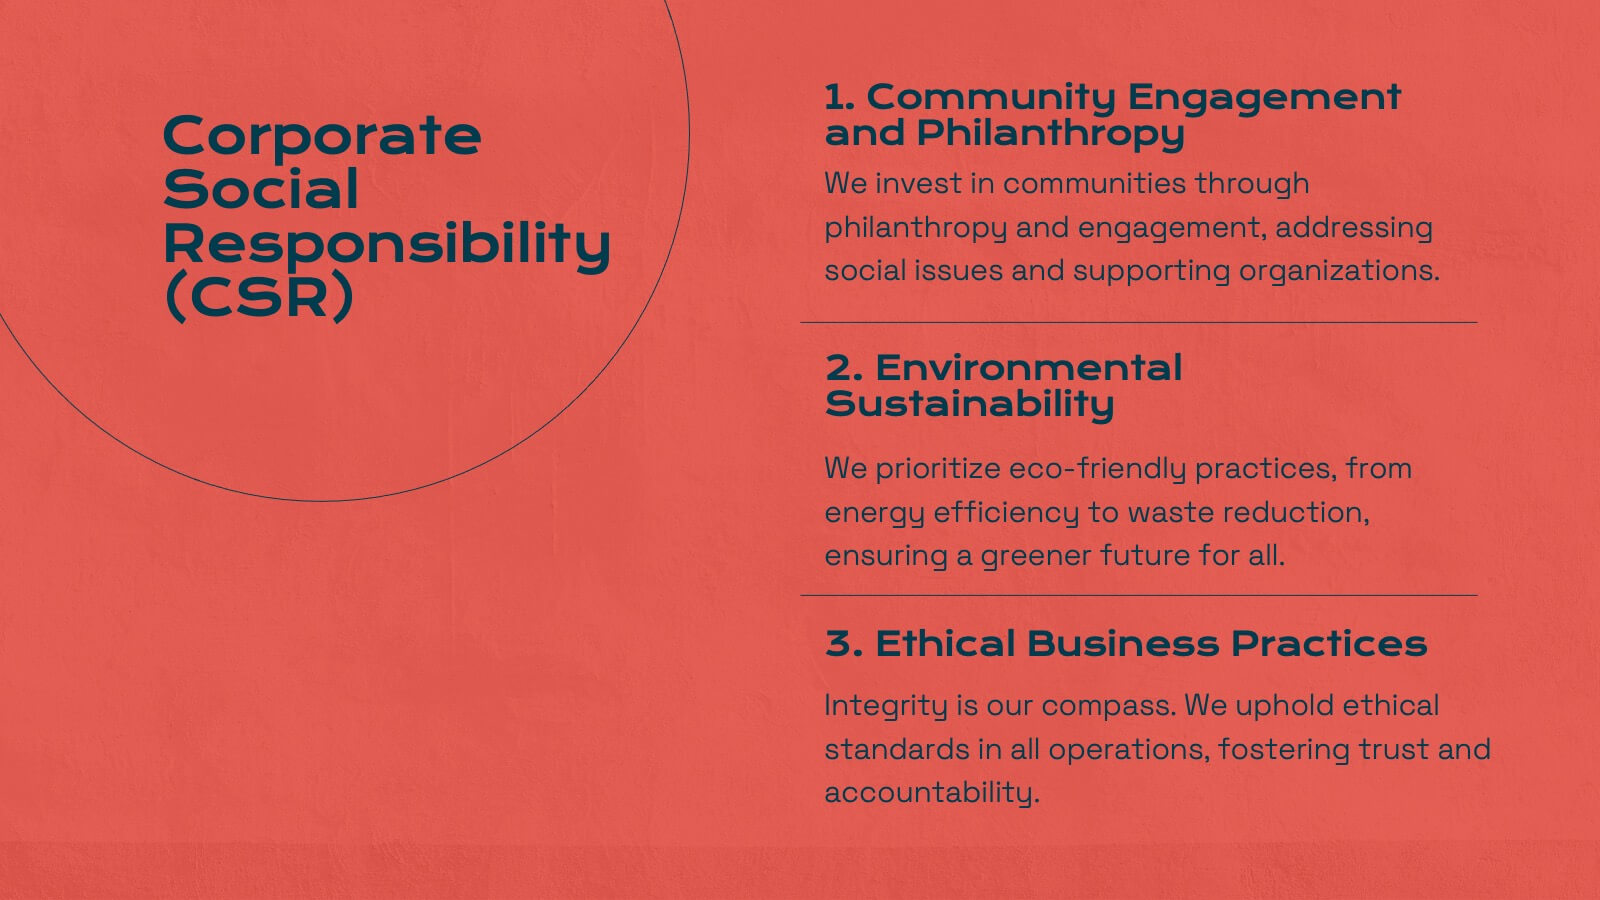
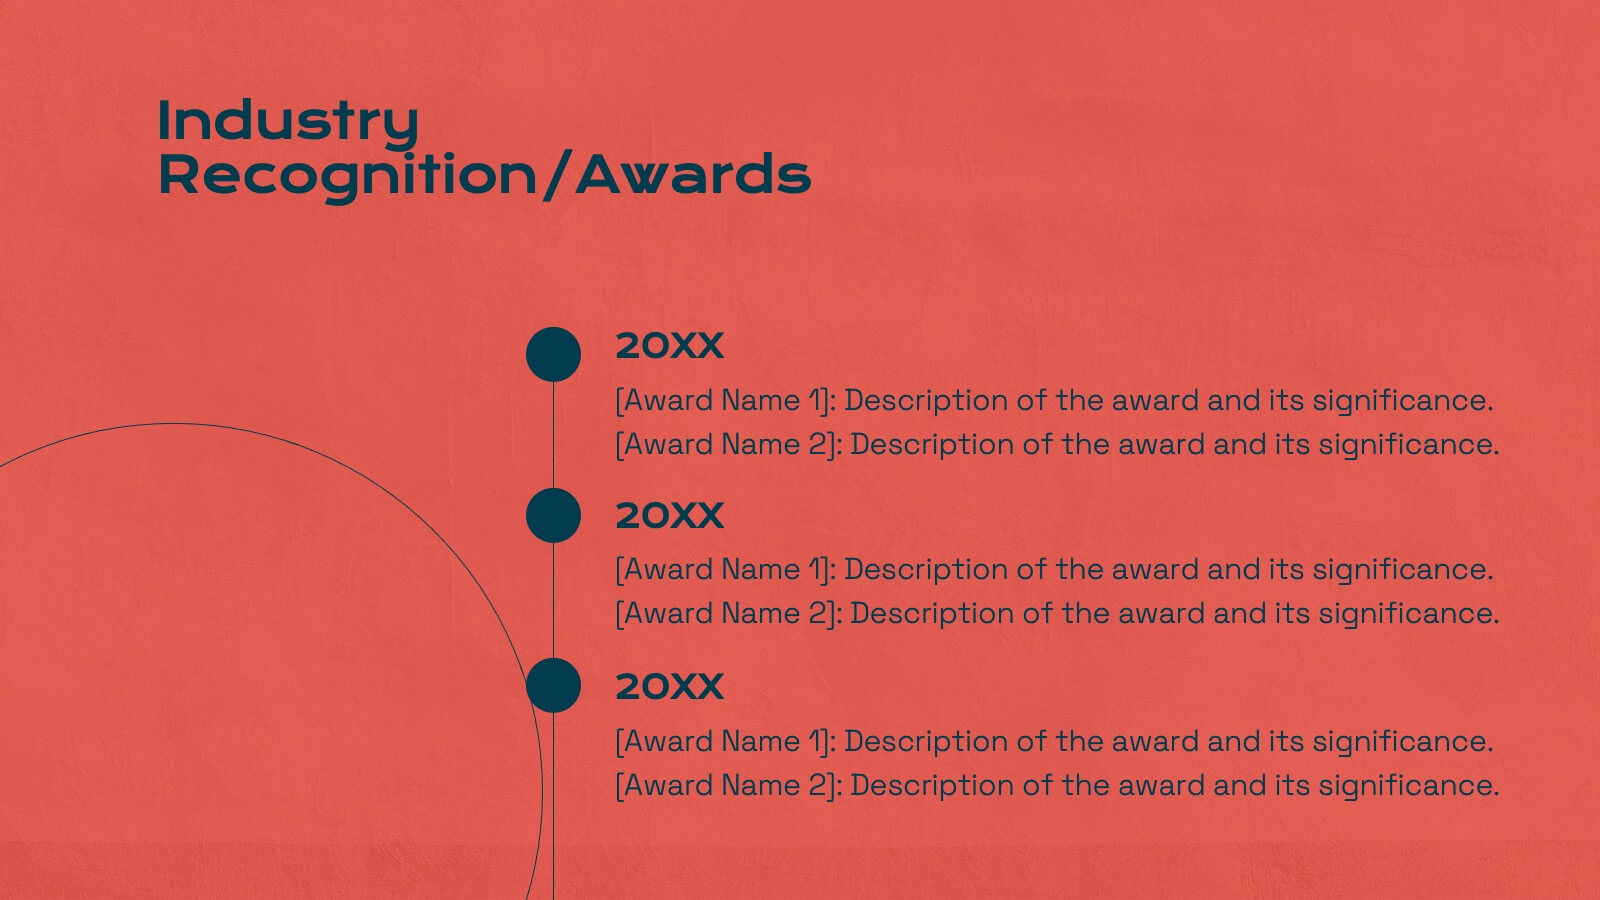
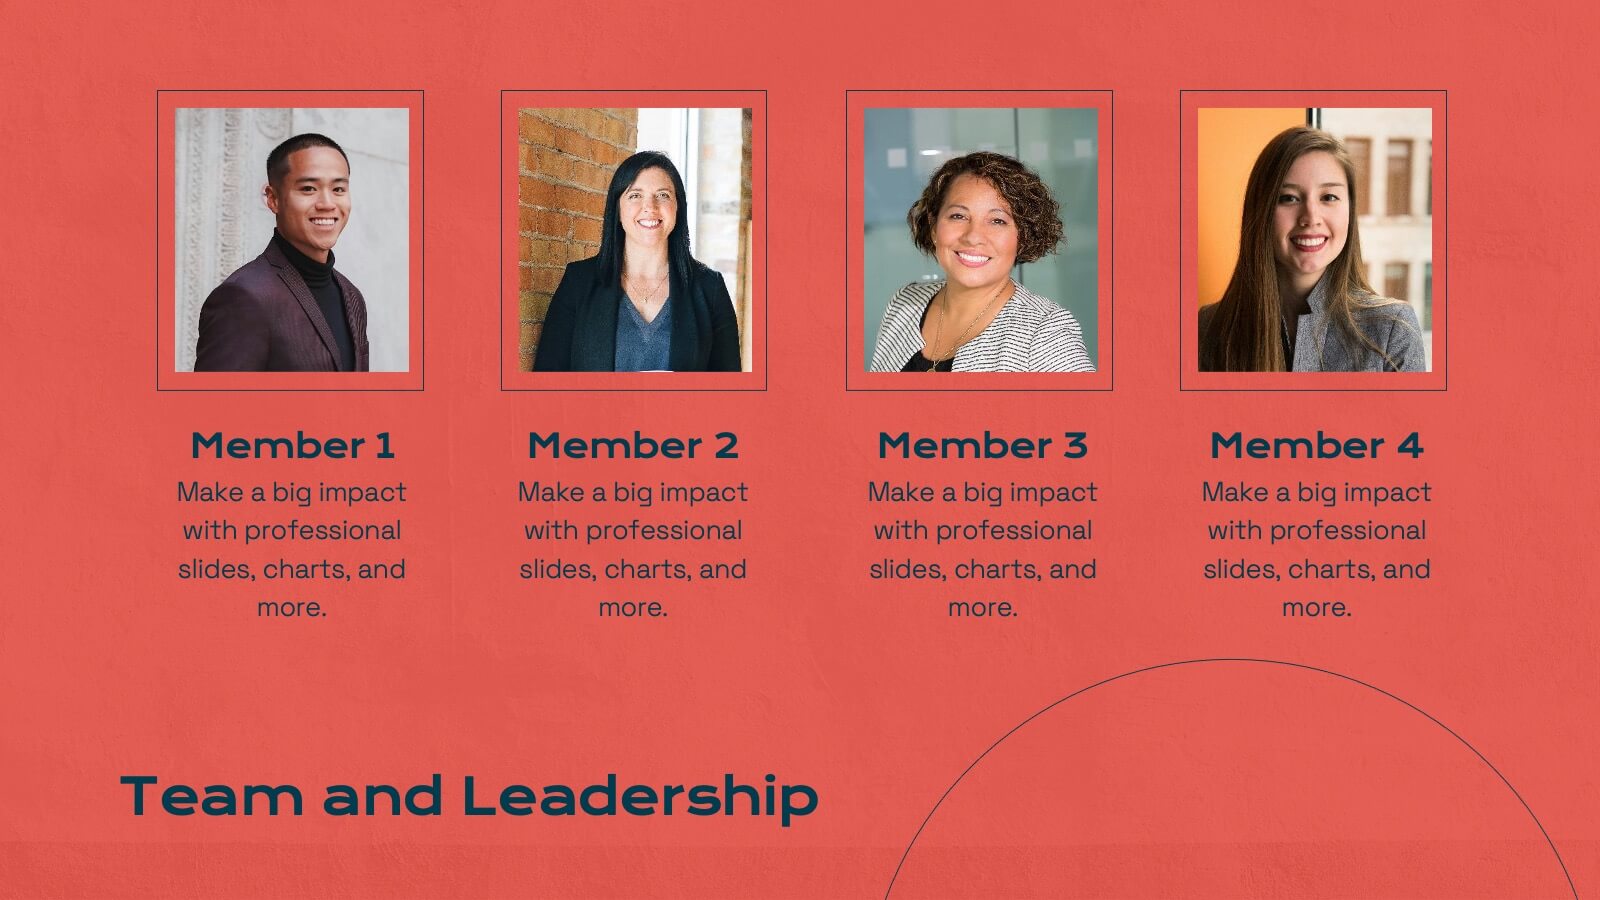
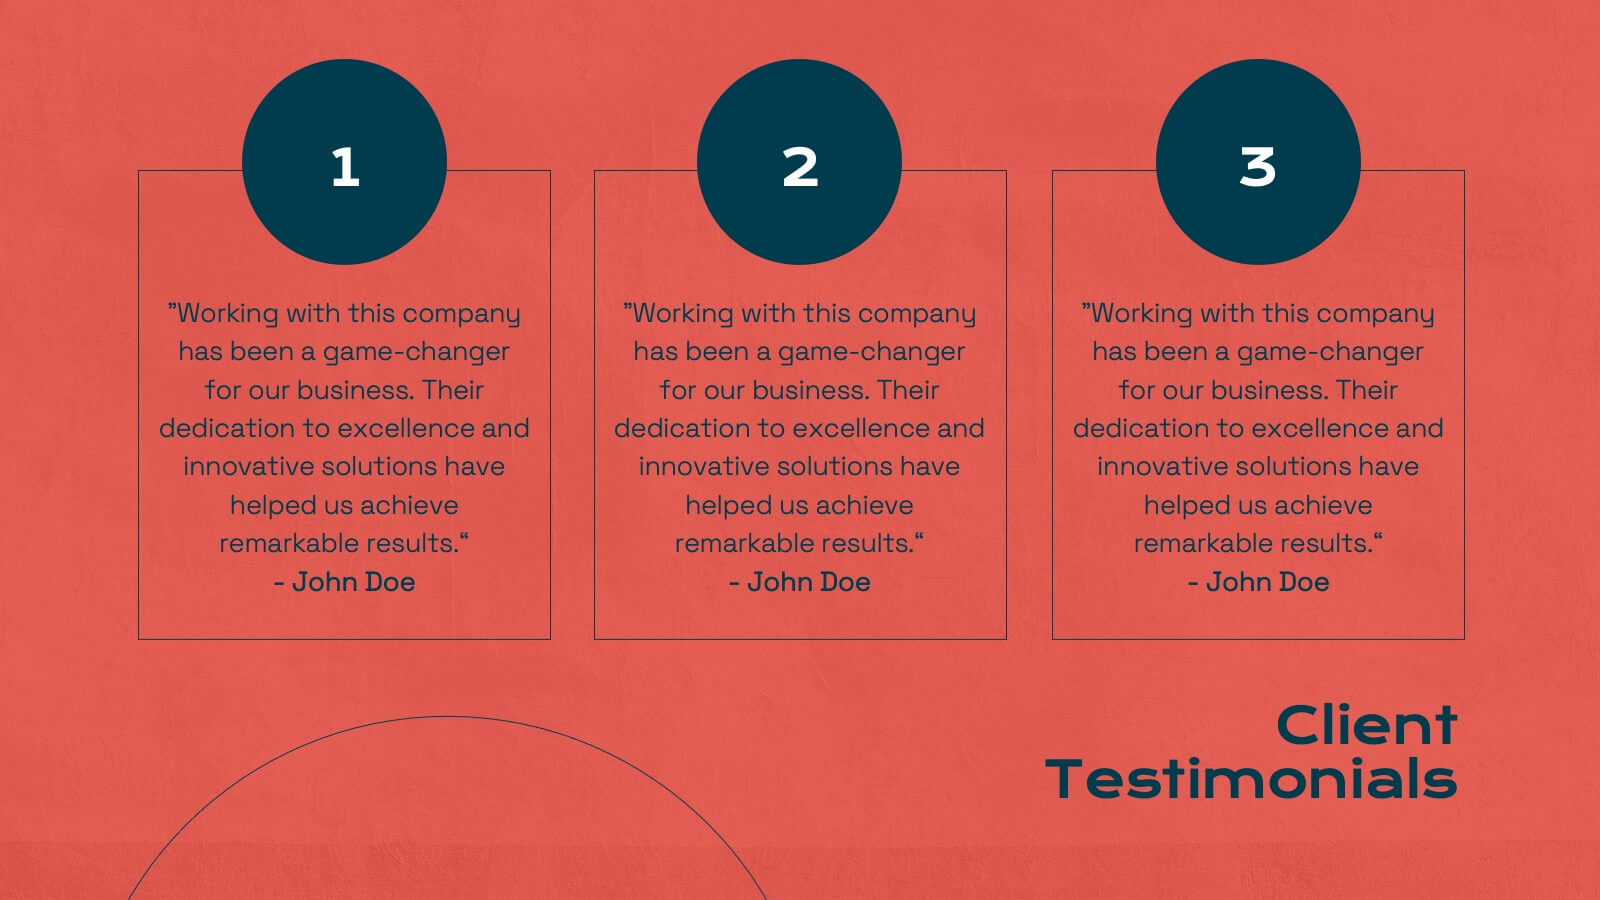
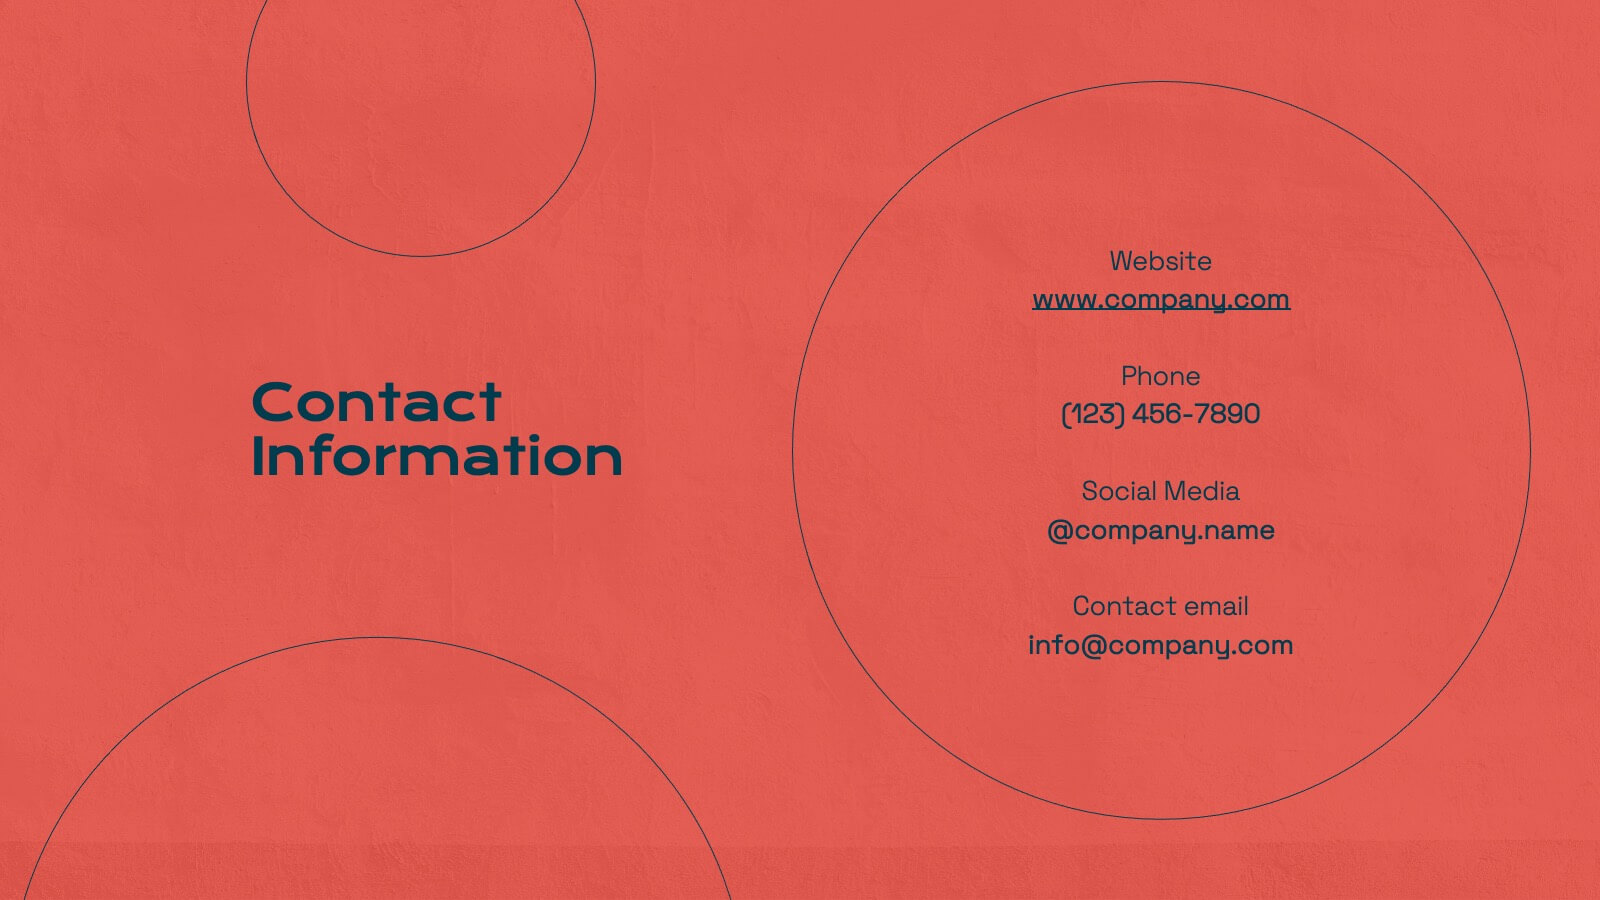
Titan Marketing Research Report Presentation
Energize your marketing research presentations with this bold, vibrant template. Perfect for detailing company history, market presence, and competitive landscapes, it features a striking red design that captures attention. Highlight key insights like target audience, financial highlights, and growth plans to engage your audience. Compatible with PowerPoint, Keynote, and Google Slides, it ensures seamless presentations on any platform.


5 diapositivas
Meal Plan and Nutrition Guide Presentation
Simplify your nutrition strategy with the Meal Plan and Nutrition Guide Presentation. This visually engaging circular layout lets you outline five key nutrition pillars or daily meals with icons and editable titles. Ideal for dietitians, wellness coaches, or health brands. Compatible with PowerPoint, Canva, and Google Slides for seamless customization.


6 diapositivas
OKR Goal-Setting Framework Presentation
Achieve clarity and focus with the OKR Goal-Setting Framework. This structured layout helps visualize objectives and key results using hexagonal elements for a clear strategic overview. Perfect for business planning, performance tracking, and team alignment. Fully editable and compatible with PowerPoint, Keynote, and Google Slides for effortless customization.


6 diapositivas
Six Sigma Certification Infographics
Explore the world of Six Sigma Certification with our customizable infographic template. This template is fully compatible with popular presentation software like PowerPoint, Keynote, and Google Slides, allowing you to easily customize it to illustrate and communicate various aspects of Six Sigma certification and its benefits. The Six Sigma Certification infographic template offers a visually engaging platform to outline the different levels of certification, the DMAIC methodology, and the impact of Six Sigma on quality improvement within organizations. Whether you're a quality professional, project manager, or someone looking to enhance your process improvement skills, this template provides a user-friendly canvas to create informative presentations and educational materials. Deepen your knowledge of Six Sigma Certification with this SEO-optimized infographic template, thoughtfully designed for clarity and ease of use. Customize it to showcase the certification requirements, training options, project success stories, and the potential for career advancement, ensuring that your audience gains valuable insights into the world of Six Sigma. Start crafting your personalized infographic today to explore the realm of Six Sigma Certification.


5 diapositivas
Feedback Assessment with Smile Ratings Presentation
Visually capture user sentiment with this Feedback Assessment with Smile Ratings slide. Featuring a curved layout with emoticons ranging from happy to unhappy, it’s ideal for showcasing satisfaction levels, survey results, or evaluation stages. Fully customizable in Canva, PowerPoint, or Google Slides—perfect for reports, workshops, or performance reviews.


20 diapositivas
Spartan Content Marketing Pitch Deck Presentation
The Spartan Marketing Pitch Deck is designed to captivate and impress with its bold, modern layout and striking black-and-white color scheme. Perfect for delivering powerful marketing strategies, this template covers all essential aspects from industry overview to consumer behavior analysis. It seamlessly guides you through emerging technologies, content marketing trends, and mobile marketing insights. The deck emphasizes personalization trends, influencer marketing, and the latest eCommerce developments, ensuring your pitch resonates with cutting-edge strategies. Whether discussing SEO and SEM trends or diving into customer experience and brand storytelling, this template delivers your message with clarity and impact. Conclude with a strong call to action, ensuring your audience is engaged and ready to take the next step. Fully compatible with PowerPoint, Keynote, and Google Slides, the Spartan Marketing Pitch Deck is an excellent choice for professionals aiming to deliver a memorable and persuasive presentation.