


Características


¿Tienes alguna pregunta?
Recomendar


4 diapositivas
Leadership Development and Growth Presentation
Explore the dynamics of effective leadership with our Leadership Development and Growth Presentation. This template illustrates the progressive stages of leadership maturity with unique, visually appealing graphics, making it ideal for workshops and seminars. Compatible with major presentation software to ensure accessibility and ease of use.


7 diapositivas
PESTEL Analysis Infographic Presentation Template
A PESTEL Analysis Infographic is a great tool to highlight the risks and opportunities of a market. Based on the needs of your customers, this Infographic can help you communicate key information about competition, regulatory environment and economic outlook. This template can also be used for stocks of any company from any industry. This is a comprehensive pestel analysis infographic that will show you the factors that are driving and restraining the growth of your industry. This template can help companies to identify their weaknesses and drive their strengths with the pestel analysis.


6 diapositivas
Business Investment Market in Africa Map Presentation
Highlight key investment hotspots across Africa with this clean, location-based map template. Featuring labeled markers, progress bars, and editable data points, it’s ideal for showcasing project focus, regional funding, or development opportunities. Customize easily in PowerPoint, Keynote, or Google Slides to create compelling, data-driven business and finance presentations.


4 diapositivas
UX Empathy Map Design Presentation
Spark deeper user understanding with a layout that turns thoughts, feelings, and behaviors into clear visual insights. This presentation helps teams explore customer motivation and improve product decisions through a simple, structured empathy-mapping framework. Fully compatible with PowerPoint, Keynote, and Google Slides.


8 diapositivas
Business Growth Strategies Presentation
Take your vision from concept to expansion with a sleek, modern presentation designed to highlight progress and future potential. Ideal for showcasing goals, performance metrics, and market strategies, it keeps your ideas structured and engaging. Fully compatible with PowerPoint, Keynote, and Google Slides for effortless customization and presentation delivery.


7 diapositivas
SCRUM Process Infographic
Scrum is an agile framework used in software development and project management. Embark on an agile journey through the scrum Process with our infographic template. This illustrative and informative infographic provides a clear visual guide to this methodology, facilitating a swift and efficient path to project success. Compatible with Powerpoint, Keynote, and Google Slides. This is an informative and visually engaging presentation that brings the effectiveness of scrum methodology to life, encouraging individuals and teams to sprint towards project excellence with precision and collaboration.


7 diapositivas
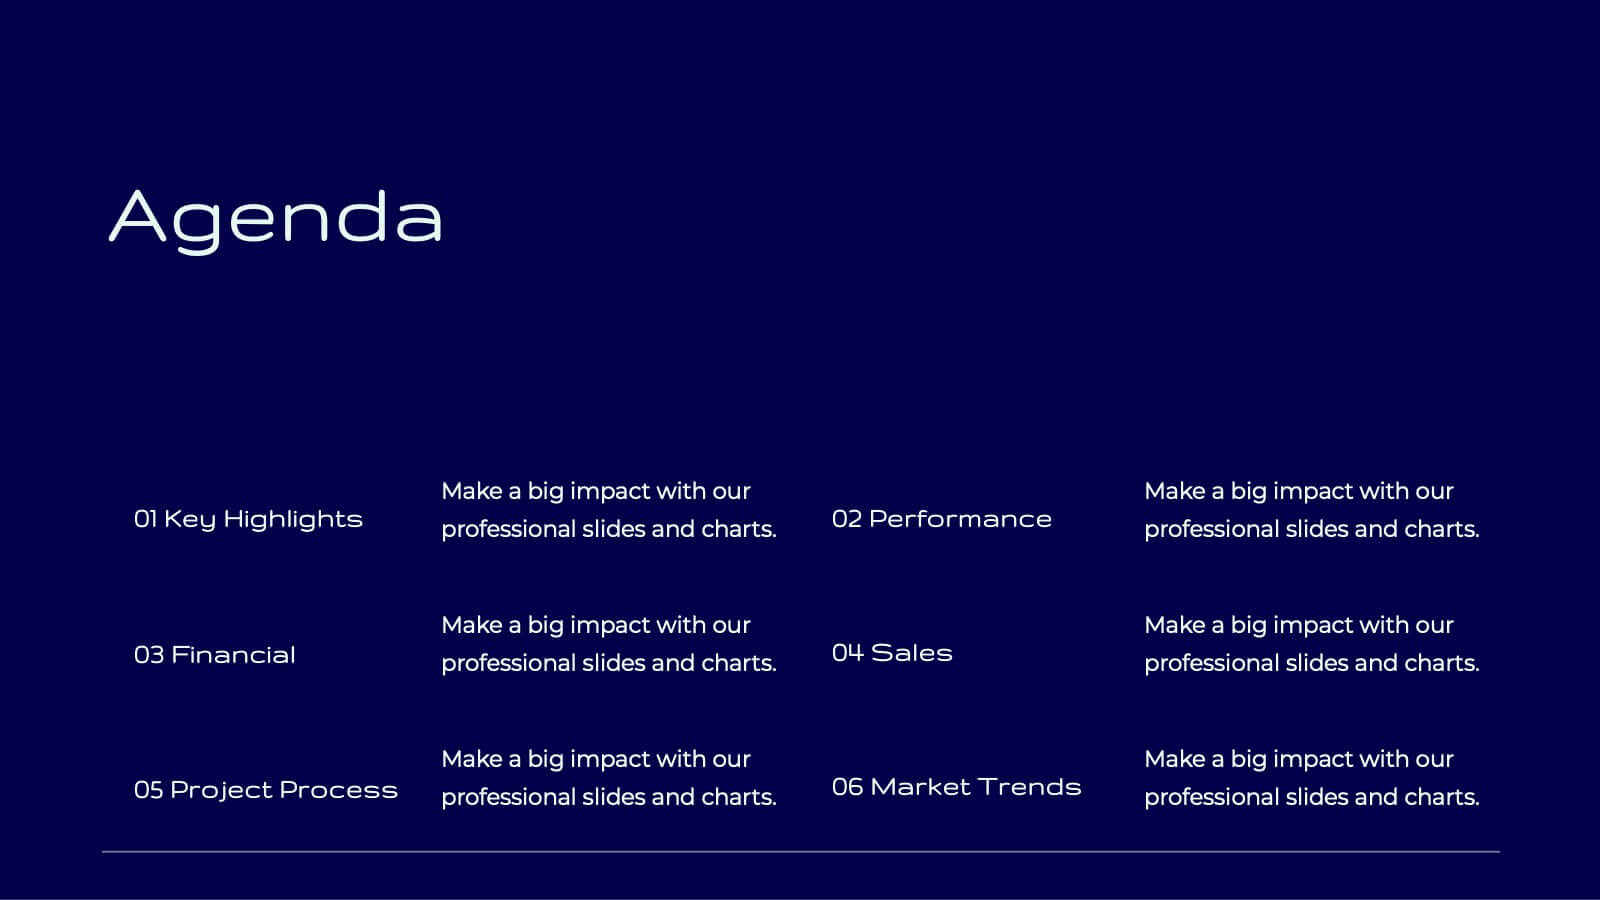
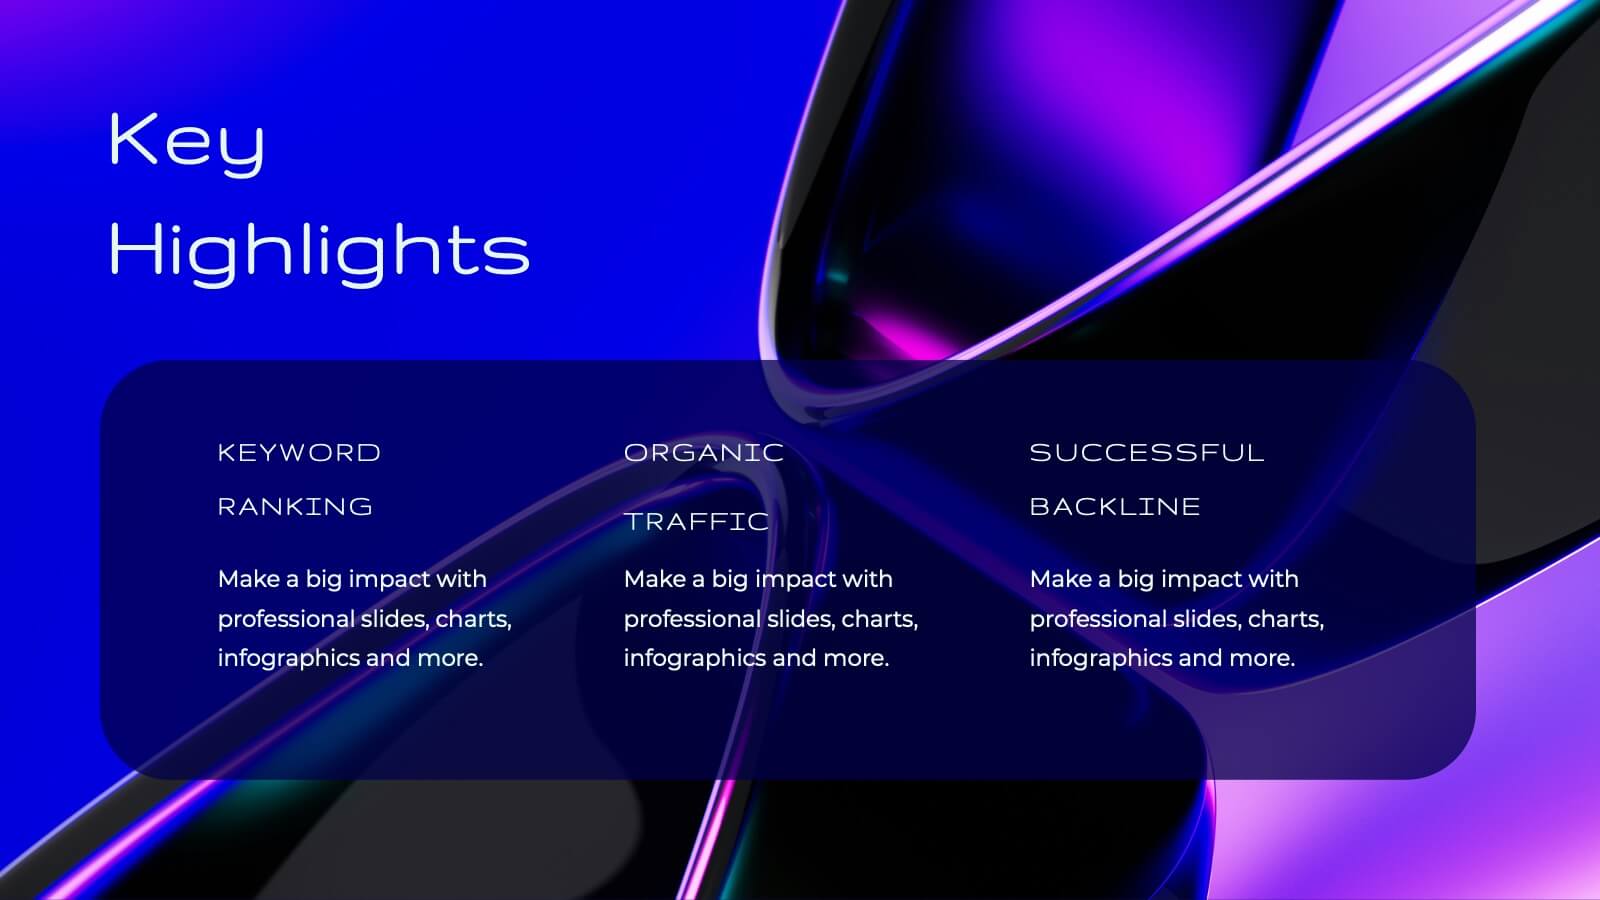
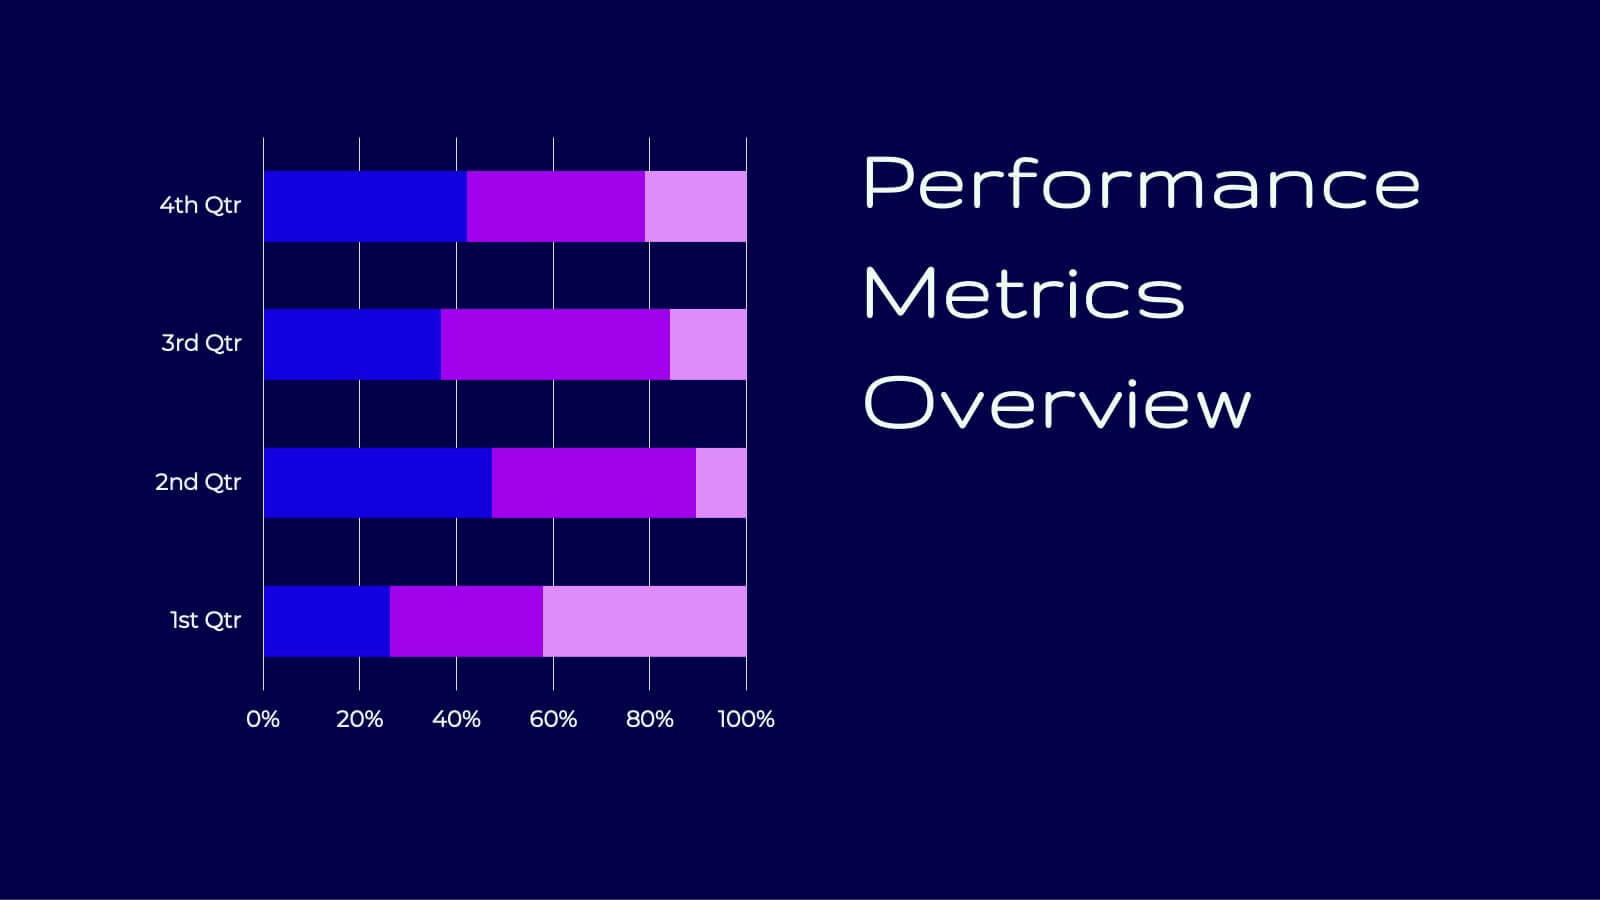
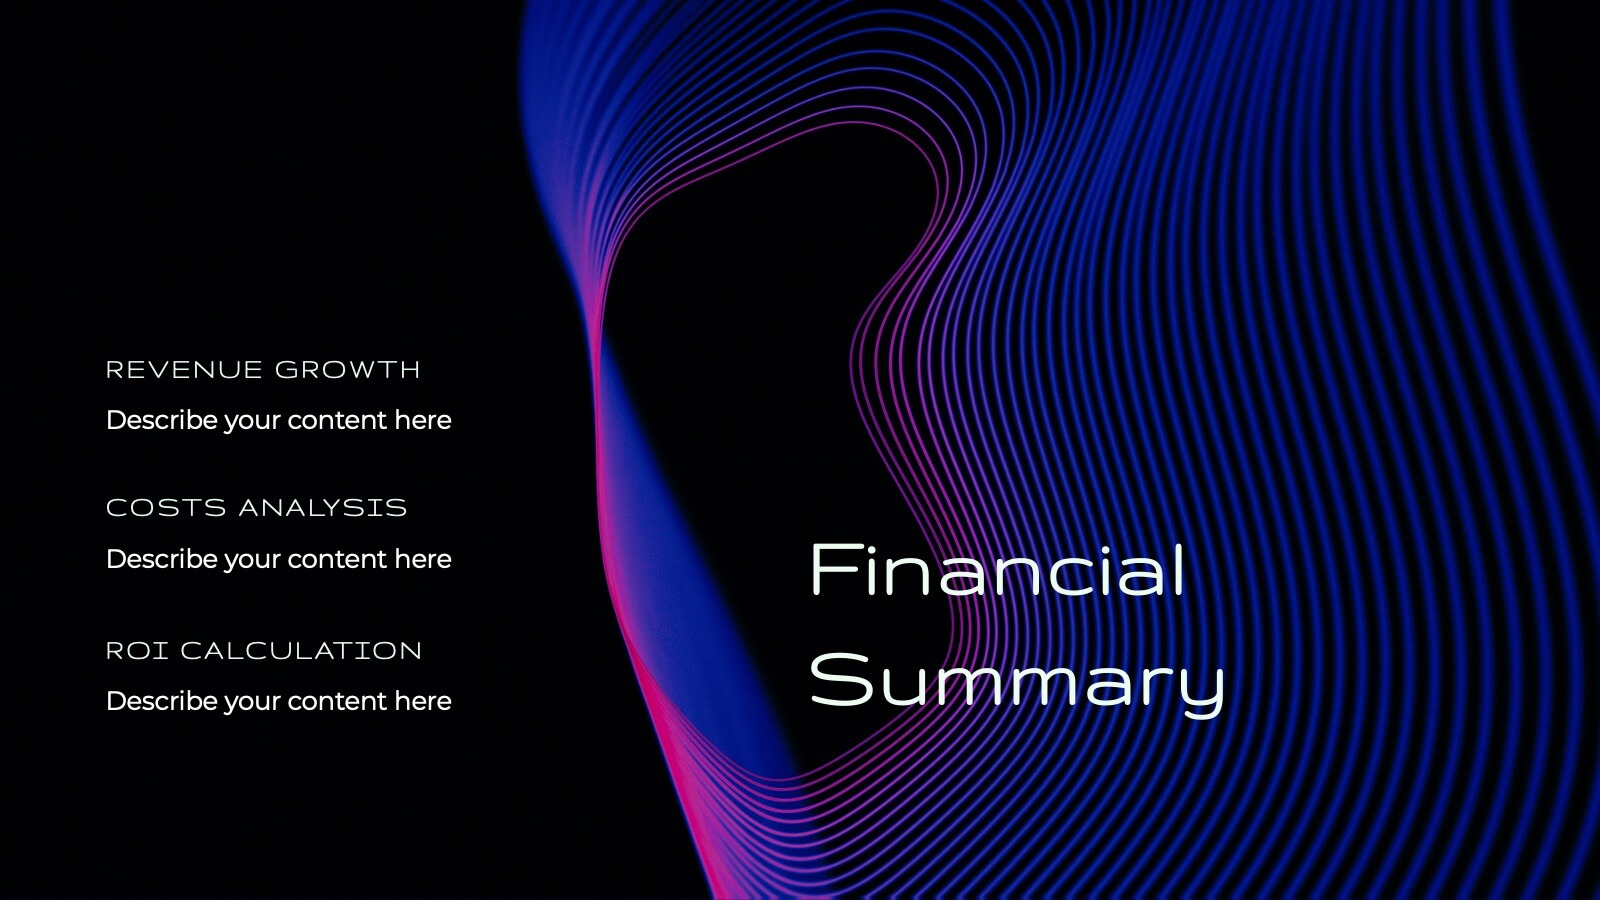
Agenda and Sections TOC Presentation
Bring your audience in with a dynamic, story-driven overview that makes each section feel intentional and easy to follow. This presentation highlights key agenda points in a clean, structured layout, helping you introduce topics with clarity and flow. Fully compatible with PowerPoint, Keynote, and Google Slides.


6 diapositivas
Organizational Structure Infographic
Organizational structure refers to the way in which an organization is structured and how its roles, responsibilities, and functions are defined and coordinated. This infographic template provides a framework for how individuals and teams work together to achieve the organization's goals. This infographic visually represents the hierarchy, roles, and relationships within an organization. This template allows you to provides a clear overview of how different departments, teams, and individuals are organized and how they interact with each other. Fully customizable and compatible with Powerpoint, Keynote, and Google Slides.


2 diapositivas
Target Audience and Persona Development Presentation
Bring your audience straight into the heart of your ideal customer with a vibrant, story-focused slide that highlights goals, motivations, data insights, and key pain points. This presentation makes it easy to communicate who you’re targeting and why it matters. Fully compatible with PowerPoint, Keynote, and Google Slides.


21 diapositivas
Flare Project Management Plan Presentation
Unleash the full potential of your projects with a dynamic plan template that makes every detail shine! This vibrant and clear design is built to guide your team and stakeholders through every phase of your project with confidence and clarity. Starting with a compelling introduction and project overview, this template captures attention and sets the stage for success. Dive deep into problem statements, objectives, and the scope of work, all presented in a visually appealing and easy-to-digest format. With sections dedicated to timelines, milestones, budget breakdowns, and resource allocation, this template ensures every aspect of your project is meticulously planned and communicated. The inclusion of stakeholder analysis, risk management, and quality assurance plans showcases your thorough approach to project management. Perfectly compatible with PowerPoint, Keynote, and Google Slides, this template is your go-to tool for creating project plans that are both inspiring and effective. Get ready to impress and lead your projects to success!


12 diapositivas
Simple Gantt Chart Template Presentation
Track your project progress at a glance with this Simple Gantt Chart Template. Featuring color-coded circles for weekly task planning across two timelines, it’s perfect for visual project tracking. Easily customizable for PowerPoint, Keynote, or Google Slides. Ideal for quick updates, team syncs, and keeping your workflow organized.


22 diapositivas
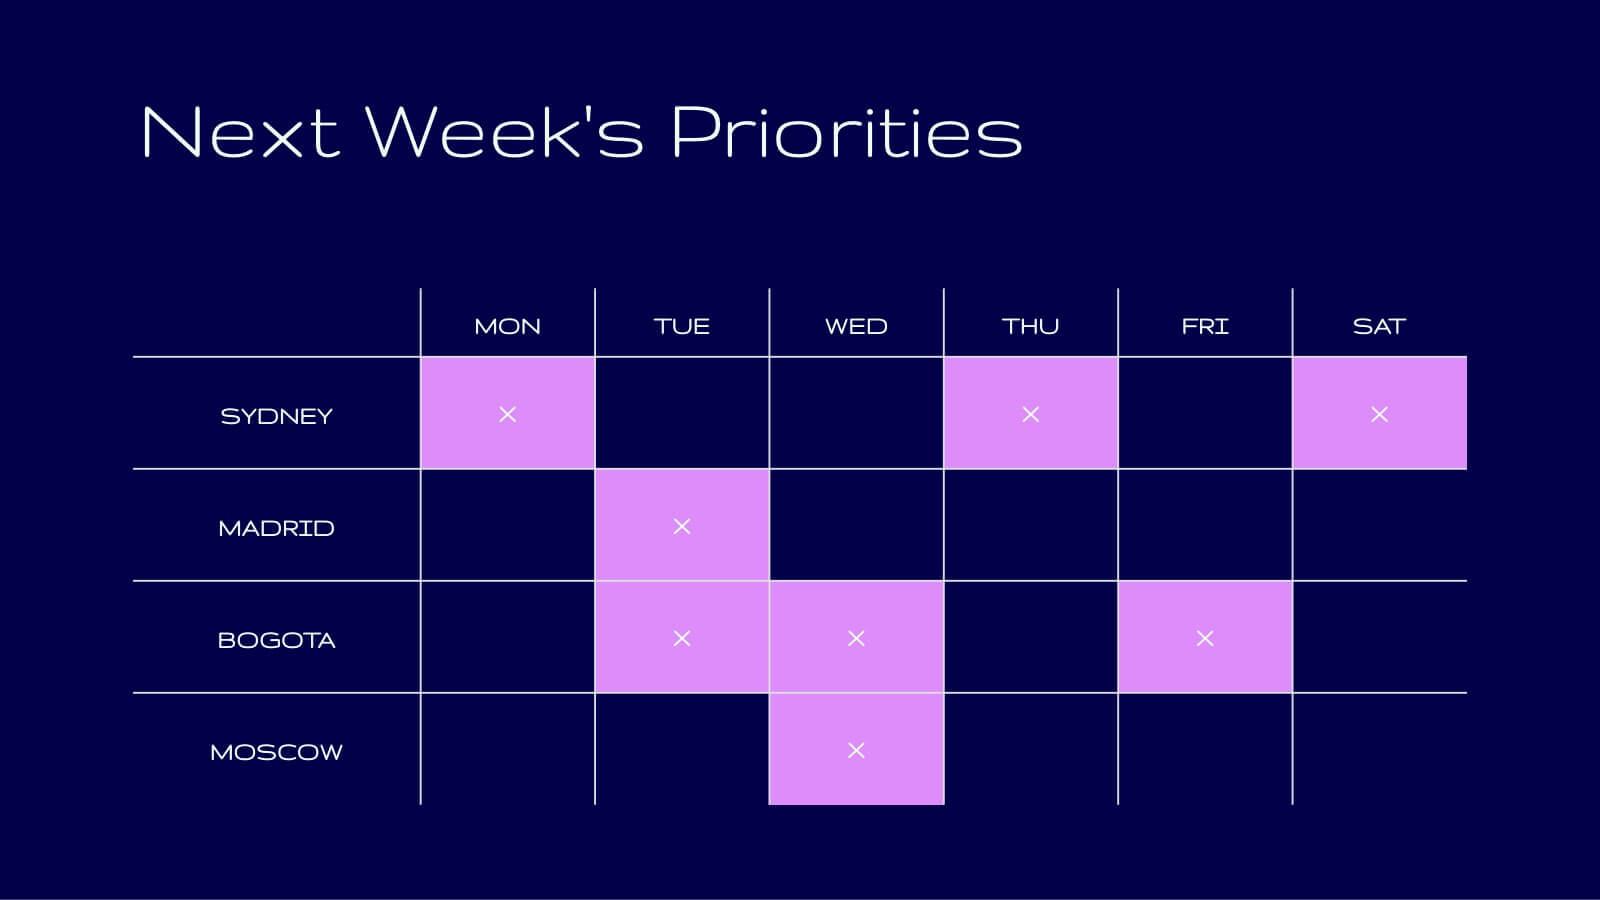
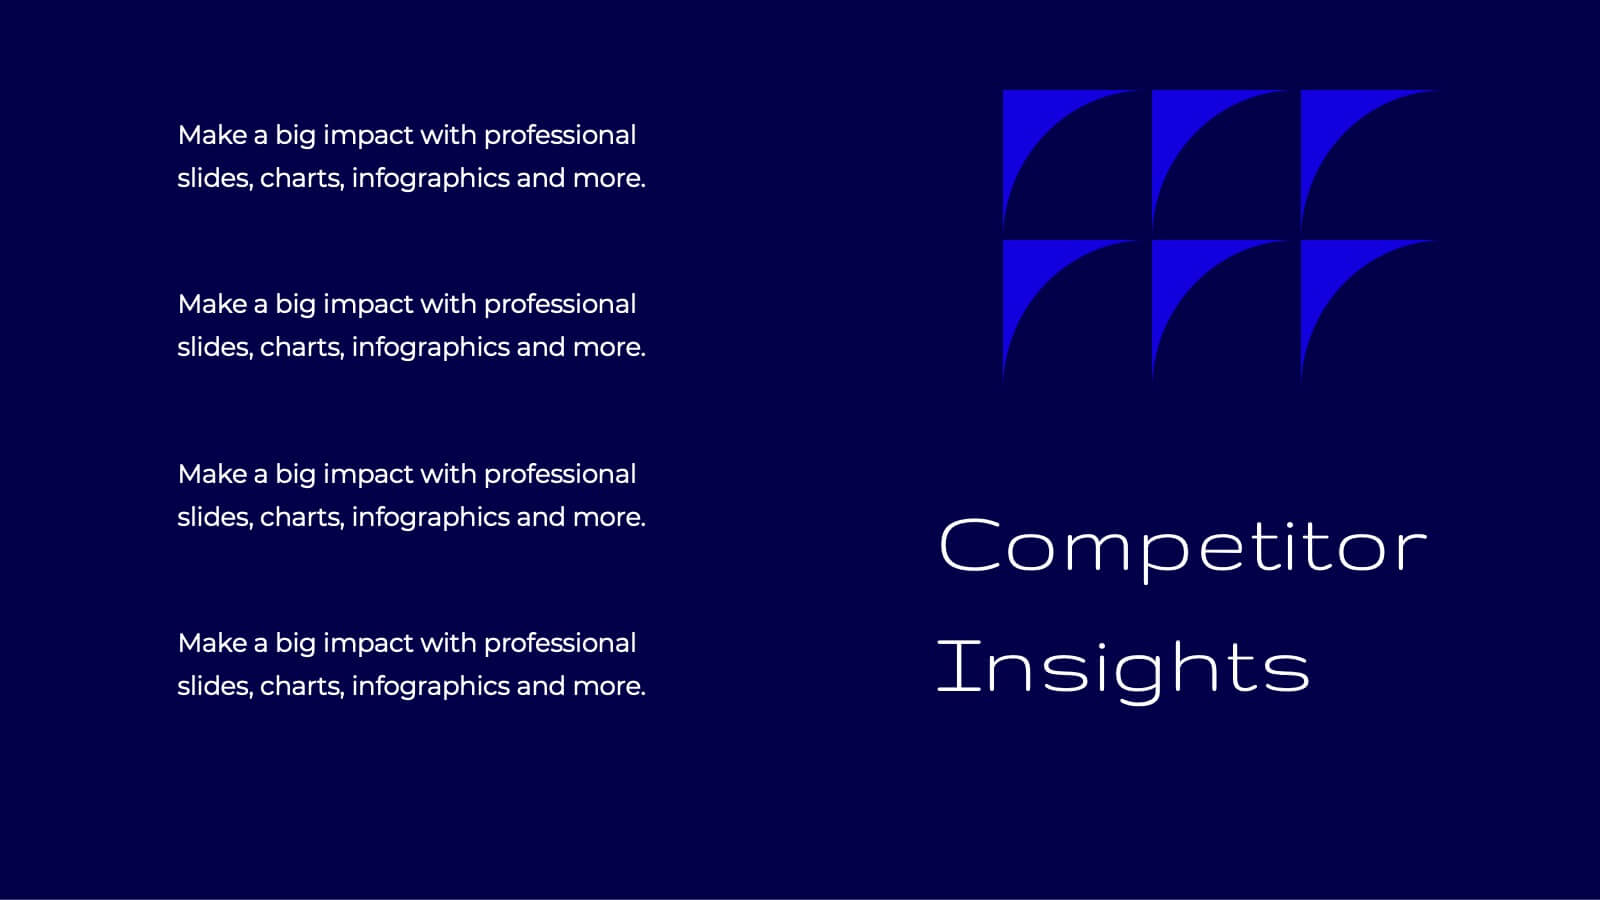
Tidal Research Findings Report Presentation
Deliver your research findings with impact using this sleek and modern report template! It covers key highlights, performance metrics, project progress, and competitor insights, making it ideal for clear, professional presentations. Perfect for summarizing challenges, solutions, and strategic initiatives. Compatible with PowerPoint, Keynote, and Google Slides for seamless reporting.


4 diapositivas
Workforce Skills Gap Plan Presentation
Ignite smarter workforce planning with a clear, engaging visual that highlights current capabilities, needed competencies, and actionable steps to close performance gaps. This presentation helps leaders map priorities, streamline development efforts, and strengthen team readiness for future demands. Fully compatible with PowerPoint, Keynote, and Google Slides.


8 diapositivas
3D Infographic Design Presentation
Make your data pop—literally—with a stacked design that brings depth and clarity to your message. This 3D infographic template helps break down layered concepts, step-by-step processes, or hierarchical data in a visually striking way. It’s fully customizable and compatible with PowerPoint, Keynote, and Google Slides for easy presentation building.


20 diapositivas
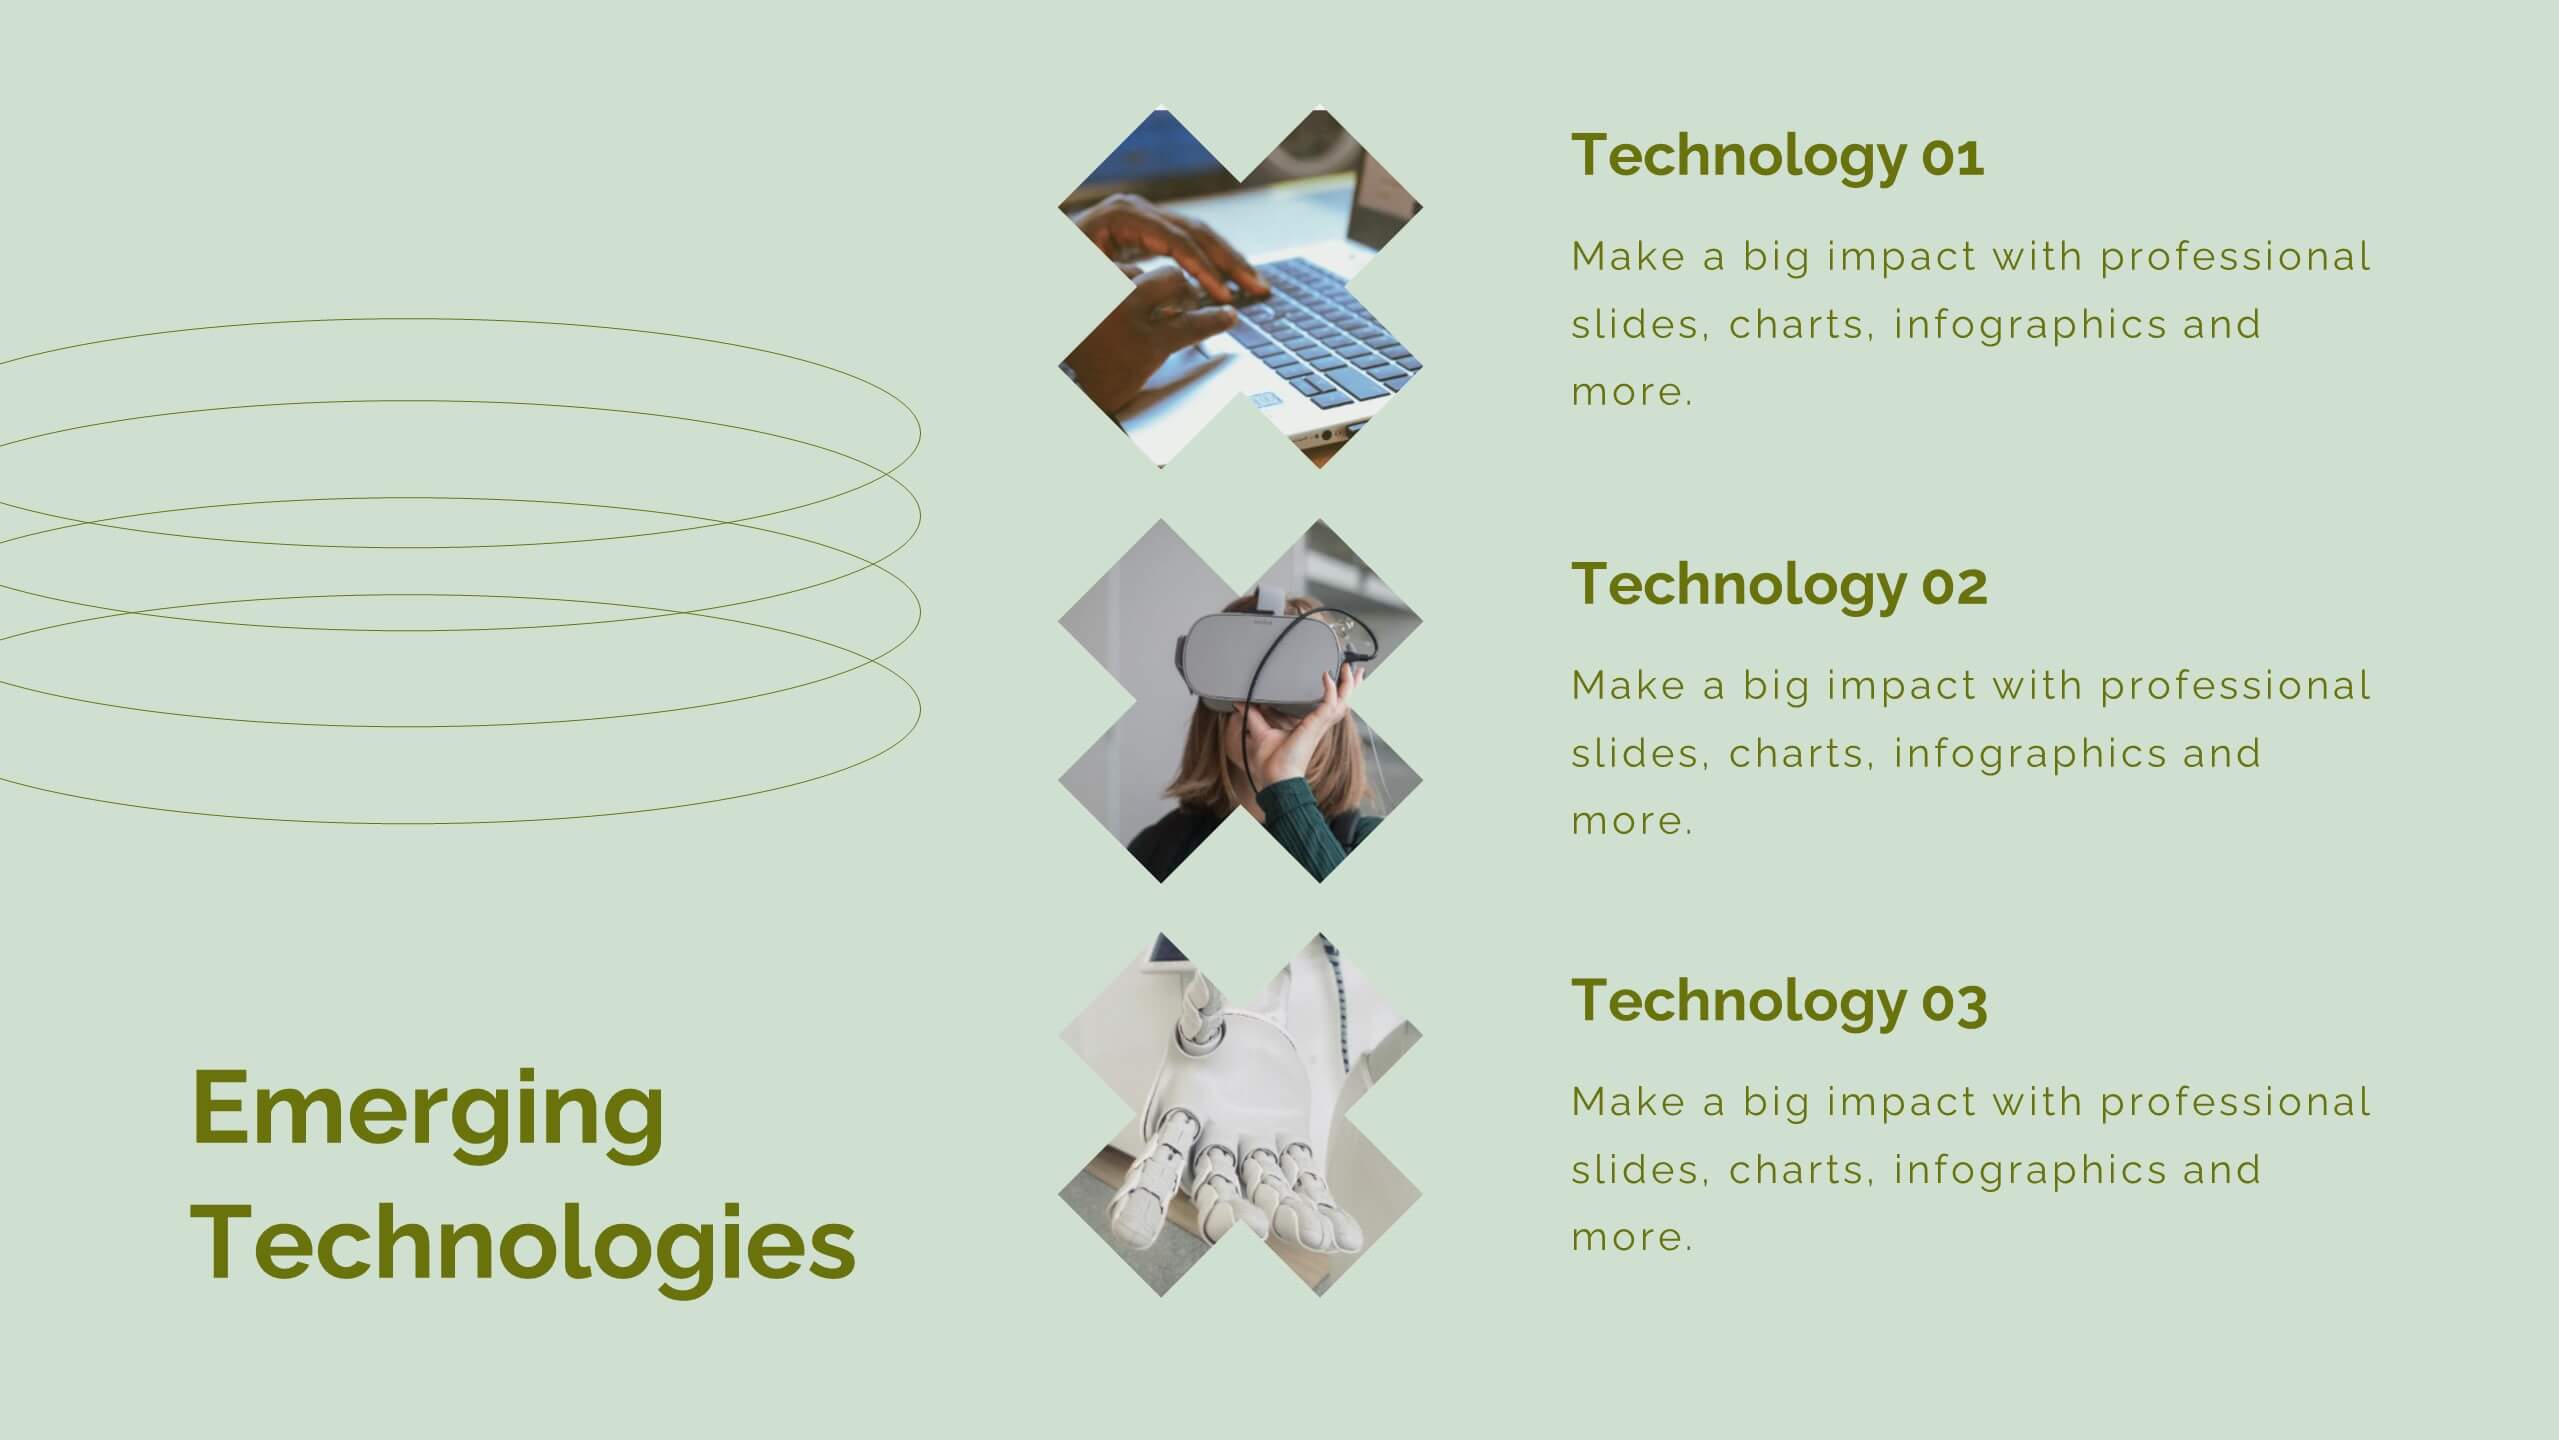
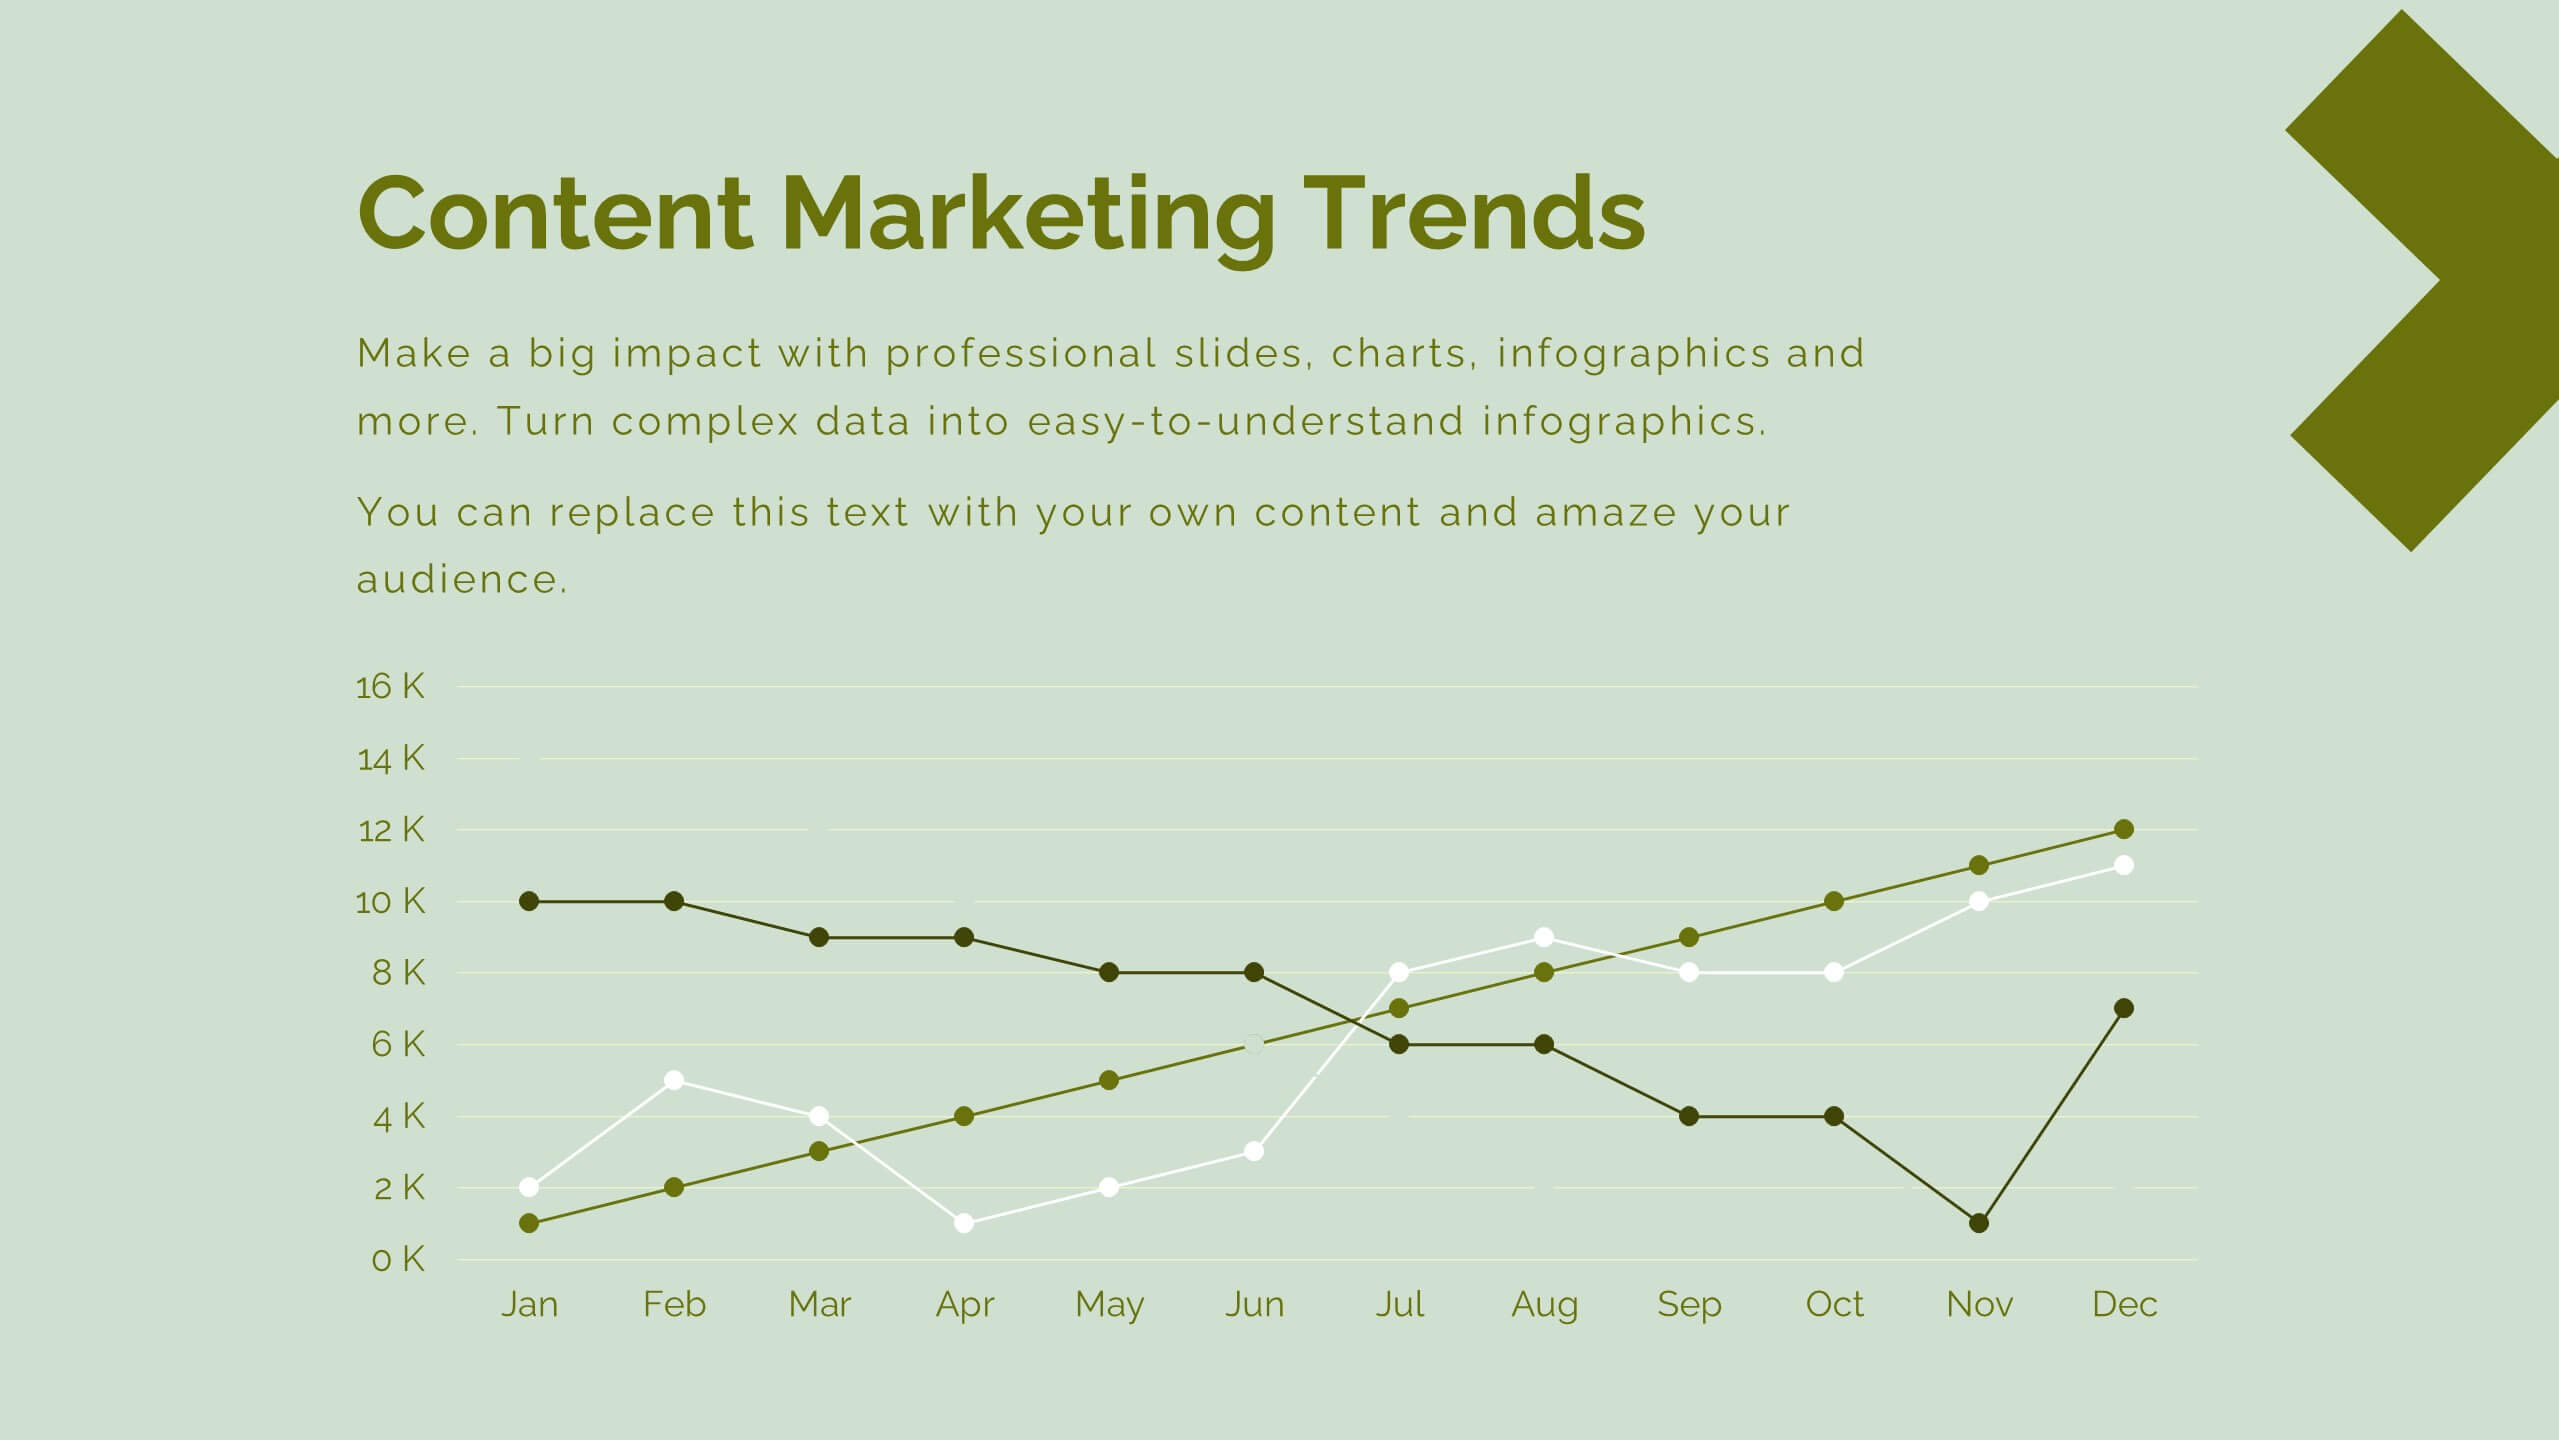
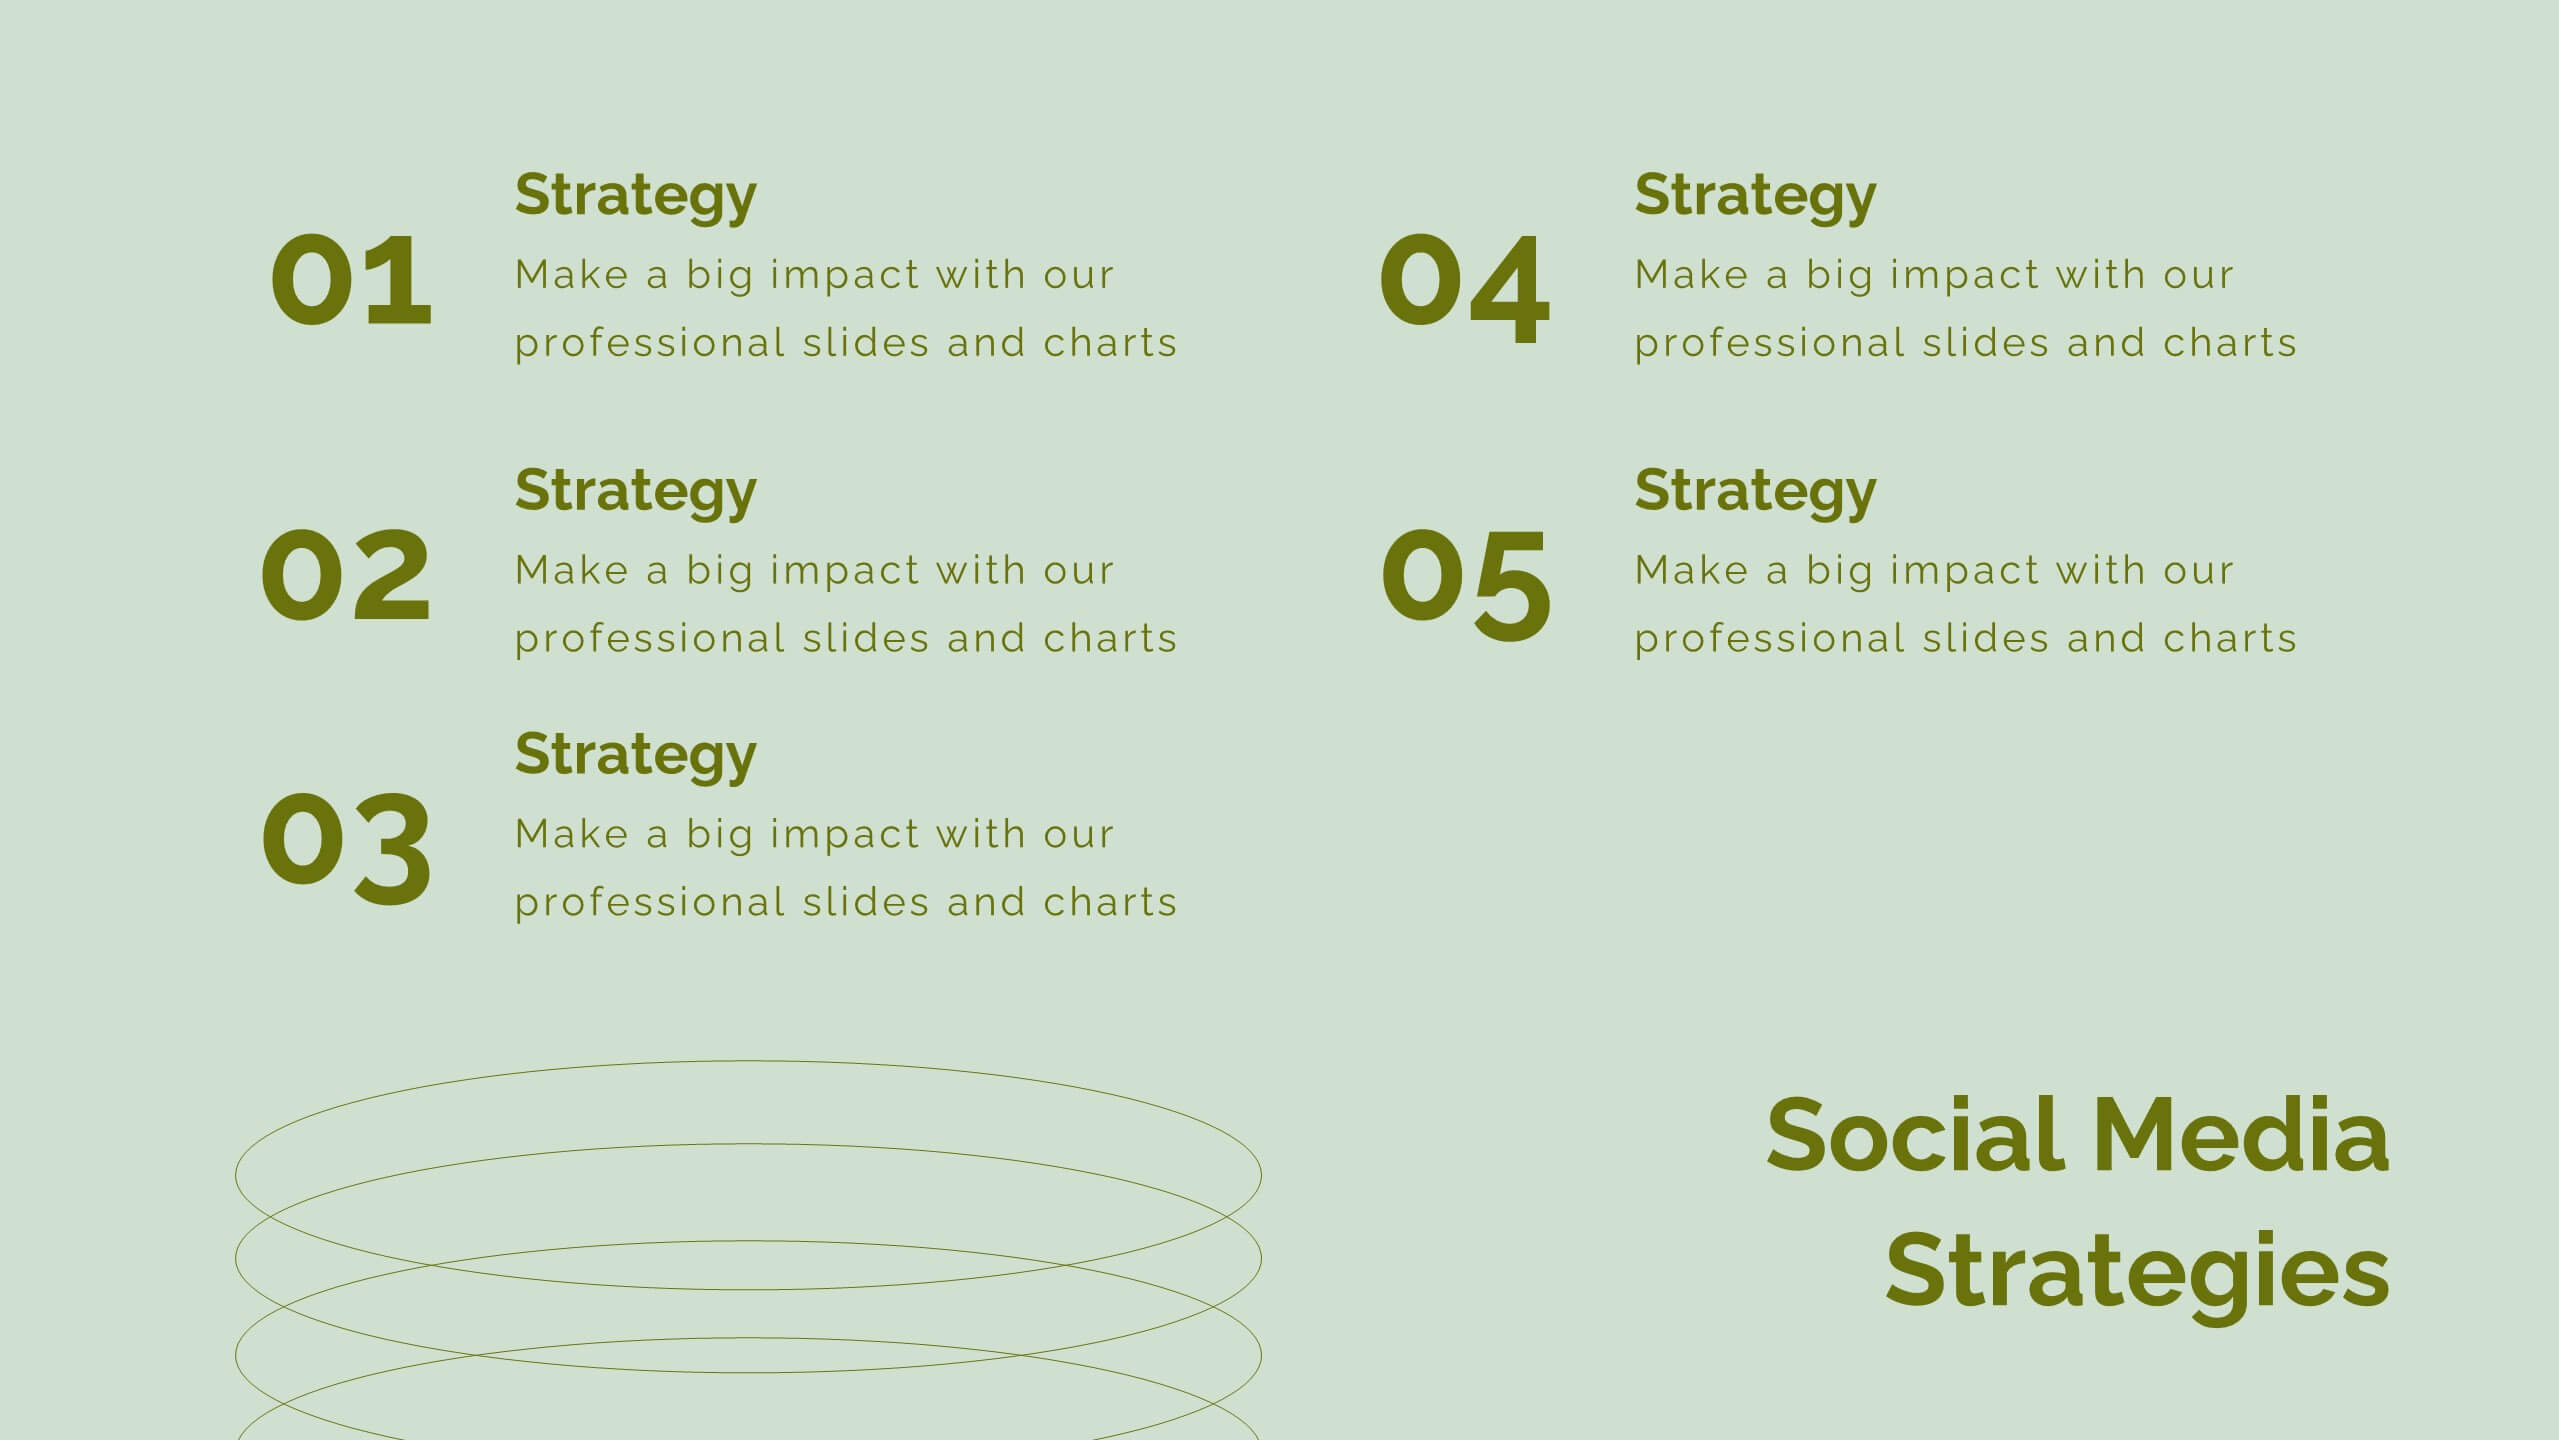
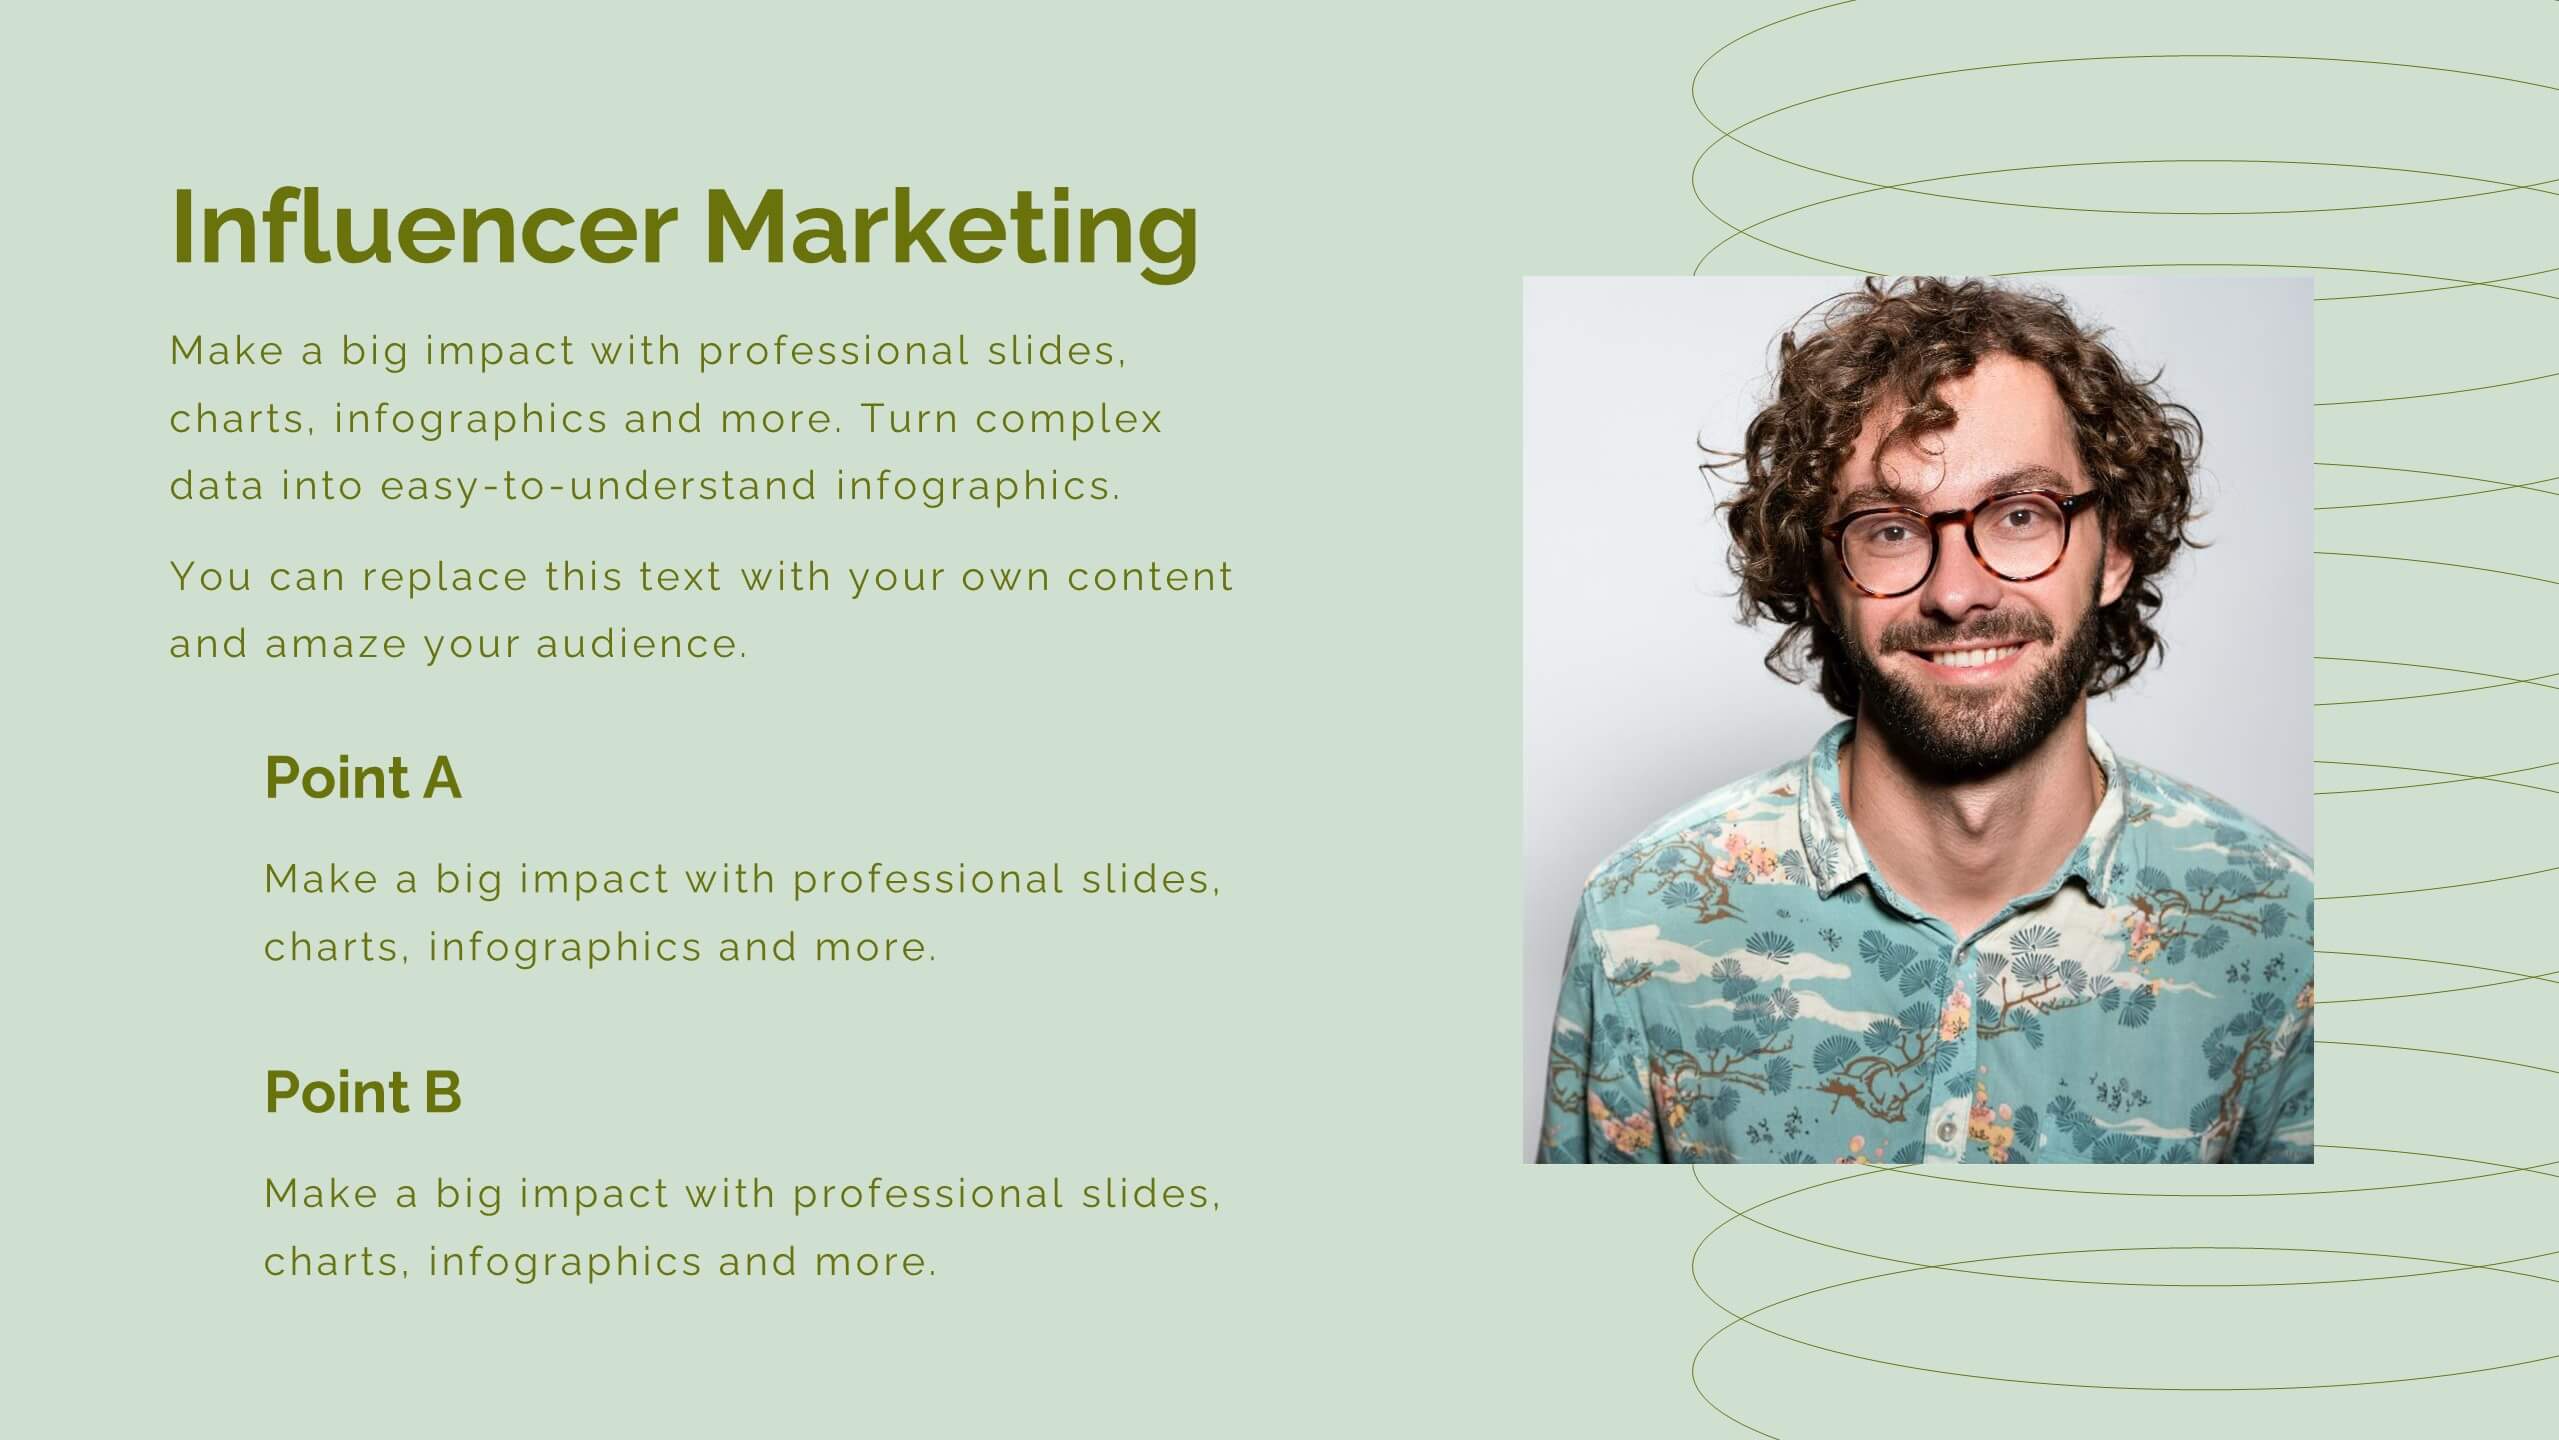
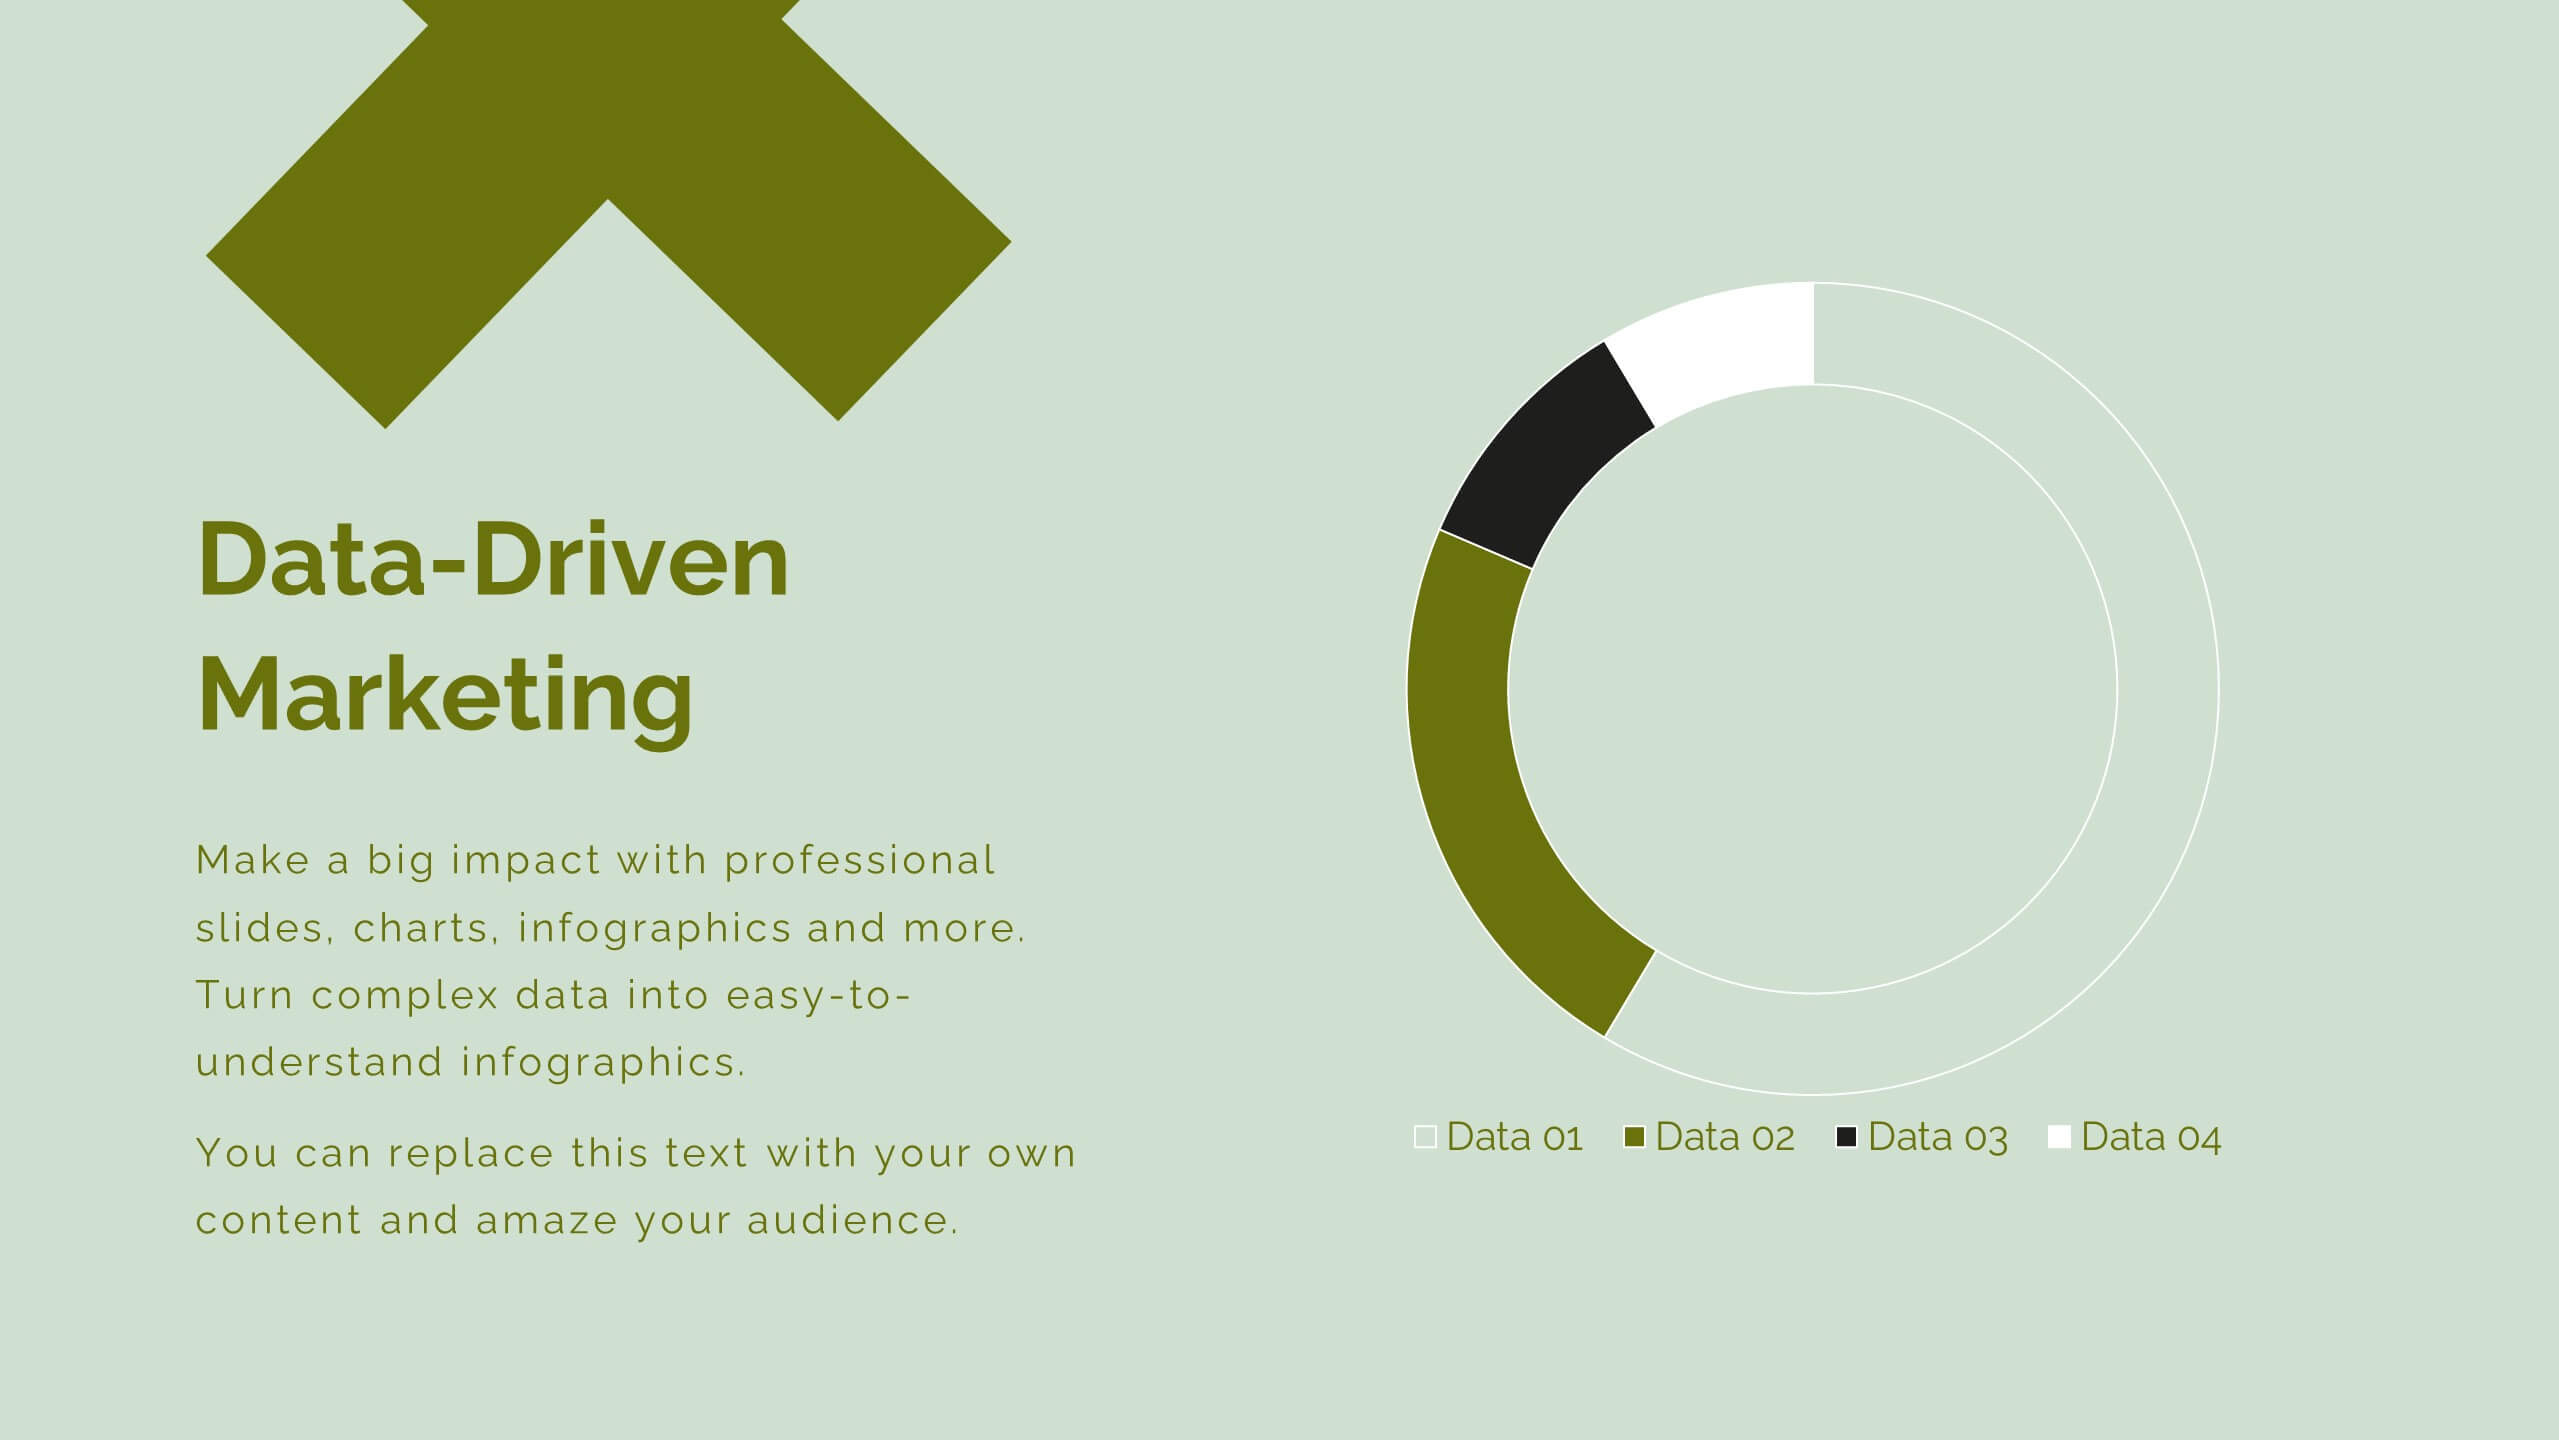
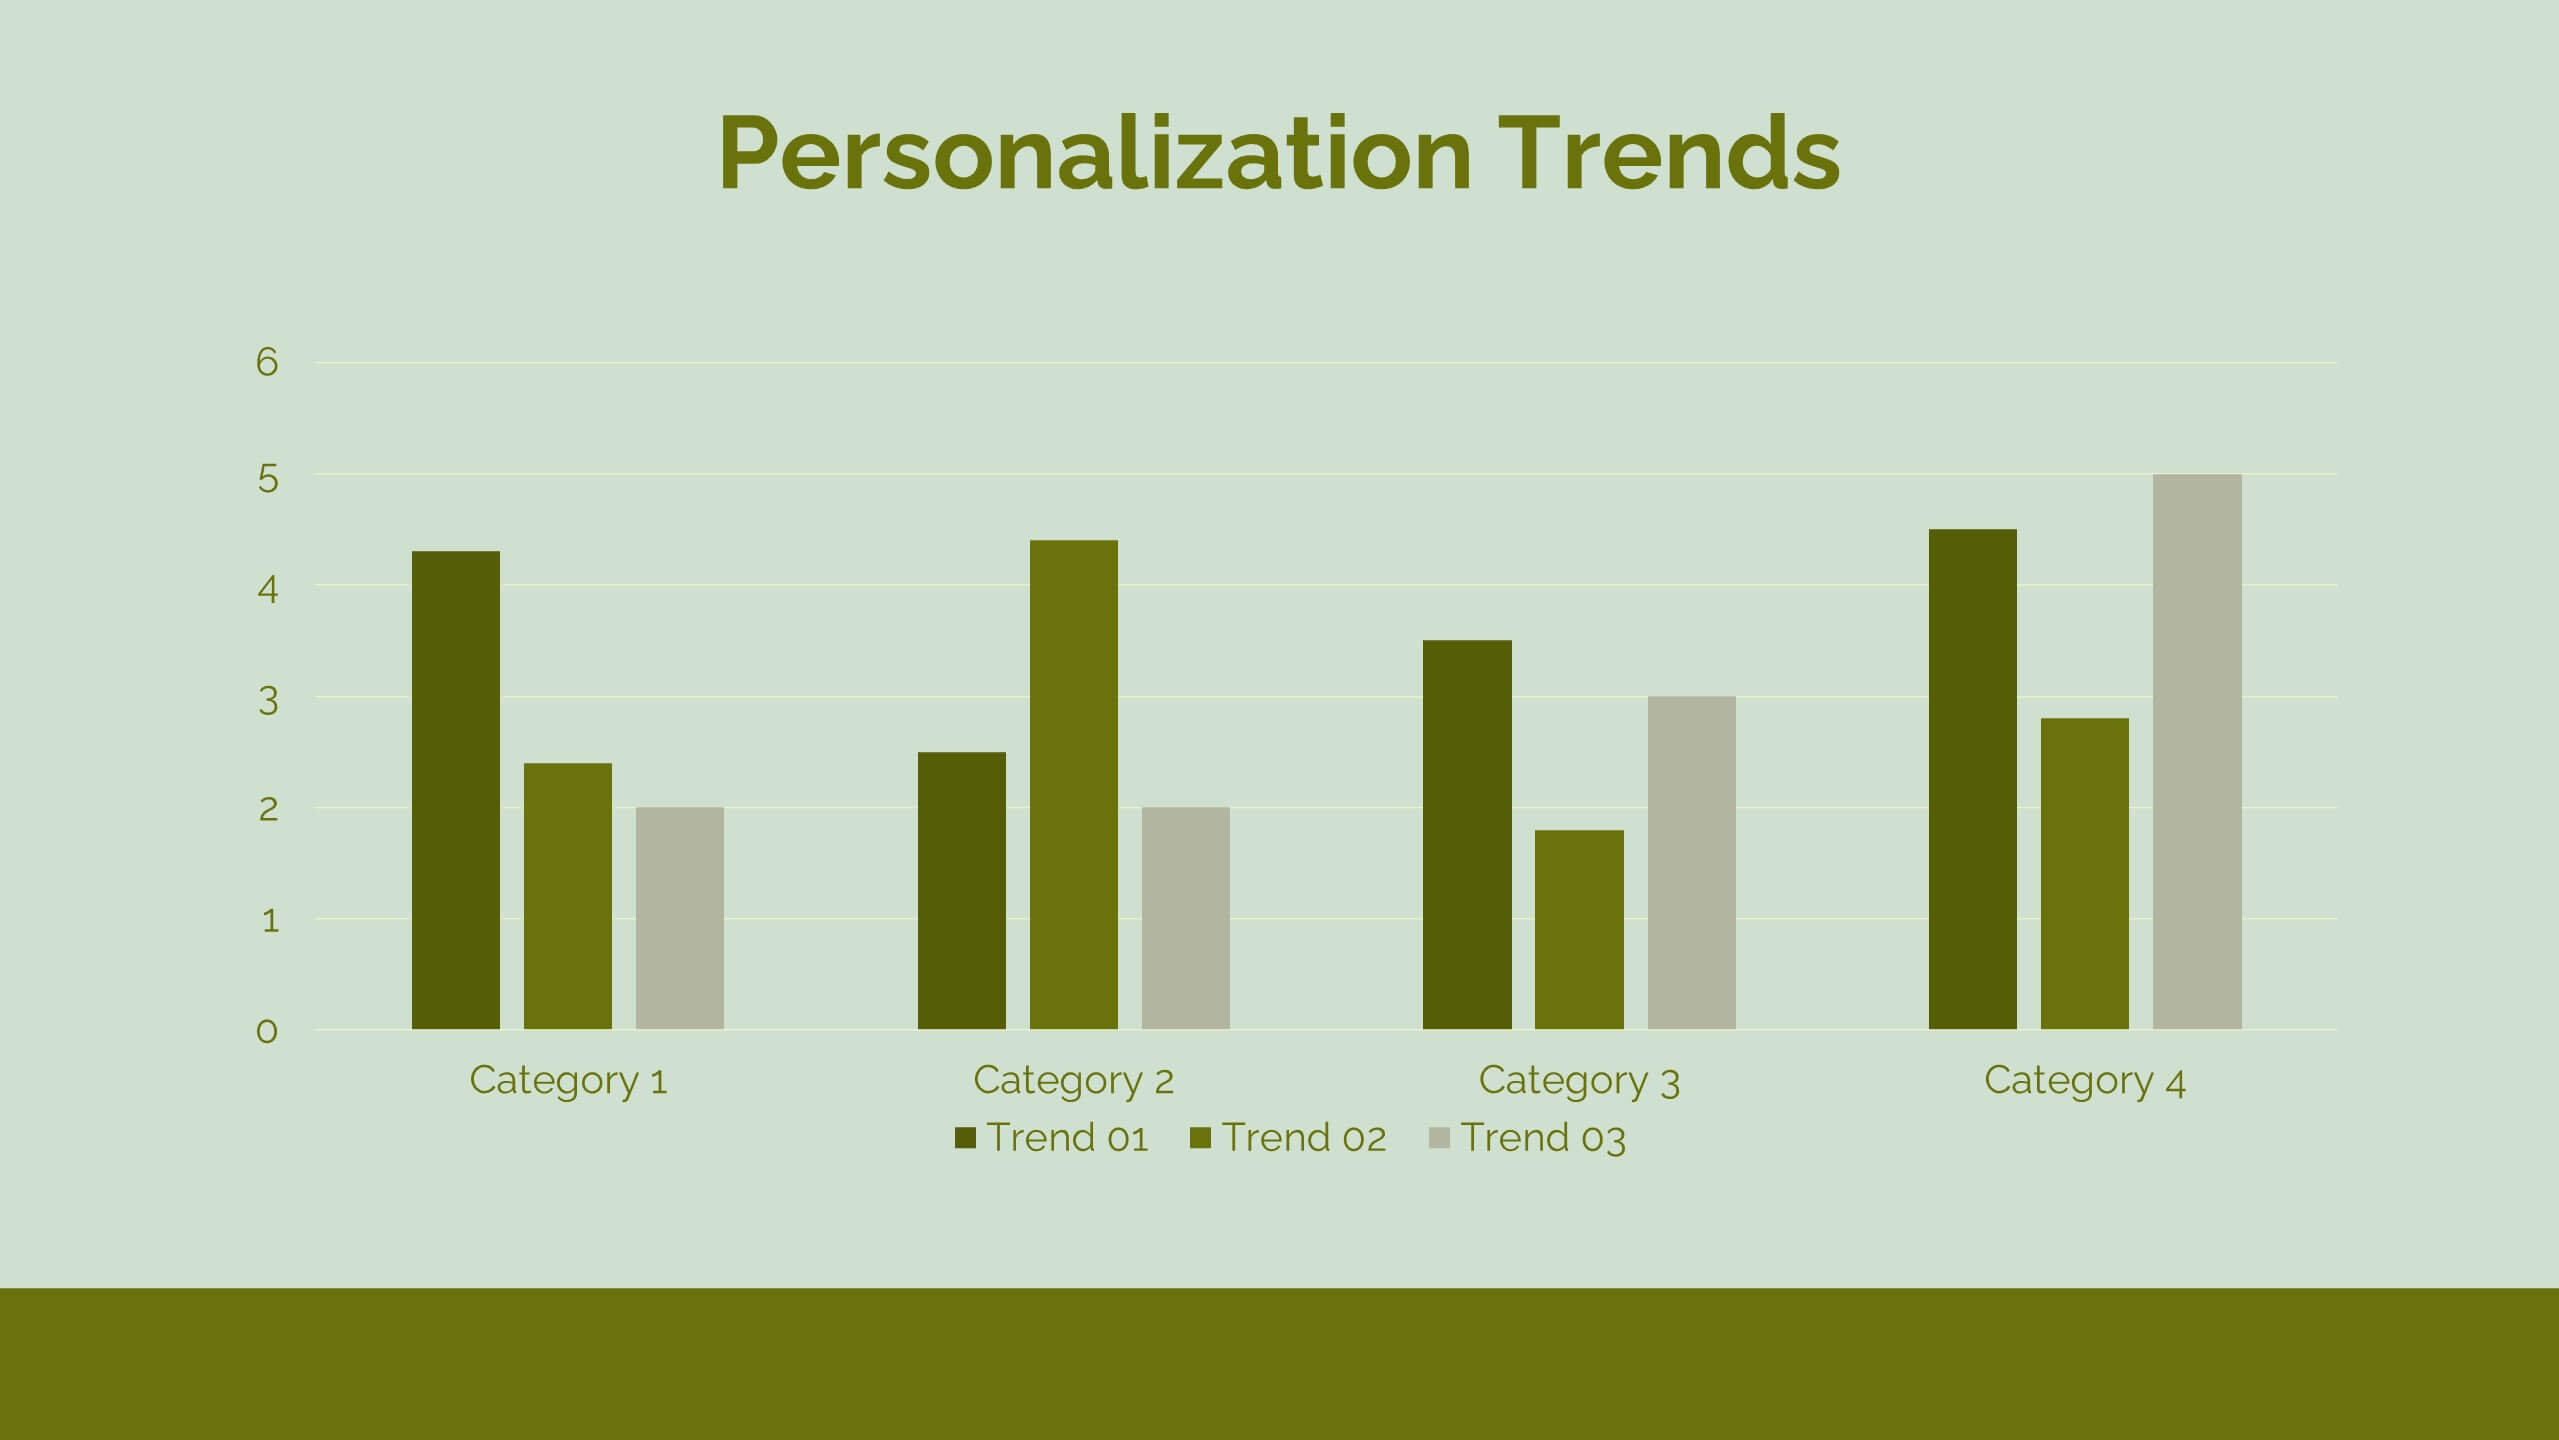
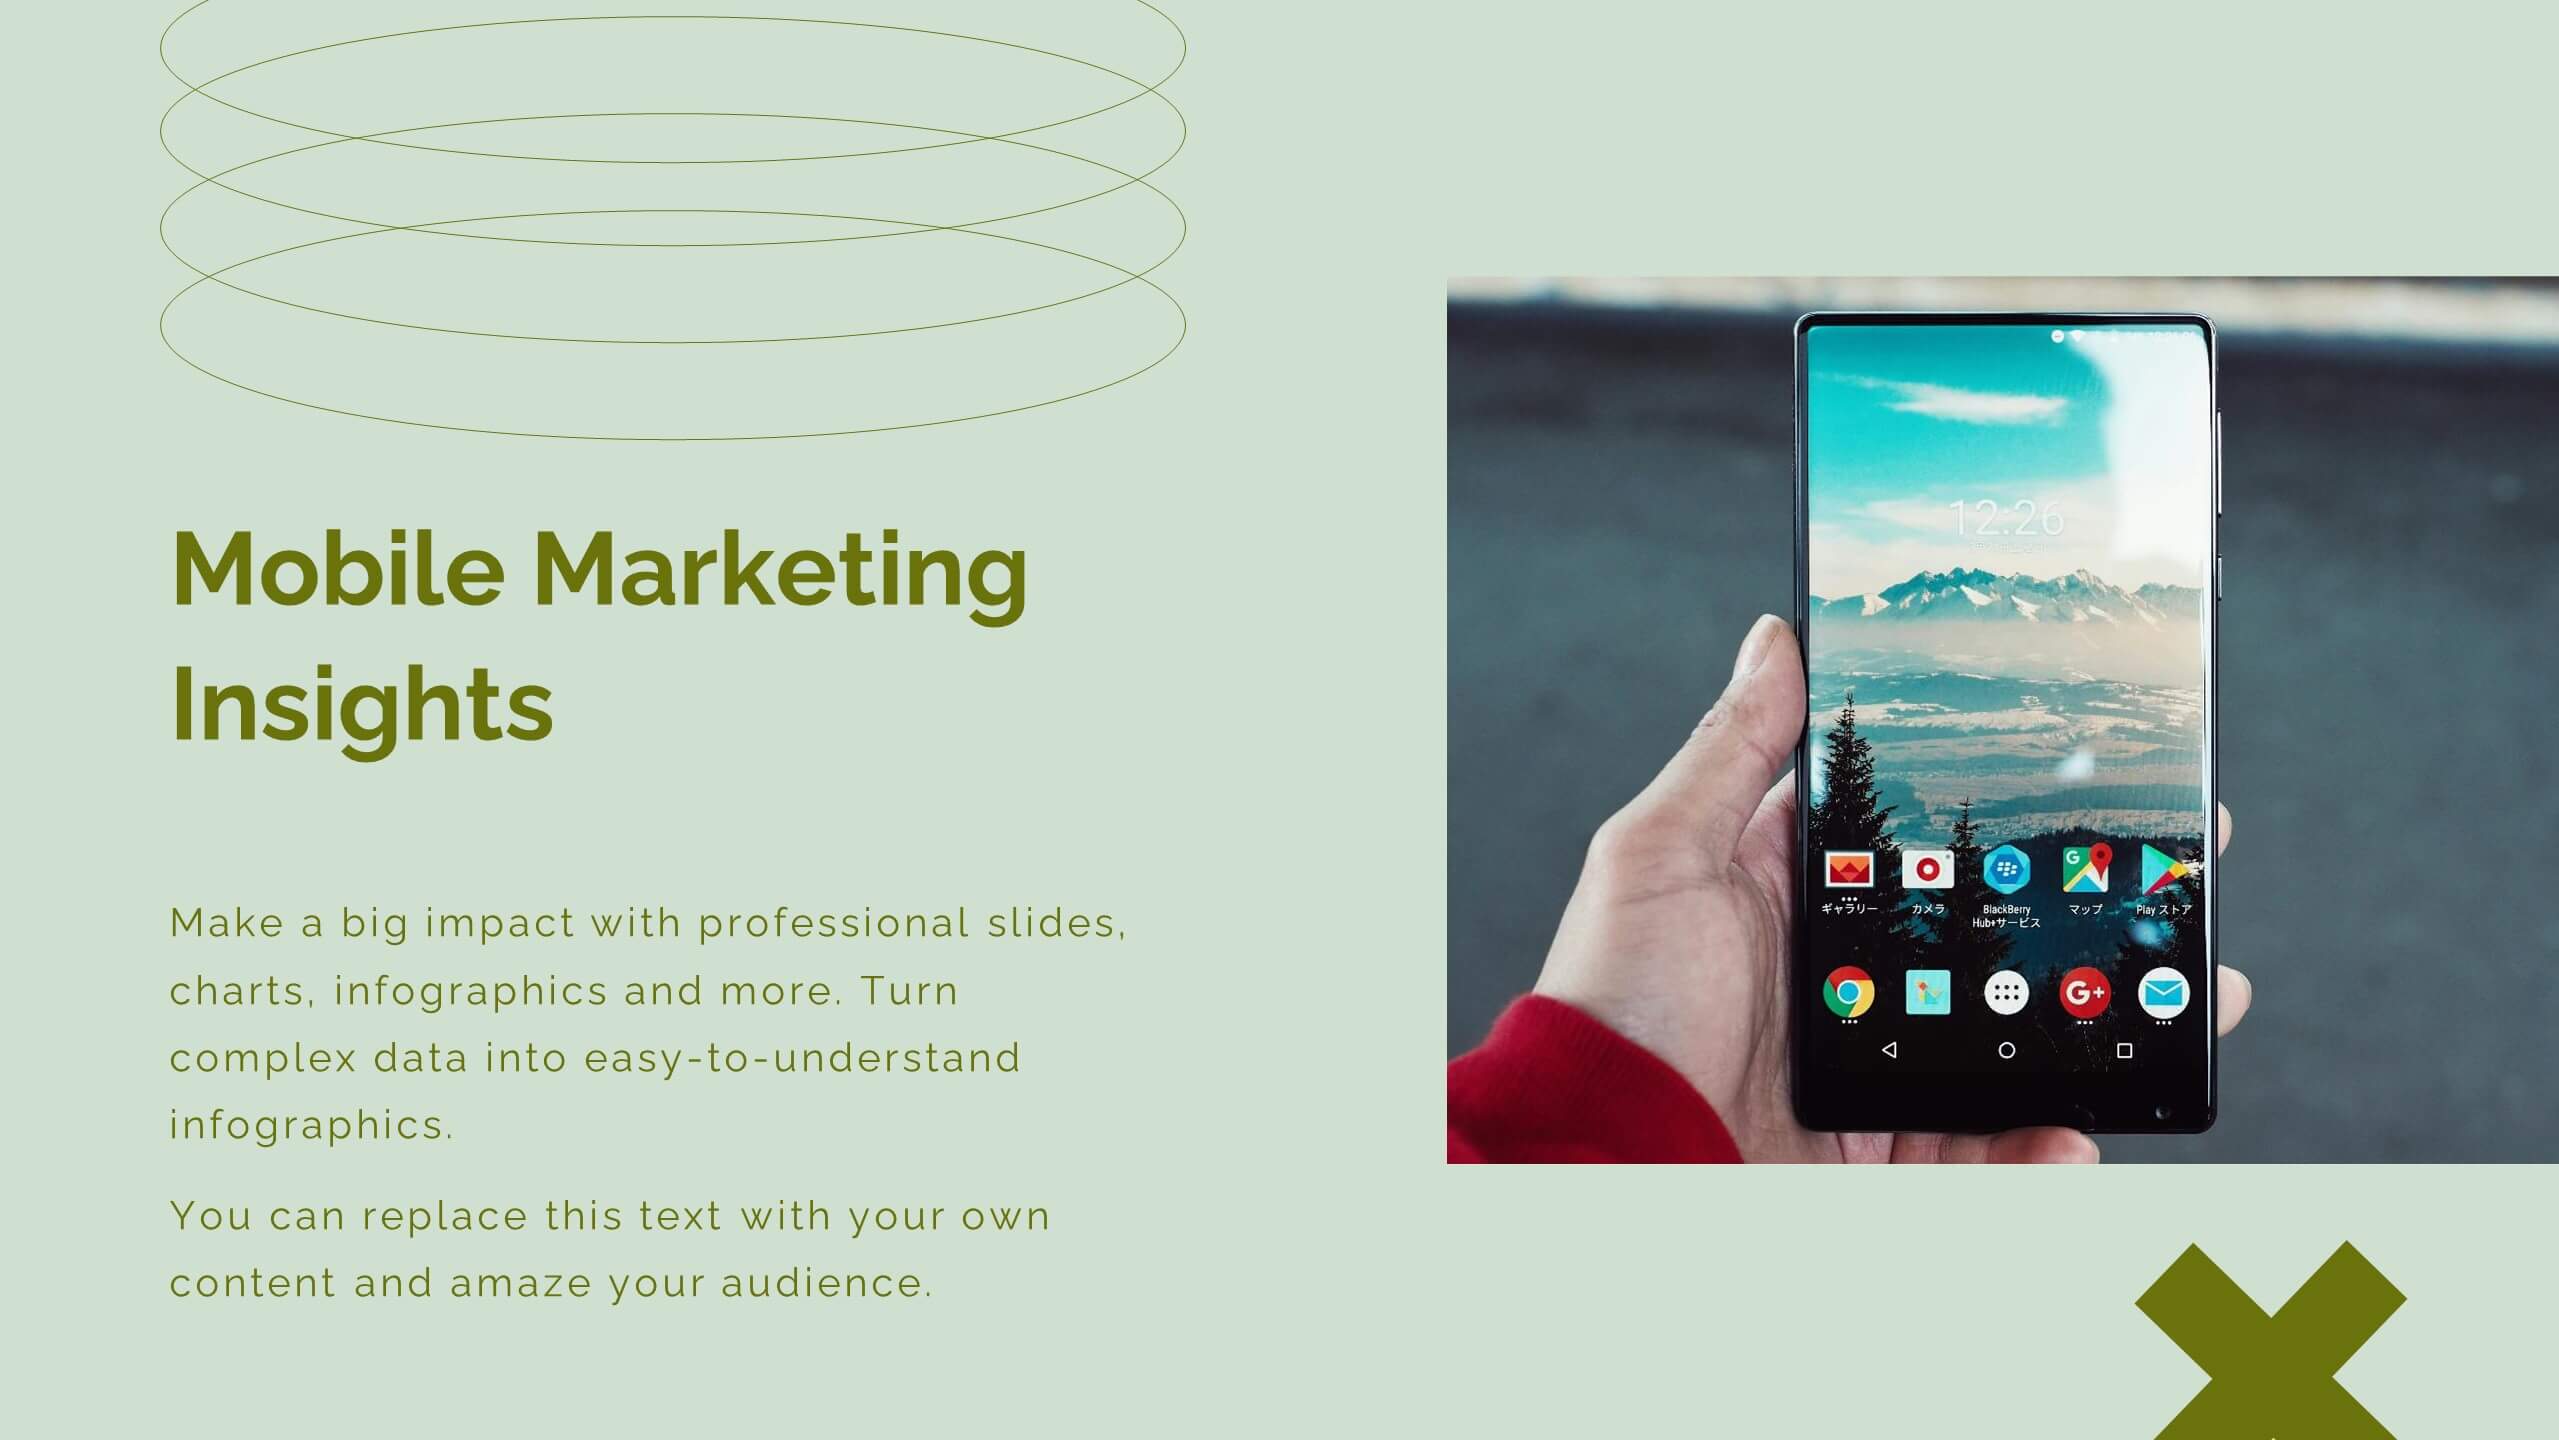
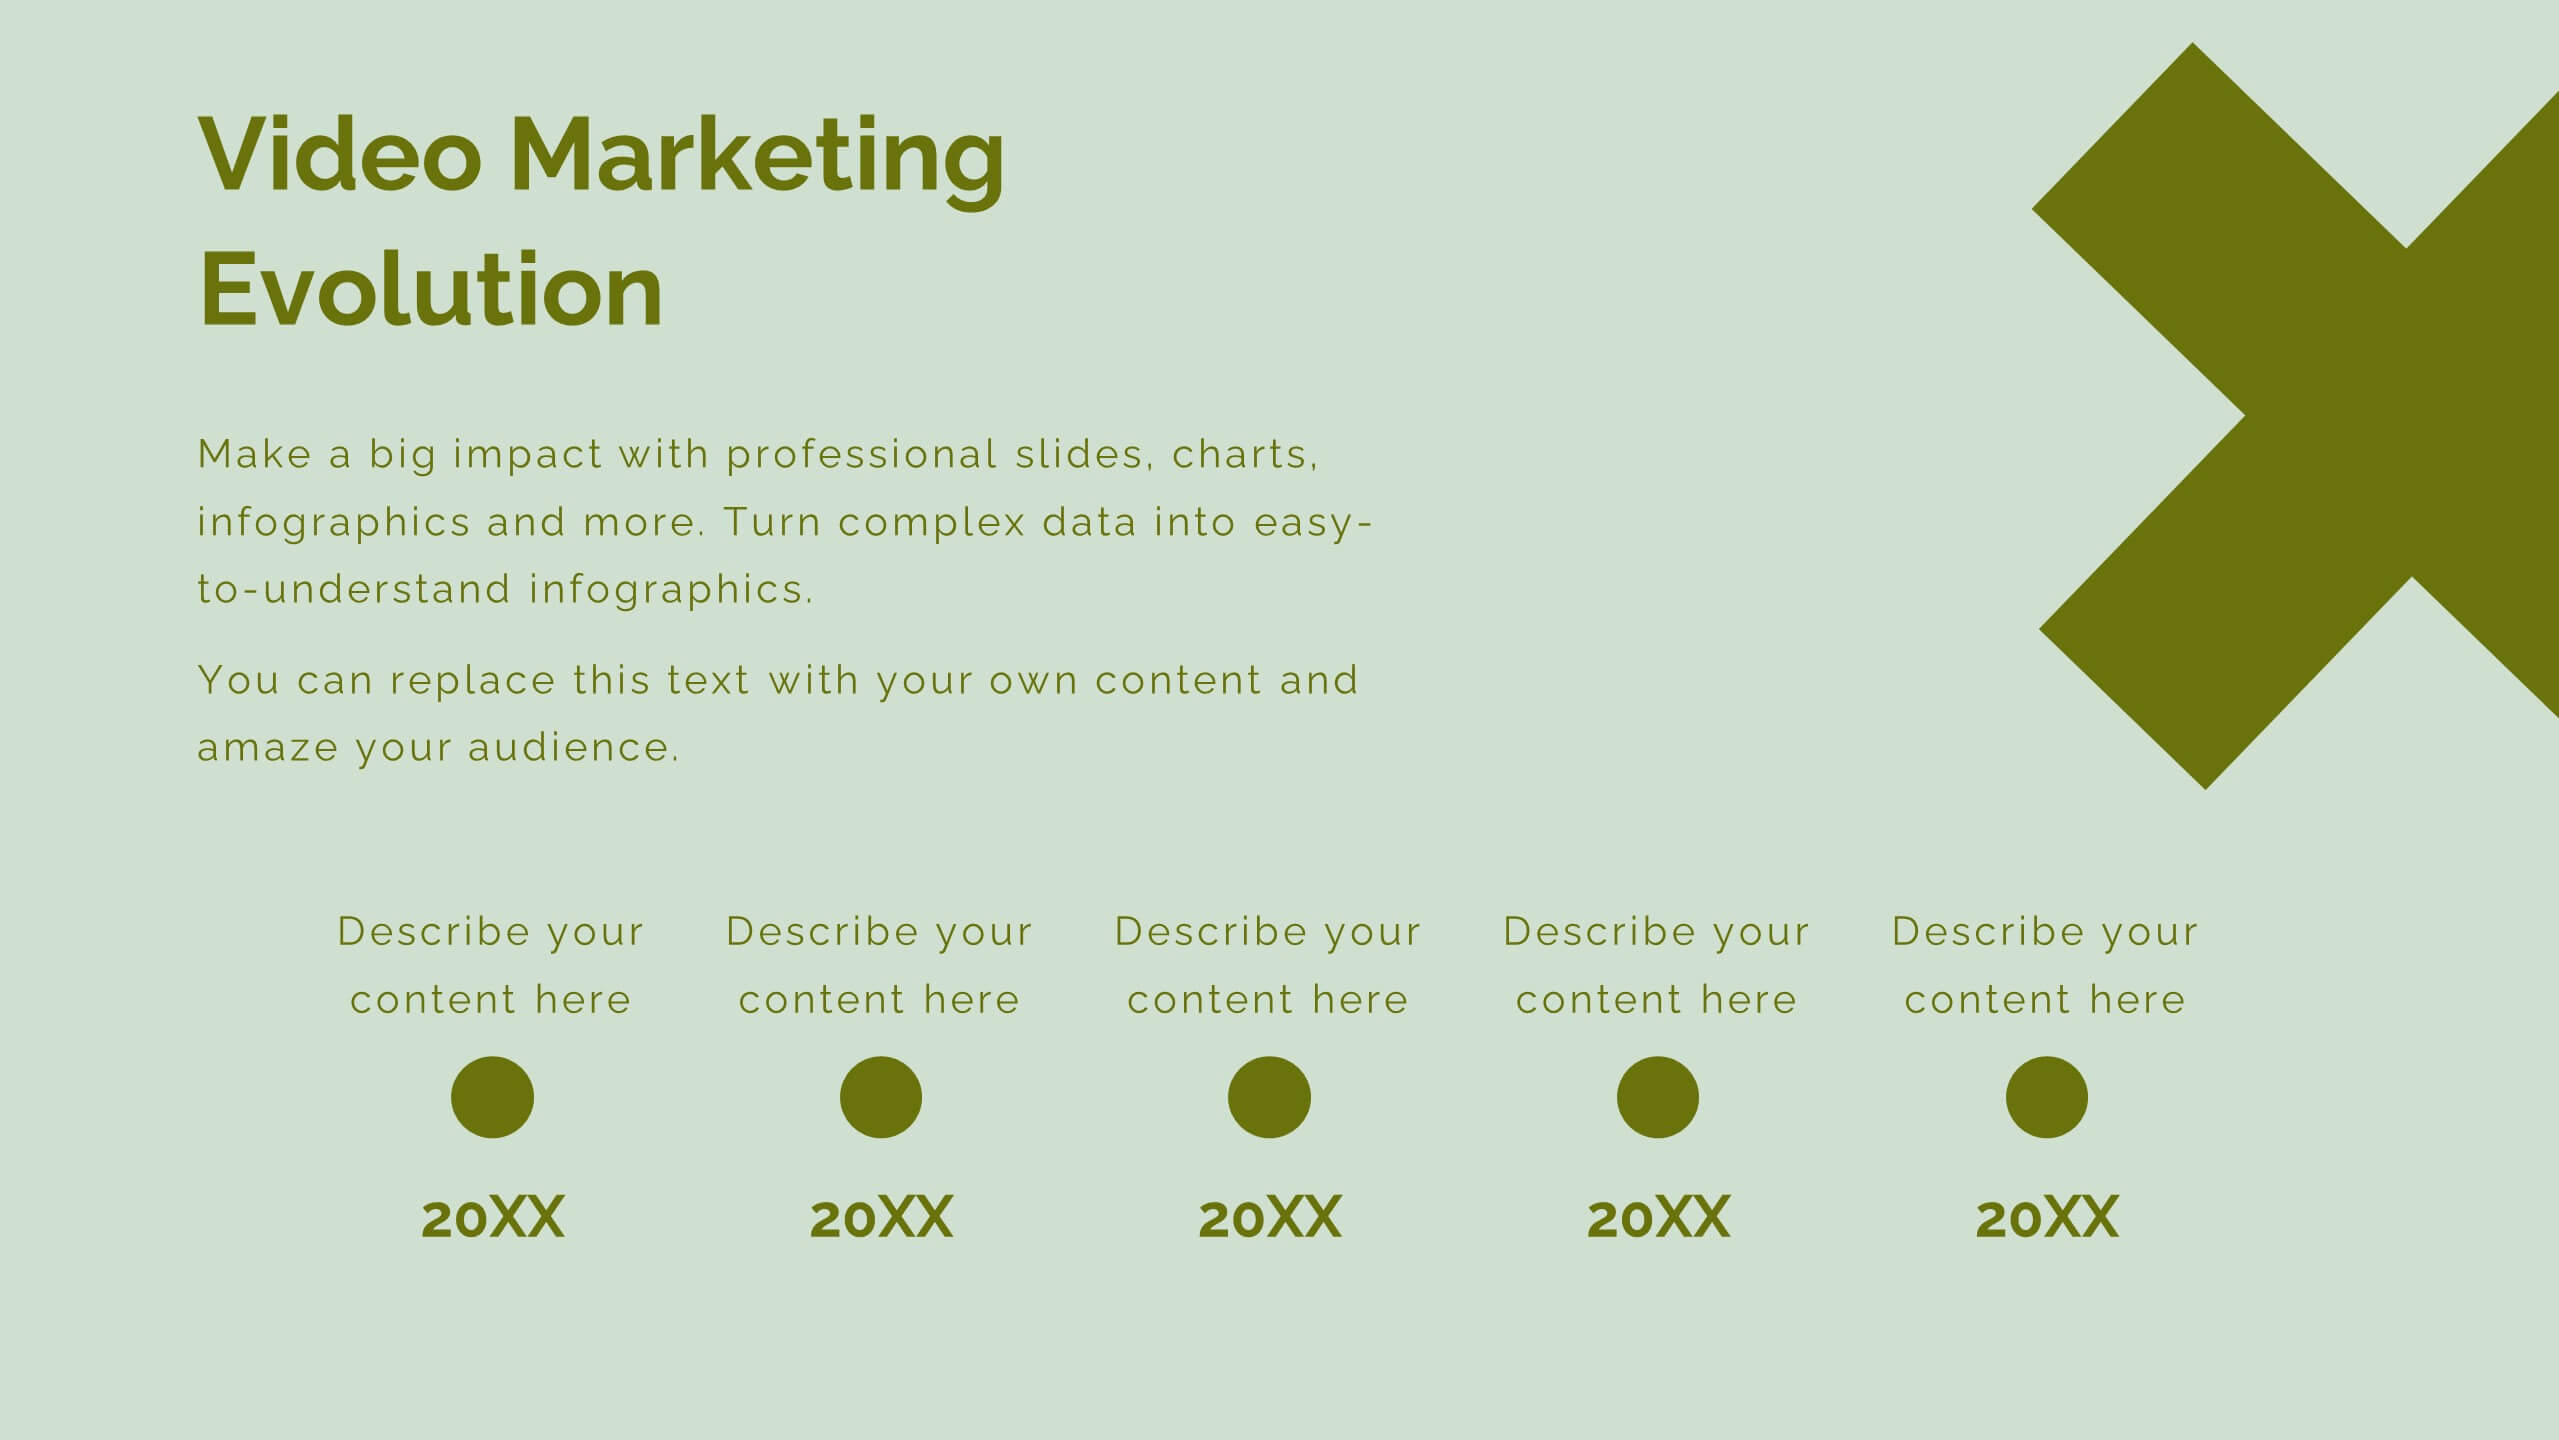
Aura Digital Marketing Strategy Plan Presentation
Revamp your digital marketing strategies with this dynamic template! Covering everything from industry overviews and consumer behavior analysis to emerging technologies and social media strategies, this template has it all. Perfect for creating compelling presentations that highlight data-driven marketing and brand storytelling. Compatible with PowerPoint, Keynote, and Google Slides.


6 diapositivas
Business Performance Dashboard
Enhance your business presentations with our "Business Performance Dashboard" template. This comprehensive infographic provides a detailed overview of crucial business metrics, structured within a user-friendly dashboard layout. It includes financial data like total orders and cash on hand, operational stats such as project updates, and engagement metrics including views and follows. Each section is visually distinct, with icons and color blocks that make data easy to read and analyze. Ideal for managers and analysts, this template offers a snapshot of company performance, facilitating informed decision-making and efficient reporting. Compatible with PowerPoint, Keynote, and Google Slides, it's an essential tool for any business analysis.


7 diapositivas
Progress Report Infographics
In the dynamic landscape of modern businesses, understanding and tracking progress is paramount. The progress report infographic, bathed in hues of blue, orange, and yellow, offers a concise yet comprehensive snapshot of advancements and milestones. Created for managers, team leads, and stakeholders in mind, this tool aids in monitoring, communicating, and celebrating growth. Whether you're analyzing quarter-to-quarter performance or year-end overviews, its versatility ensures coherence and clarity. With seamless integration capabilities for PowerPoint, Keynote, and Google Slides, this infographic is primed to elevate any business presentation.