


Características


¿Tienes alguna pregunta?
Recomendar


8 diapositivas
Social Media Engagement Metrics
Track engagement with clarity using the Social Media Engagement Metrics Presentation. This layout features a smartphone mockup at the center, with four vertically stacked icons representing key engagement indicators. Surrounding the device, space is allocated for concise data insights or definitions labeled A through D. Perfect for presenting analytics like likes, shares, comments, and reach. Fully editable in PowerPoint, Keynote, and Google Slides.


4 diapositivas
Digital Marketing and SEO Best Practices Presentation
Communicate your digital strategy with this clean and structured visual layout. This template features a horizontal flowchart design with four circular icons branching from a central infographic, allowing you to showcase core areas such as audience targeting, content creation, performance analytics, and ranking improvement. Ideal for marketers, consultants, and SEO professionals. Fully editable in PowerPoint, Keynote, and Google Slides.


8 diapositivas
Sustainable Operation & Ethical Practice Presentation
Illustrate your ethical initiatives and operational sustainability with this water drop flow diagram. Ideal for outlining four key actions or principles, it features a faucet visual and icon-based content drops. Fully customizable in PowerPoint, Keynote, and Google Slides—perfect for ESG reporting, CSR updates, and eco-conscious business presentations.


4 diapositivas
Career Onboarding 30 60 90 Day Presentation
Start strong with a clean, uplifting layout that makes each milestone in the onboarding journey feel clear, motivating, and easy to follow. This presentation helps you outline expectations, track early progress, and communicate development goals with confidence and clarity. Fully editable and compatible with PowerPoint, Keynote, and Google Slides.


6 diapositivas
Matrix Diagram
A matrix diagram, also known as a matrix chart, is a visual tool used to analyze and organize complex information by displaying it in a matrix format. This infographic template provides a visual framework for analyzing complex information, and improving understanding of relationships between different elements or factors. This template allows users to effectively communicate complex relationships and categorize information using a matrix format. This is perfect to use in a wide range of contexts, including project management, problem-solving, decision-making, strategic planning, and data analysis.


21 diapositivas
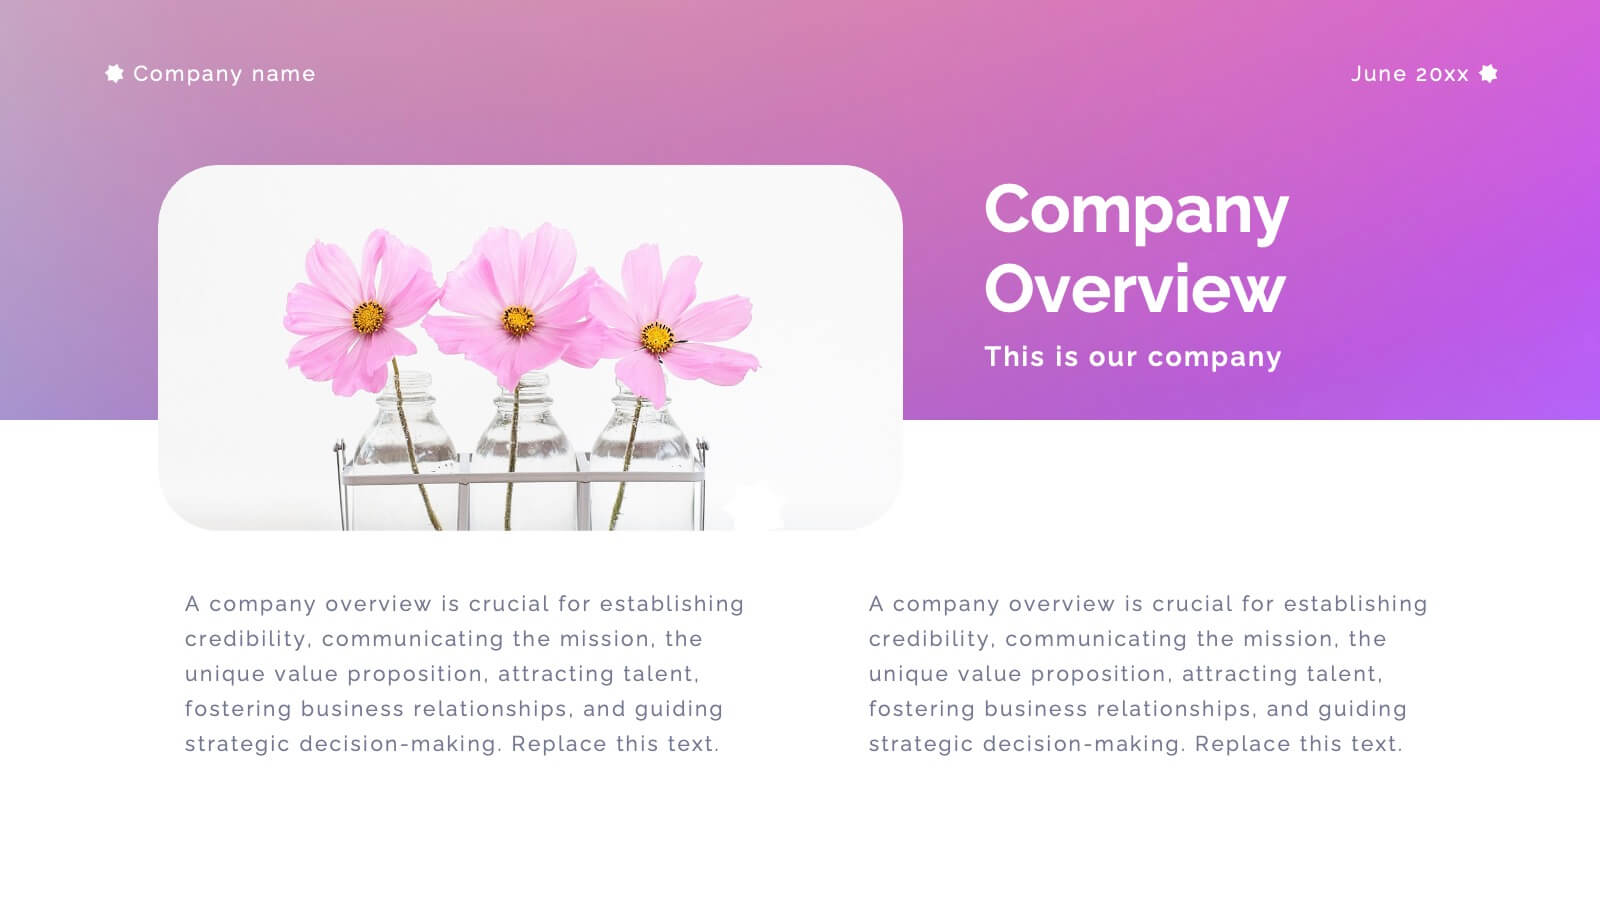
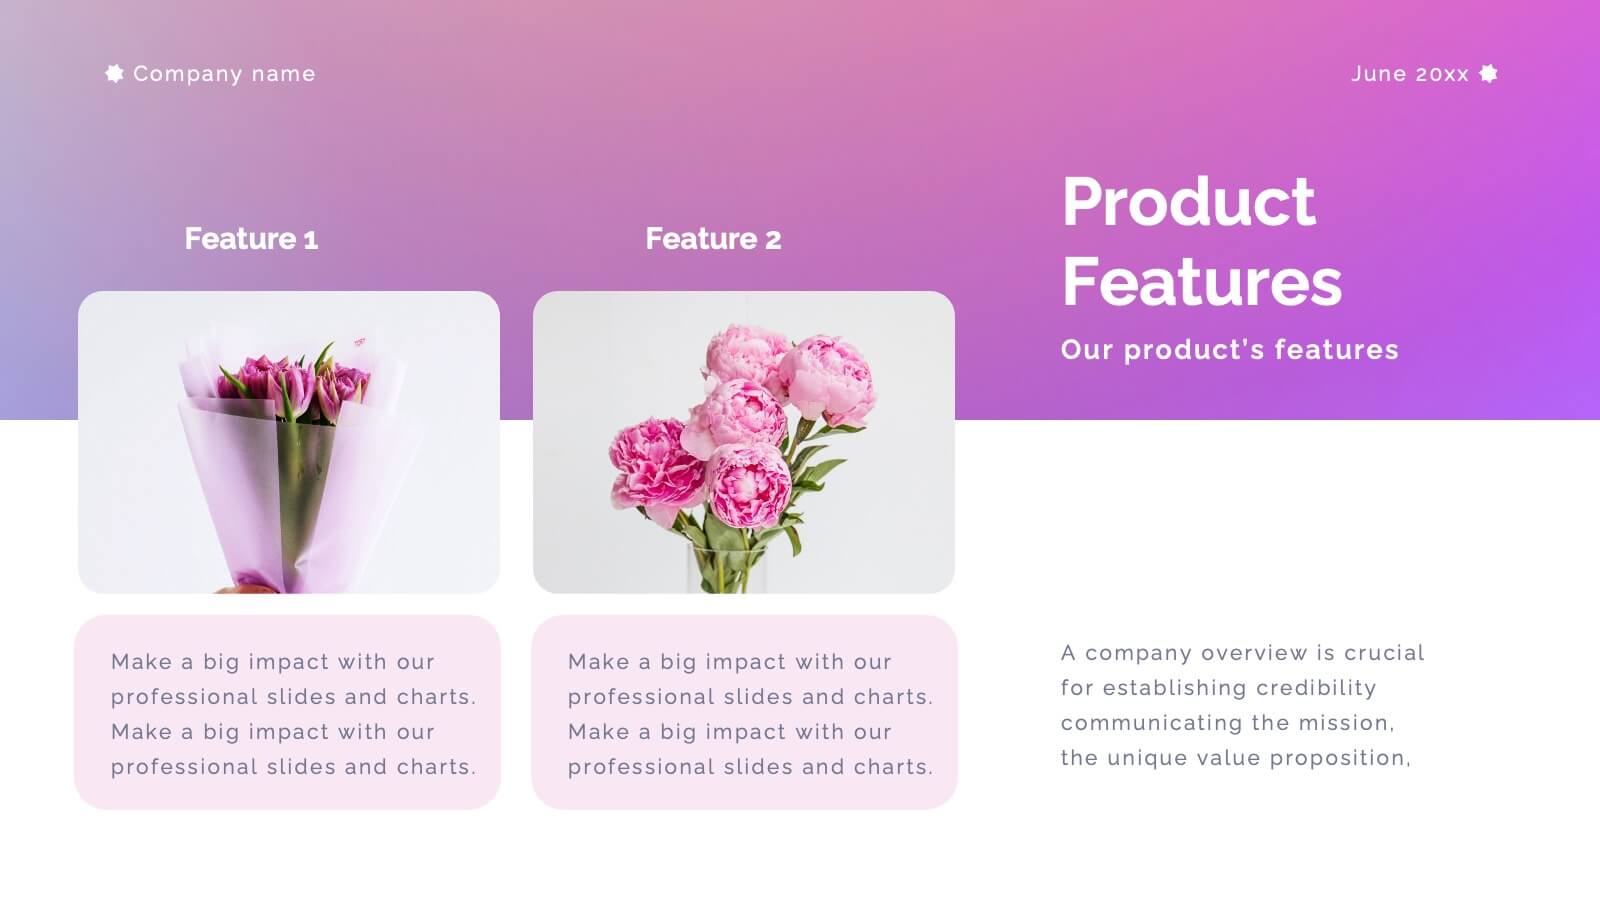
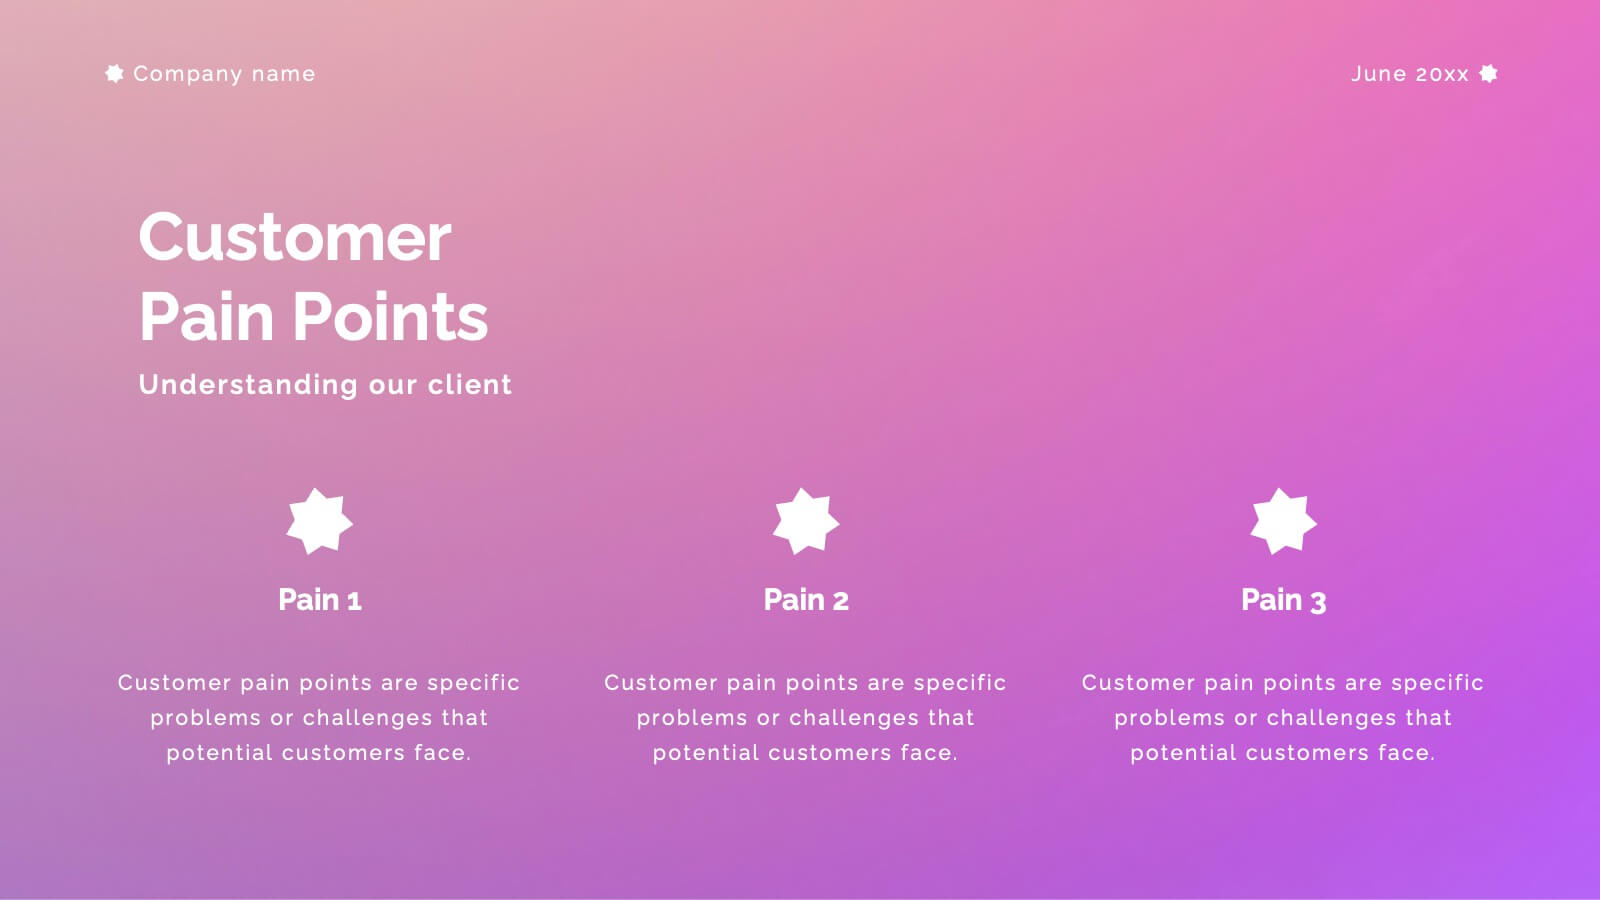
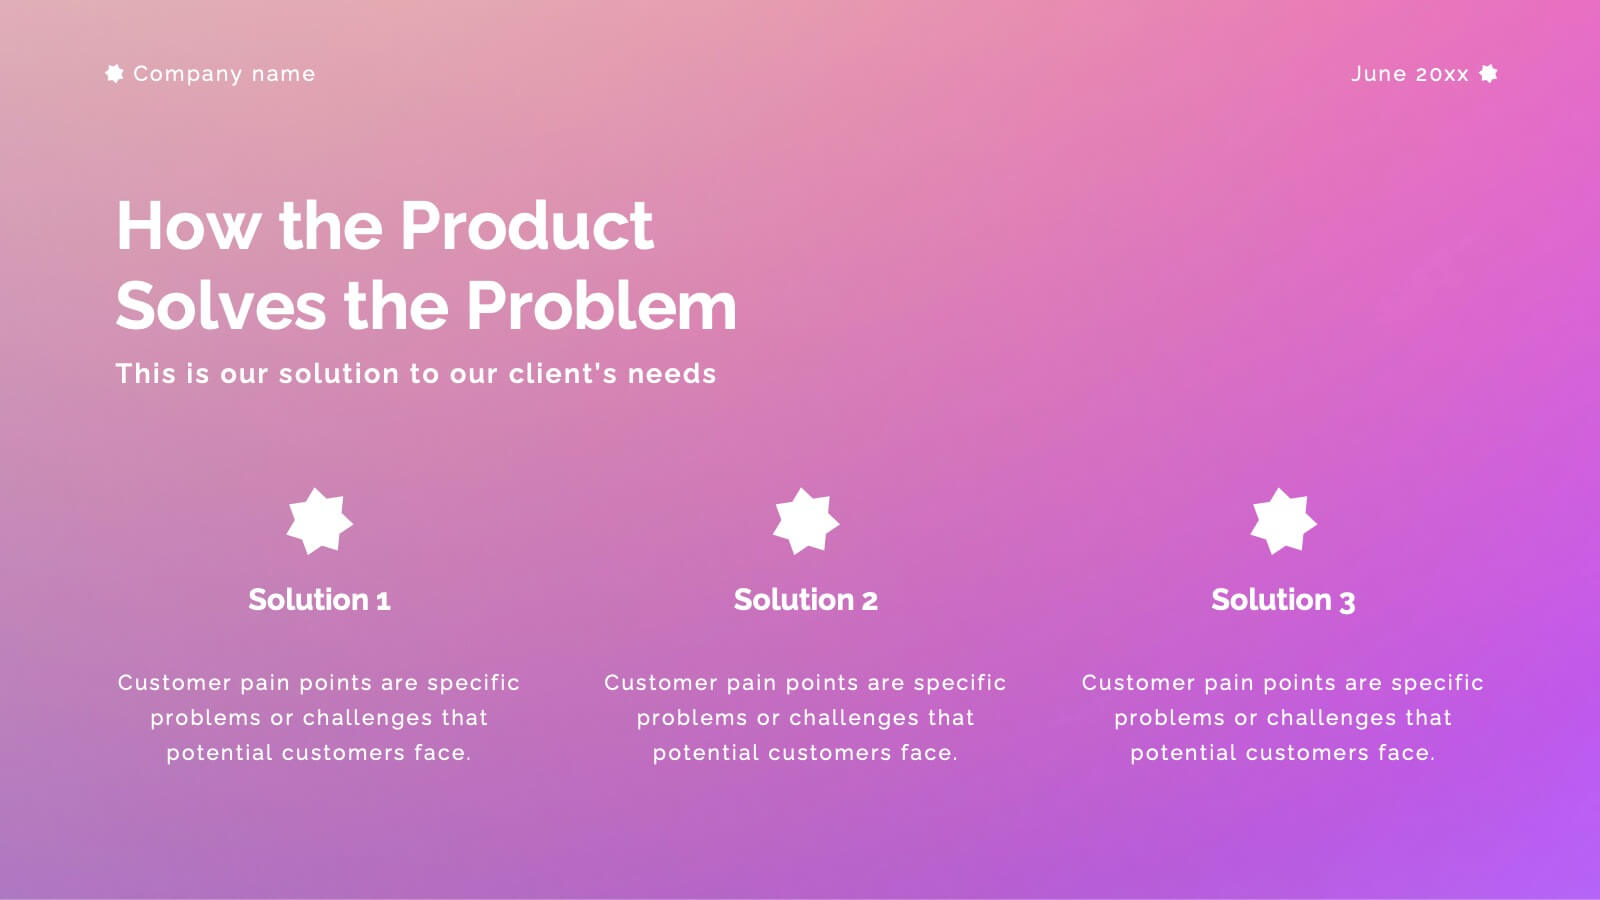
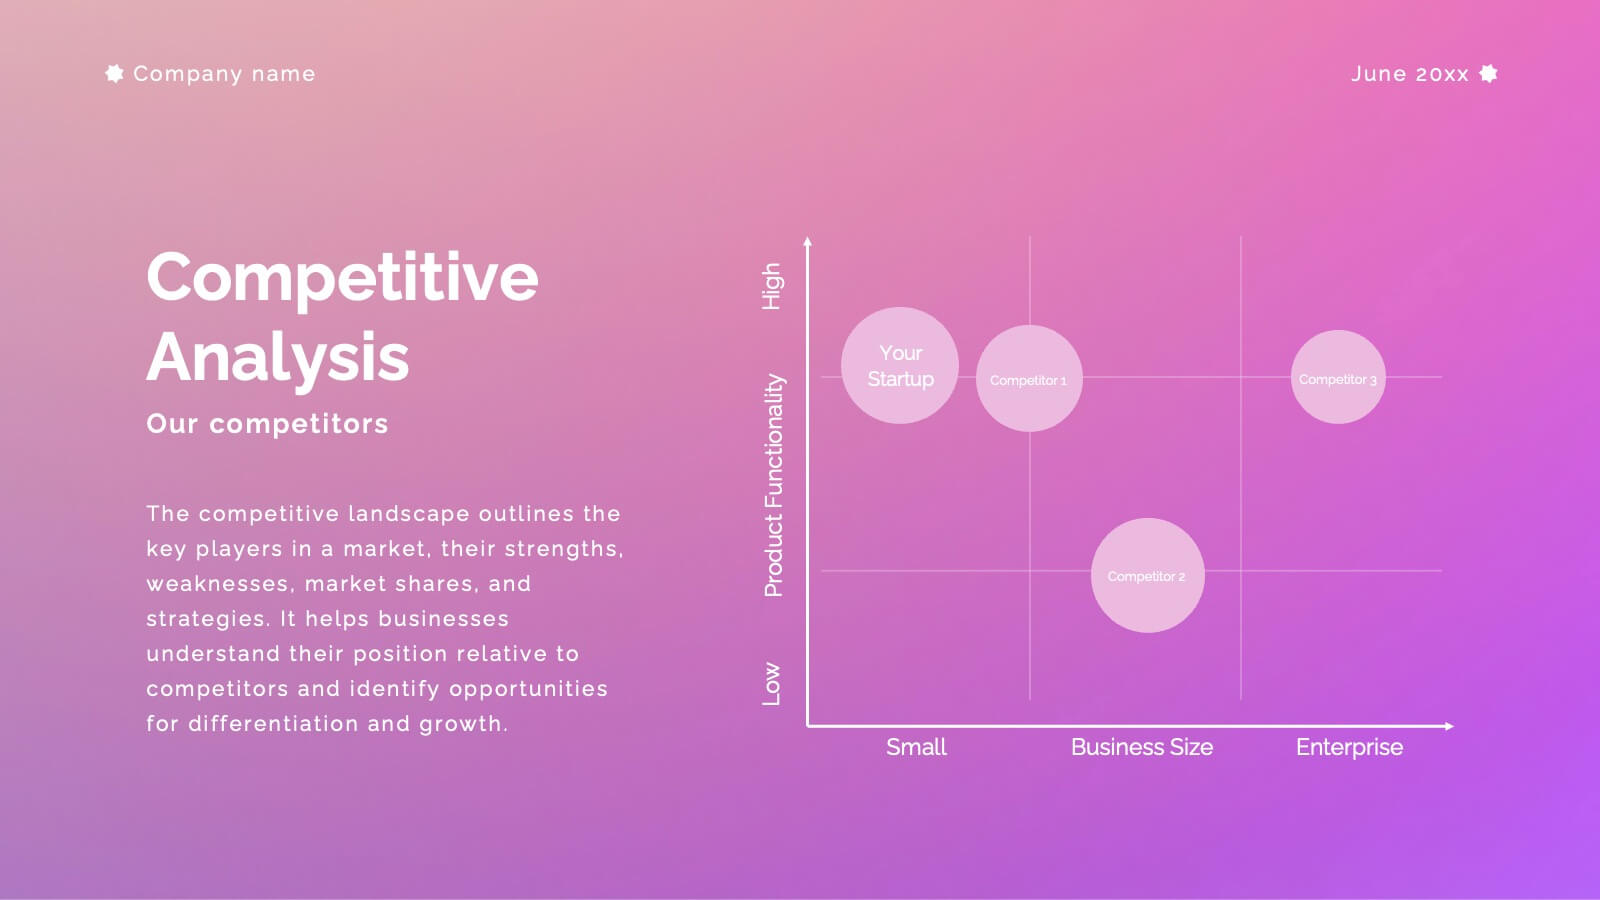
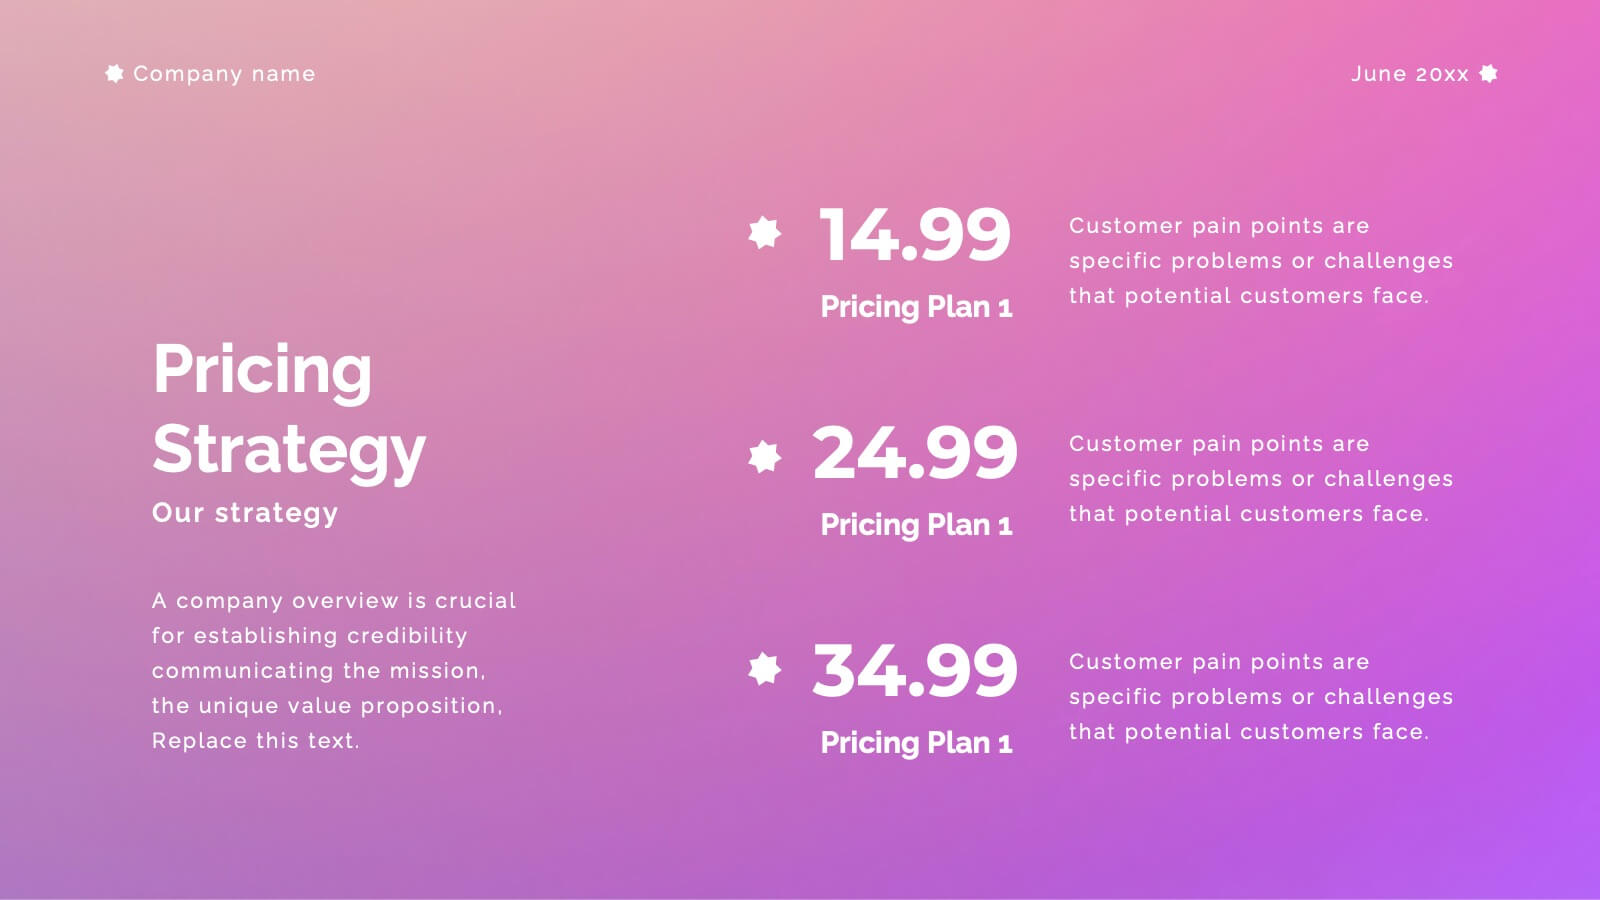
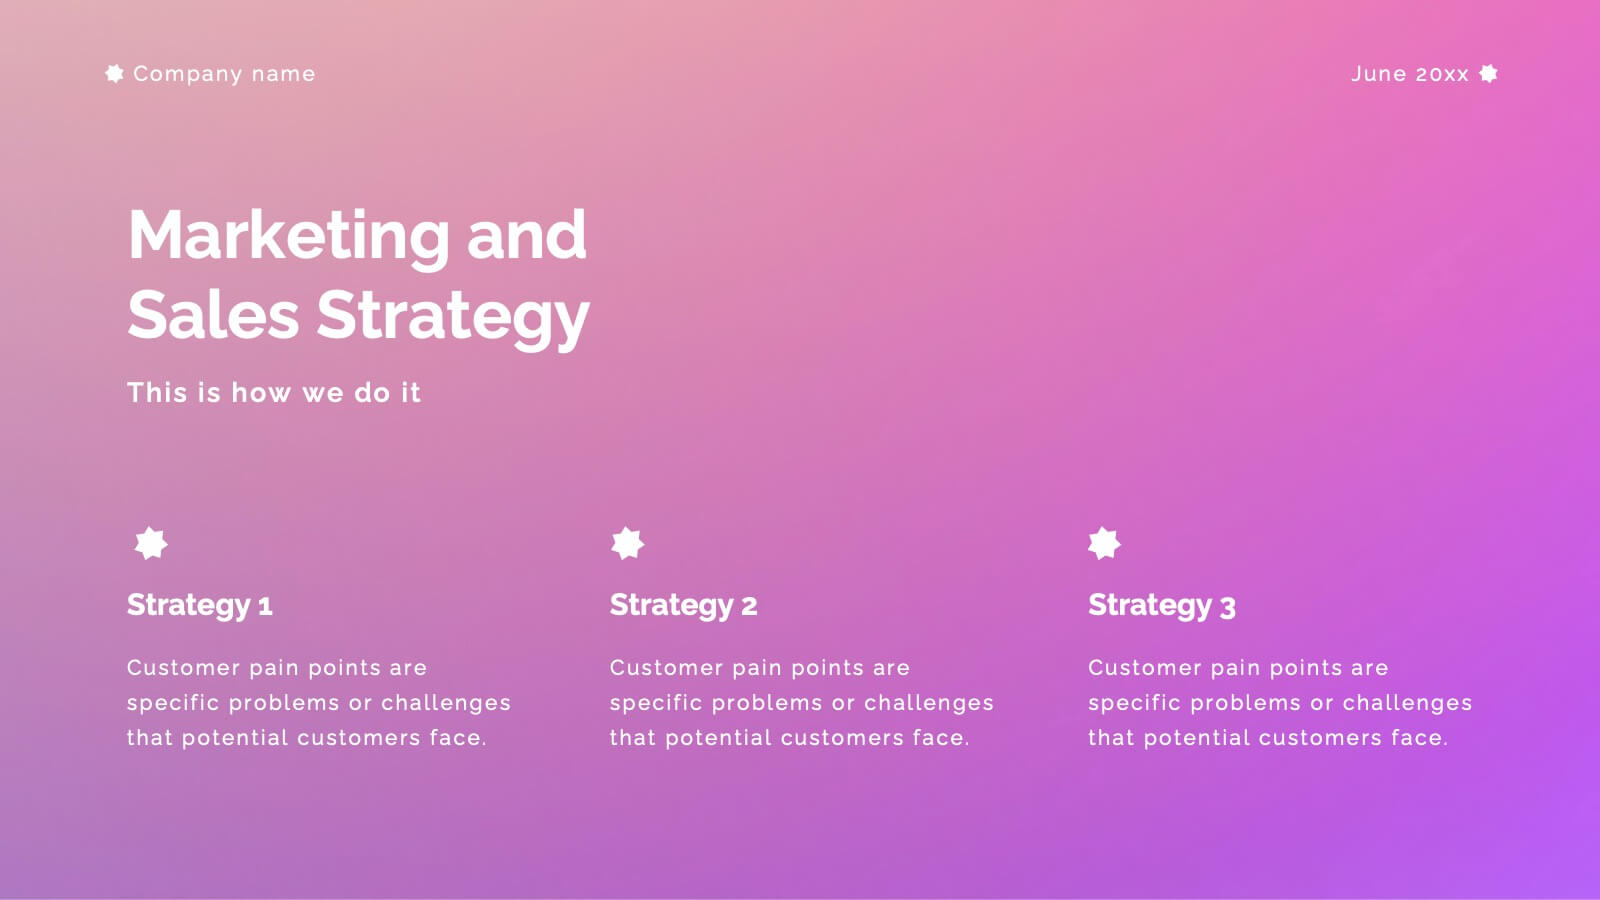
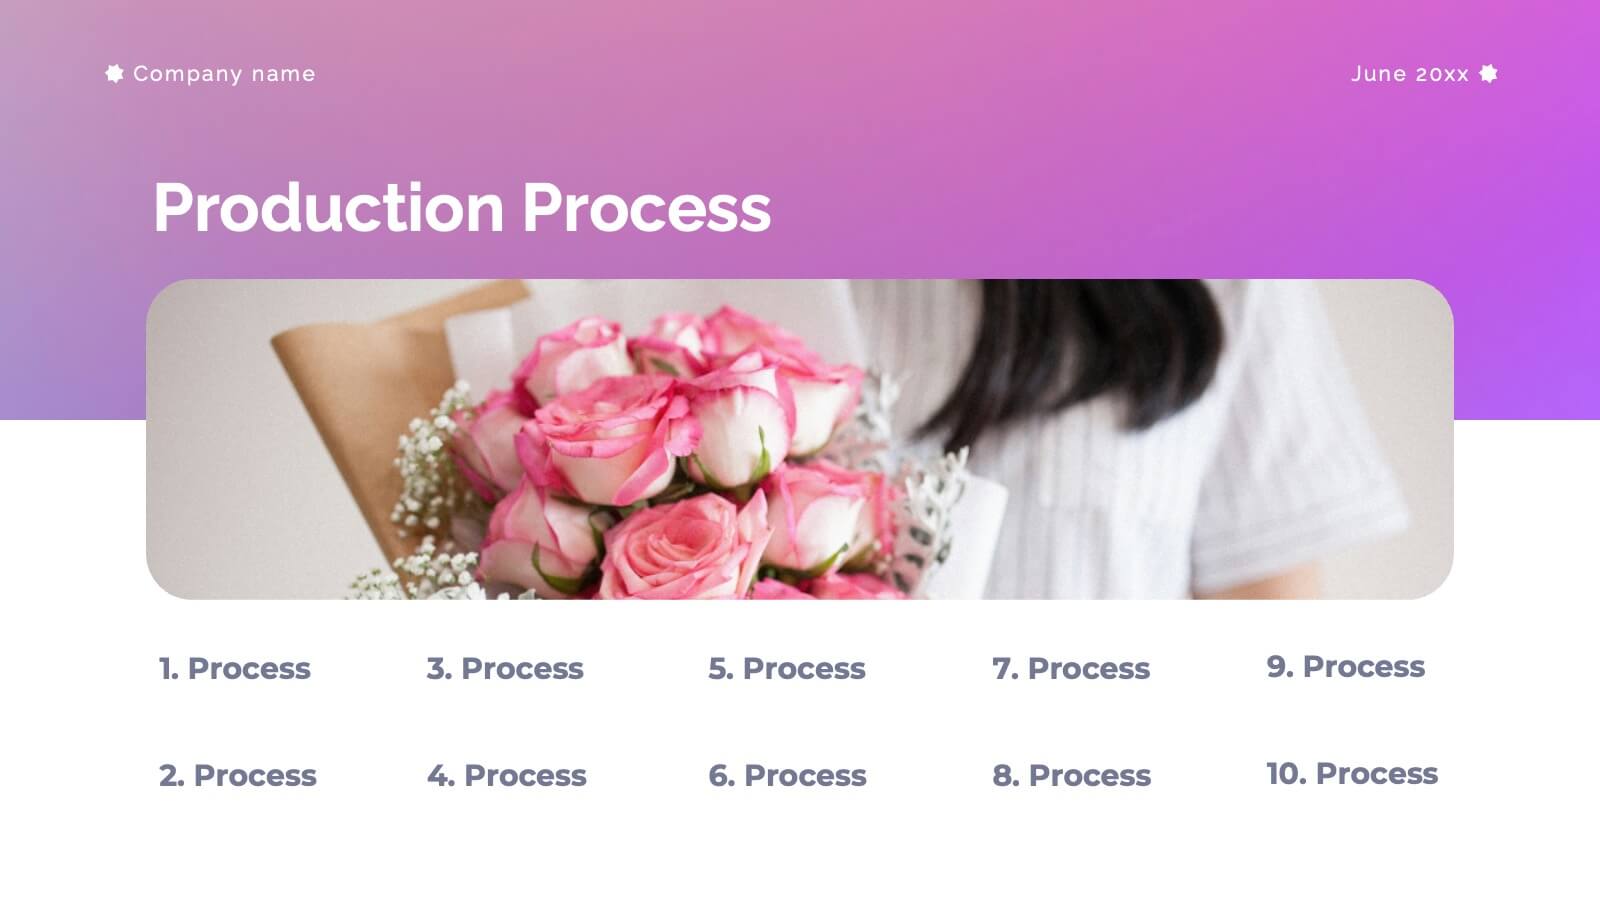
Aventurine New Product Proposal Presentation
Showcase your product in style with this vibrant and modern product proposal template! It covers everything from product features to target market, pricing strategy, and marketing plans. Designed for clarity and impact, it's perfect for pitching your product. Fully customizable, and compatible with PowerPoint, Keynote, and Google Slides for seamless presentations.


21 diapositivas
Sapphire Graphic Design Project Plan Presentation
Make your next project plan sparkle with this sleek, sapphire-inspired presentation design! This template is perfect for showcasing your graphic design project, helping you organize key milestones, timelines, and objectives. With its modern layout and clean aesthetics, your ideas will stand out beautifully. Compatible with PowerPoint, Keynote, and Google Slides.


7 diapositivas
Blue Ocean Strategy Infographic Presentation Template
The Blue Ocean strategy is a highly practical, step-by-step process for leaders to create uncontested market space and make the competition irrelevant. With this template you will be able to identify and capitalize on the growth opportunities your company has been overlooking or avoiding due to industry constraints. Our template is designed to help you identify market opportunities and formulate your strategy to avoid the threat of competition. Use this as a graphic organizer to help you think about how you can best compete in the marketplace. This template is perfect for your next presentation!


6 diapositivas
Connection and Relationship Strategy Presentation
Present your workflow or relationship journey with clarity using the Connection and Relationship Strategy Presentation. This linear hexagon path is ideal for visualizing sequences, strategies, or stages in professional relationships. Fully customizable for PowerPoint, Keynote, and Google Slides—perfect for consultants, marketers, or project managers.


7 diapositivas
Organizational Analysis McKinsey 7S Presentation
Explore the core of organizational alignment with our McKinsey 7S Model presentation template. Perfectly crafted for analyzing and optimizing business structures, this template guides you through the seven essential elements: Strategy, Structure, Systems, Shared Values, Skills, Staff, and Style. Its intuitive design ensures effective communication and clarity in your presentations. Optimized for PowerPoint, Keynote, and Google Slides, it's an invaluable tool for consultants and business strategists aiming to enhance internal coherence and performance.


5 diapositivas
Strategic Decision-Making Techniques Presentation
Communicate key business insights with clarity using this structured four-step layout. Each segment is aligned with an icon and space for concise text, making it ideal for presenting executive strategies, project evaluations, or decision pathways. The centered character adds a professional and engaging touch. Fully customizable in PowerPoint, Keynote, and Google Slides.


5 diapositivas
Real Estate Market Infographics
The Real Estate Market refers to the buying, selling, and renting of properties, including residential, commercial, and industrial properties. These infographic templates are a valuable tool for real estate professionals, investors, or anyone interested in understanding and presenting key information about the real estate market. With its visually appealing design and informative content it provides an overview of the real estate market and serves as a powerful visual aid for presentations or reports. Showcase key data and trends in the real estate market. It is compatible with PowerPoint, Keynote, and Google Slides.


7 diapositivas
Exponential Growth Infographic
Exponential growth refers to a process where a quantity grows at a consistent percentage rate per unit of time. This infographic template takes your audience on a visual expedition through the marvels of exponential expansion, turning complex data into a clear and engaging narrative. Compatible with Powerpoint, Keynote, and Google Slides. This features dynamic visuals like ascending graphs and vibrant charts, this infographic embodies the essence of exponential growth, making this come alive. Showcase the growth trajectory using ascending line graphs or bar charts, visually representing the skyrocketing growth in a way that's easy to comprehend.


4 diapositivas
IT Network Infrastructure
Simplify the complexity of your digital ecosystem with this IT Network Infrastructure presentation. Designed to visualize connectivity, servers, and system architecture, this layout is perfect for IT teams, consultants, and tech-focused reports. Fully editable in PowerPoint, Keynote, and Google Slides for seamless integration into your workflow.


7 diapositivas
Social Hierarchy Infographics
A Social Hierarchy is a way of organizing and ranking individuals or groups within a society based on factors such as social status, wealth, power, and prestige. This template features a powerful message about the difference in power between different groups, a stylish design and is fully customizable. Designed for use in Powerpoint, Google Slides and Keynote. Use this template to make your point clear in a meaningful way that really sticks with your audience. This hierarchy themed infographic is best suited for presentations about company structure, business hierarchies and office politics.


5 diapositivas
Sports Industry Market Trends Presentation
Visualize key metrics in the sports sector with this dynamic Sports Industry Market Trends slide. Designed with a timeline layout and medal-inspired percentage rings, it allows you to highlight four core insights or data points. Ideal for industry overviews, competitor benchmarking, or annual sports business reports. Fully editable in PowerPoint, Keynote, and Google Slides.


7 diapositivas
Meeting Infographic Presentation Template
Meetings are an important part of workplace culture. They help people build relationships, share ideas and make decisions. This template is a great way to show the importance of meetings to your managers and employees. This presentation can be used in a workplace to show how meetings help team members share knowledge and work. By providing an open dialogue, they can also be a useful tool for making employees feel valued and heard. Using the fun customizable illustrations provided in the template, keep your team members engaged on meetings and boost the entire team’s work ethic.