


Características


¿Tienes alguna pregunta?
Recomendar


4 diapositivas
Environmental Sustainability Presentation
Showcase sustainable strategies with this triangle-style infographic focused on Environmental Sustainability. Perfect for illustrating the relationship between ecological, economic, and social pillars. The arrow-based design emphasizes continuity and impact. Fully customizable and ideal for PowerPoint, Keynote, and Google Slides presentations.


5 diapositivas
Rental Business Milestone Timeline Presentation
Showcase your company's growth journey with this clean Rental Business Milestone Timeline layout. Designed for tracking key achievements, it features a horizontal timeline with icons and customizable date markers. Perfect for business reviews or investor updates, it’s fully editable in PowerPoint, Keynote, and Google Slides for a professional presentation


6 diapositivas
Big Data Insights Visual Presentation
Transform complex analytics into clear, engaging visuals that tell a compelling story. This modern layout is perfect for showcasing data connections, performance metrics, and analytical insights in a visually balanced way. Fully editable and compatible with PowerPoint, Keynote, and Google Slides for seamless customization and professional presentations.


10 diapositivas
Growth Strategy in Four Steps Presentation
Achieve sustainable business expansion with the Growth Strategy in Four Steps presentation. This structured template guides teams through progressive development phases, using clear visuals to illustrate key milestones and percentage-based improvements. Ideal for entrepreneurs, marketers, and business strategists, this slide layout is fully customizable and compatible with PowerPoint, Keynote, and Google Slides for seamless integration into your workflow.


4 diapositivas
Omnichannel Marketing Plan Overview Presentation
Visualize your cross-channel marketing strategy with this modern, megaphone-themed slide. Ideal for showcasing campaigns across multiple platforms, this layout helps communicate key marketing touchpoints in a clear and impactful format. Fully editable in PowerPoint, Keynote, and Google Slides—perfect for aligning marketing teams and presenting strategic plans with ease.


6 diapositivas
PESTEL Environment Analysis Infographics
Elevate your strategic analysis presentations with our PESTEL Environment Analysis infographic template. Designed for PowerPoint, Keynote, and Google Slides, this template is a must-have for business strategists, analysts, and students alike. This template efficiently breaks down the complex components of PESTEL analysis - Political, Economic, Social, Technological, Environmental, and Legal factors. Each segment is given its own distinct space, making it easy to input and display your analysis in a clear, organized manner. The sophisticated and educational design of the template ensures that your content is both accessible and engaging. The diverse yet harmonious color palette of the template enhances its visual appeal, reflecting the multifaceted nature of PESTEL analysis. This makes it ideal for detailed presentations where clarity and aesthetics are key. Whether you're presenting to a classroom, a boardroom, or at a conference, this infographic template will help you convey your environmental analysis with professionalism and style.


6 diapositivas
6-Step Business Process Presentation
Clearly map out workflows with this 6-step business process presentation. Ideal for project managers and strategists, this horizontal timeline helps break complex tasks into digestible phases. With editable icons, color highlights, and step-by-step layout, it's easy to customize in PowerPoint, Keynote, or Google Slides for any professional setting.


21 diapositivas
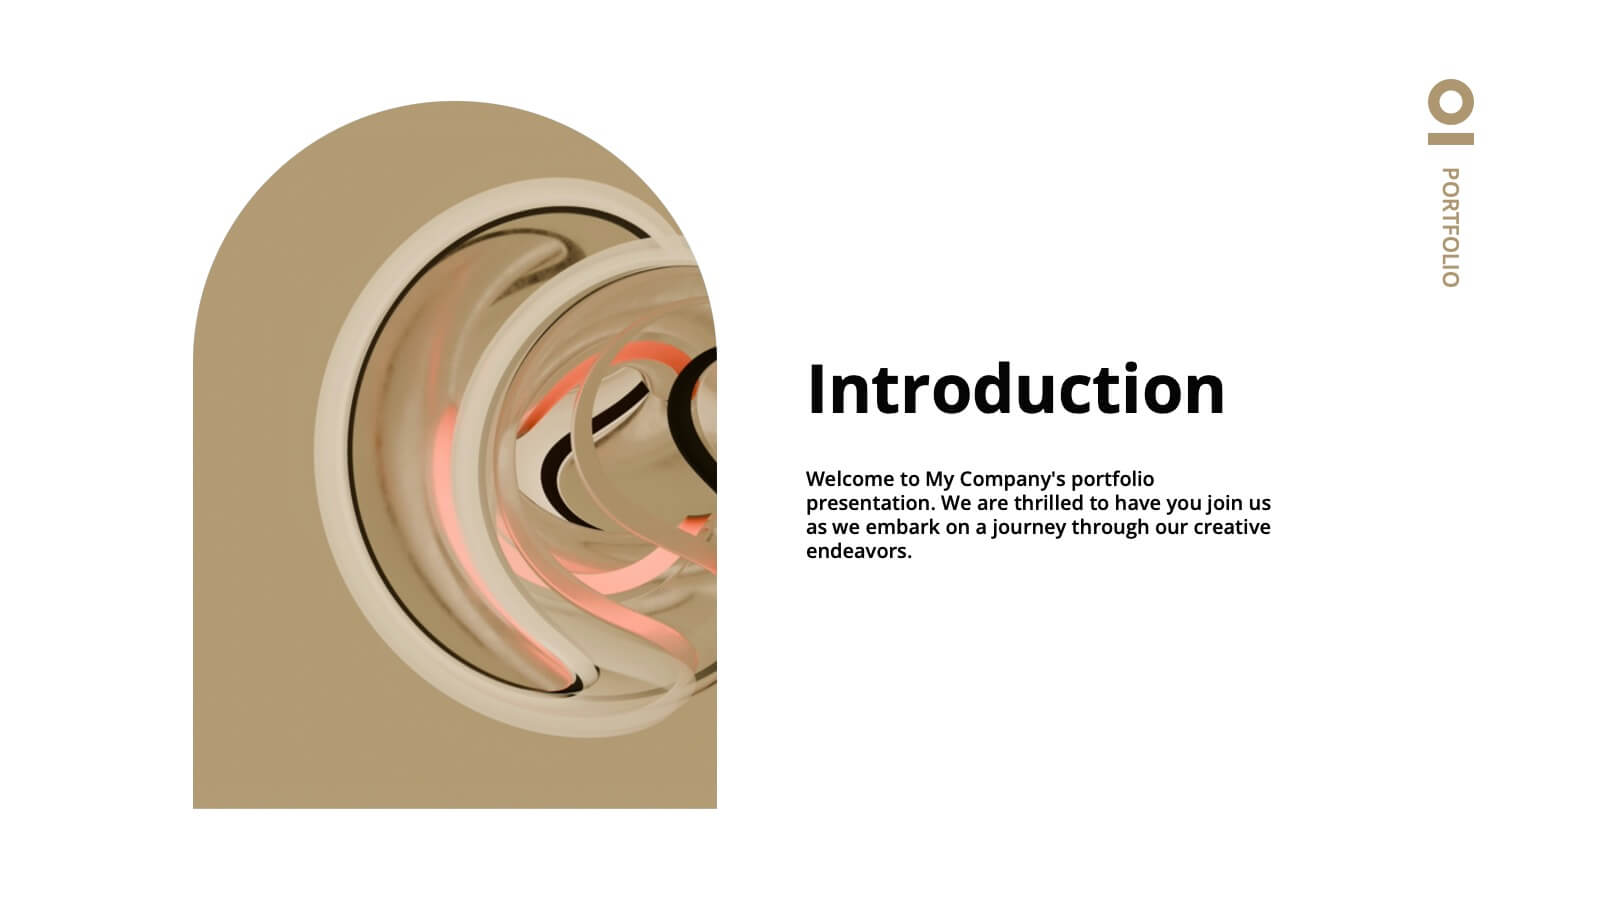
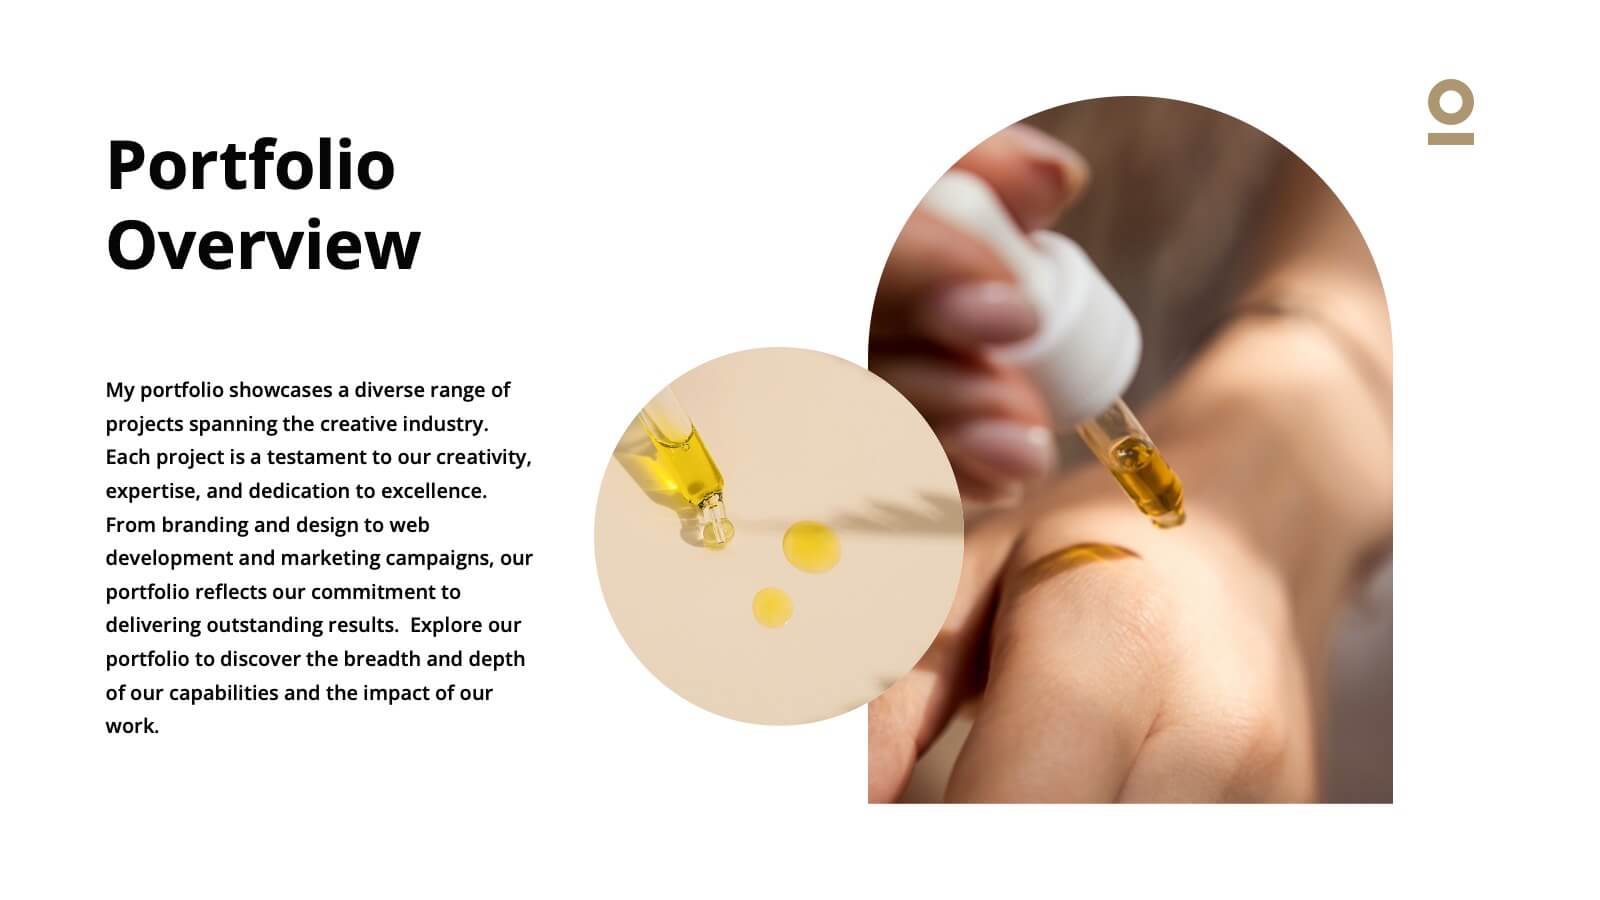
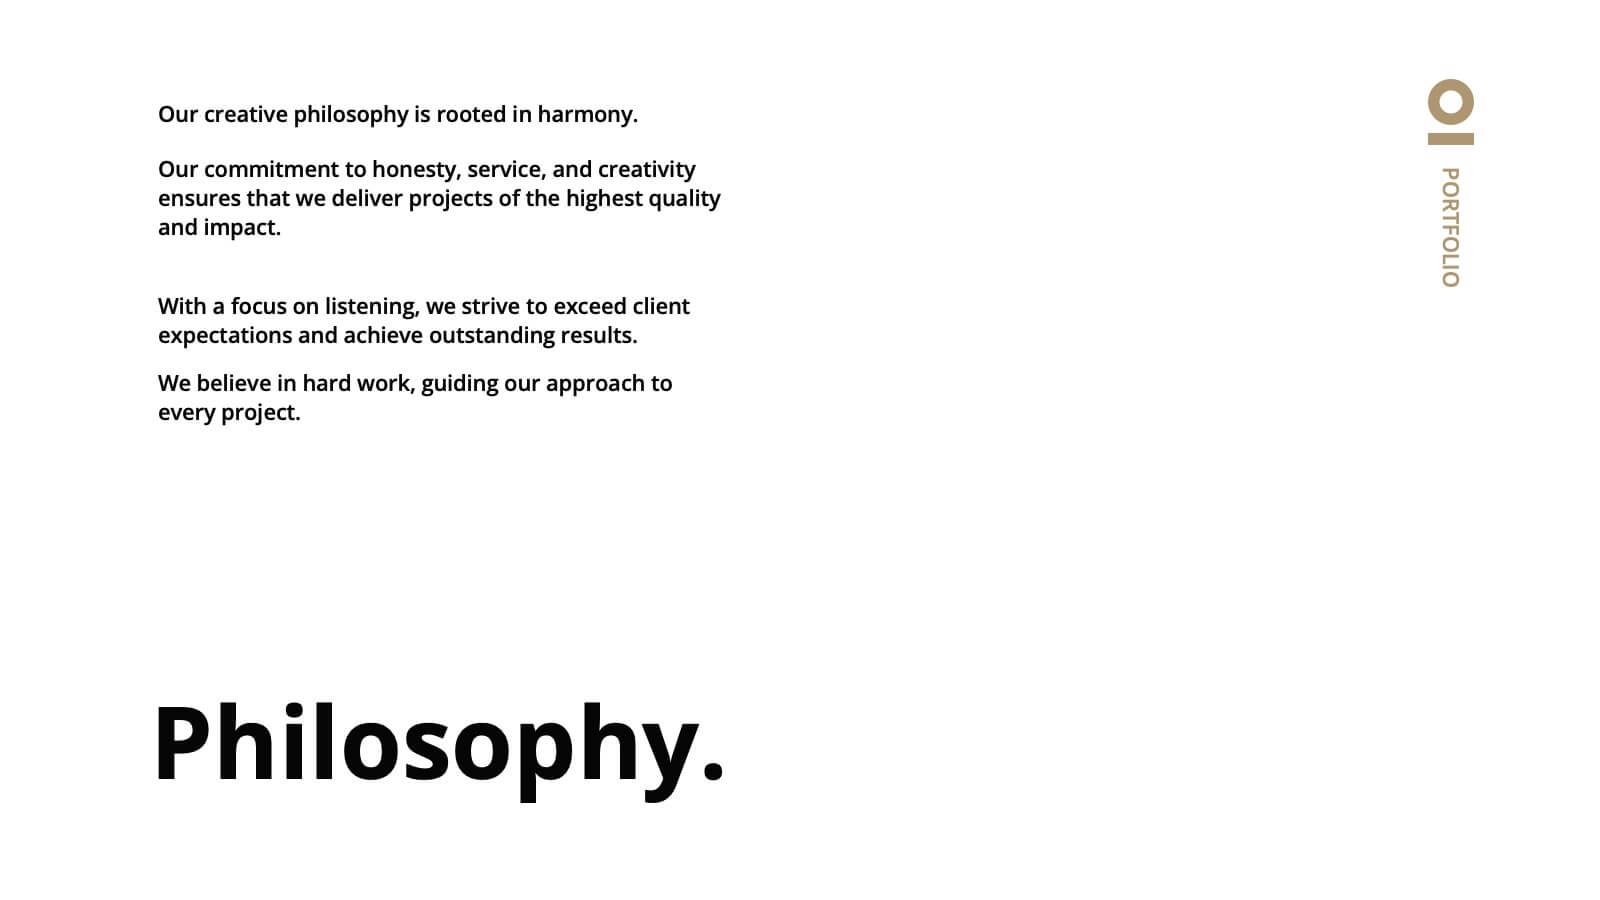
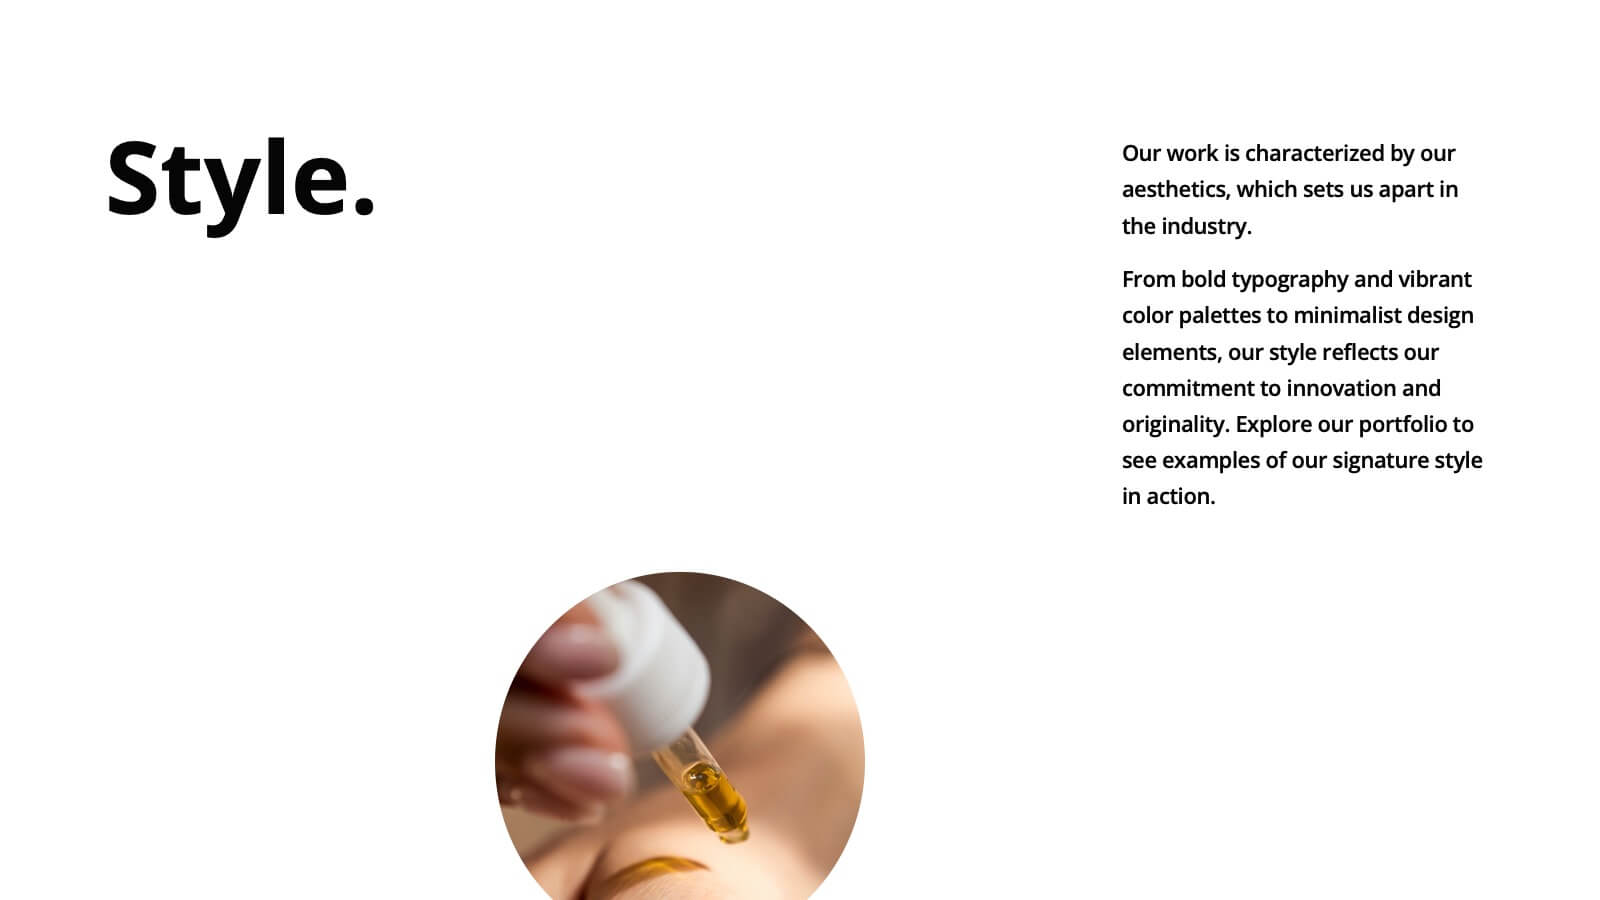
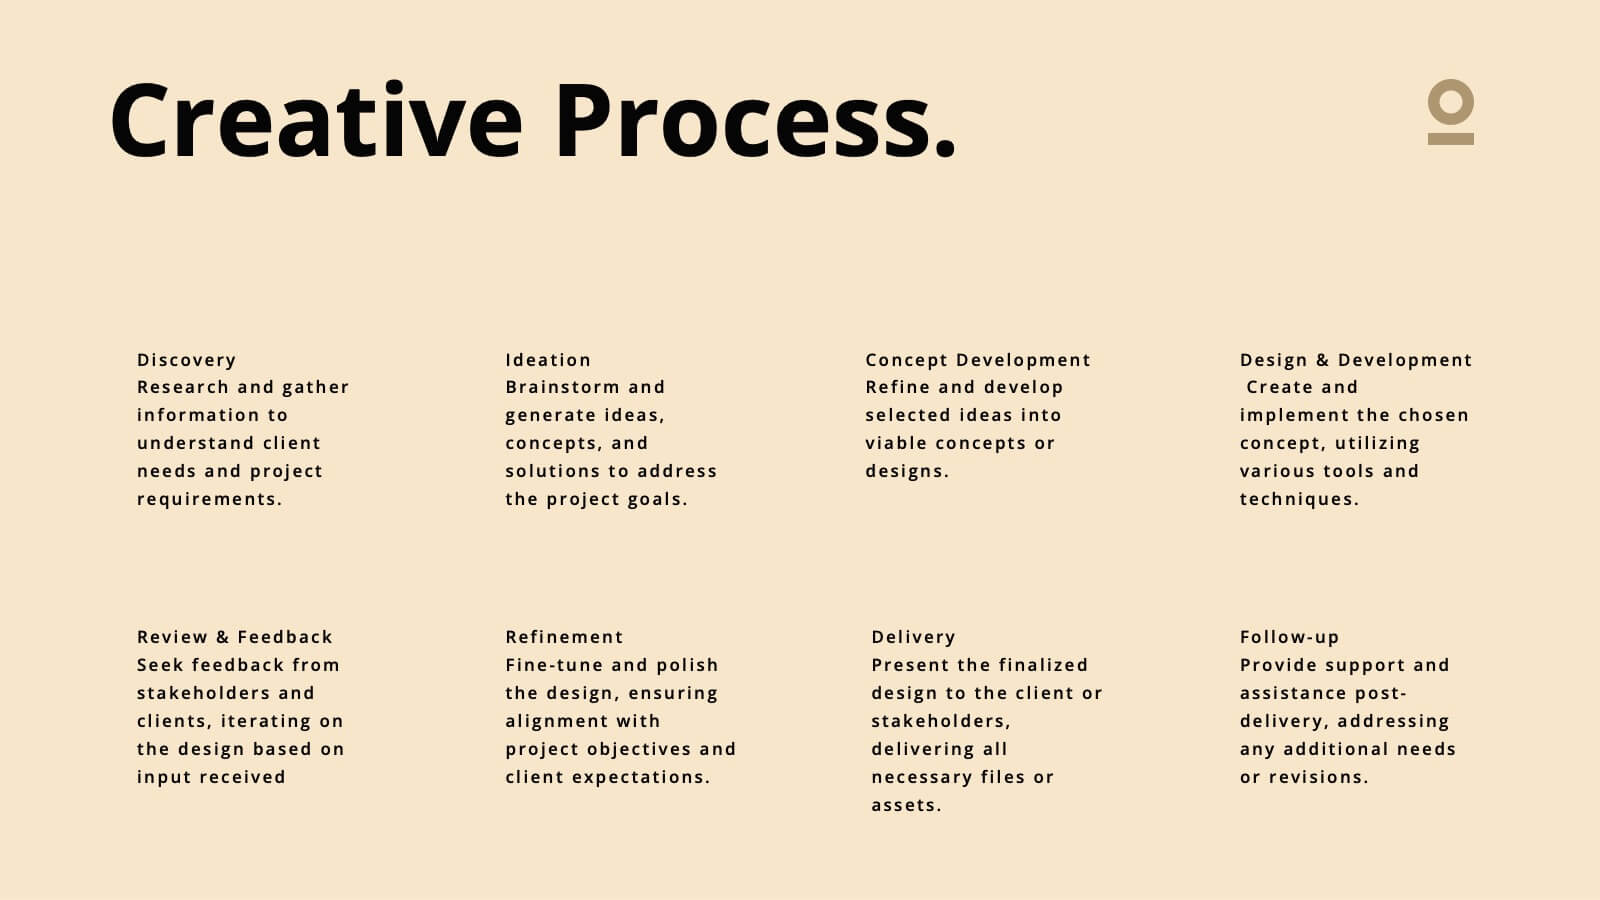
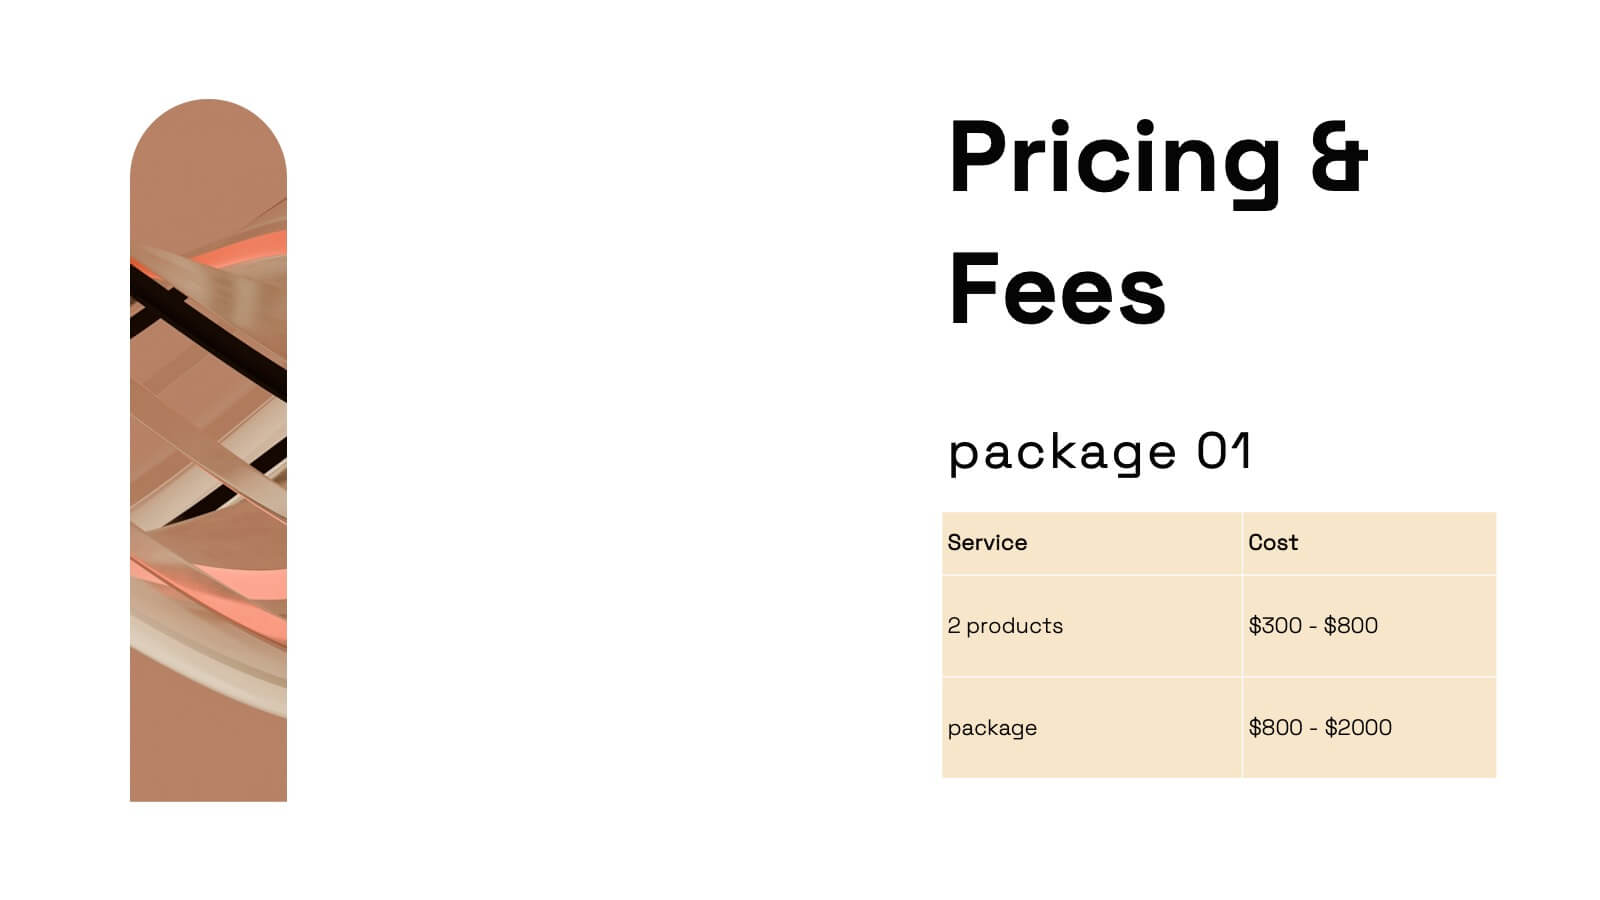
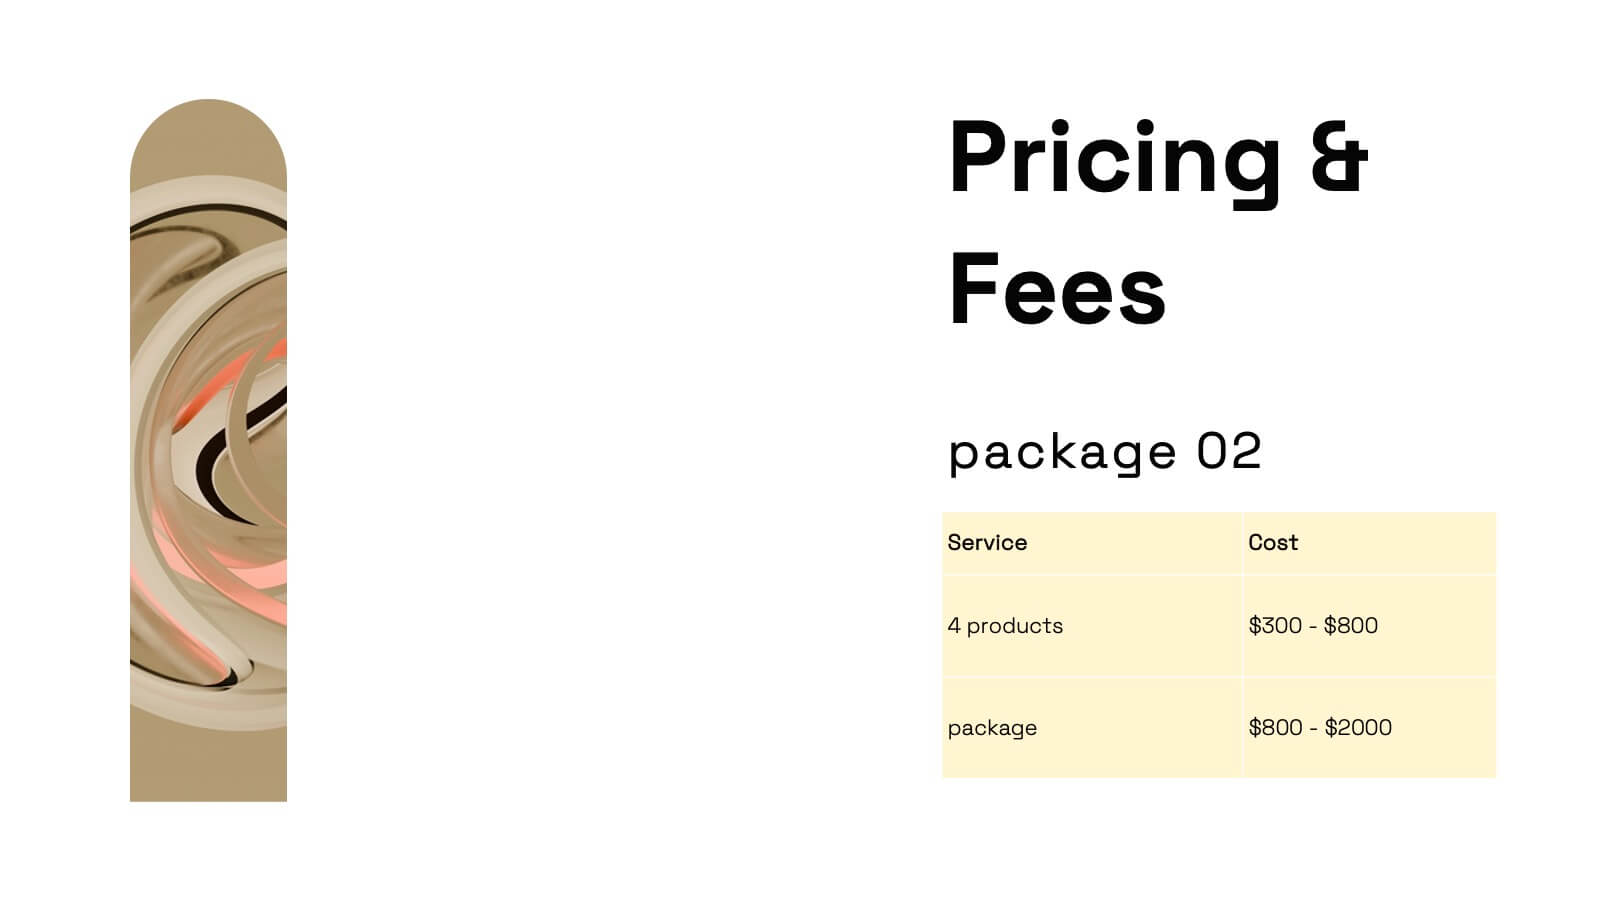
Haze Professional Portfolio Showcase Presentation
Elevate your professional presence with this stunning haze-inspired presentation template! Ideal for showcasing your portfolio, it beautifully highlights your skills, projects, and achievements with a clean and sophisticated design. This template ensures your work stands out, captivating potential clients and employers. Compatible with PowerPoint, Keynote, and Google Slides.


5 diapositivas
Population Segmentation by Demographic Factors Presentation
Break down audience demographics with this segmented infographic slide. Featuring a vertical figure illustration divided into color-coded percentage bars, it’s ideal for showcasing traits like age, gender, or location. This layout offers a clear visual summary, making it perfect for reports, marketing briefs, or investor presentations. Fully editable in Canva.


8 diapositivas
Air Travel Trends and Safety Presentation
Explore global air travel dynamics with the 'Air Travel Trends and Safety' presentation template. Designed to deliver critical insights into aviation safety standards and travel patterns, this template facilitates impactful presentations for industry stakeholders. Tailored for use in platforms like PowerPoint, Keynote, and Google Slides, it serves as an essential tool for discussing regulatory impacts, operational safety, and market trends, ensuring your data is not only presented but persuasively communicated.


10 diapositivas
Corporate Growth Strategy Presentation
Elevate your corporate presentations with our "Corporate Growth Strategy Presentation" template. Designed to visually represent key growth strategies, this infographic uses a wrench graphic to symbolize the tools necessary for business expansion. Each segment of the wrench is color-coded, highlighting different strategic elements clearly and effectively. This format aids in discussing business objectives systematically, from foundational practices to advanced goals. Ideal for executives, strategists, and business analysts, this template ensures professional and coherent delivery of complex strategies. Compatible with PowerPoint, Keynote, and Google Slides, it is an indispensable tool for articulating and presenting sophisticated corporate strategies.


3 diapositivas
Clean Water Initiative Overview Presentation
Communicate sustainability goals with this clean, modern layout featuring water droplet and faucet visuals. Ideal for summarizing three core focus areas of your environmental or nonprofit program. The minimalist design keeps attention on your key points. Fully editable and compatible with PowerPoint, Keynote, and Google Slides for easy customization.


6 diapositivas
Executive Summary of Findings Presentation
Summarize your key insights with clarity using this Executive Summary of Findings slide. Designed with a centered target icon and surrounding data points, it’s ideal for spotlighting major conclusions. Fully editable in PowerPoint, Keynote, and Google Slides.


4 diapositivas
Workforce Adaptation Through Change Management Presentation
Show how your team evolves and thrives through transformation with this visual journey up the change curve. This template uses a clear mountain-climb illustration to highlight workforce progression and adaptation. Ideal for HR, change leaders, and organizational development professionals. Fully compatible with PowerPoint, Keynote, and Google Slides.


3 diapositivas
Future of Aviation Technologies Presentation
Soar into the future of flight with this sleek, data-driven layout that visualizes progress and innovation in aviation. Perfect for showcasing new technologies, sustainability efforts, or industry growth trends, it balances clarity and impact. Fully customizable and compatible with PowerPoint, Keynote, and Google Slides for effortless presentation design.


4 diapositivas
Sustainability Report Slide Deck Presentation
Bring your sustainability story to life with a bright, modern layout that turns complex environmental data into a clear visual narrative. This presentation helps you outline key initiatives, performance metrics, and long-term goals in a clean, structured format. Fully editable and compatible with PowerPoint, Keynote, and Google Slides.


6 diapositivas
Business Calendar and Monthly Overview Presentation
Bring structure to your chaos with a bold and colorful visual planner! This easy-to-use layout helps track tasks, deadlines, or projects across multiple months in one glance. Ideal for team coordination or solo planning. Fully editable and compatible with PowerPoint, Keynote, and Google Slides for seamless calendar-based presentations.