


Características


¿Tienes alguna pregunta?
Recomendar


6 diapositivas
Academy Sports Infographic
Sports are physical activities or games that involve individual or team competition and are typically governed by specific rules. This infographic template highlights key aspects of sports and physical activities in an academy setting. Whether it's a school sports program, a community sports academy, or a professional training institute, this infographic provides a comprehensive overview of the benefits, programs, and facilities offered by an academy sports institution. This template is compatible with Powerpoint, Keynote, and Google Slides making it easy to navigate and can be easily customized to fit your presentation needs.


10 diapositivas
Business Scaling Strategy Presentation
Achieve rapid growth with the Business Scaling Strategy Diagram. This professional template helps you visualize key steps, strategic phases, and milestones for scaling a business effectively. Designed for entrepreneurs, executives, and consultants, this slide ensures a clear and structured presentation of your expansion strategy. Fully customizable and compatible with PowerPoint, Keynote, and Google Slides.


22 diapositivas
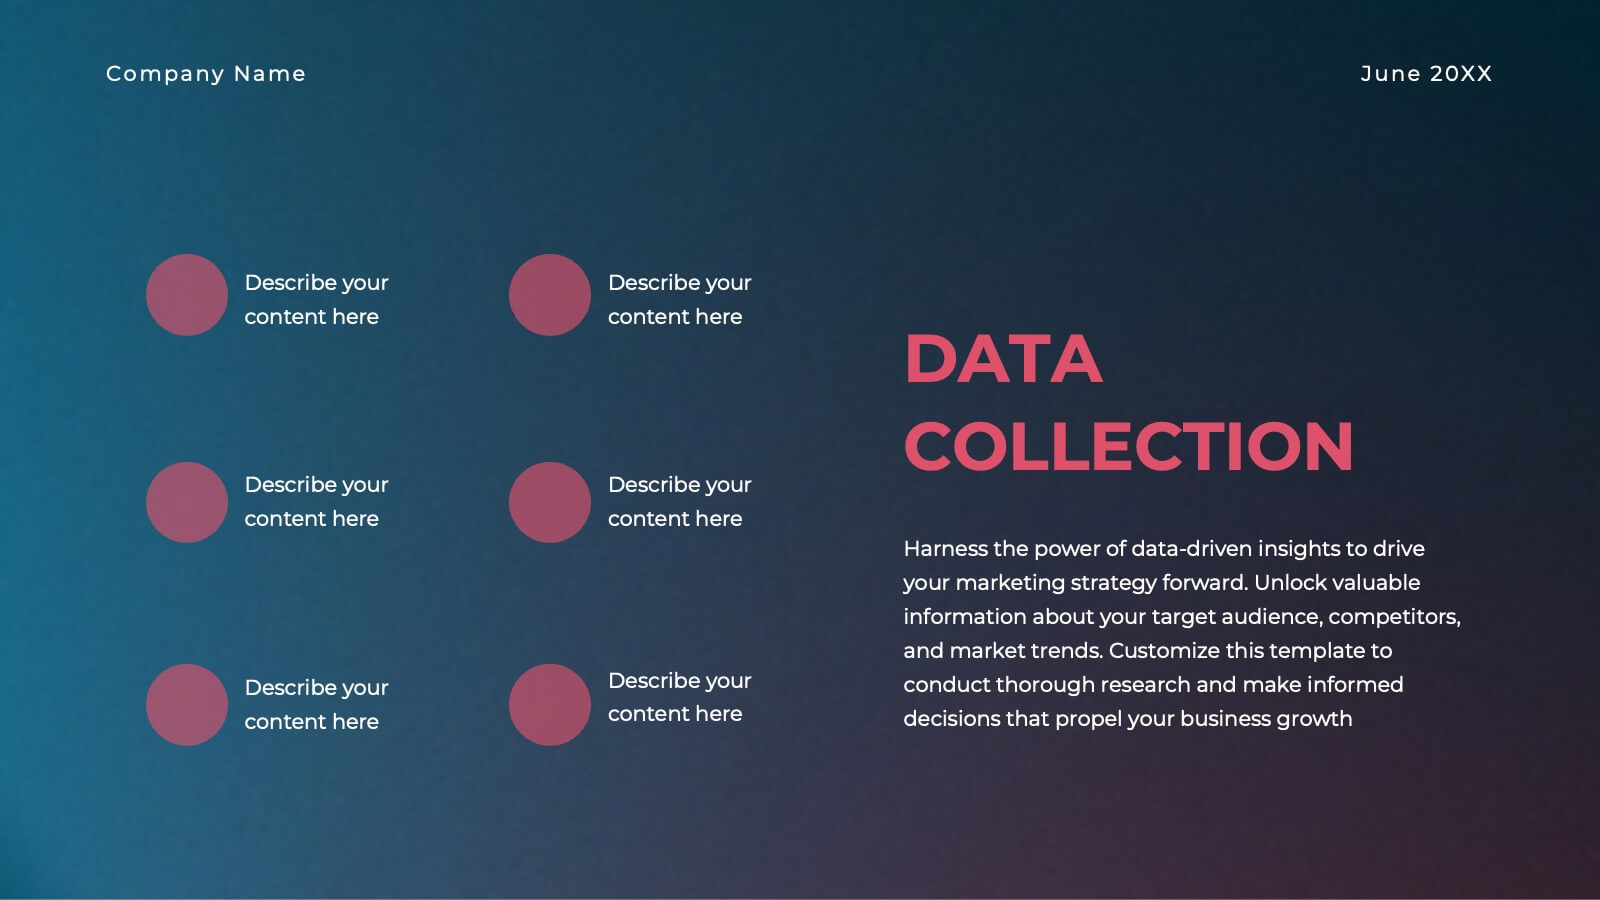
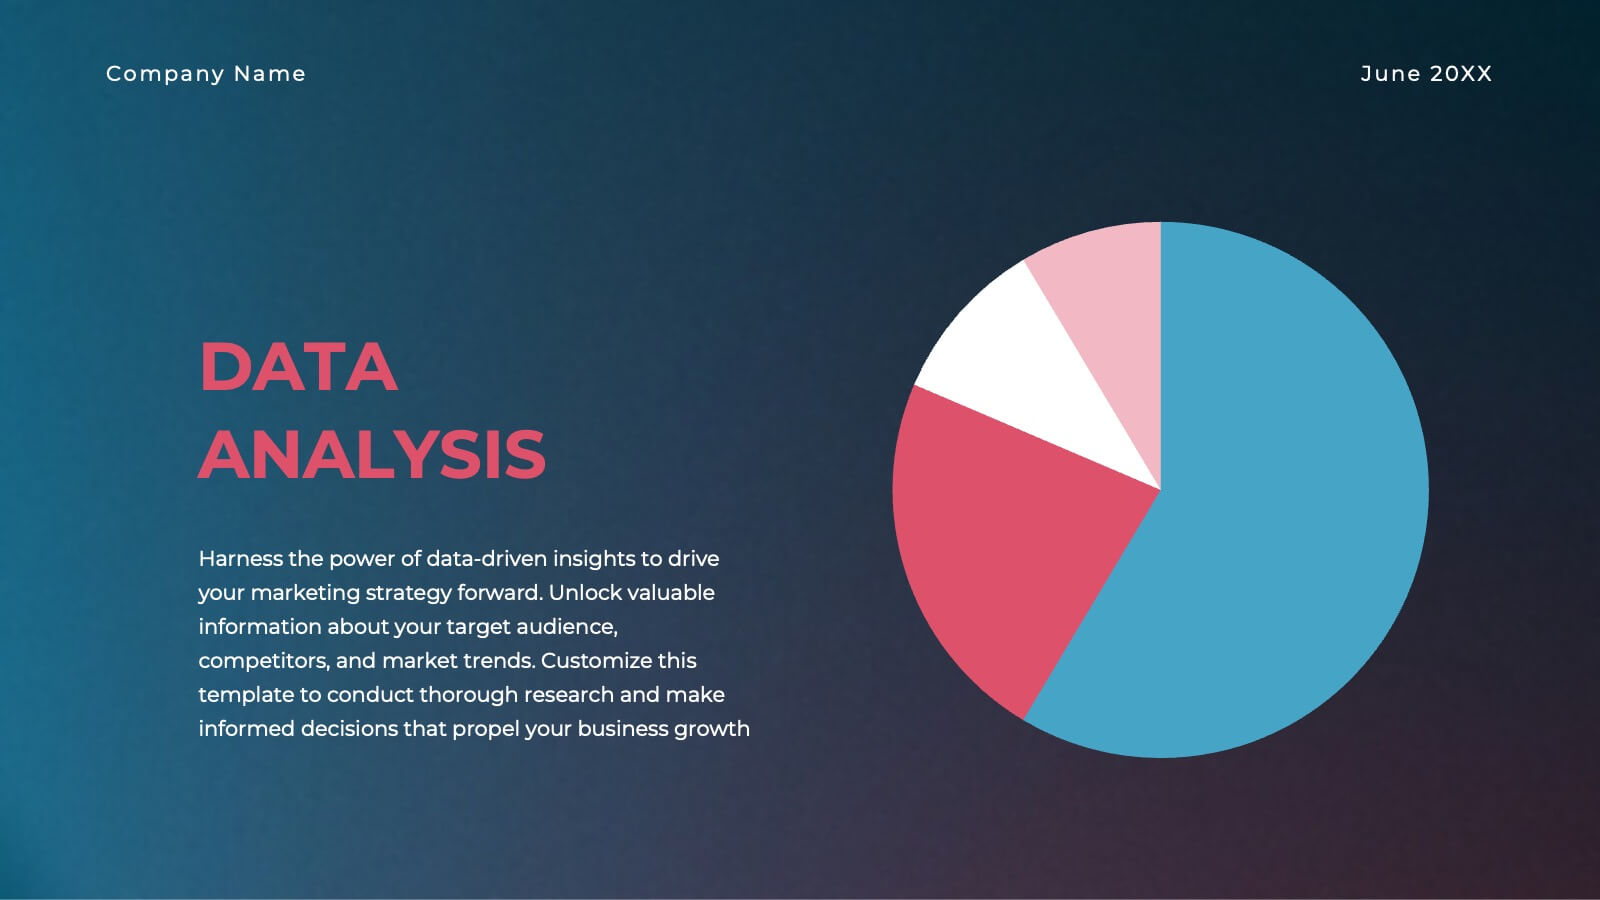
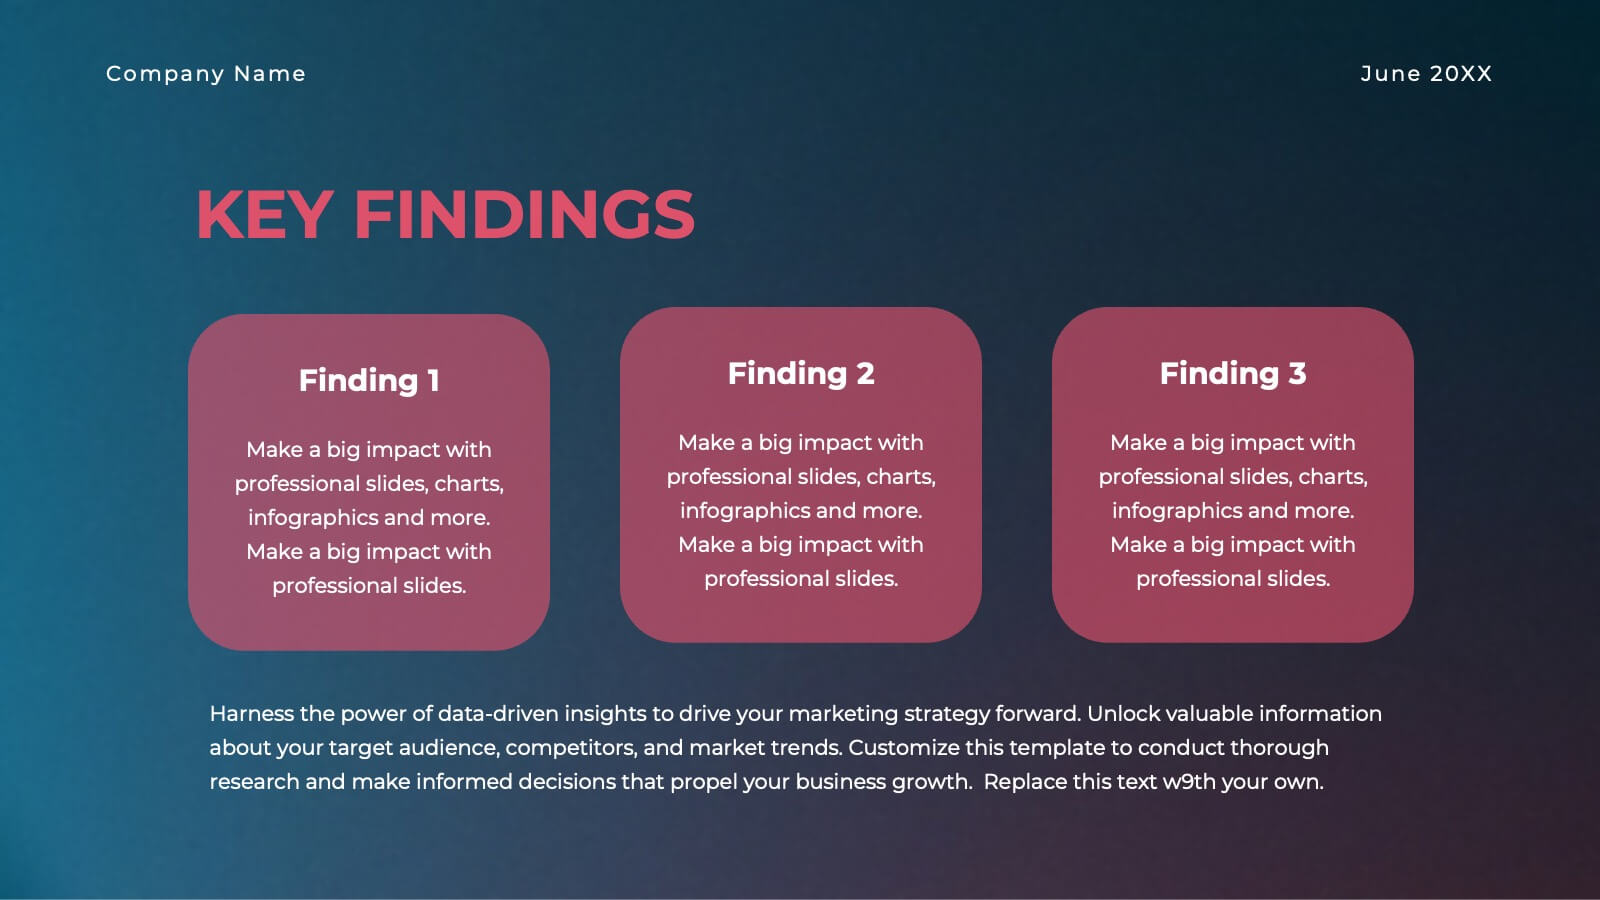
Gold Research Proposal Presentation
Present your research with impact using this sleek and modern research proposal template! Featuring sections for objectives, data collection, analysis, key findings, and recommendations, this template helps organize your research clearly and professionally. Fully customizable and compatible with PowerPoint, Keynote, and Google Slides, it's ideal for any research presentation.


5 diapositivas
Data Breach Infographics
A data breach refers to an incident where unauthorized individuals gain access to sensitive, confidential, or protected information. This infographic is designed to educate and raise awareness about data breaches, their causes, impacts, and preventive measures. It presents complex information in an understandable way, making it accessible to a wide range of audiences. The template incorporates relevant statistics and data to provide a comprehensive understanding of the prevalence and scale of data breaches. It includes graphs, charts, and infographics to visualize the frequency, magnitude, and industries most affected by data breaches.


4 diapositivas
Business Report Conclusion Slide Presentation
Summarize findings with impact using the Business Report Conclusion Slide Presentation. This template provides a structured, four-step layout that helps you clearly present key takeaways, data highlights, or action points. Clean design with icon integration makes it easy to follow. Fully editable and compatible with PowerPoint, Keynote, and Google Slides.


5 diapositivas
Interlocking Puzzle Infographic Presentation
Visually connect ideas with the Interlocking Puzzle Infographic. This design is perfect for illustrating processes, relationships, and key concepts that fit together seamlessly. Whether you're presenting business strategies, project workflows, or educational content, this template enhances clarity and engagement. Fully customizable and compatible with PowerPoint, Keynote, and Google Slides.


27 diapositivas
Drift Rebranding Project Plan Presentation
Transform your brand with this comprehensive rebranding project template! Perfect for presenting brand identity, market analysis, and strategic positioning, it includes slides for logos, color palettes, and brand guidelines. Engage your audience with visually striking designs and detailed content. Compatible with PowerPoint, Keynote, and Google Slides for easy, professional presentations on any platform.


4 diapositivas
Startup Business Plan Slide Deck Presentation
Kickstart your pitch with a clean, modern slide deck that guides your audience through your startup’s core ideas with clarity and confidence. This presentation outlines key business concepts, supporting strategy, goals, and planning in an easy-to-follow structure. Fully compatible with PowerPoint, Keynote, and Google Slides.


7 diapositivas
Agile Project Management Approach Presentation
Illustrate iterative planning and delivery cycles with this Agile Project Management Approach Presentation. The dynamic circular graphic paired with a horizontal flow arrow highlights six core steps in agile workflows. Ideal for scrum teams, product owners, or project leads, each phase is clearly labeled with editable titles and content placeholders. Fully customizable and compatible with PowerPoint, Keynote, and Google Slides.


26 diapositivas
Spellis Rebranding Project Plan Presentation
Revamp your brand’s identity with this sleek and strategic presentation template. Covering key aspects such as brand values, audience personas, strategy, positioning, and future development, this template ensures a comprehensive rebranding approach. Fully customizable and compatible with PowerPoint, Keynote, and Google Slides for seamless use.


22 diapositivas
Simple Pitch Deck Presentation
Streamline your pitch process with this no-frills Pitch Deck template, designed for clear communication and powerful impact. From the get-go, the cover slide clearly announces your purpose, inviting audiences into your business narrative. The template smoothly transitions from one slide to the next, each one a stepping stone in building your case — from problem to solution. It includes a neatly organized table of contents, thought-provoking mission and vision statements, and data-rich slides for a deep dive into your business metrics. Each section, marked with bold, numbered headers, keeps your presentation on track and your audience engaged. A final 'Thank You' slide adds a touch of professionalism, and the credits section ensures that your sources are transparently acknowledged. This pitch deck is ideal for startups and businesses looking to capture attention and convey their story succinctly.


6 diapositivas
World Market Presence and Expansion Map Presentation
Showcase your company’s global footprint with this World Market Presence and Expansion Map. Visually highlight key regions, market activity, or strategic territories. Perfect for investor decks, global overviews, or international growth strategies. Fully editable in PowerPoint, Keynote, and Google Slides for seamless integration into your professional presentation workflow.


23 diapositivas
Night Slash UX Strategy Plan Presentation
Elevate your UX/UI design presentations with the Night Slate UX Strategy Plan template! This dynamic and visually striking design is perfect for conveying your strategic ideas with impact. The bold use of contrasting black and orange creates a modern and energetic vibe, making your content stand out. Each slide is thoughtfully designed to cover every aspect of your UX/UI strategy, from user research and personas to prototyping and user testing. The template includes sections on design principles, wireframes, and responsive design, ensuring that your audience gains a comprehensive understanding of your approach. Whether you're presenting to stakeholders or guiding a design team, this template is designed to keep your audience engaged and informed. Fully compatible with PowerPoint, Keynote, and Google Slides, the Night Slate template is your go-to tool for delivering compelling UX/UI strategy presentations that leave a lasting impression.


6 diapositivas
SCRUM Framework Infographics
The "SCRUM Framework" infographic template is a dynamic and insightful tool, meticulously crafted for PowerPoint, Keynote, and Google Slides. This template is essential for project managers, agile coaches, and development teams striving to elucidate the intricacies and benefits of the SCRUM methodology in their projects. This template adeptly breaks down the SCRUM framework into its core components: roles, events, and artifacts. It showcases the iterative process of product development, sprint planning, daily stand-ups, sprint reviews, and retrospectives. The visual representation of SCRUM roles – Product Owner, SCRUM Master, and Development Team – along with the flow of activities, makes it an indispensable resource for SCRUM training, agile transformation initiatives, and team workshops. The design is as agile as the methodology it represents, with a color scheme that encourages clarity, focus, and energy. This not only makes the presentation visually compelling but also reinforces the principles of transparency, inspection, and adaptation that are central to SCRUM. Whether used in corporate training, team onboarding, or educational settings, this template ensures that the "SCRUM Framework" is communicated with precision, clarity, and visual flair.


6 diapositivas
Marketing Plan Infographic
Bring your marketing plan to life with this visually engaging Marketing Plan Infographic. Tailored for clarity and impact, it's perfect for Powerpoint, Google Slides, and Keynote. This template helps marketers and business professionals effectively communicate their strategy, from market analysis to sales targets. Customize each part with your data to showcase your marketing mix, customer segmentation, or competitive analysis. Whether for client meetings, team briefings, or classroom settings, this infographic simplifies complex data into a compelling visual narrative. Elevate your marketing presentation and ensure your plan is understood and remembered.


5 diapositivas
Healthcare Industry Report
Deliver key medical insights with this modern, stethoscope-themed slide. Ideal for showcasing health metrics, clinical data, or medical updates, the layout includes four sections with health icons and clear callouts for easy readability. Fully customizable in PowerPoint, Keynote, and Google Slides.


5 diapositivas
5-Level Pyramid Diagram Presentation
Build your message from the ground up with a clean, layered visual that makes complex ideas feel easy to follow. This presentation highlights hierarchical structure, priorities, and step-by-step concepts in a polished, professional layout perfect for business or education. Fully compatible with PowerPoint, Keynote, and Google Slides.