


Características


¿Tienes alguna pregunta?
Recomendar


8 diapositivas
Credit Card Comparison Presentation
The "Credit Card Comparison" presentation template visualizes the differences between credit and debit card options in a straightforward and engaging way. Featuring side-by-side comparisons, the template allows for easy insertion of key points such as fees, benefits, and suitability for different user profiles, making it an excellent tool for financial educators, advisors, and banking professionals. The template’s design ensures that the content is accessible and relatable, making complex financial concepts easier to grasp for the audience. This makes it ideal for presentations aimed at educating consumers about financial choices or for internal training within financial institutions.


18 diapositivas
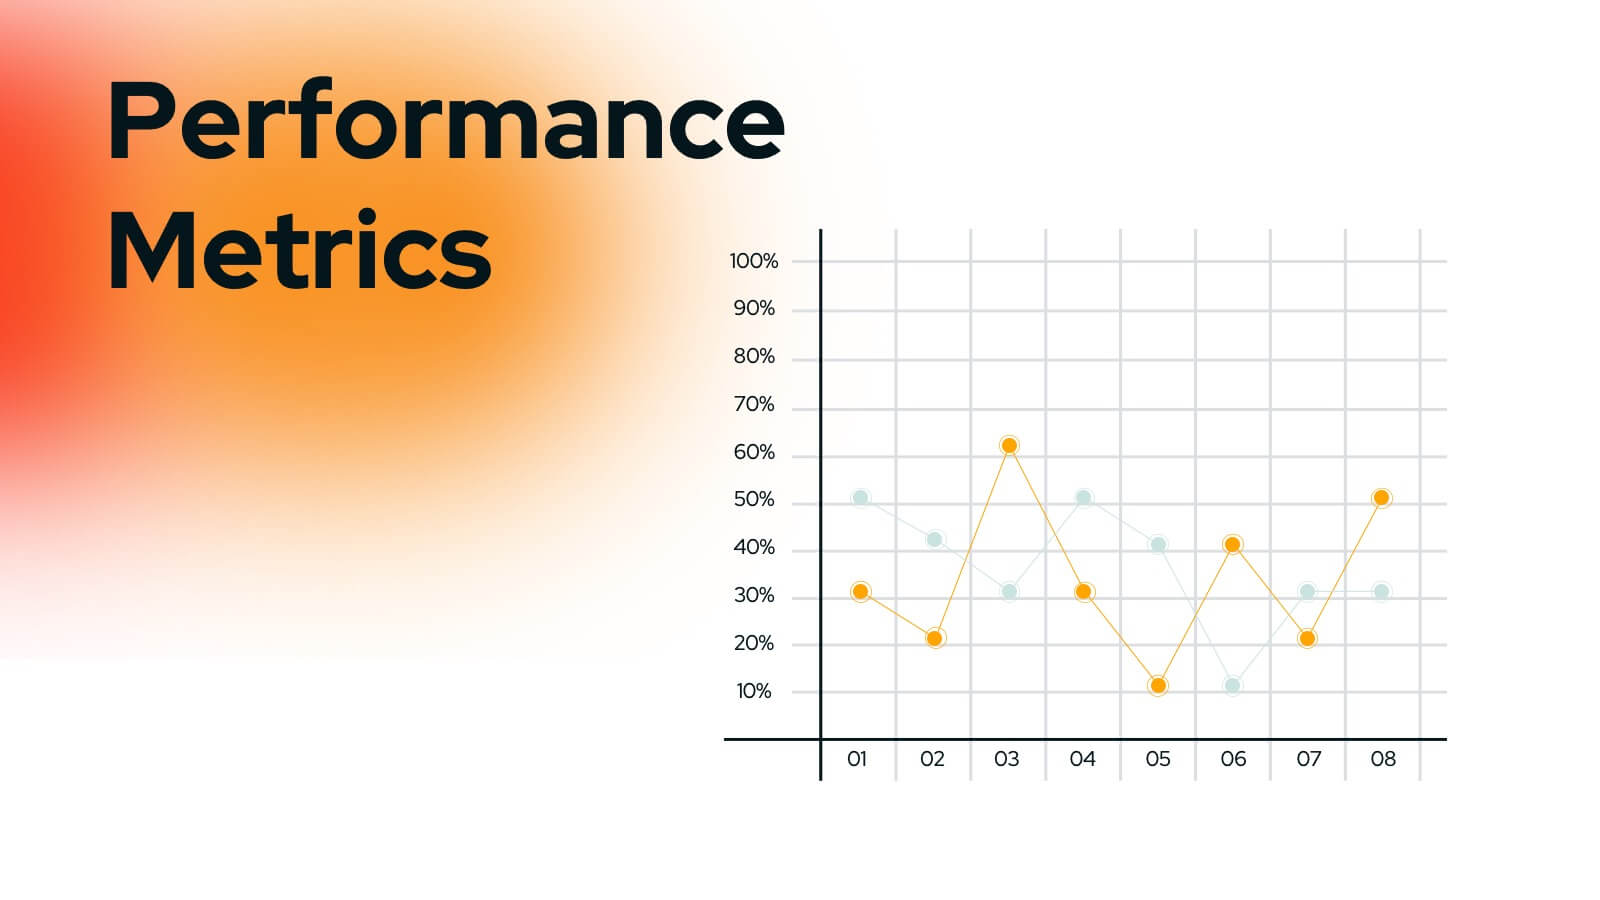
Business Data Analysis Dashboard Presentation
Track Business Performance Effectively! The Business Data Analysis Dashboard Presentation provides a structured and visually engaging way to showcase key metrics, trends, and insights. Featuring dynamic charts, graphs, and KPI indicators, this template is perfect for executive reports, financial reviews, and strategic planning. Fully customizable and compatible with PowerPoint, Keynote, and Google Slides for seamless presentation.


6 diapositivas
Asia Map Population Infographic
Explore the demographic dynamics of Asia with our collection of infographic slides, designed to illustrate the population statistics across the continent. These templates are an essential tool for educators, demographers, and business analysts, providing detailed visualizations of population distribution, density, and growth trends. Each infographic combines the map of Asia with engaging graphical elements such as bar graphs, pie charts, and statistical callouts that emphasize key data points like total population, urban versus rural distribution, and demographic forecasts. The color-coding and spatial arrangements on the map effectively highlight variations and trends across different countries and regions, making complex data easy to understand and visually compelling. Fully customizable, these templates allow you to adjust the data presentation to suit specific needs or focuses, such as comparing population growth rates or highlighting demographic challenges. Whether used in presentations, reports, or educational materials, these slides offer a comprehensive and accessible way to communicate the demographic landscape of Asia.


4 diapositivas
Market Research Case Study Presentation
Present compelling data insights with the Market Research Case Study Presentation template. Designed for structured storytelling, this template visually maps out research findings, trends, and key takeaways to support data-driven decisions. Perfect for marketing reports, business strategies, and competitive analysis, it’s fully customizable and compatible with PowerPoint, Keynote, and Google Slides.


6 diapositivas
Funnel Stages Infographic
In marketing and sales, the term "funnel stages" refers to the different stages or steps that a potential customer goes through in their journey from initial awareness of a product or service to making a purchase decision. These infographics visualize and help you understand the customer's progression through these stages. They aim to help businesses and professionals understand the customer journey and optimize their strategies for each stage of the funnel. Whether used in sales presentations, marketing workshops, or educational materials, this template helps businesses build successful sale funnels and maximize their revenue potential.


7 diapositivas
Technology Infographic Presentation Template
A technology infographic is a visual representation of information or data related to technology. The purpose of this template is to present your complex information in a simple, easy-to-understand manner. This template contains pre-designed layouts and images that can be used to structure your content in a variety of ways. This template is perfect to use to help explain technology-related topics such as software, hardware, cybersecurity, and more. Infographics are commonly used in the technology industry to help educate people about the latest trends, products, and services.


6 diapositivas
Market Trends and Risk Analysis with PESTEL Presentation
Present strategic insights with clarity using this Market Trends and Risk Analysis with PESTEL slide. Ideal for business consultants, marketers, and strategic planners, this slide helps dissect external factors—Political, Economic, Sociocultural, Technological, Environmental, and Legal—into clearly labeled segments using a modern hexagonal layout. Each section offers dedicated space for brief analysis or key data points, making it perfect for risk assessment, market evaluation, and forecasting discussions. Easily customizable in PowerPoint, Keynote, and Google Slides.


28 diapositivas
Ignite Rebranding Project Plan Presentation
Ignite your brand with this vibrant project plan template! Perfect for defining brand identity, vision, and strategy. Ideal for marketers and brand managers aiming to create a cohesive and compelling brand presence. Compatible with PowerPoint, Keynote, and Google Slides, this template ensures your branding is impactful and professional. Make your brand unforgettable!


6 diapositivas
Sports Training Program Presentation
Get ready to energize your audience with a slide that feels fast, motivating, and built for action. This presentation helps you outline key training steps, performance goals, and athletic milestones in a clean, visual way that keeps information clear and engaging. Fully compatible with PowerPoint, Keynote, and Google Slides.


26 diapositivas
Entrepreneurship 101 Professional Presentation
This template offers a modern, professional framework for presentations about Entrepreneurship 101. It combines a clean, contemporary design with a palette of cool blues and muted reds, setting a tone that's both creative and serious—just right for the innovative spirit of entrepreneurship. Within its slides, you'll find all the tools needed to outline the essentials of starting a new business, from identifying opportunities to understanding market trends. Perfect for aspiring entrepreneurs, business school classes, or startup workshops, the template includes varied slide types: team introductions, big ideas, comparative analyses, and growth charts. The slides also feature infographics for brainstorming sessions, process flows for business operations, and timeline representations for strategic planning. Designed for adaptability, the template works seamlessly with PowerPoint, Keynote, and Google Slides, ensuring your entrepreneurial vision can be shared with clarity and impact.


7 diapositivas
Simple Table of Content Slide Presentation
A clean, structured layout makes it easy to guide your audience through key sections with clarity and flow. This simple table of content slide helps you introduce topics, outline ideas, and set expectations in a polished, professional way. Fully compatible with PowerPoint, Keynote, and Google Slides.


5 diapositivas
Cryptocurrency Investment Overview Presentation
Capture the excitement of digital investing with this clean, modern layout designed to visualize market performance, asset insights, and portfolio trends. Perfect for financial analysts, startups, and educators, it simplifies complex data into engaging visuals. Fully compatible with PowerPoint, Keynote, and Google Slides for seamless editing and presentation delivery.


21 diapositivas
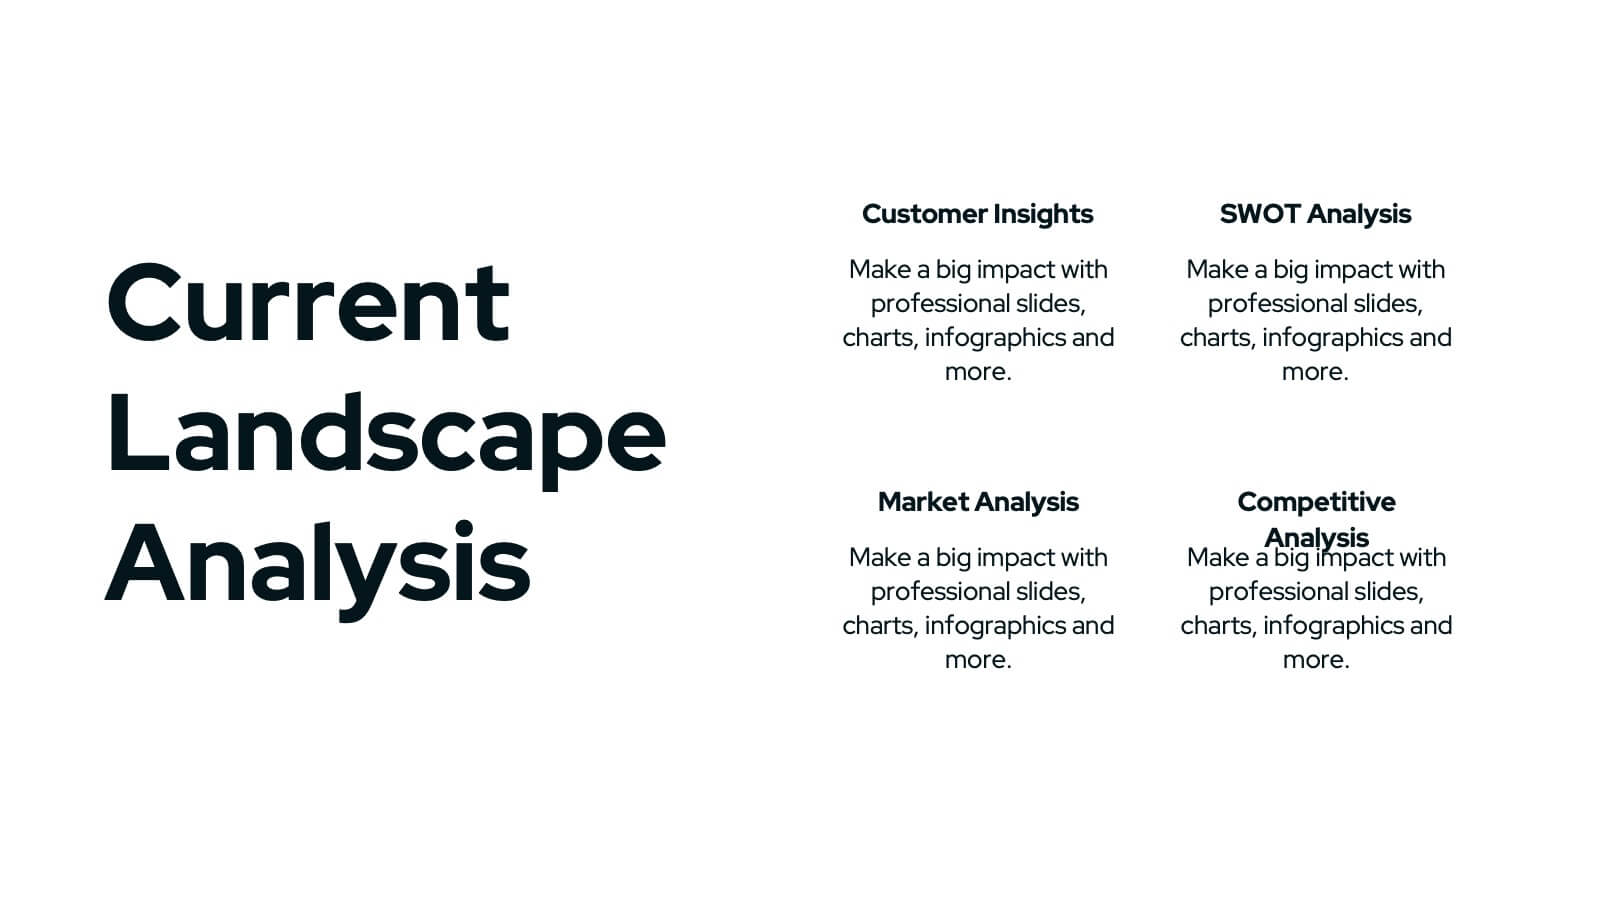
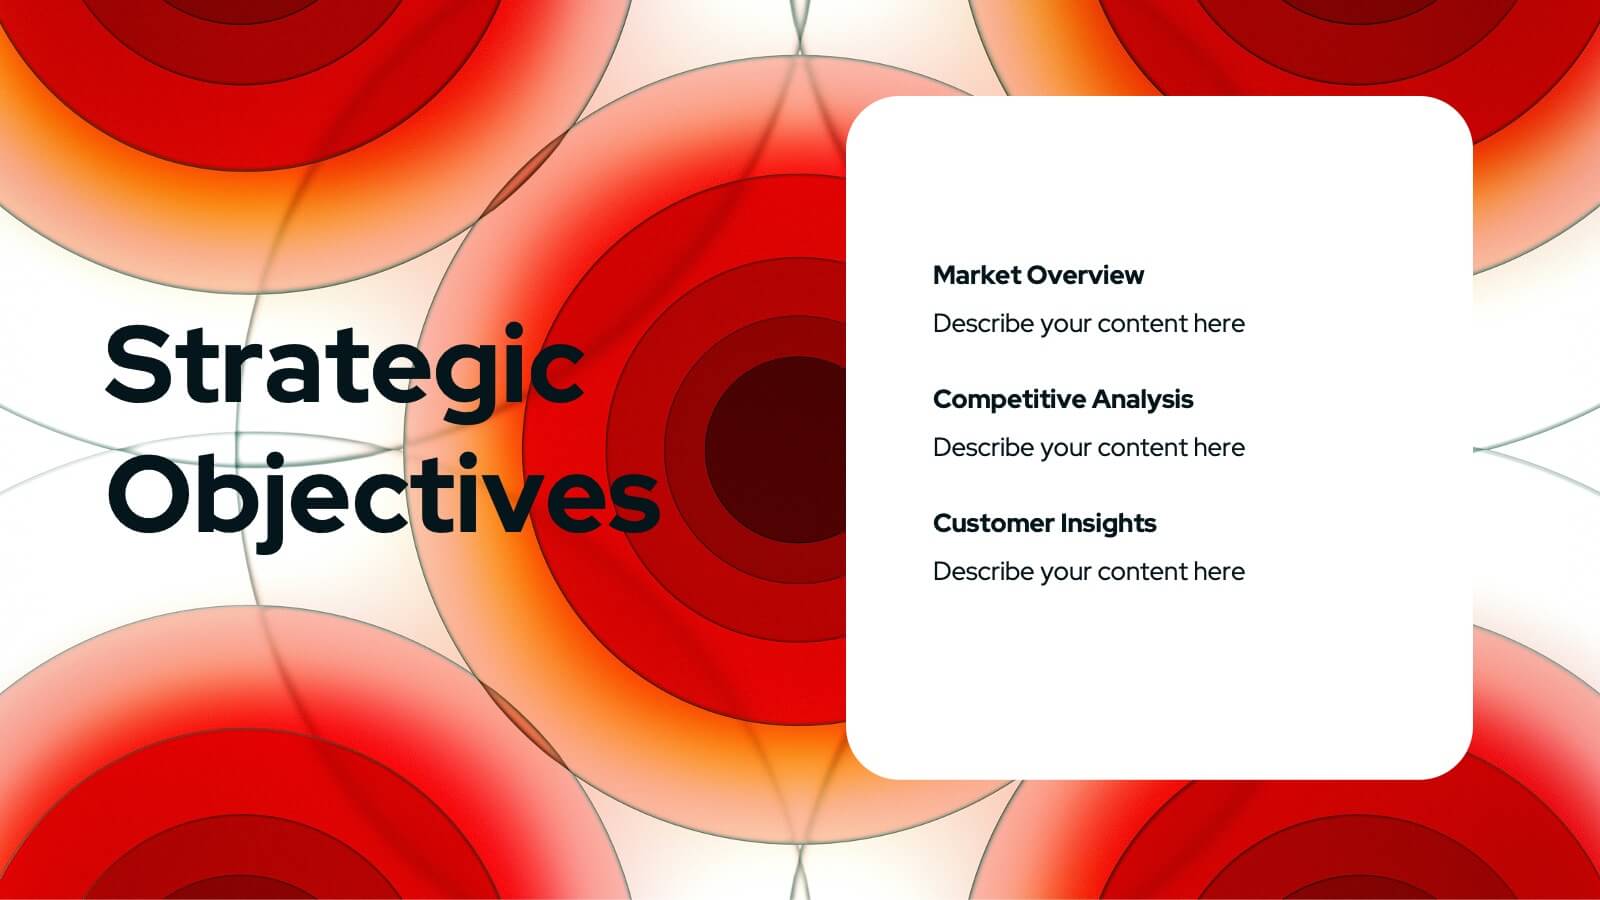
Wyrm Marketing Strategy Plan Presentation
Unleash the power of your marketing strategy with this bold and dynamic presentation template! Perfect for covering everything from landscape analysis and target audience identification to performance metrics and risk management. This template helps guide your audience through key challenges, SWOT analysis, and strategic initiatives with clarity and impact. Compatible with PowerPoint, Keynote, and Google Slides for effortless and engaging presentations.


5 diapositivas
Customer Loyalty Program Strategy
Design a winning rewards system with this engaging loyalty program infographic. Featuring a vertical layout with five customizable stages alongside a gift icon, this slide is perfect for outlining incentives, customer tiers, or retention plans. Fully editable in PowerPoint, Keynote, and Google Slides.


6 diapositivas
Commercial Real Estate Infographics
Explore the world of Commercial Real Estate with our customizable infographic template. This template is fully compatible with popular presentation software like PowerPoint, Keynote, and Google Slides, allowing you to easily customize it to illustrate and communicate various aspects of commercial real estate. The Commercial Real Estate infographic template offers a visually engaging platform to outline the different types of commercial properties, investment strategies, market trends, and the benefits of investing in commercial real estate. Whether you're a real estate professional, investor, business owner, or simply interested in the world of commercial properties, this template provides a user-friendly canvas to create informative presentations and educational materials. Deepen your knowledge of Commercial Real Estate with this SEO-optimized infographic template, thoughtfully designed for clarity and ease of use. Customize it to showcase property types (e.g., office, retail, industrial), financing options, risk management, and the potential for income and growth, ensuring that your audience gains valuable insights into this lucrative sector. Start crafting your personalized infographic today to explore the realm of Commercial Real Estate.


6 diapositivas
Goal Setting and Strategic Planning Presentation
Present objectives and action plans with the Goal Setting and Strategic Planning template. Featuring a modern segmented design, this layout is perfect for outlining priorities, initiatives, and milestones. Fully editable in Canva, PowerPoint, and Google Slides, allowing you to adapt colors, icons, and text to match your business vision.


8 diapositivas
Europe Market Trends with Europe Map Presentation
Showcase key market insights with this Europe-focused presentation. Highlight regional trends using data-driven visuals, including percentage indicators and color-coded country comparisons. Ideal for marketing reports, business expansion plans, or performance reviews. Fully editable and compatible with PowerPoint, Keynote, and Google Slides for seamless customization across platforms.