


Características


¿Tienes alguna pregunta?
Recomendar


5 diapositivas
Sports Legends Infographics
Sport Legends play a significant role in inspiring and motivating aspiring athletes to achieve their goals. These Infographics can provide an educational and visually appealing way to showcase the accomplishments and achievements of some of the greatest athletes in history. These infographics can highlight specific individuals, teams, or eras, and can include statistics, records, awards, and other notable accomplishments. All the design elements are customizable and can include illustrations of the athletes, logos or team colors, and text boxes to highlight statistics and provide additional information.


21 diapositivas
Flare Project Management Plan Presentation
Unleash the full potential of your projects with a dynamic plan template that makes every detail shine! This vibrant and clear design is built to guide your team and stakeholders through every phase of your project with confidence and clarity. Starting with a compelling introduction and project overview, this template captures attention and sets the stage for success. Dive deep into problem statements, objectives, and the scope of work, all presented in a visually appealing and easy-to-digest format. With sections dedicated to timelines, milestones, budget breakdowns, and resource allocation, this template ensures every aspect of your project is meticulously planned and communicated. The inclusion of stakeholder analysis, risk management, and quality assurance plans showcases your thorough approach to project management. Perfectly compatible with PowerPoint, Keynote, and Google Slides, this template is your go-to tool for creating project plans that are both inspiring and effective. Get ready to impress and lead your projects to success!

21 diapositivas
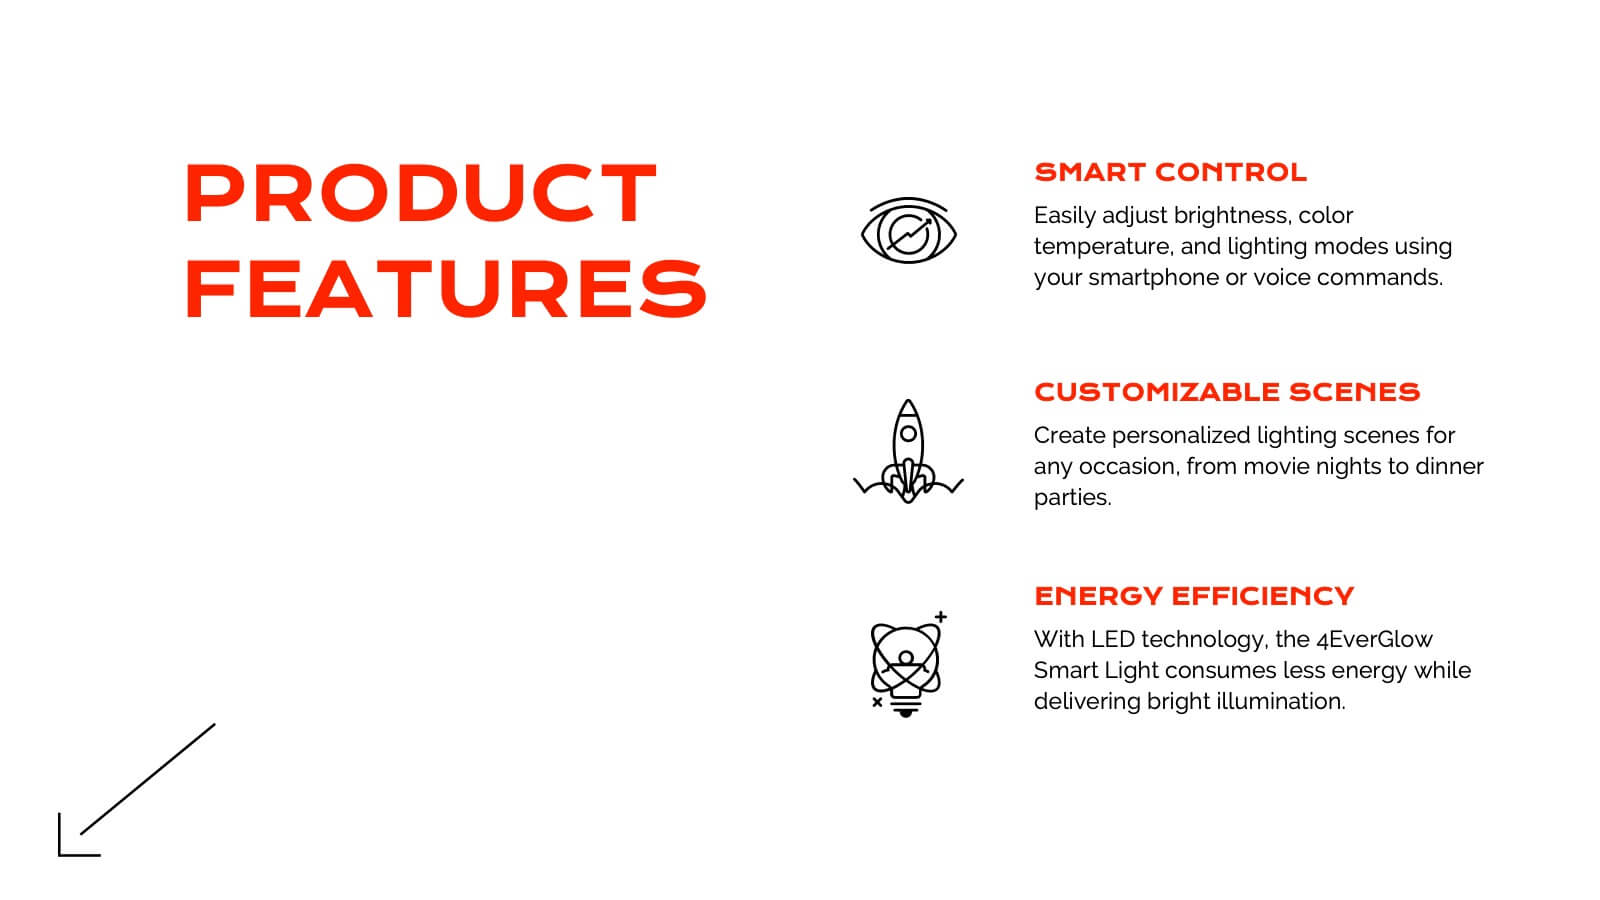
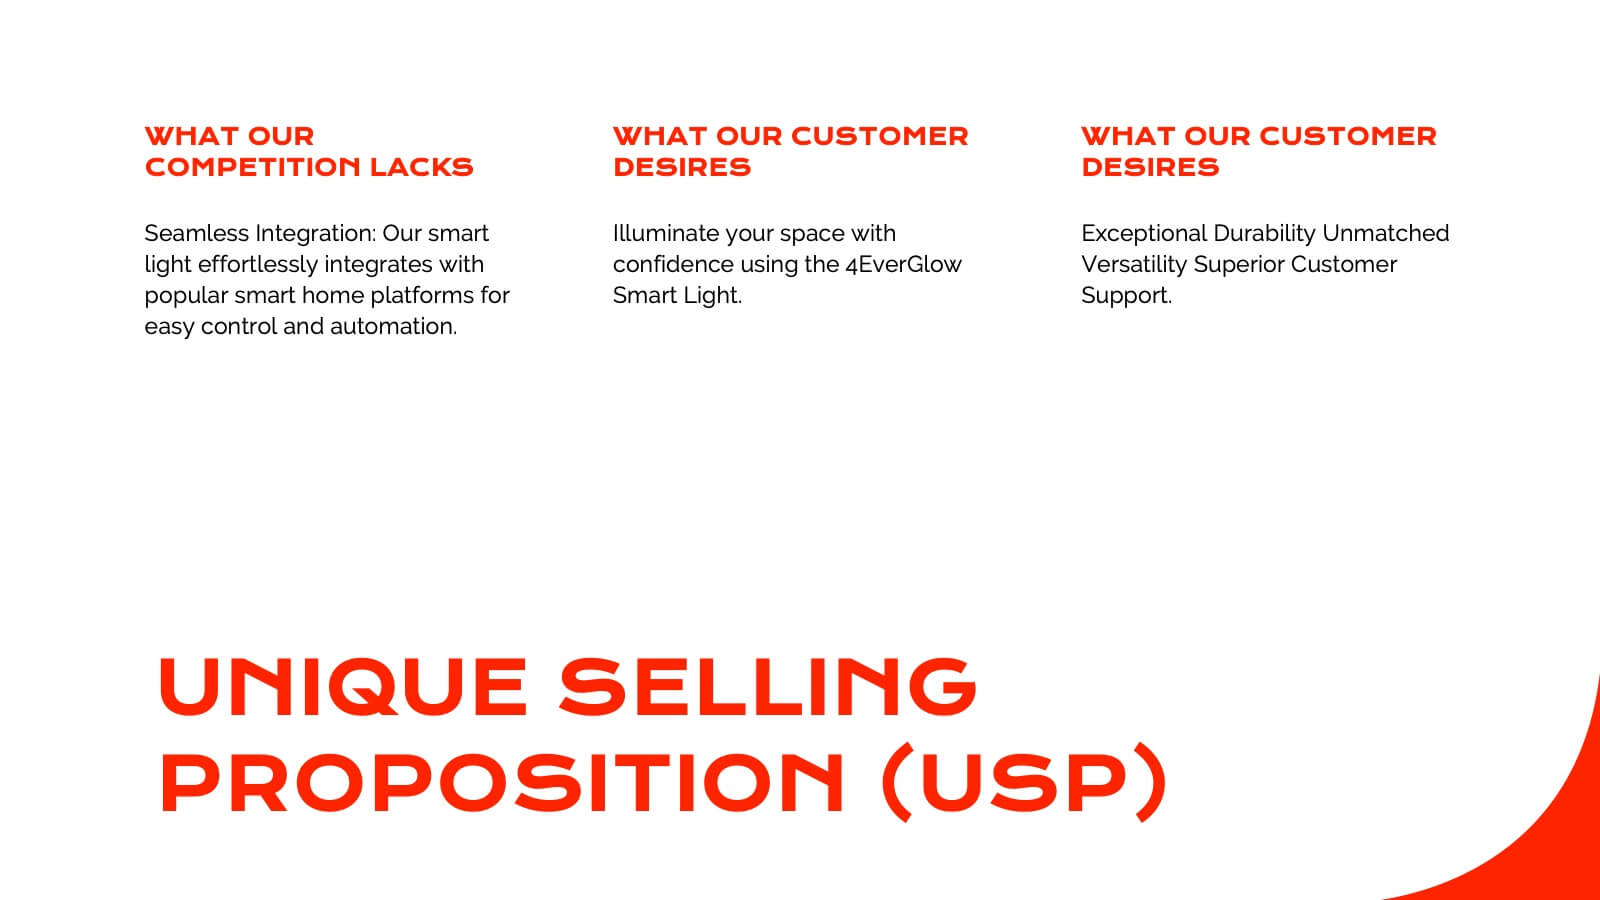
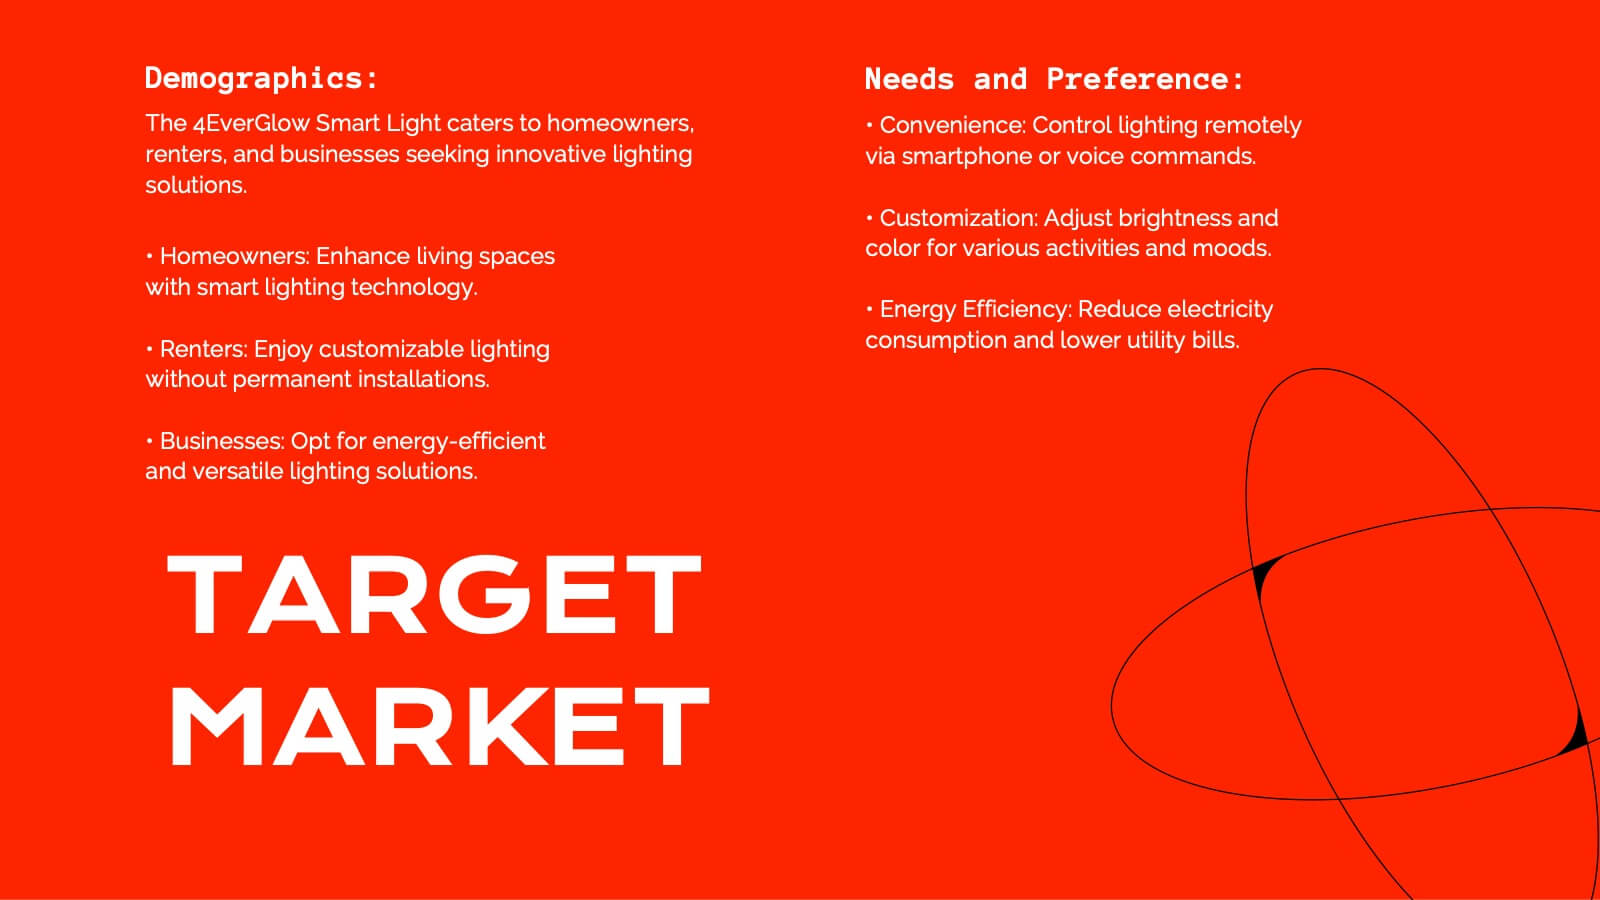
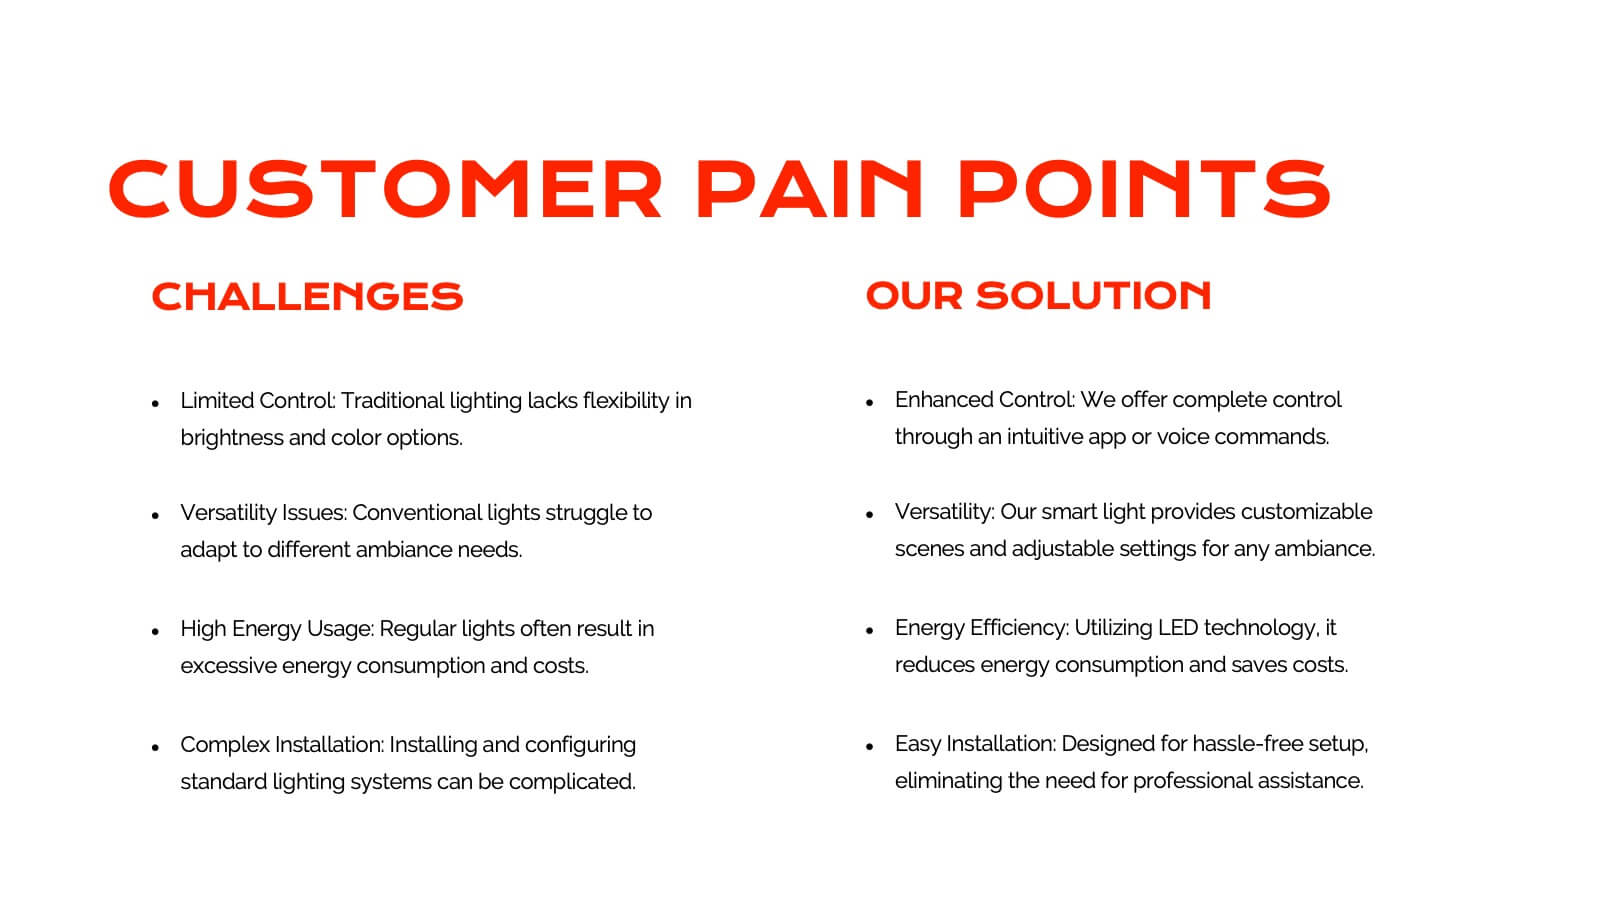
Juventas Product Roadmap Presentation
Get ready to dazzle your audience with a visually striking presentation that takes them through the entire product journey! This template covers essential areas such as product features, target market analysis, and competitive positioning. With its sleek, modern design, it's perfect for capturing attention and delivering clear information. Compatible with PowerPoint, Keynote, and Google Slides for effortless use across platforms.


4 diapositivas
Meetings Agenda Slide Presentation
Make every meeting feel purposeful with a clean layout that highlights topics, timing, and key discussion points effortlessly. This presentation helps teams stay aligned, organized, and ready to follow the flow of the session. Perfect for planning or reporting. Fully compatible with PowerPoint, Keynote, and Google Slides.


3 diapositivas
Customers Loyalty Program Strategy Presentation
Turn customer rewards into a story worth sharing with this modern, visually engaging layout. Ideal for showcasing loyalty program concepts, benefits, and engagement strategies, it helps businesses highlight how they retain and reward loyal clients. Fully customizable and compatible with PowerPoint, Keynote, and Google Slides for effortless presentation design.


26 diapositivas
Tempo Brand Identity Presentation
Introduce and elevate your brand with this versatile presentation template designed to reflect your company's vision and values. Perfect for businesses looking to showcase their brand strategy, components, and touchpoints with clarity and professionalism. This presentation features thoughtfully designed slides covering brand identity components, visual guidelines, target audience insights, and future development plans. Use dedicated sections to outline your unique selling proposition, positioning, and strategy. With its clean layout and attention to detail, it's ideal for presenting a cohesive and impactful brand narrative. Compatible with PowerPoint, Google Slides, and Keynote, this template is fully customizable. Edit colors, text, and images to align with your brand aesthetics and messaging. Deliver your presentation with confidence, ensuring your audience is inspired by a polished and professional brand identity.


4 diapositivas
Conversion Funnel Stages Presentation
Bring clarity to every step of your customer journey with this clean, visually aligned funnel layout designed for quick understanding. This presentation breaks your process into clear stages, helping you explain performance, drop-offs, and opportunities with ease. Fully compatible with PowerPoint, Keynote, and Google Slides.


28 diapositivas
Pitch Deck Entrepreneur's Canvas Presentation
Sharpen your business presentation with this Pitch Deck template. It covers essential areas such as market opportunity, business model, and competitive analysis, designed for startups and entrepreneurs. Fully customizable and compatible with PowerPoint, Keynote, and Google Slides, it's ideal for impressing investors and partners with your business vision.


21 diapositivas
Moonshade Strategic Planning Report Presentation
This strategic planning template provides a comprehensive framework to align your business objectives with actionable plans. With sections for SWOT analysis, resource allocation, key metrics, and growth opportunities, it ensures that every element is covered for successful execution. Customizable in PowerPoint, Keynote, and Google Slides, it's perfect for building focused, strategic initiatives.


6 diapositivas
Business Growth Metrics Butterfly Chart
Highlight performance patterns and opportunities with the Business Growth Metrics Butterfly Chart Presentation. This engaging layout uses mirrored radial segments to present six growth indicators—ideal for tracking progress across two categories, departments, or timeframes. The butterfly-shaped curves draw the viewer’s attention to the center, making comparisons intuitive and visually balanced. Fully customizable in PowerPoint, Keynote, and Google Slides, this template is perfect for showcasing KPI trends, sales metrics, or marketing performance.


5 diapositivas
Relationship Mapping Diagram Presentation
Bring clarity to complex connections with this clean and modern visual layout designed to map relationships, processes, or ideas effortlessly. Perfect for presentations that require structure and flow, it balances simplicity with professionalism. Fully customizable and compatible with PowerPoint, Keynote, and Google Slides for seamless design flexibility.


23 diapositivas
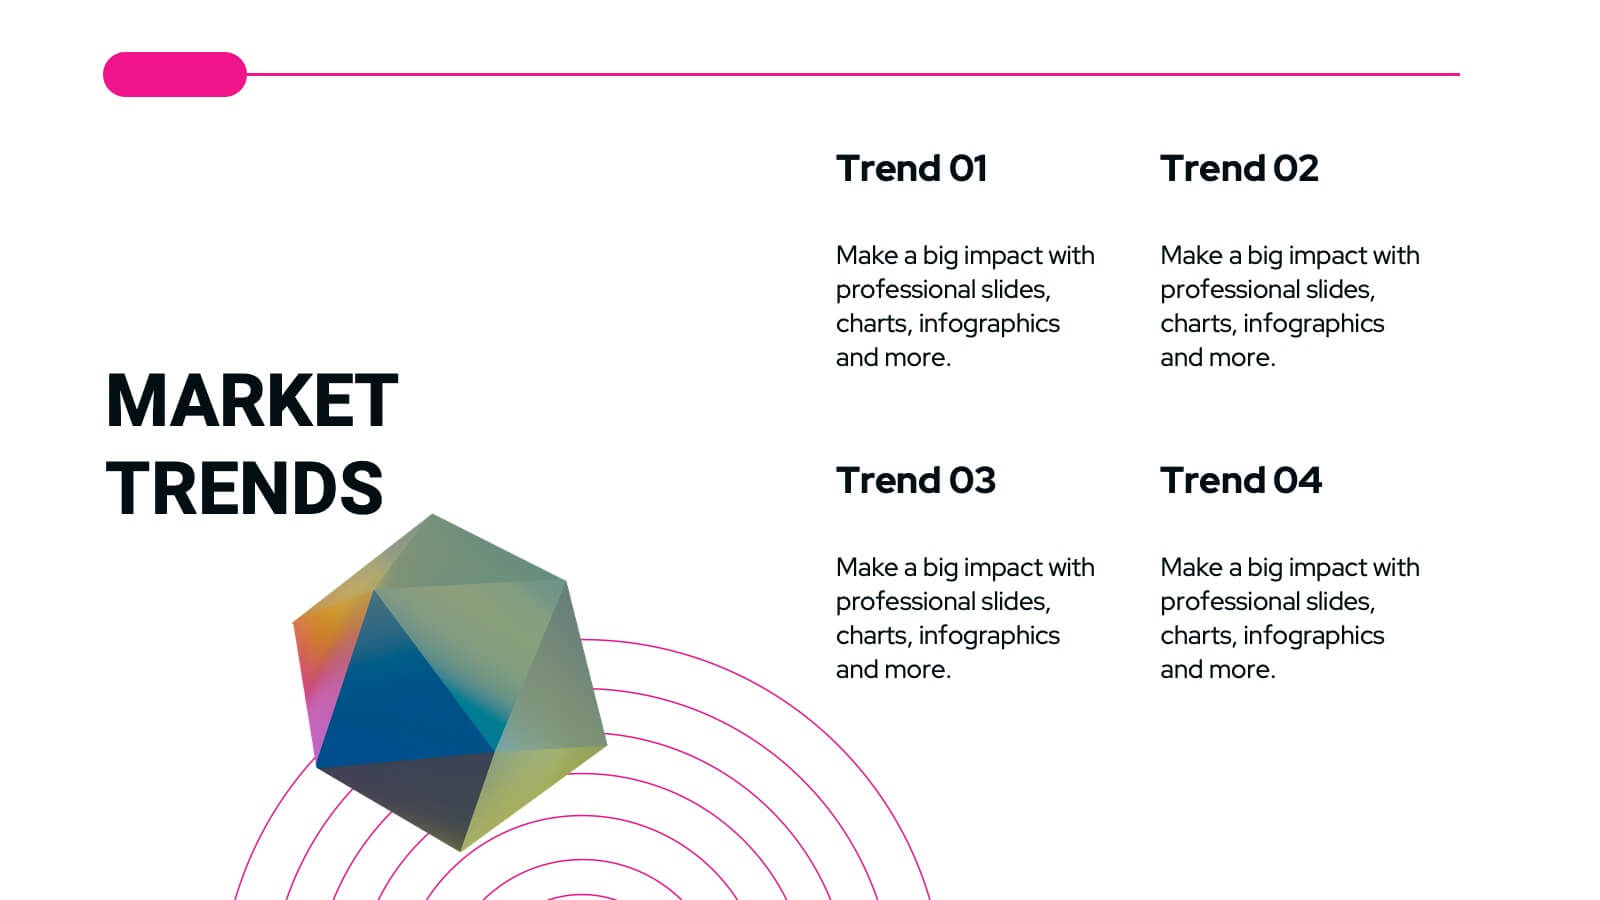
Ionian Corporate Strategy Report Presentation
The Ionian Corporate Strategy Report template offers a modern and dynamic approach to corporate presentations, designed to keep your audience engaged throughout. With a sleek, contemporary design in black, white, and purple tones, this template is perfect for presenting strategic plans, conference overviews, session breakdowns, and more. Each slide is crafted to facilitate a seamless flow of information, whether you're introducing a keynote speaker, discussing key objectives, or outlining conference agendas. The template includes placeholders for breakout sessions, networking breaks, Q&A sessions, and more, making it versatile and adaptable for various corporate events. It's fully compatible with PowerPoint, Keynote, and Google Slides, ensuring easy customization and a professional presentation experience. Use the Ionian Corporate Strategy Report template to make your next corporate presentation both impactful and memorable.


5 diapositivas
Dynamic SWOT Quadrant Assessment Presentation
Present your strategy with clarity using the Dynamic SWOT Quadrant Assessment Presentation. This clean, four-quadrant layout organizes your Strengths, Weaknesses, Opportunities, and Threats in a visually balanced format, perfect for strategic reviews and planning workshops. The bold quadrant visuals help guide the audience’s focus while allowing for detailed commentary alongside each factor. Fully customizable in PowerPoint, Keynote, and Google Slides.


24 diapositivas
Zenith Investor Pitch Presentation
Impress your investors with this sleek, modern pitch deck presentation template. Perfect for detailing problem statements, solutions, business models, and revenue projections, it features a professional design with a cohesive color scheme. Highlight key elements like market opportunities, competitive landscapes, and financials to captivate your audience. Compatible with PowerPoint, Keynote, and Google Slides, it ensures seamless presentations on any platform.


5 diapositivas
Studio Photography Infographics
Studio Photography is the practice of capturing photographs in a controlled environment, typically a dedicated photography studio. These infographic templates highlight the key aspects of studio photography with examples of fashion photography, photojournalism, and photography terminology. These are designed to assist photographers, photography studios, and enthusiasts in showcasing the essential elements and techniques involved in capturing stunning images in a studio setting. Use these to provides valuable insights and techniques to help your audience create stunning images in a studio environment. Compatible with Powerpoint, Keynote, and Google Slides.


8 diapositivas
Team Roles & Skills Chart Presentation
Bring your team’s strengths to life with this clean, engaging slide designed to highlight individual roles, skill levels, and key capabilities. It helps teams clearly visualize expertise, compare competencies, and communicate responsibilities with ease. Fully editable and compatible with PowerPoint, Keynote, and Google Slides.


6 diapositivas
OKR Goal-Setting Framework Presentation
Achieve clarity and focus with the OKR Goal-Setting Framework. This structured layout helps visualize objectives and key results using hexagonal elements for a clear strategic overview. Perfect for business planning, performance tracking, and team alignment. Fully editable and compatible with PowerPoint, Keynote, and Google Slides for effortless customization.