


Características


¿Tienes alguna pregunta?
Recomendar


26 diapositivas
Kohen Presentation Template
Kohen is a minimal coffee shop template that features slide designs you can use together, making it perfect for sharing your business and services. It is easy to use, resulting in convenient high quality presentations. This template design can be used to create more elaborate presentations about food and restaurants. It is complete with charts, images, and text boxes for endless presentation possibilities. This template will help make your message more compelling and informative. The presentation includes a variety of tools and resources, to highlight key points and ideas with minimal text.


6 diapositivas
Office Scenes Season Infographic
"Office Scenes" typically refer to the environments and activities that take place within an office setting. This Infographic template is a visual representation that showcases different scenarios and activities that commonly take place in an office environment. This type of infographic can be used to illustrate various aspects of office life, work culture, and interactions. This template provide insights into the day-to-day activities and culture of your workplace. Fully customizable and compatible with Powerpoint, Keynote, and Google Slides. Include your company logo or branding elements in the infographic.


7 diapositivas
Quantitative Insights and Data Analysis Presentation
Present survey results or demographic research with clarity using the Quantitative Insights and Data Analysis Presentation. This template features colorful, category-coded tables that simplify complex data, making it perfect for showcasing consumer segments, market research findings, or statistical insights. Fully editable in PowerPoint, Keynote, and Google Slides.


21 diapositivas
Cerberus Project Timeline Presentation
Bring your project vision to life with a well-structured plan that flows effortlessly. This presentation covers everything from objectives and timelines to budget breakdowns, team introductions, and next steps, helping you communicate key details with clarity. Perfect for internal or client presentations, and fully compatible with PowerPoint, Keynote, and Google Slides.


7 diapositivas
Mind Map Process Infographic
A Mind Map Process Infographic is a visual representation that illustrates a process or a series of steps using the structure and principles of a mind map. This template diagram is a dynamic visual guide to help individuals and teams harness the true potential of mind mapping. This is used to visually organize information in a hierarchical and interconnected manner, often starting with a central concept or theme and branching out into related ideas or subtopics. Mind maps are the ultimate tool for brainstorming, planning, and innovating, and this template is your gateway to unlocking their full potential.


5 diapositivas
Banking and Rewards Credit Card Presentation
Highlight the value of credit card programs and customer incentives with this engaging rewards-themed infographic layout. The dynamic card and path visuals help illustrate benefits, user behavior, or loyalty stages effectively. Perfect for banking institutions, fintech startups, or rewards program pitches. Fully customizable in PowerPoint, Keynote, and Google Slides.


23 diapositivas
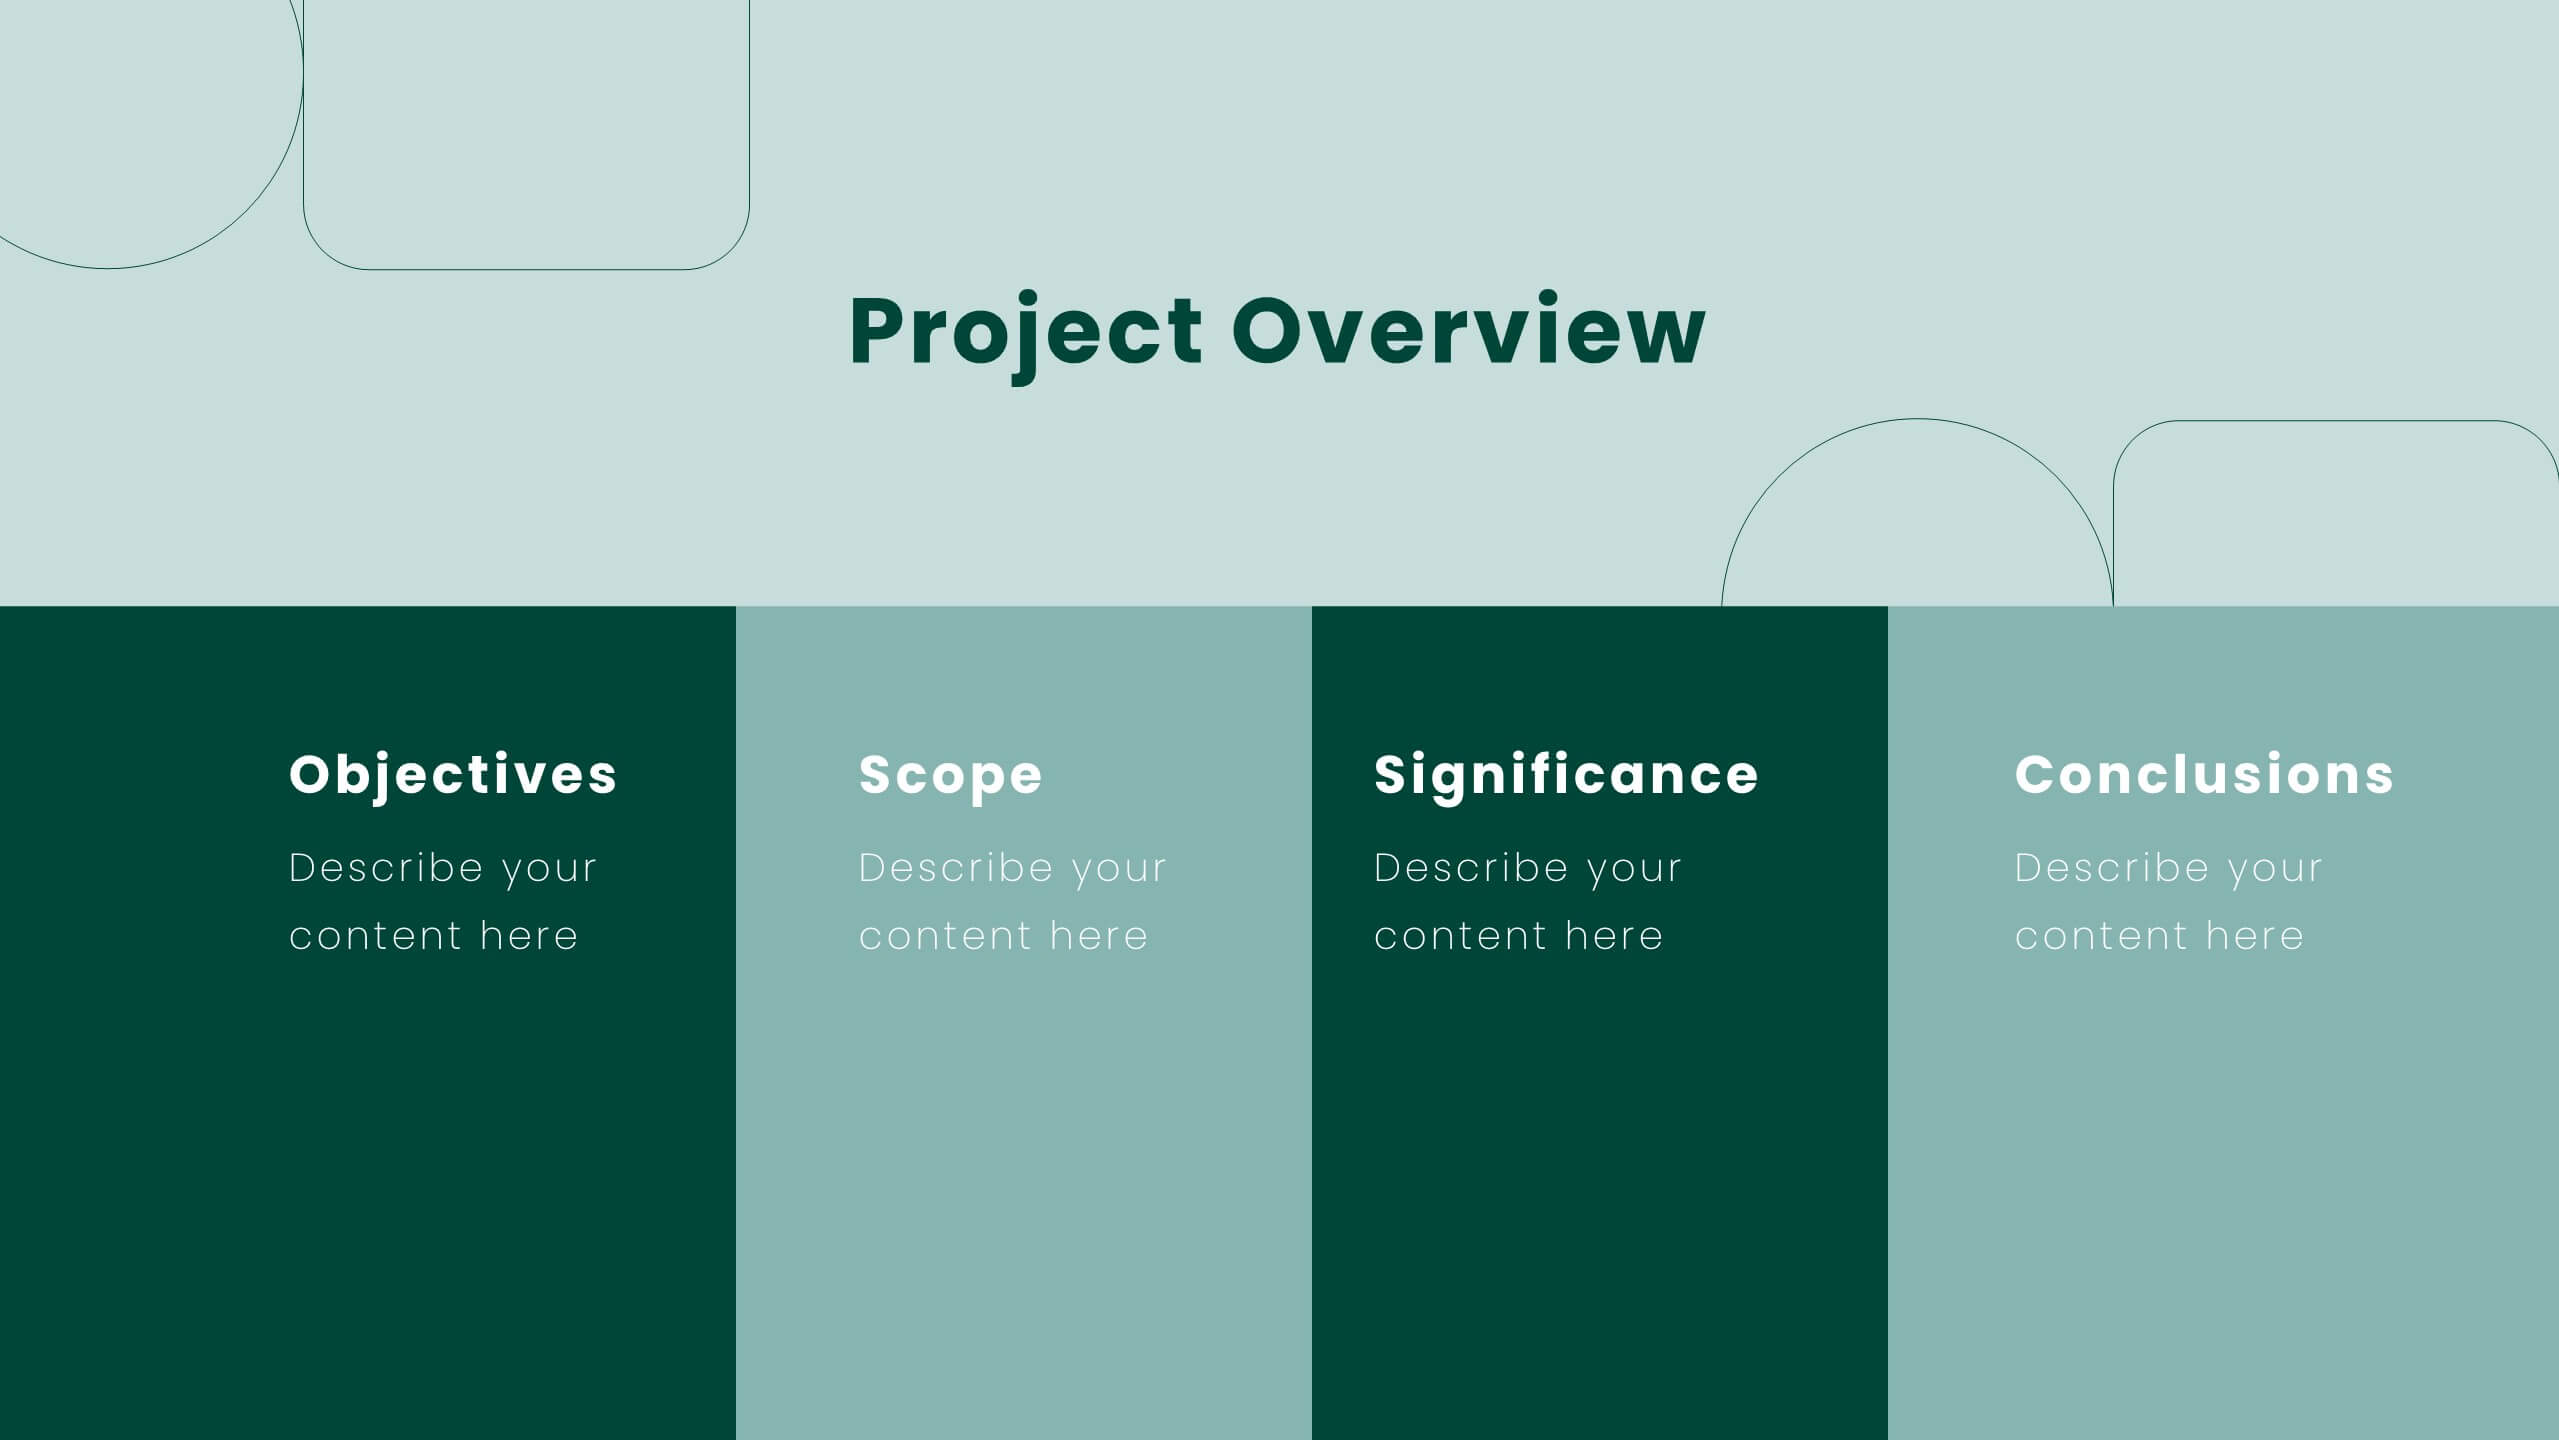
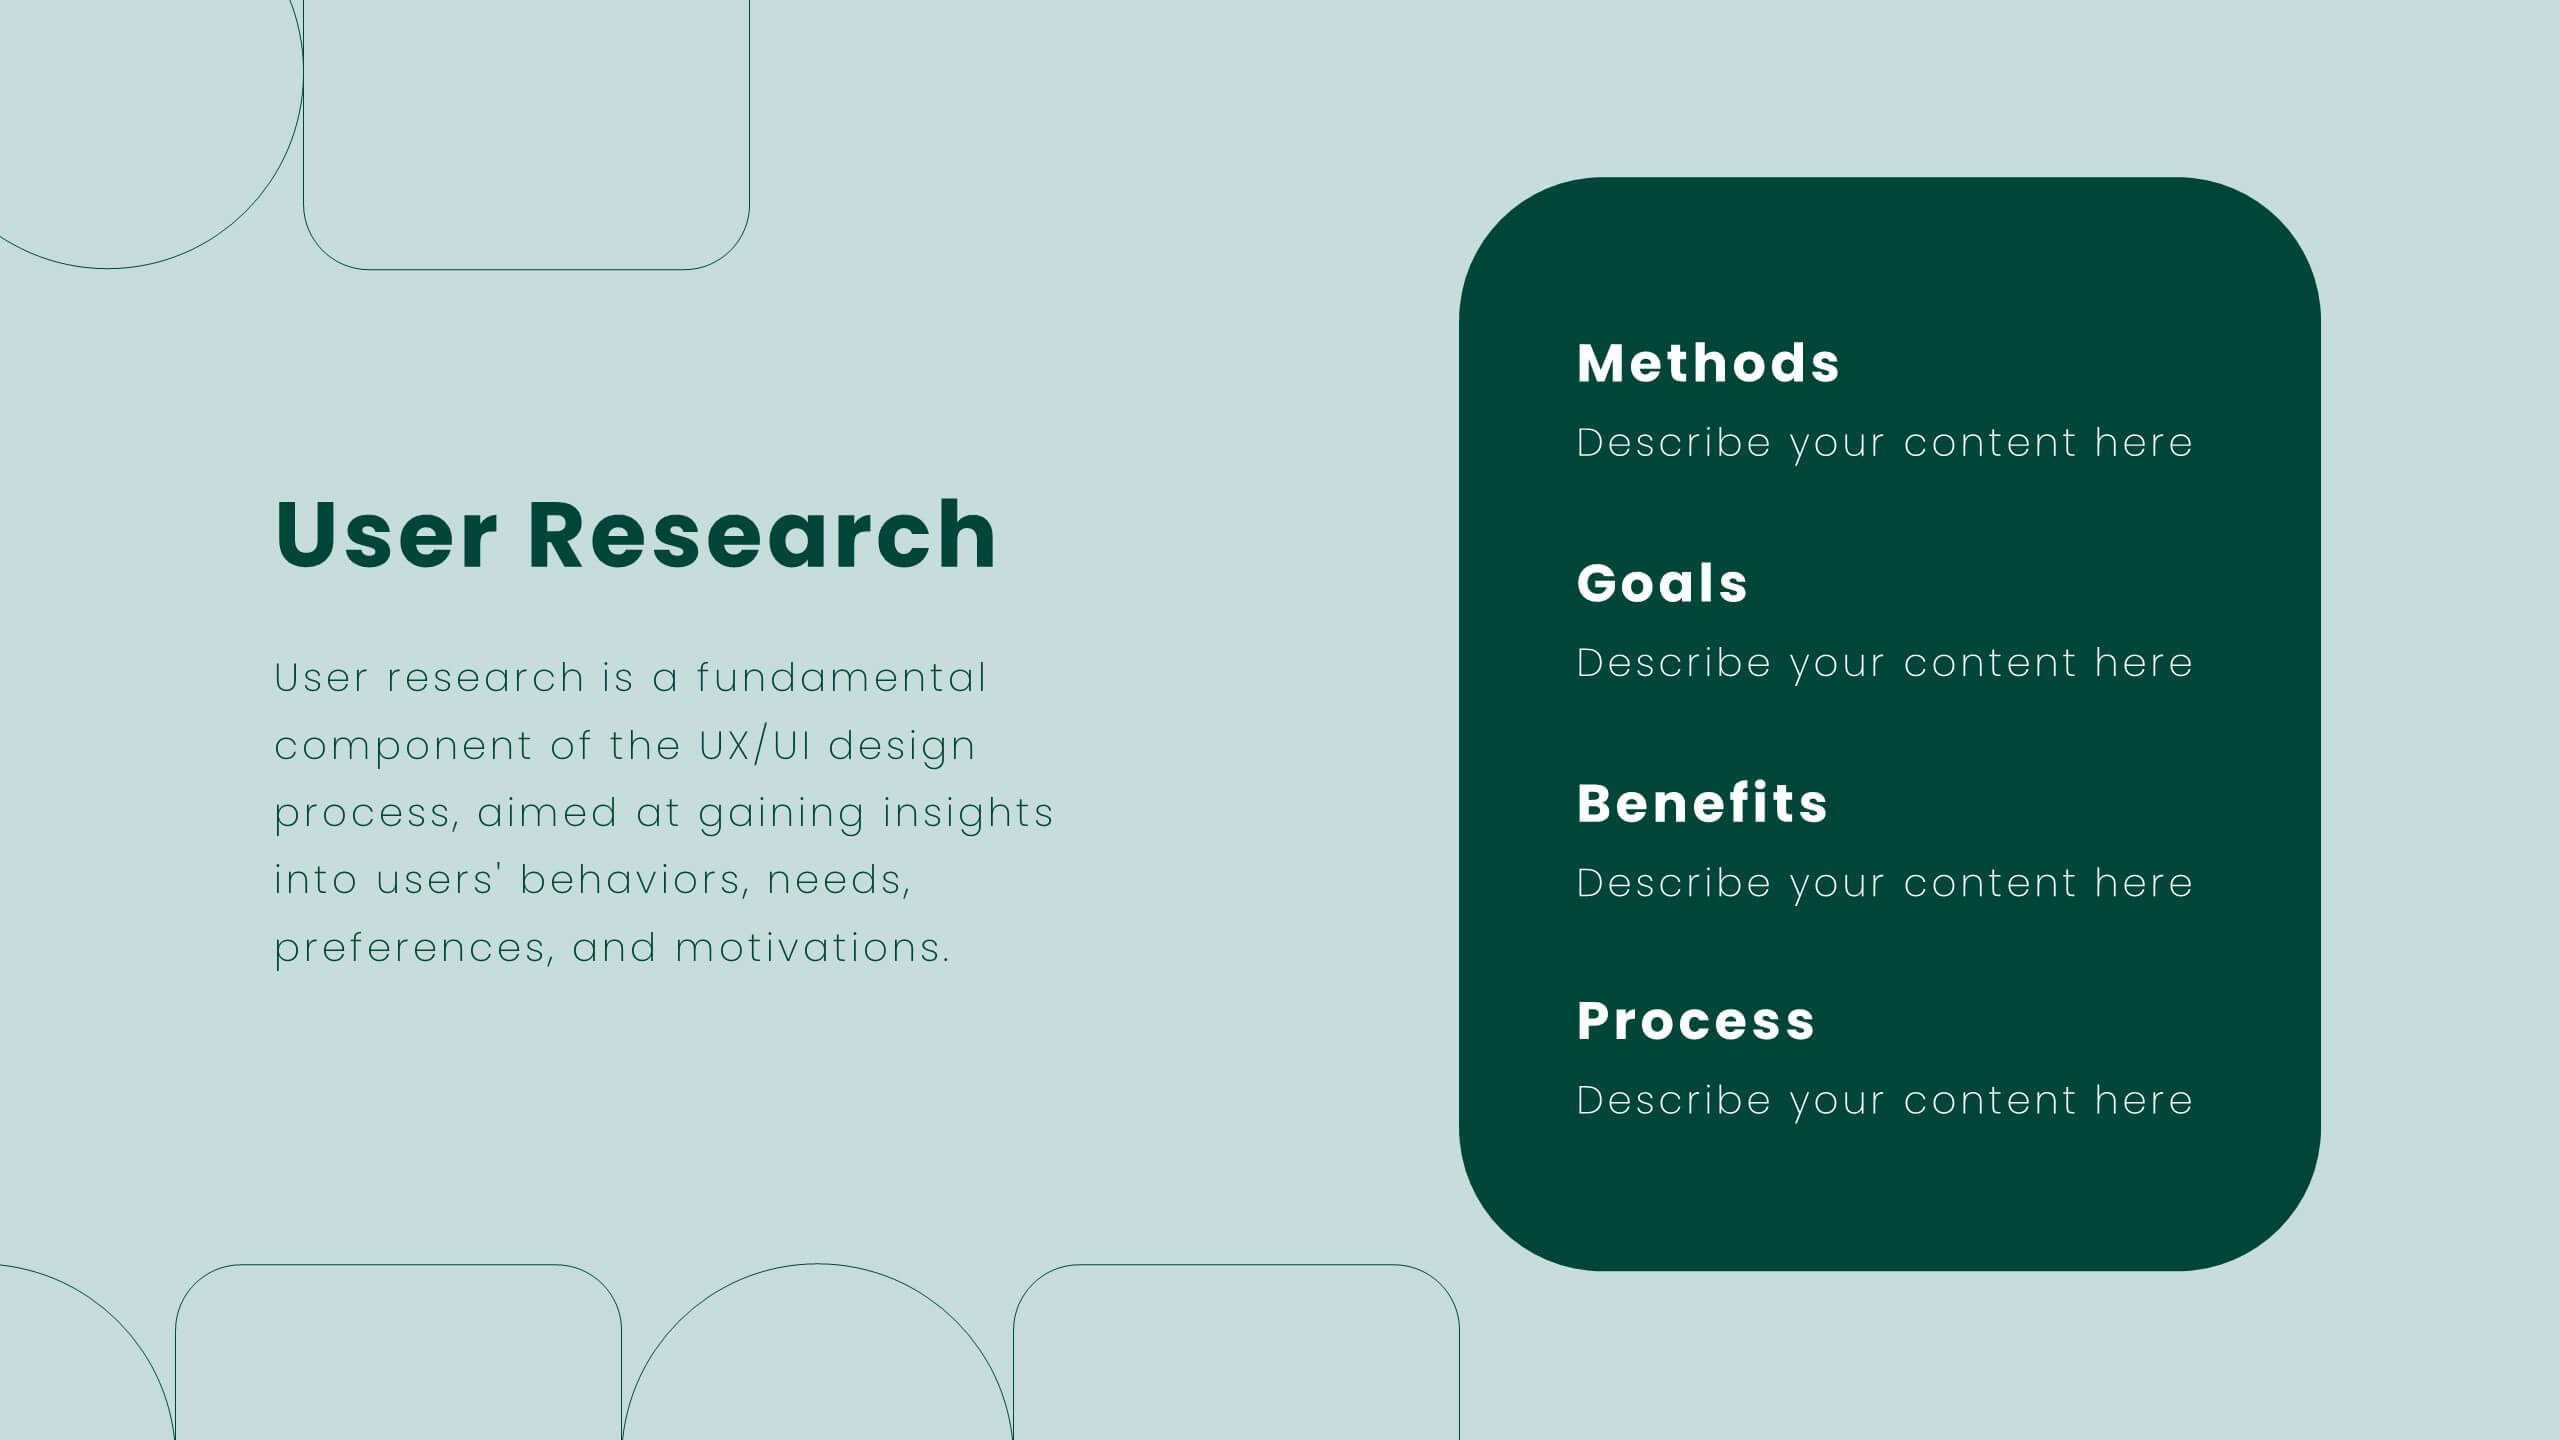
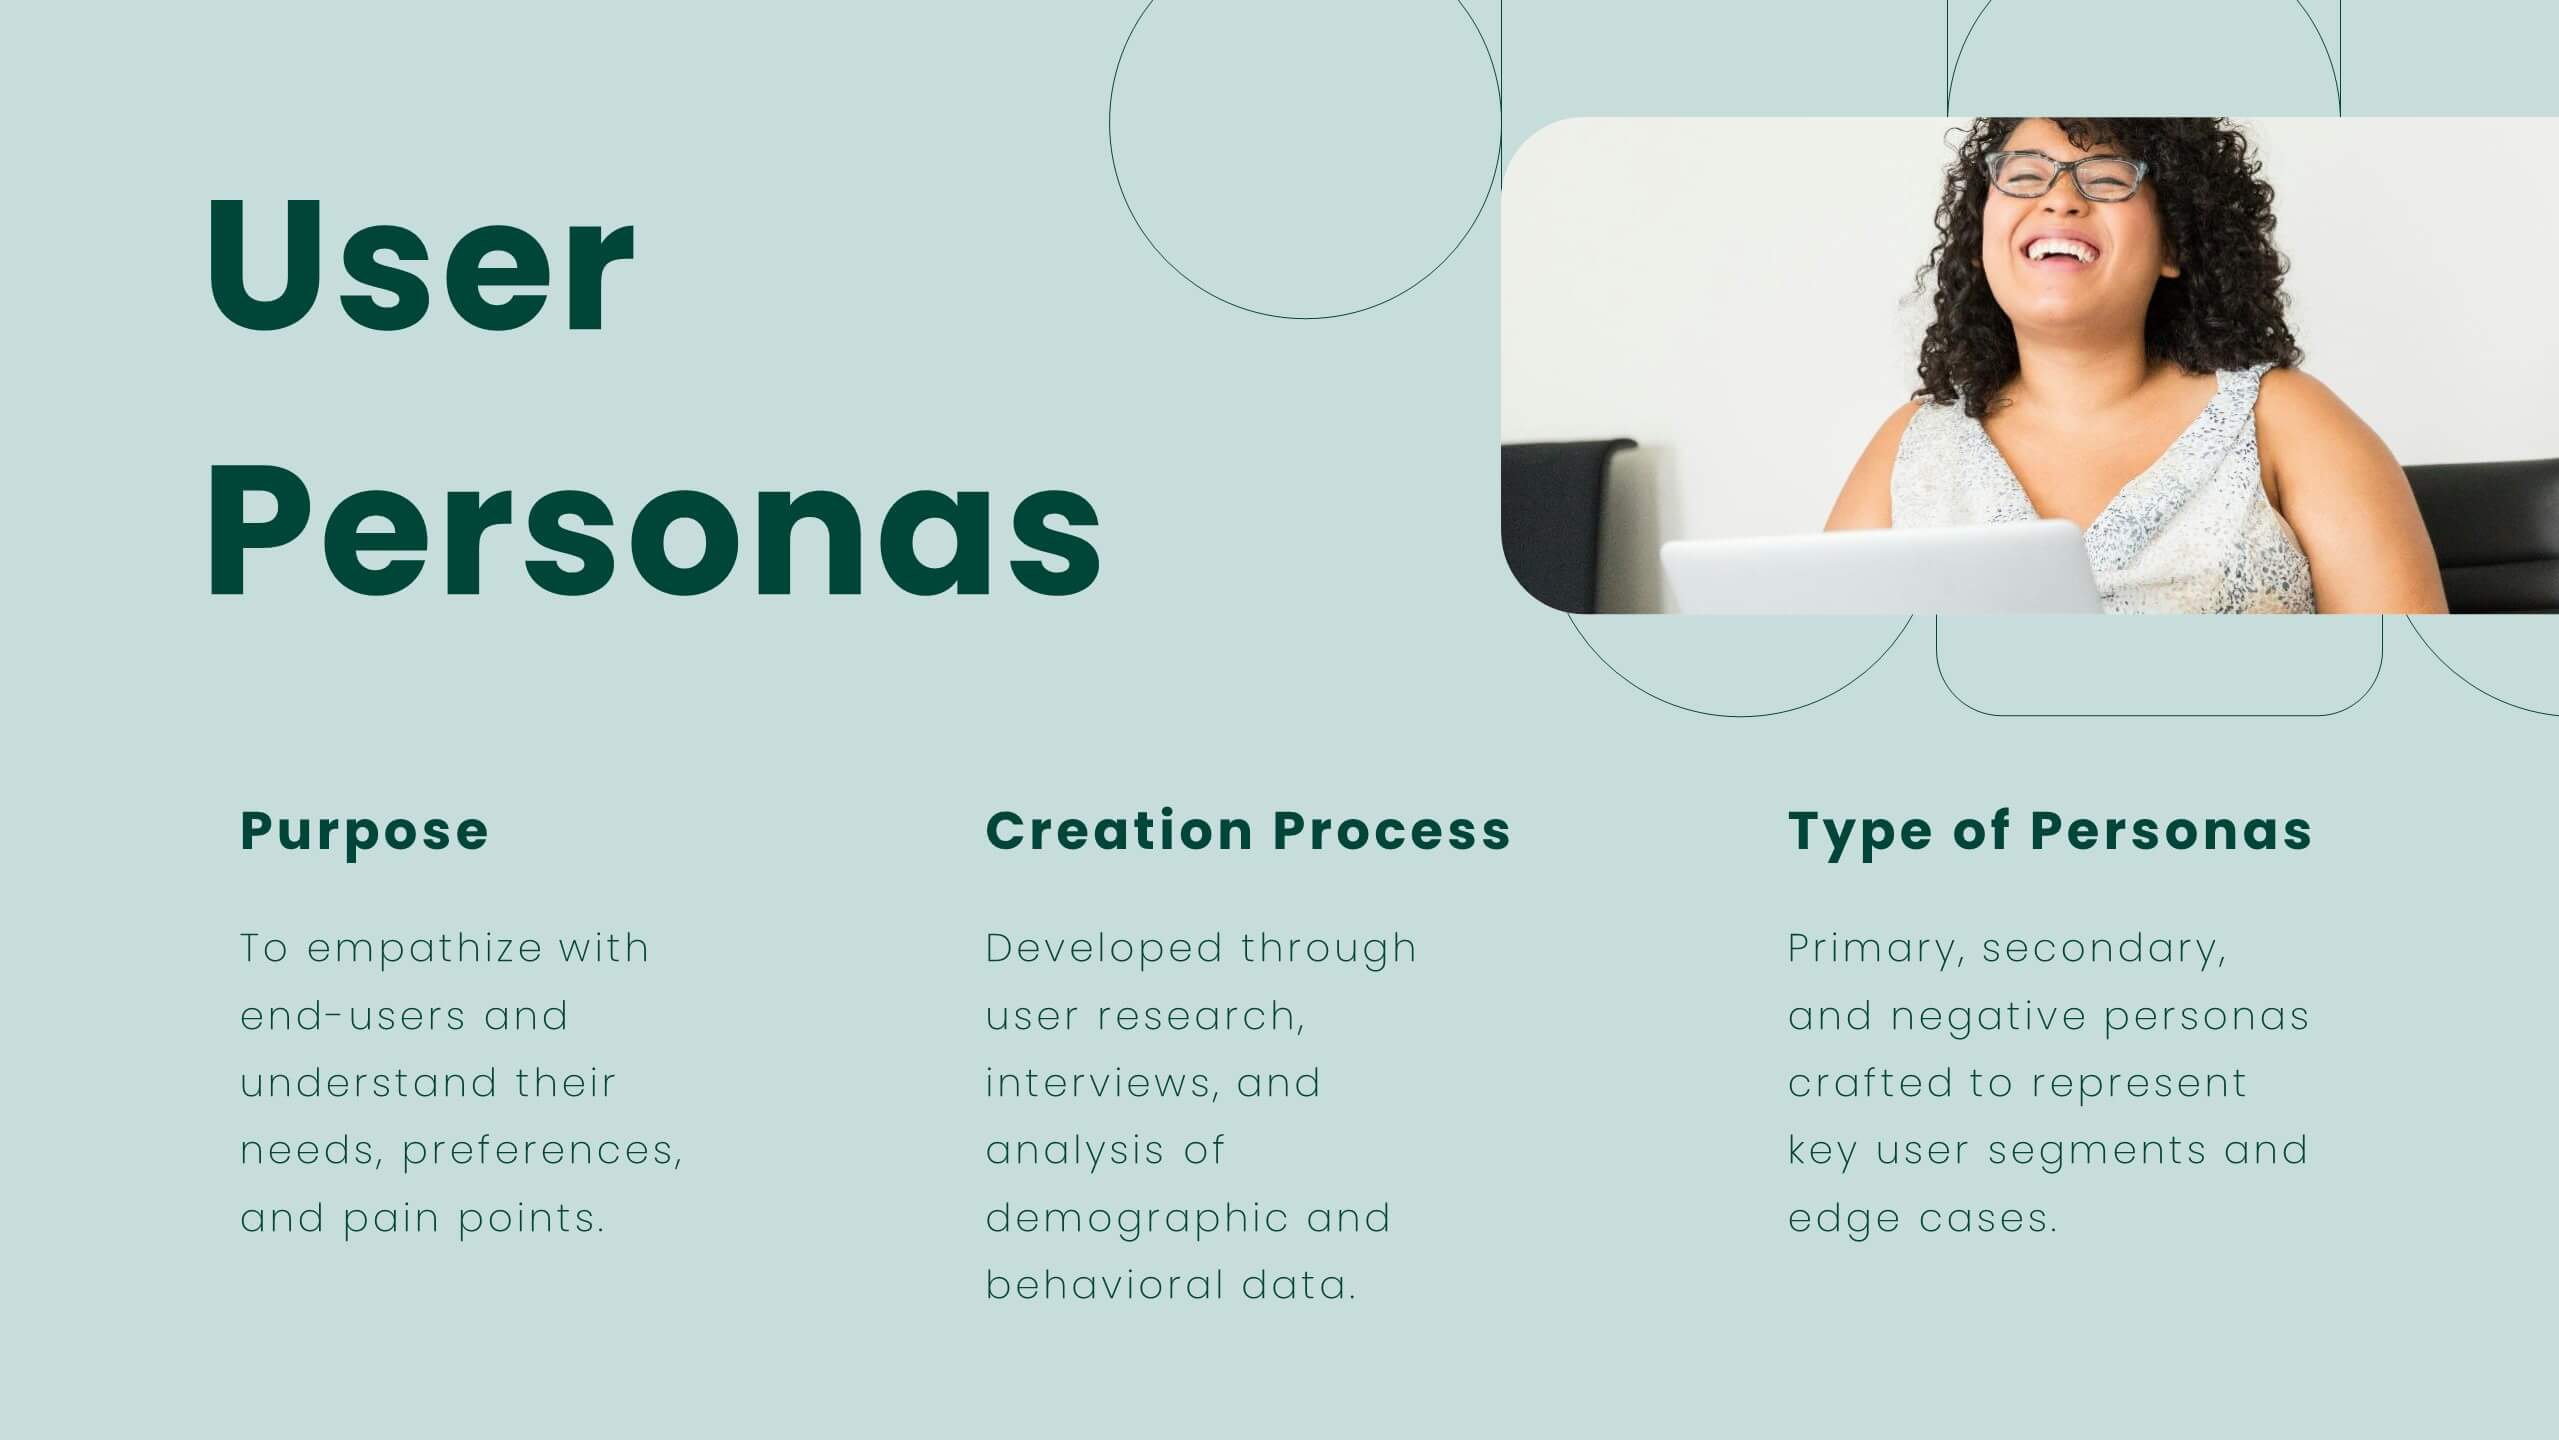
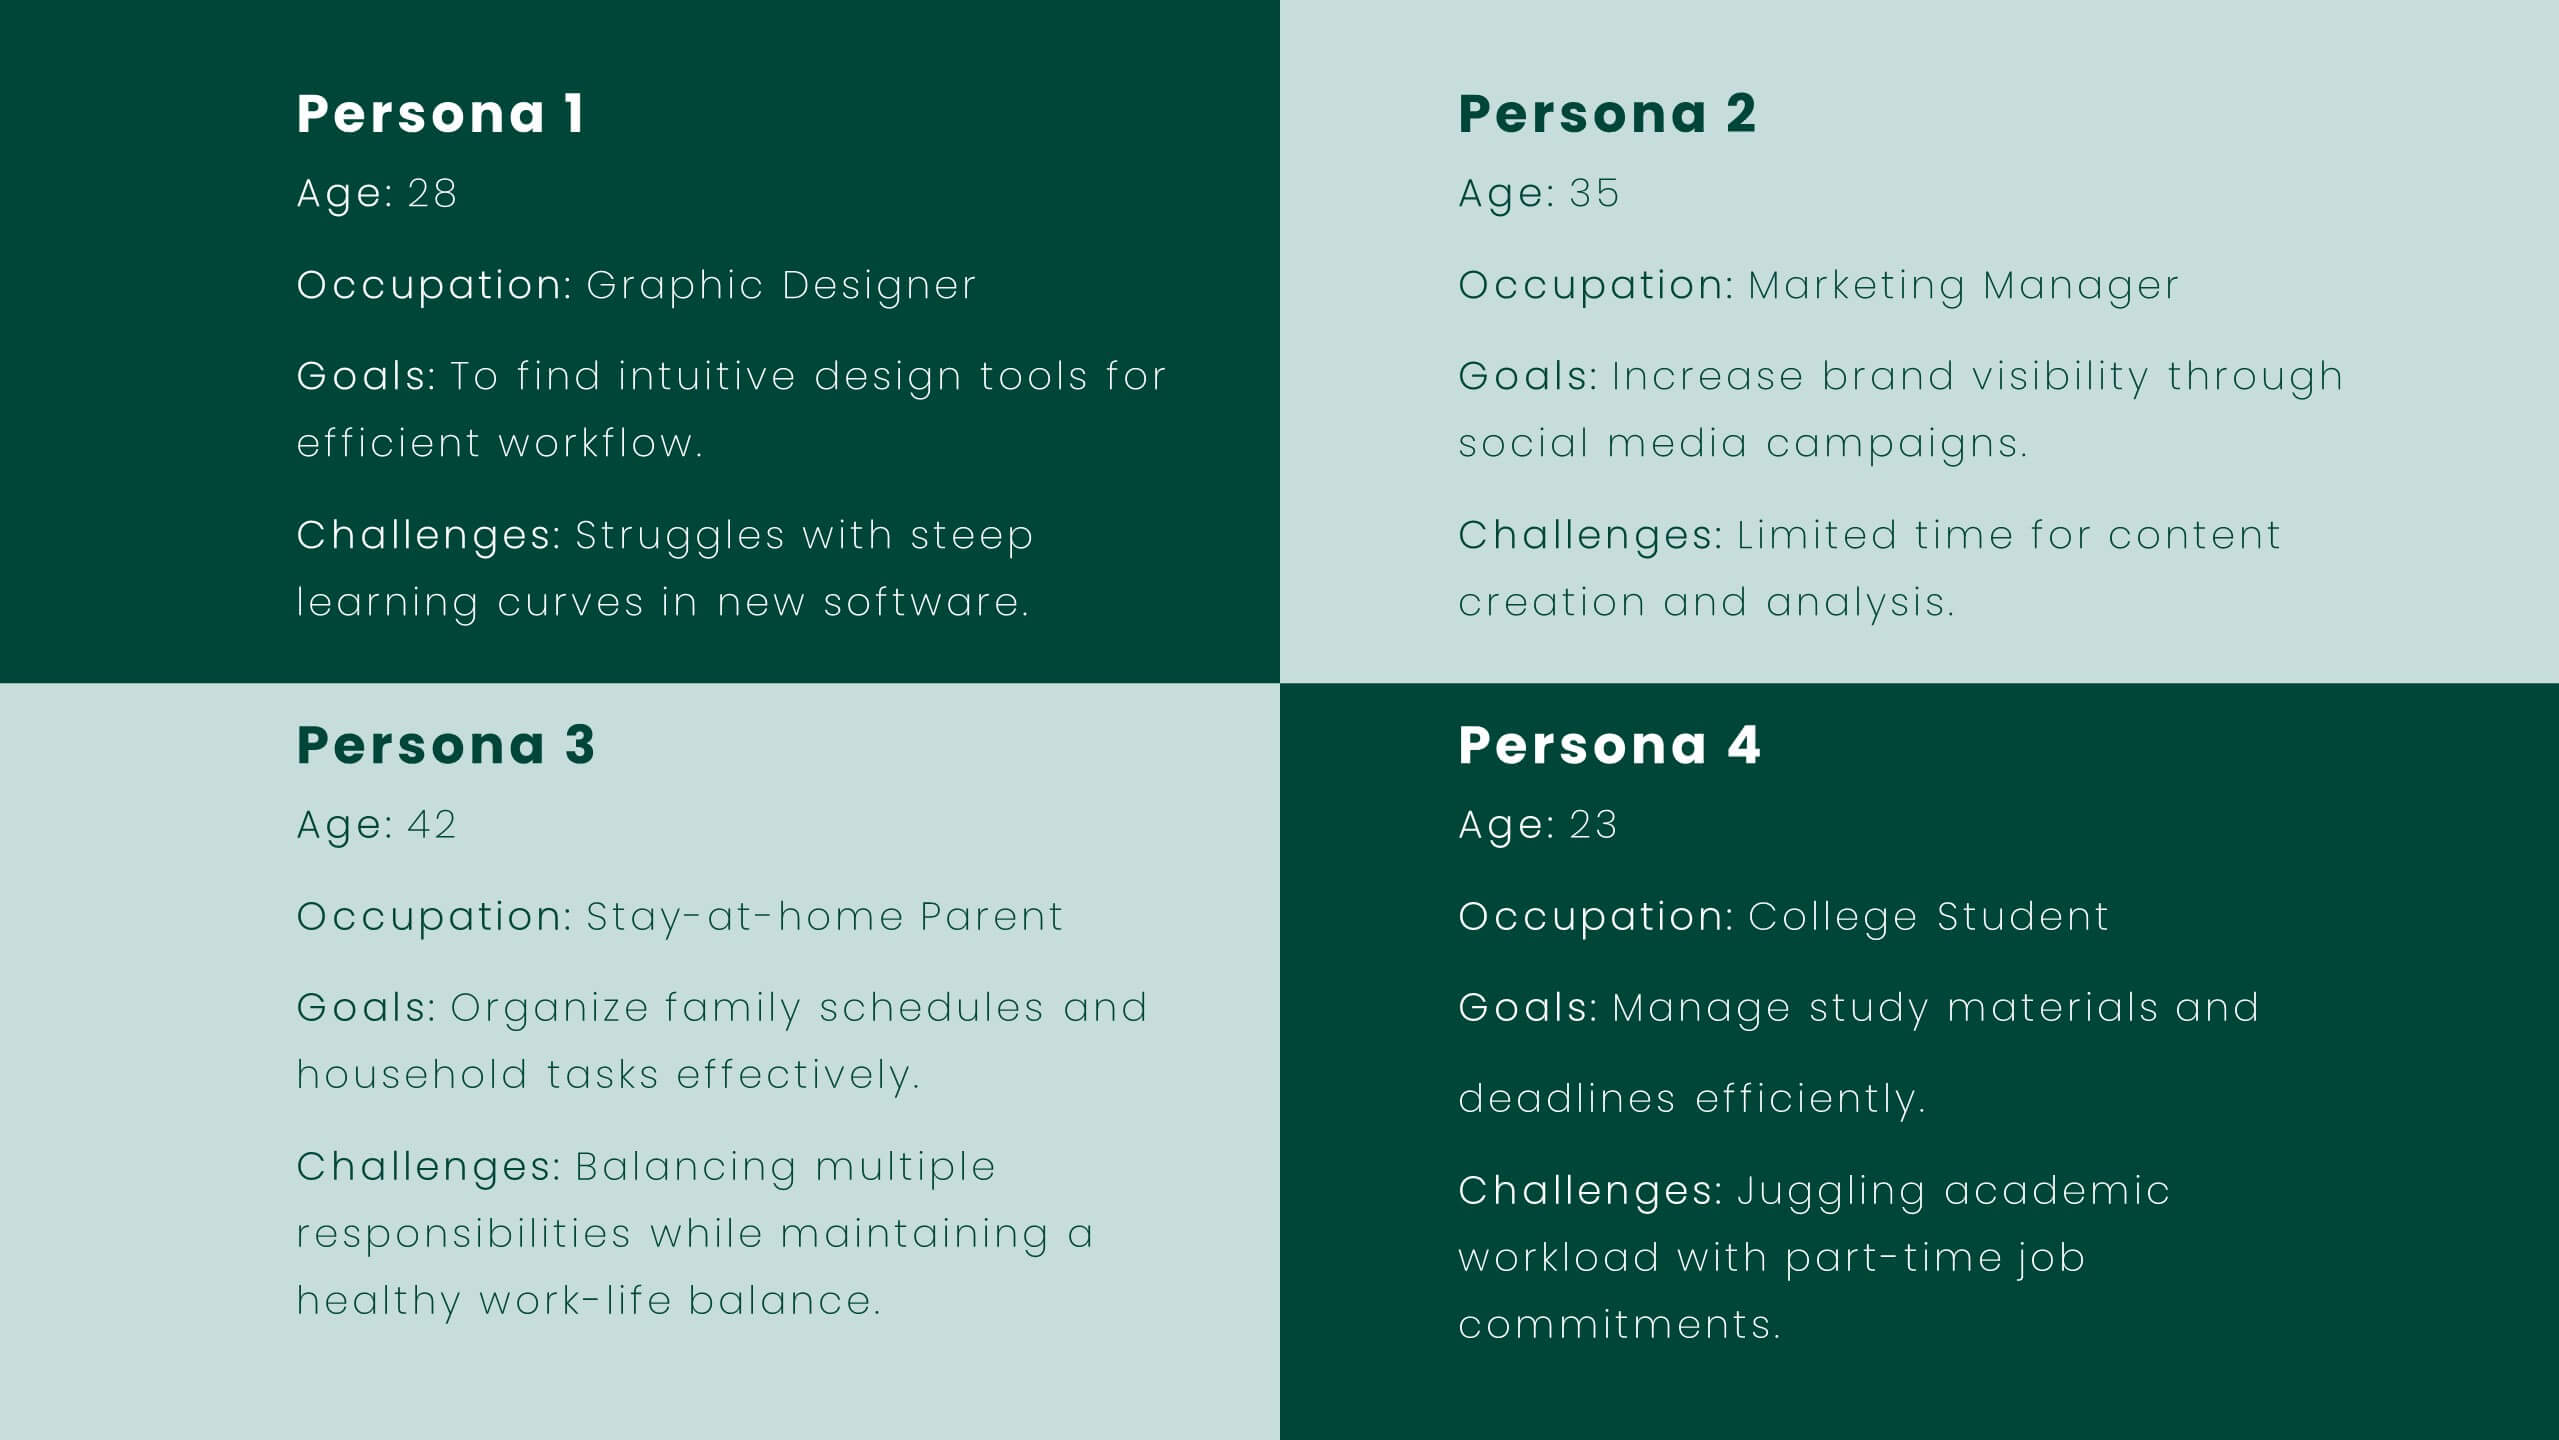
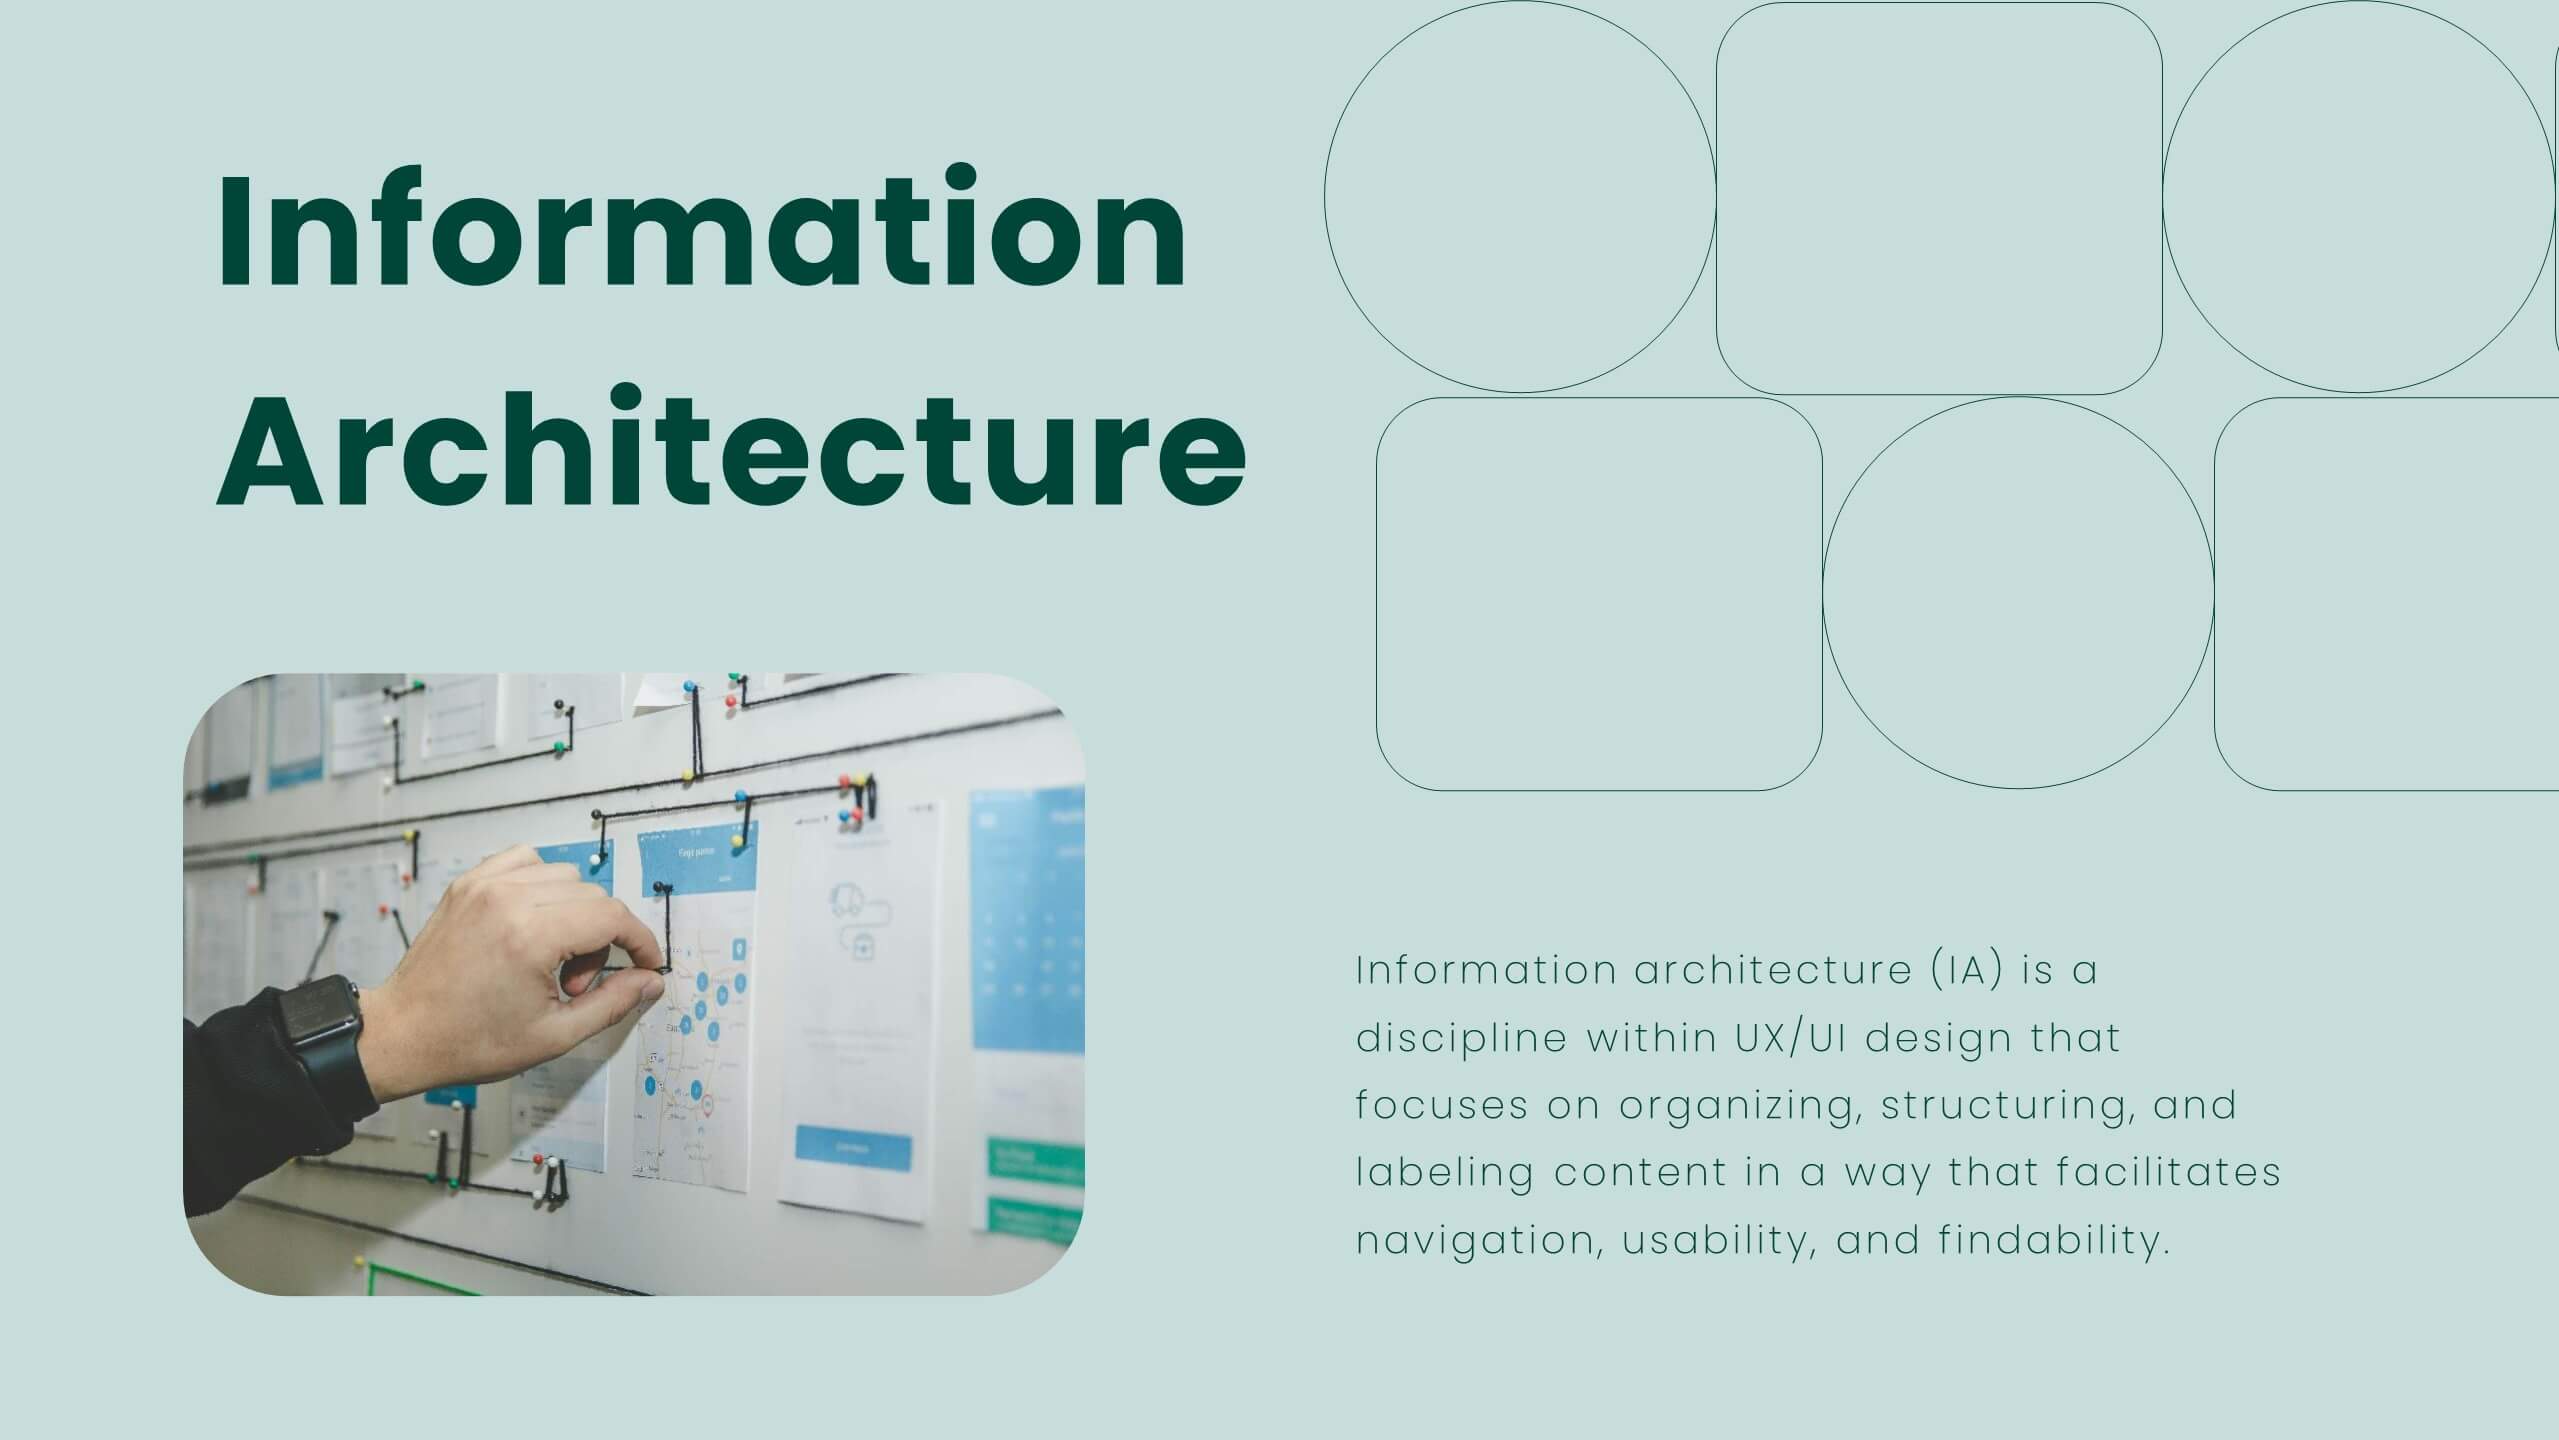
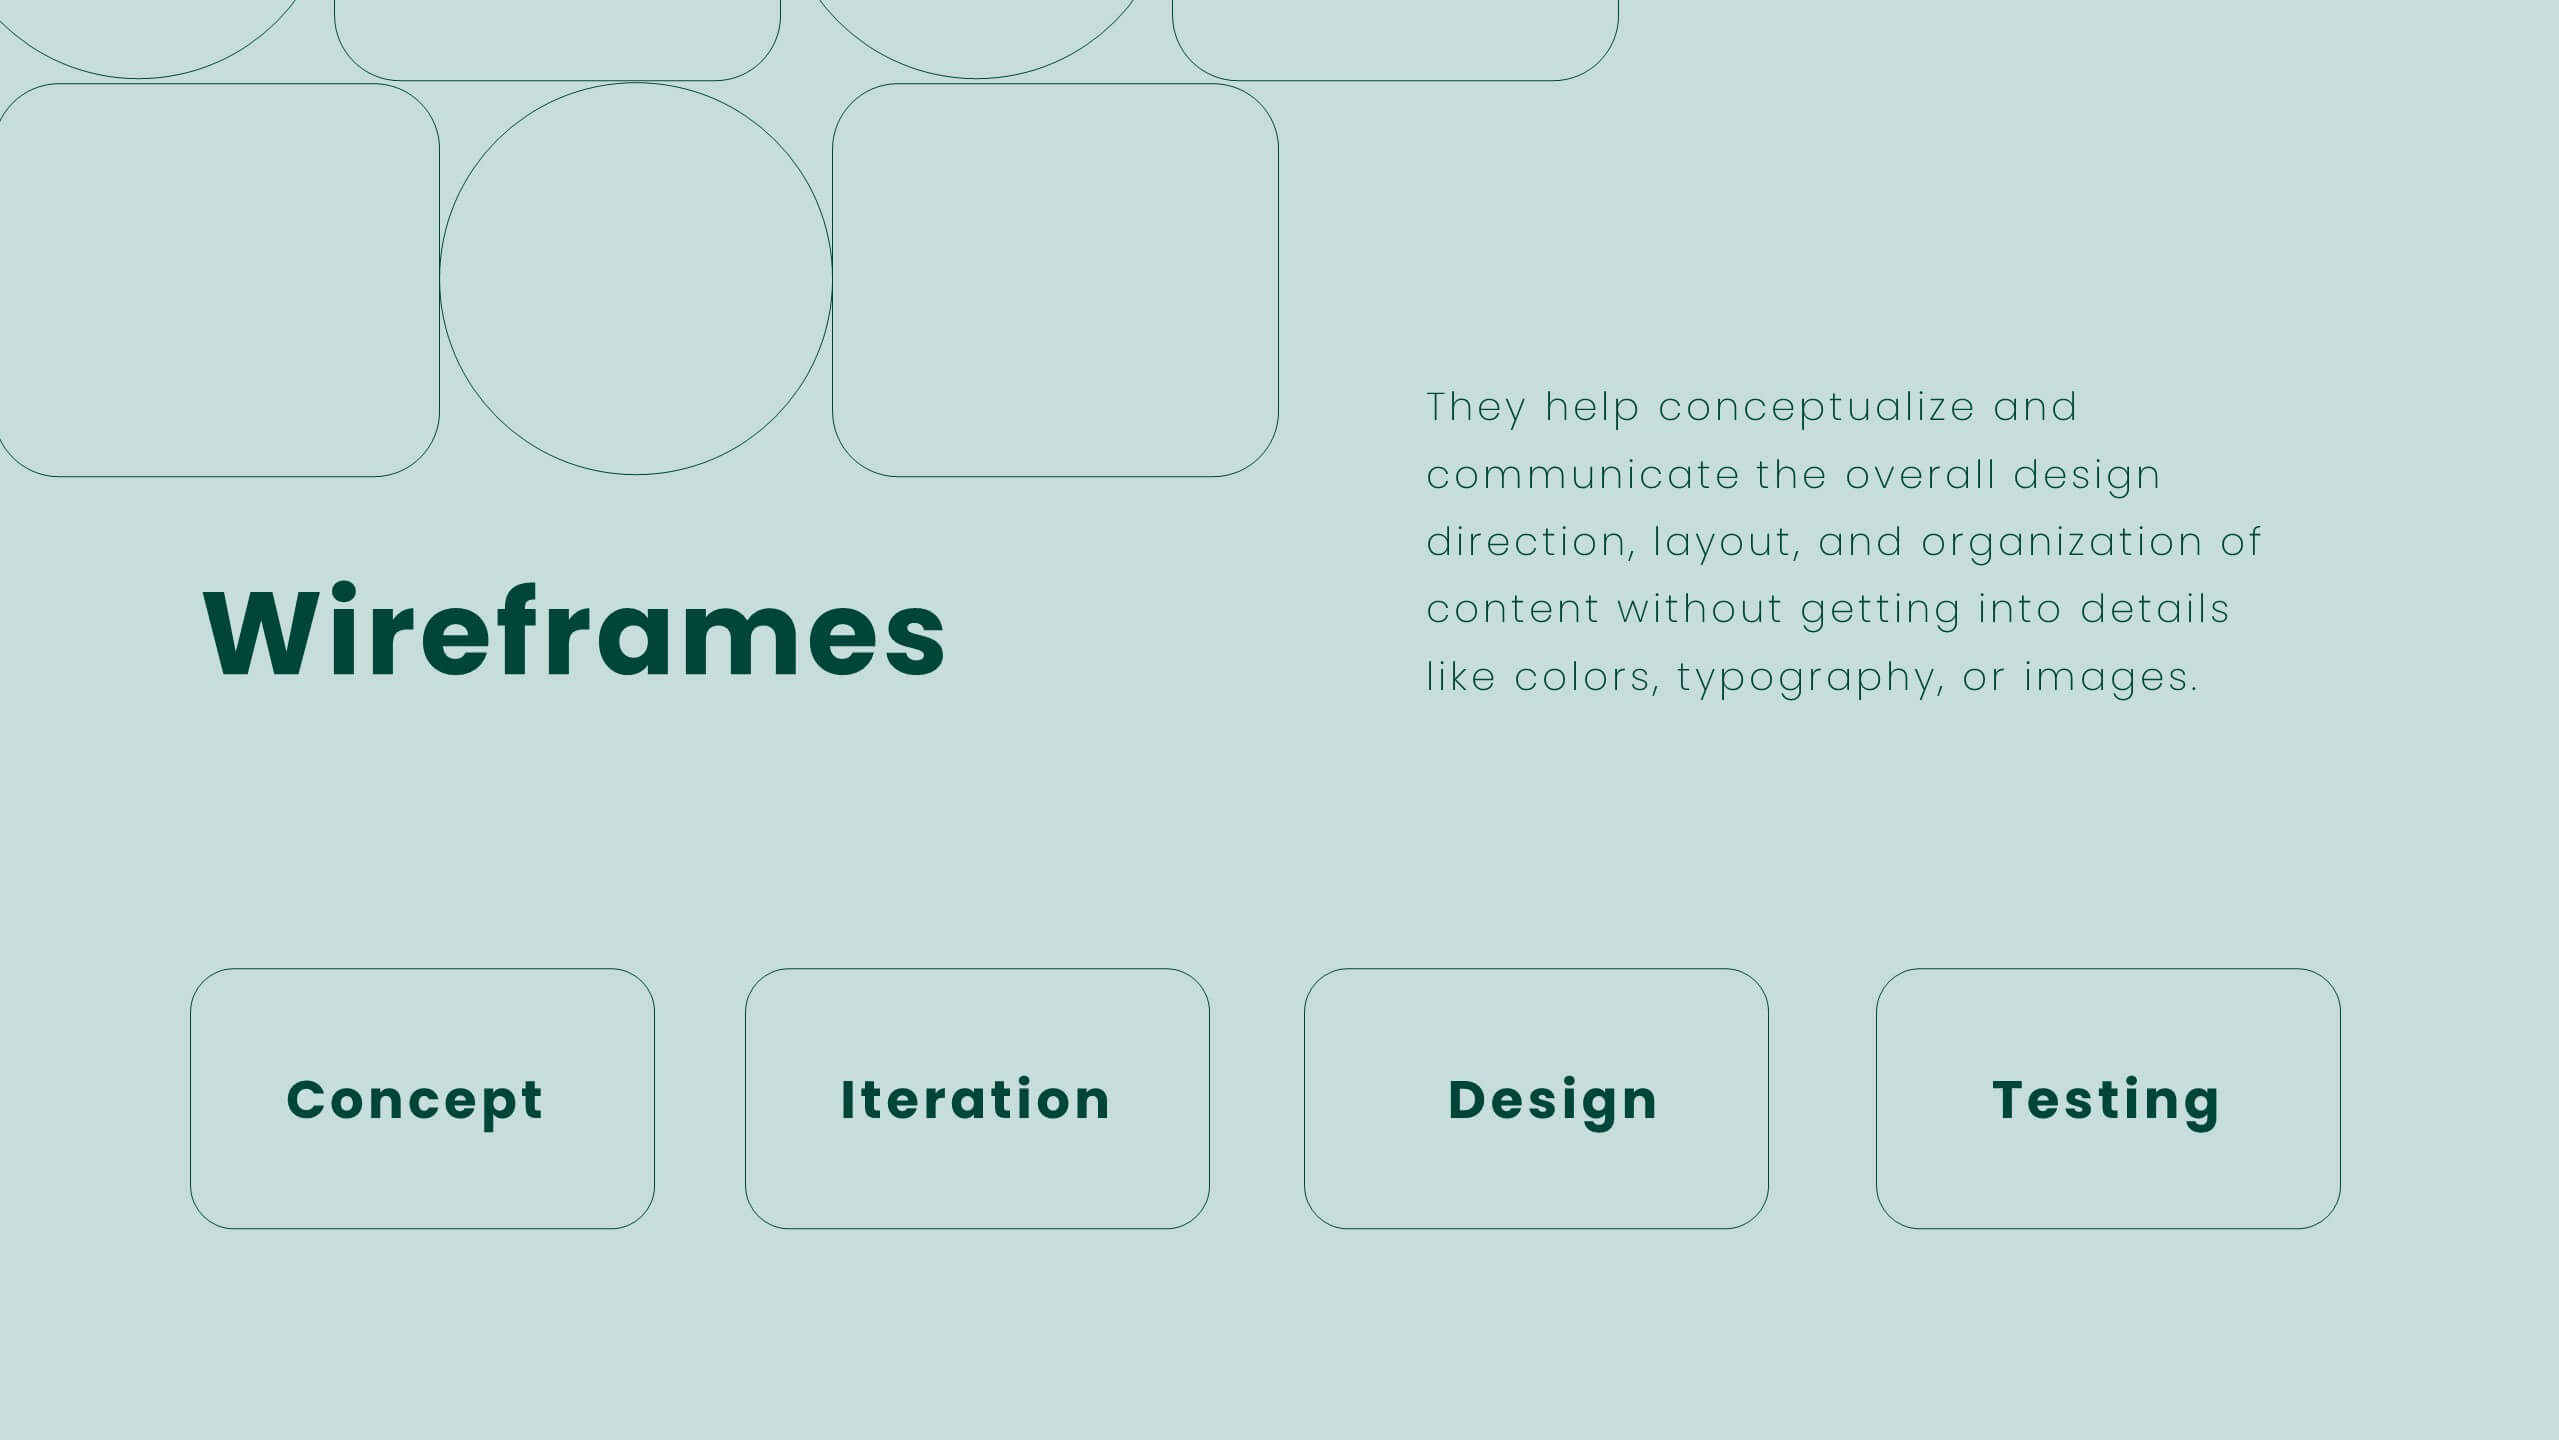
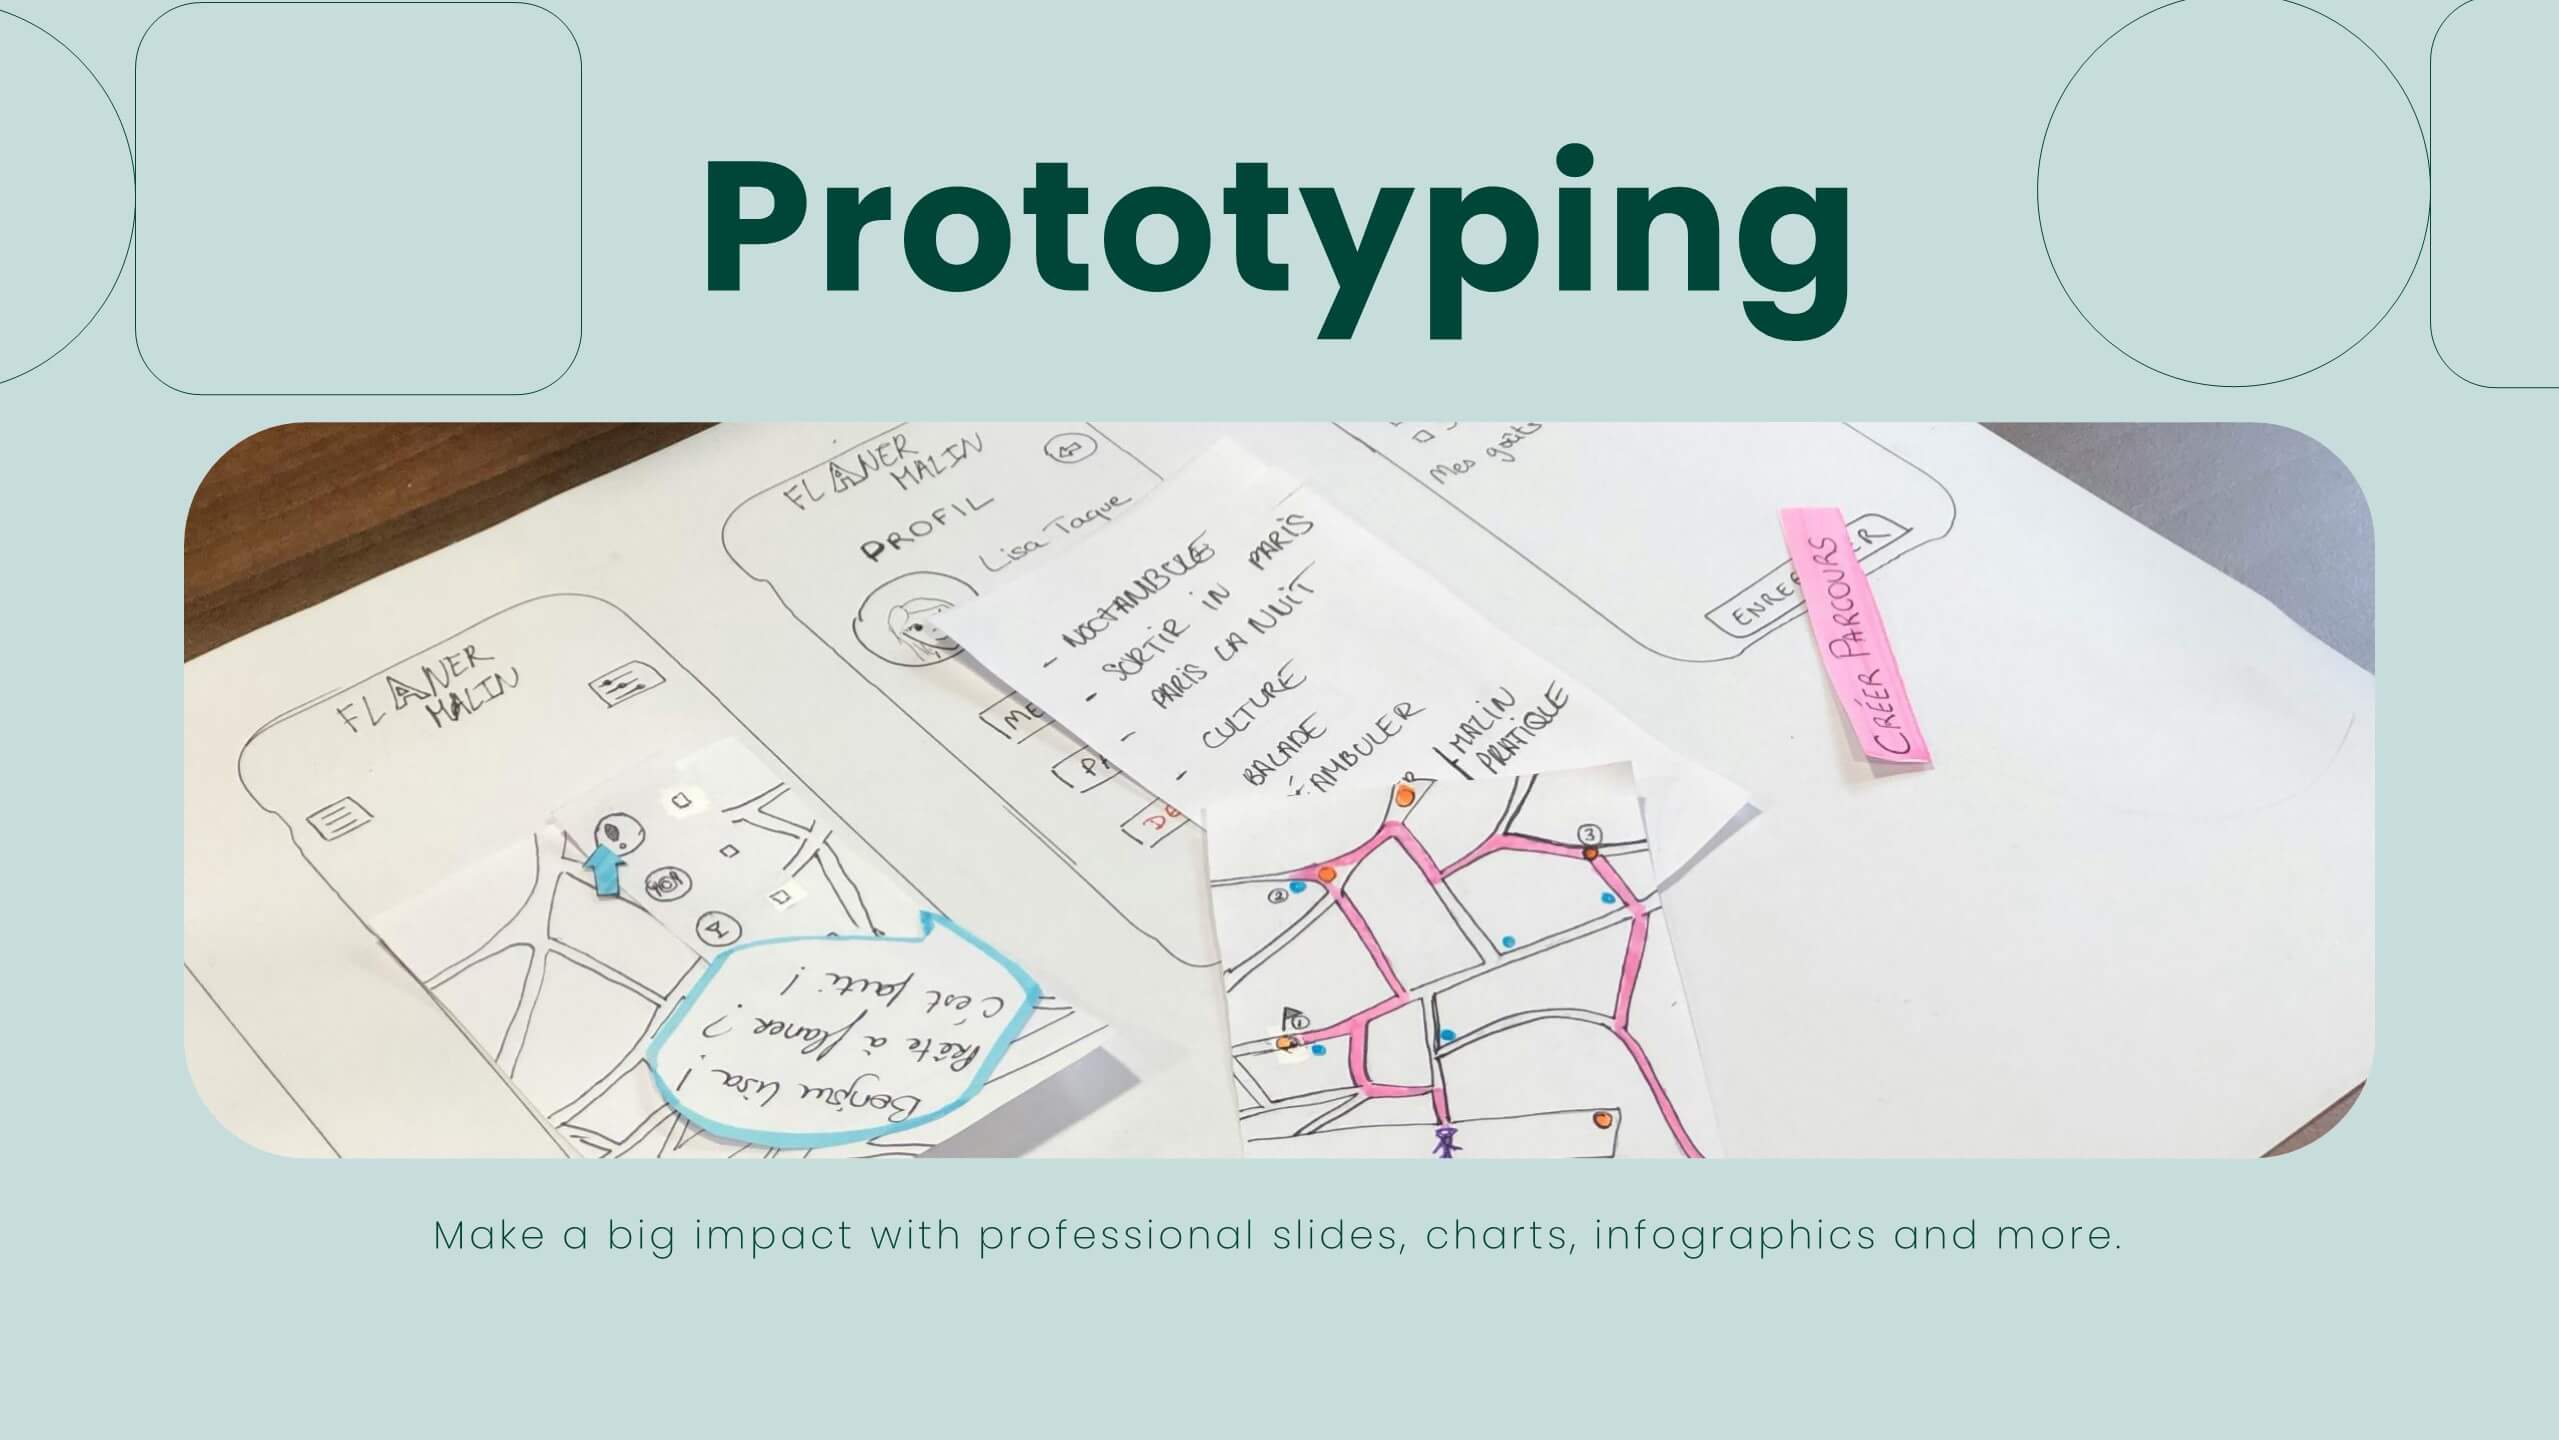
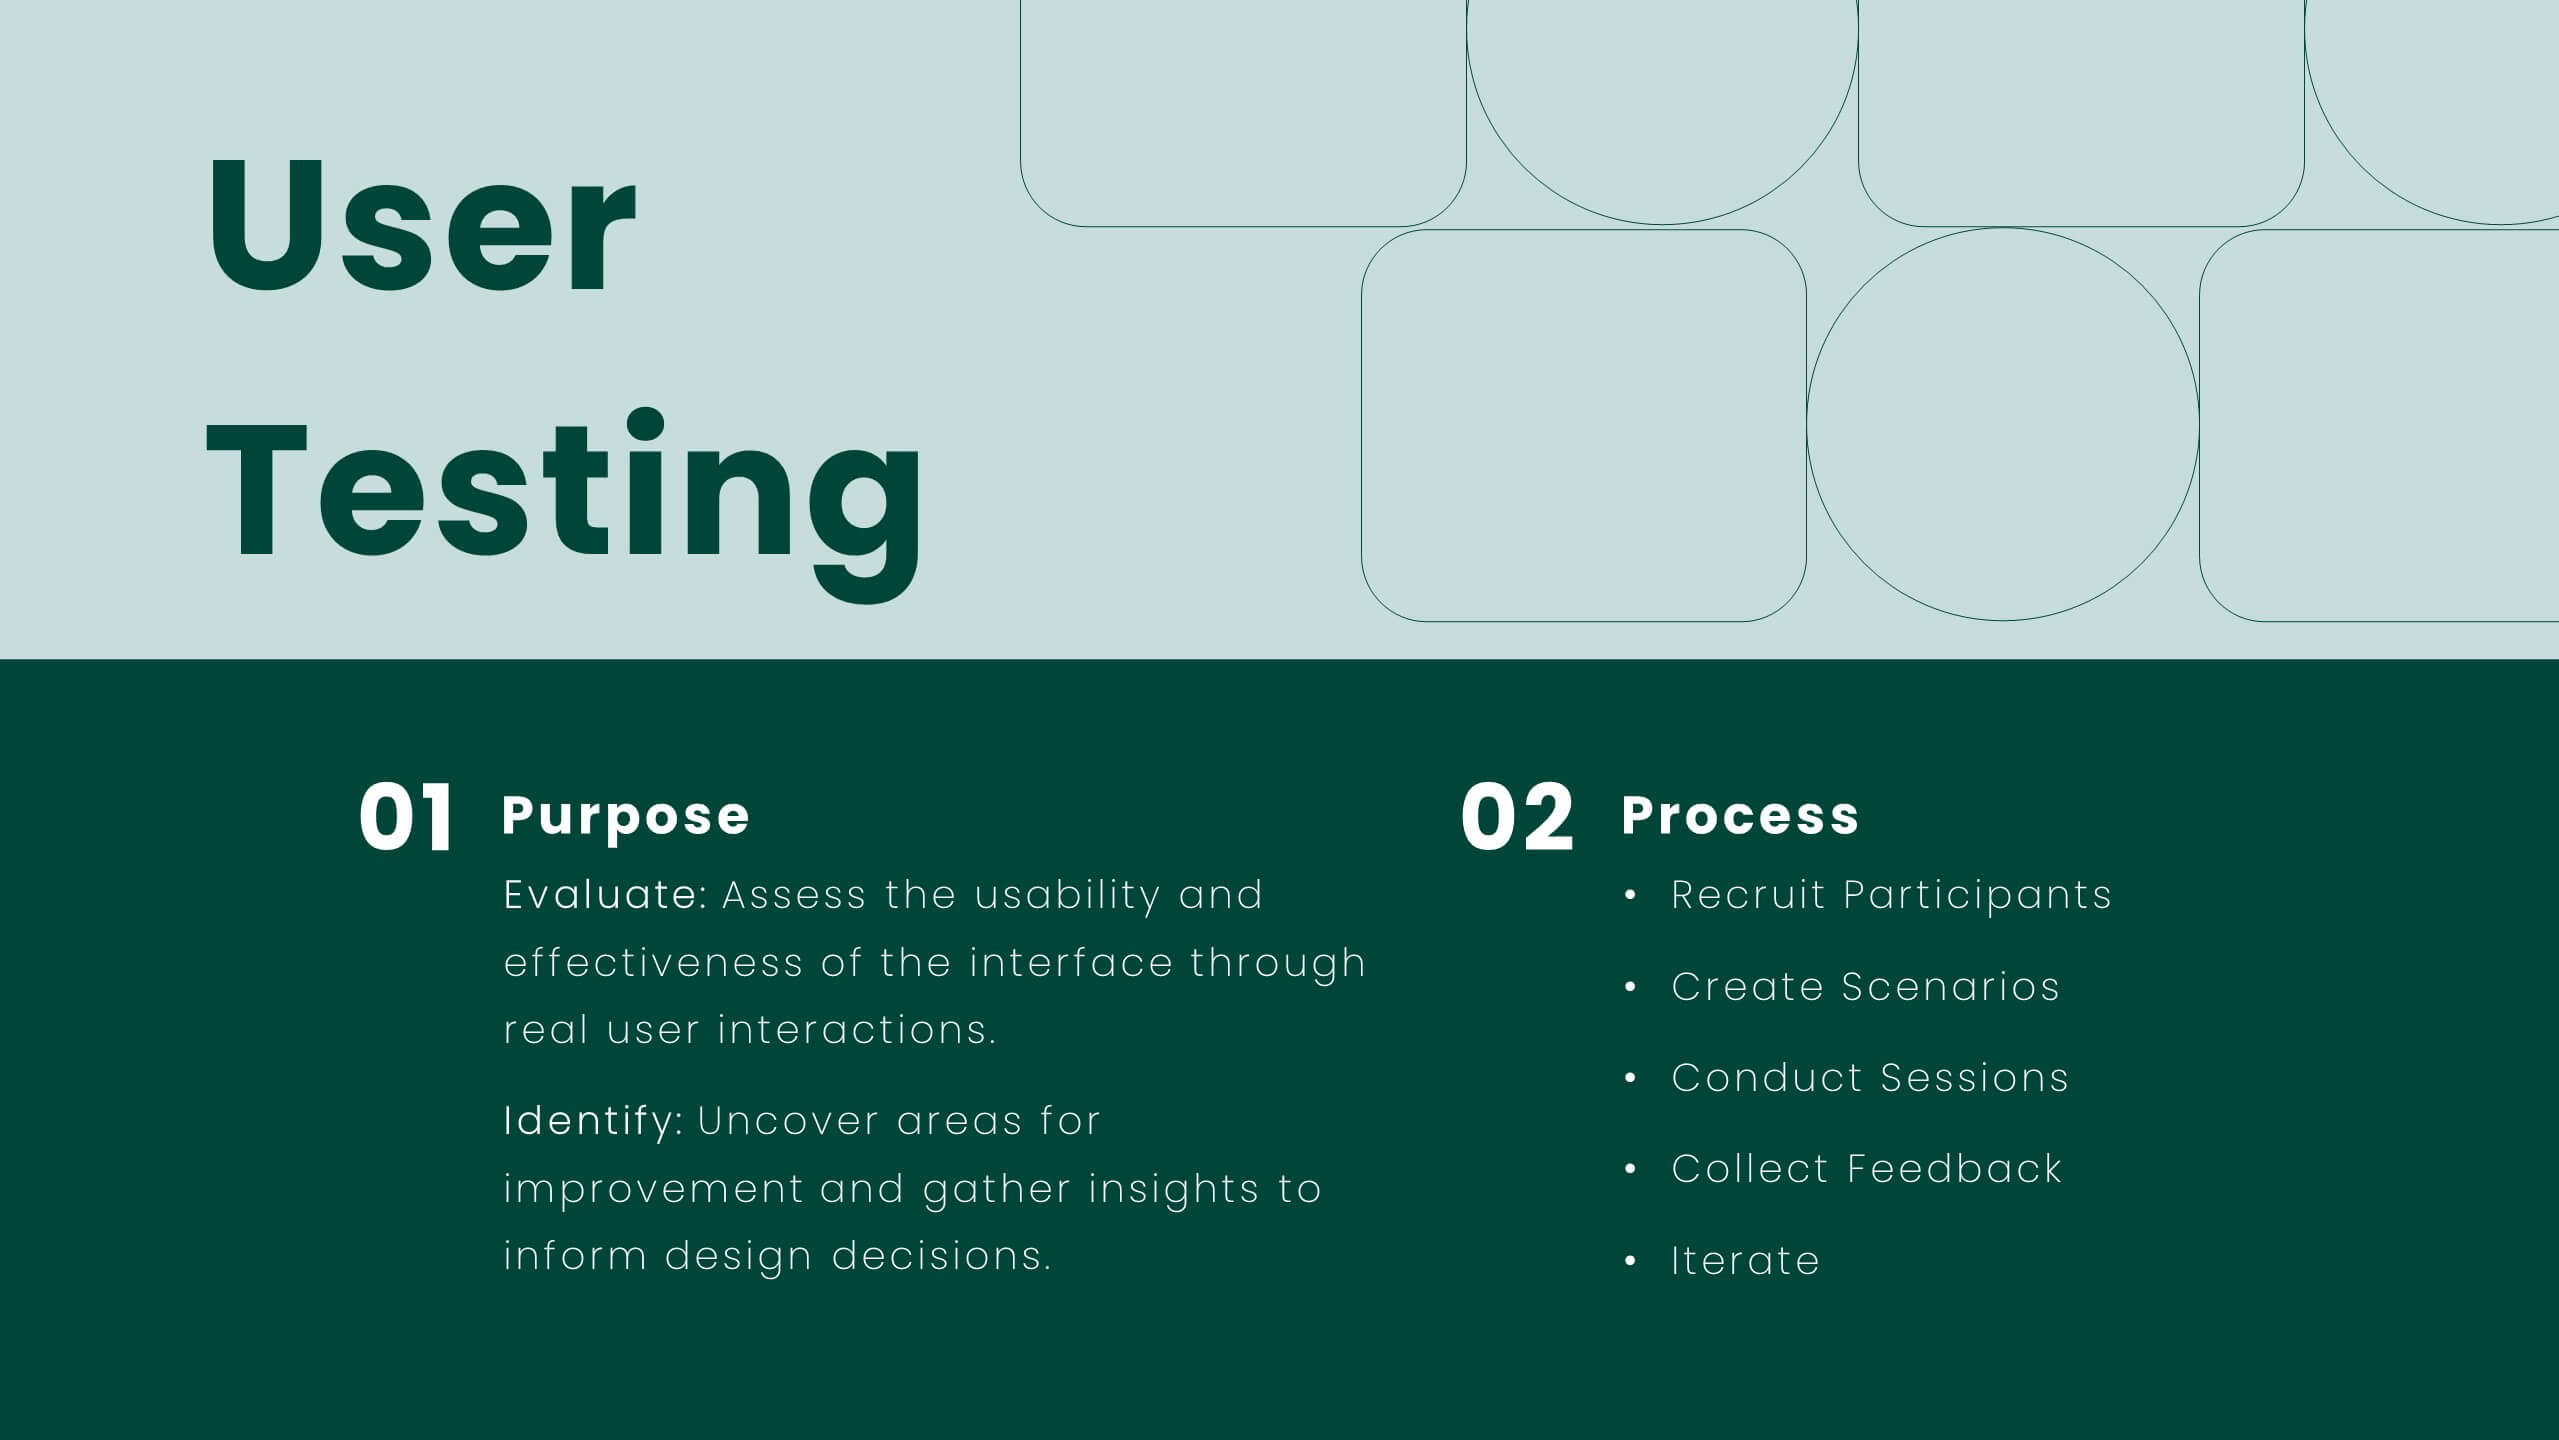
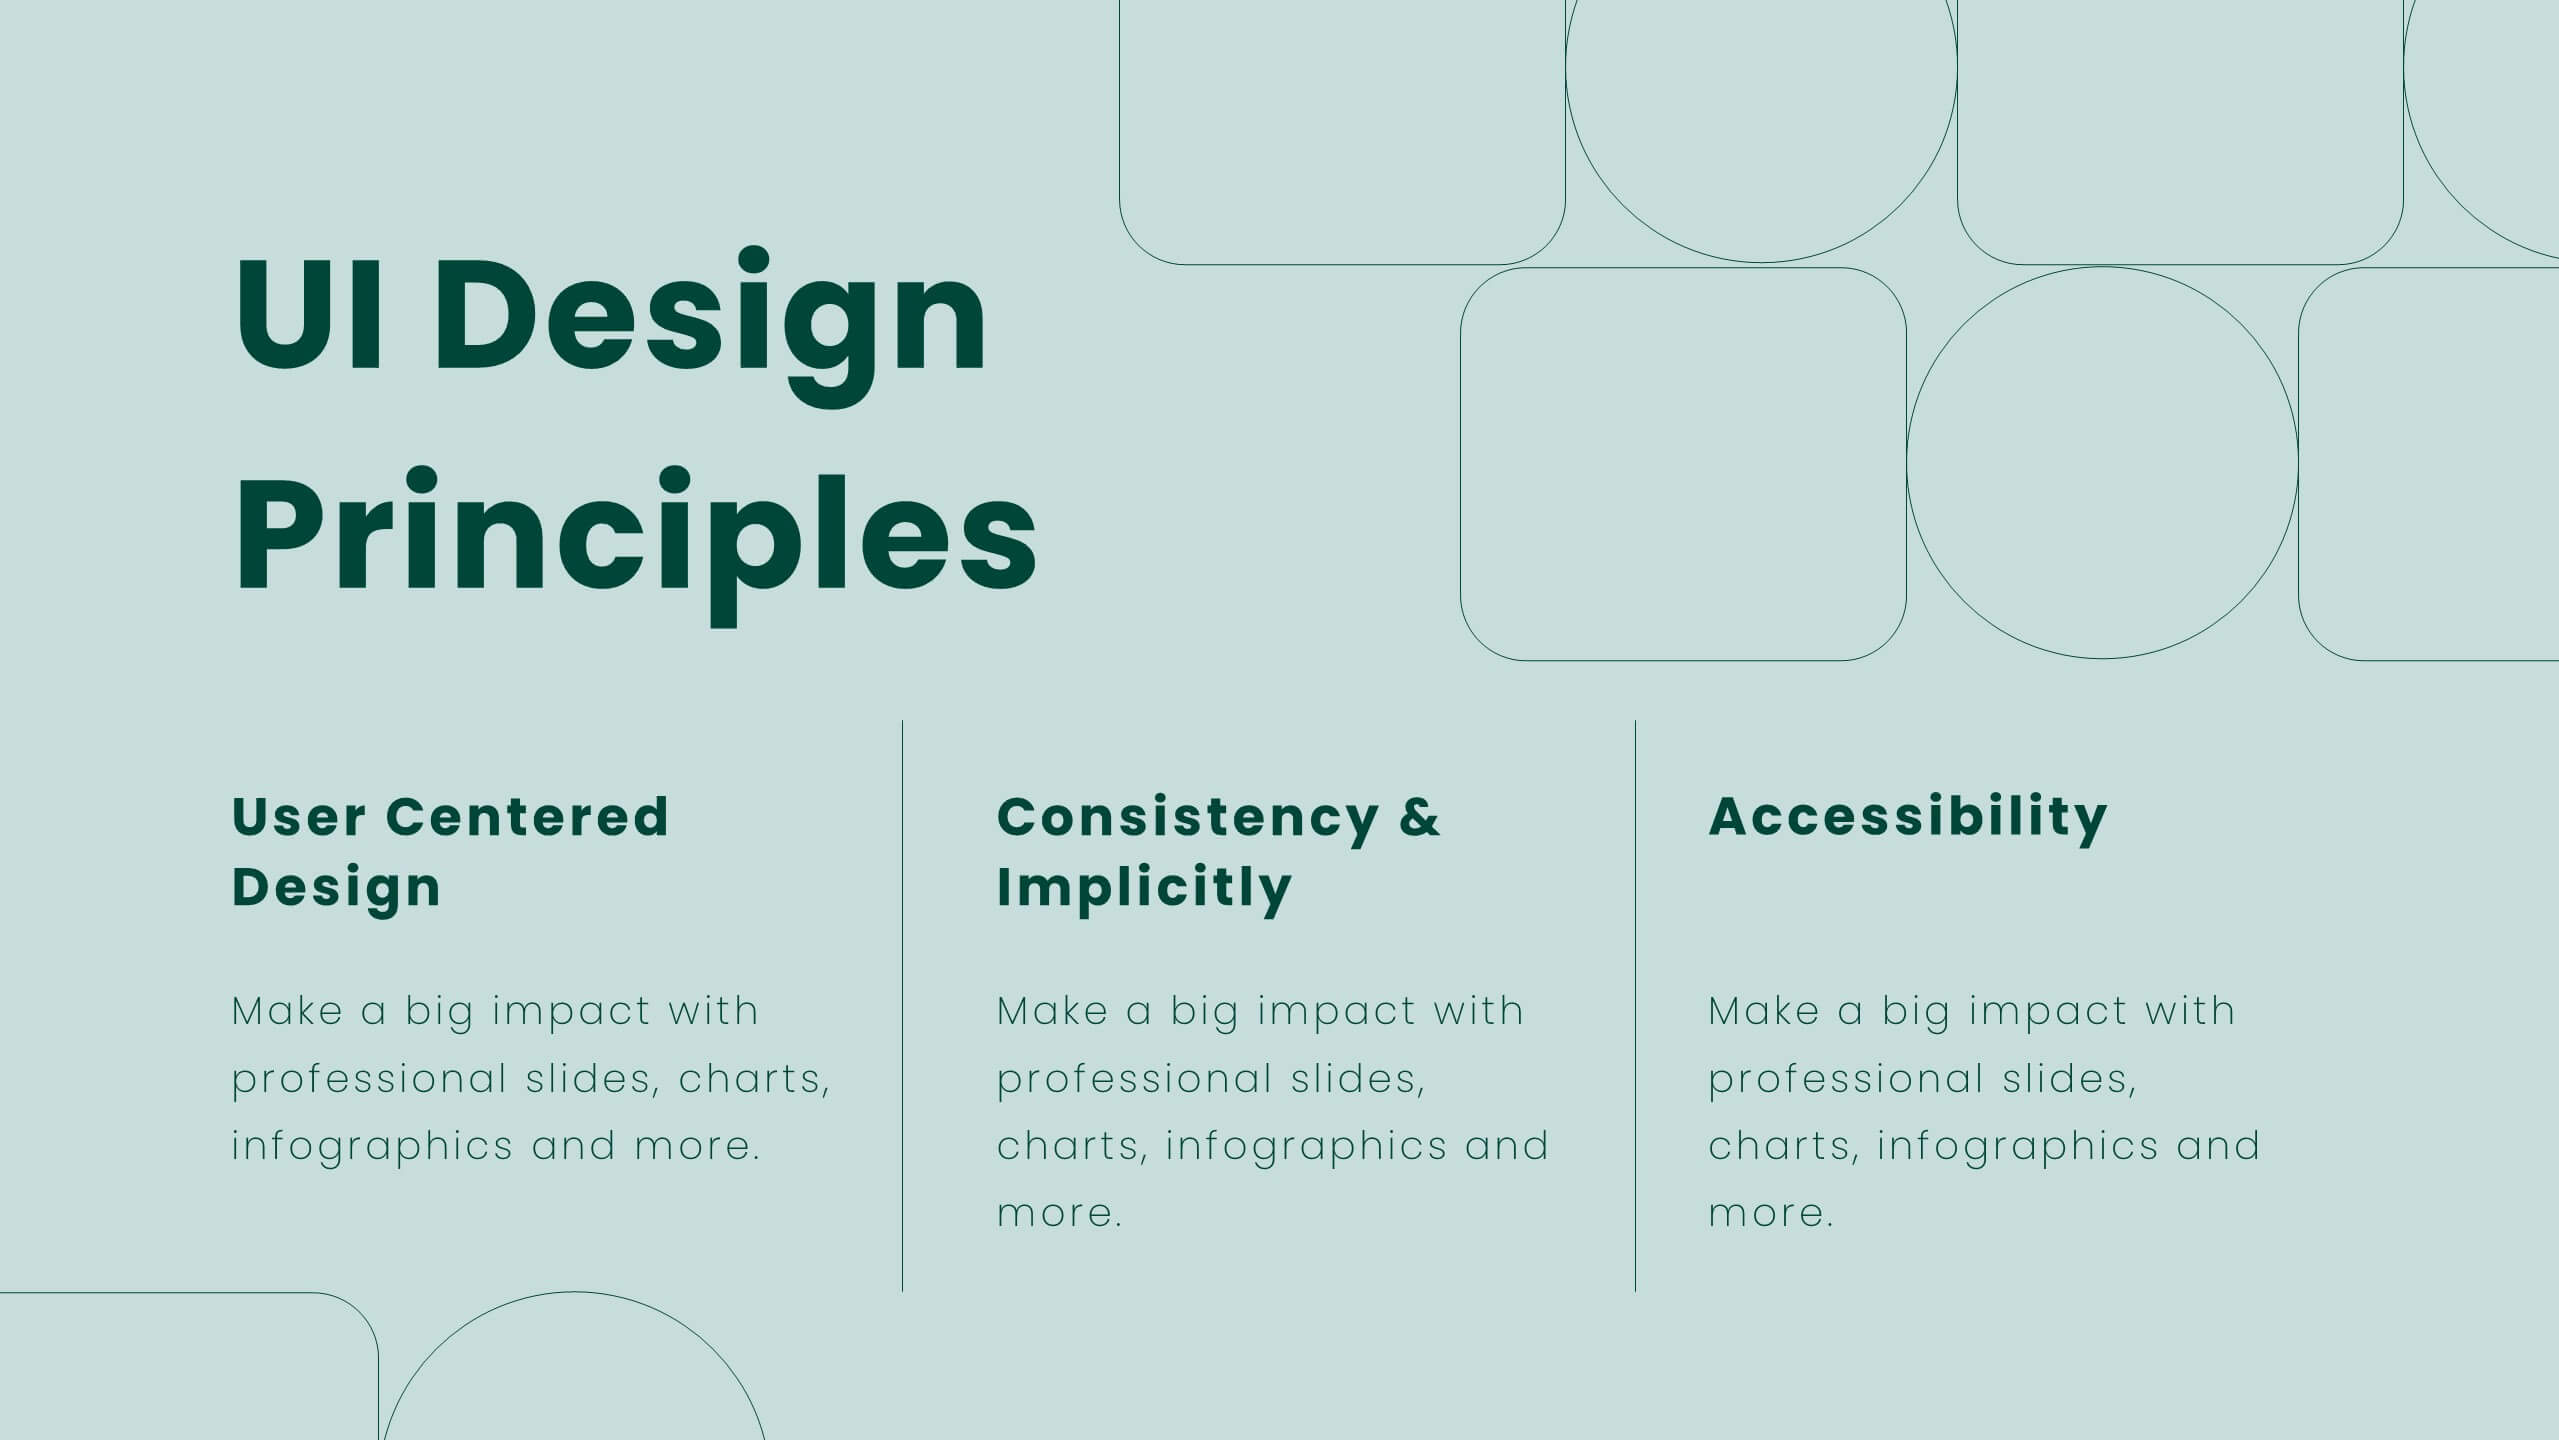
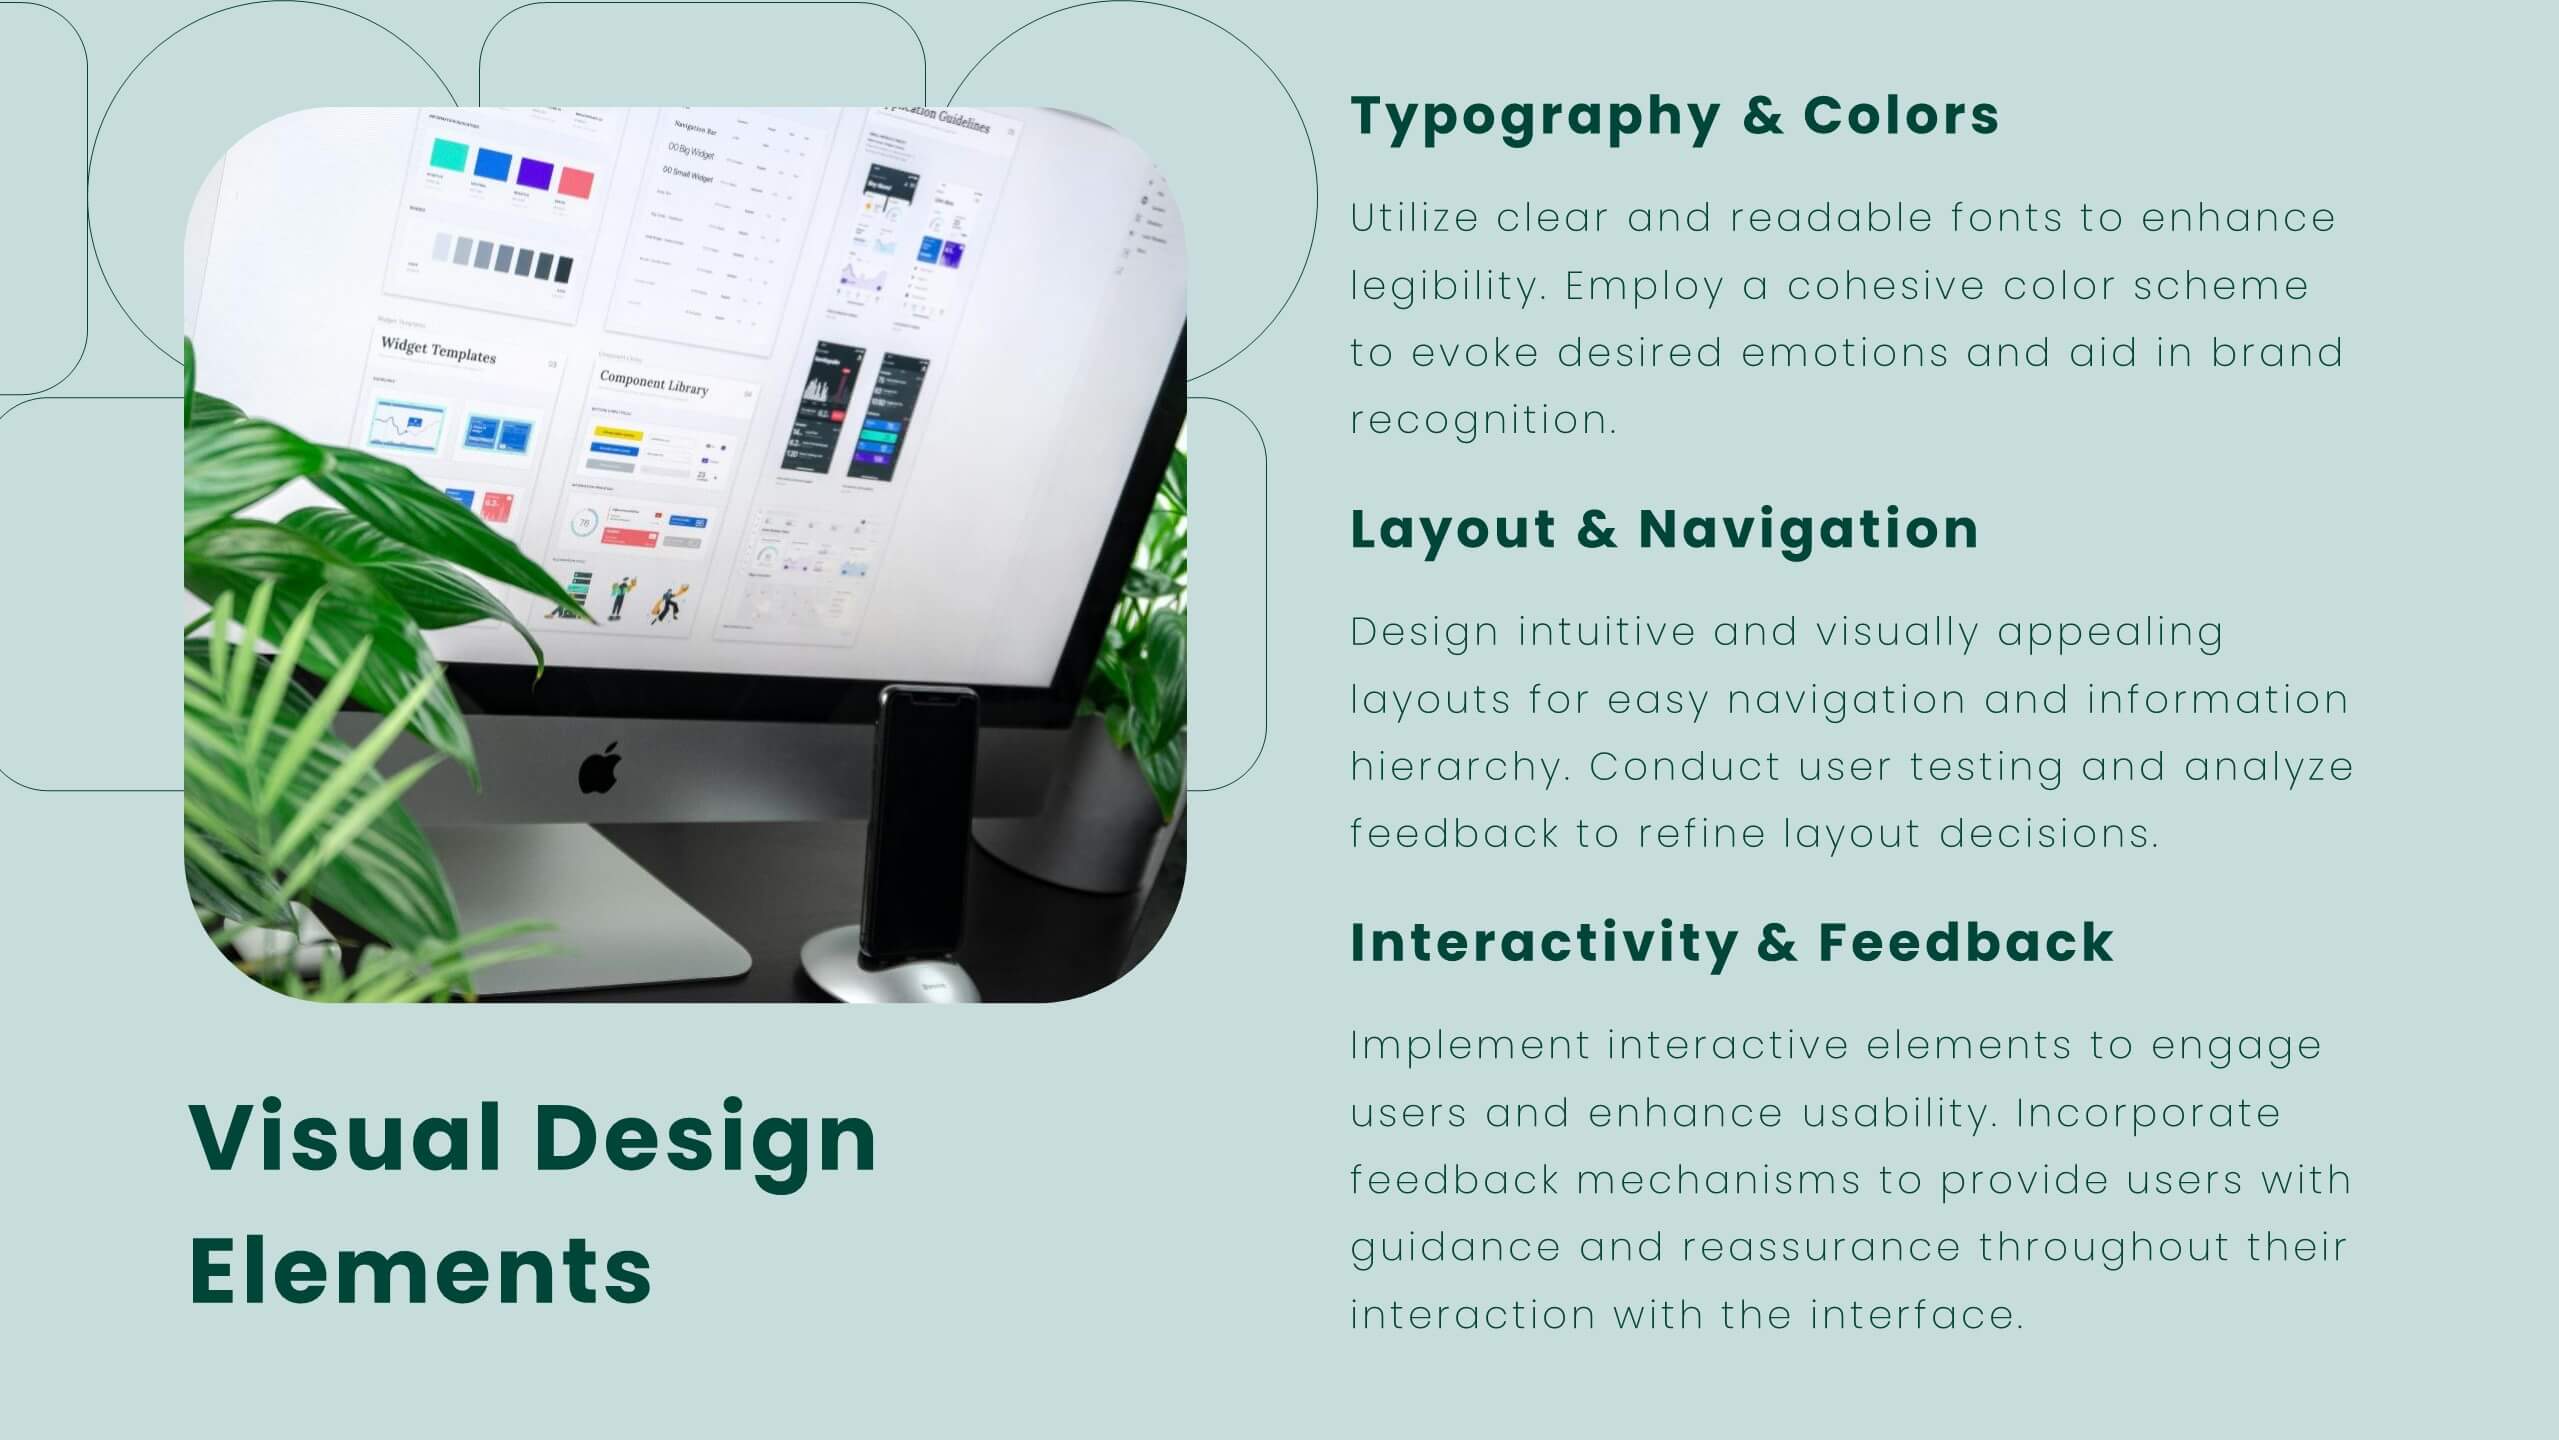
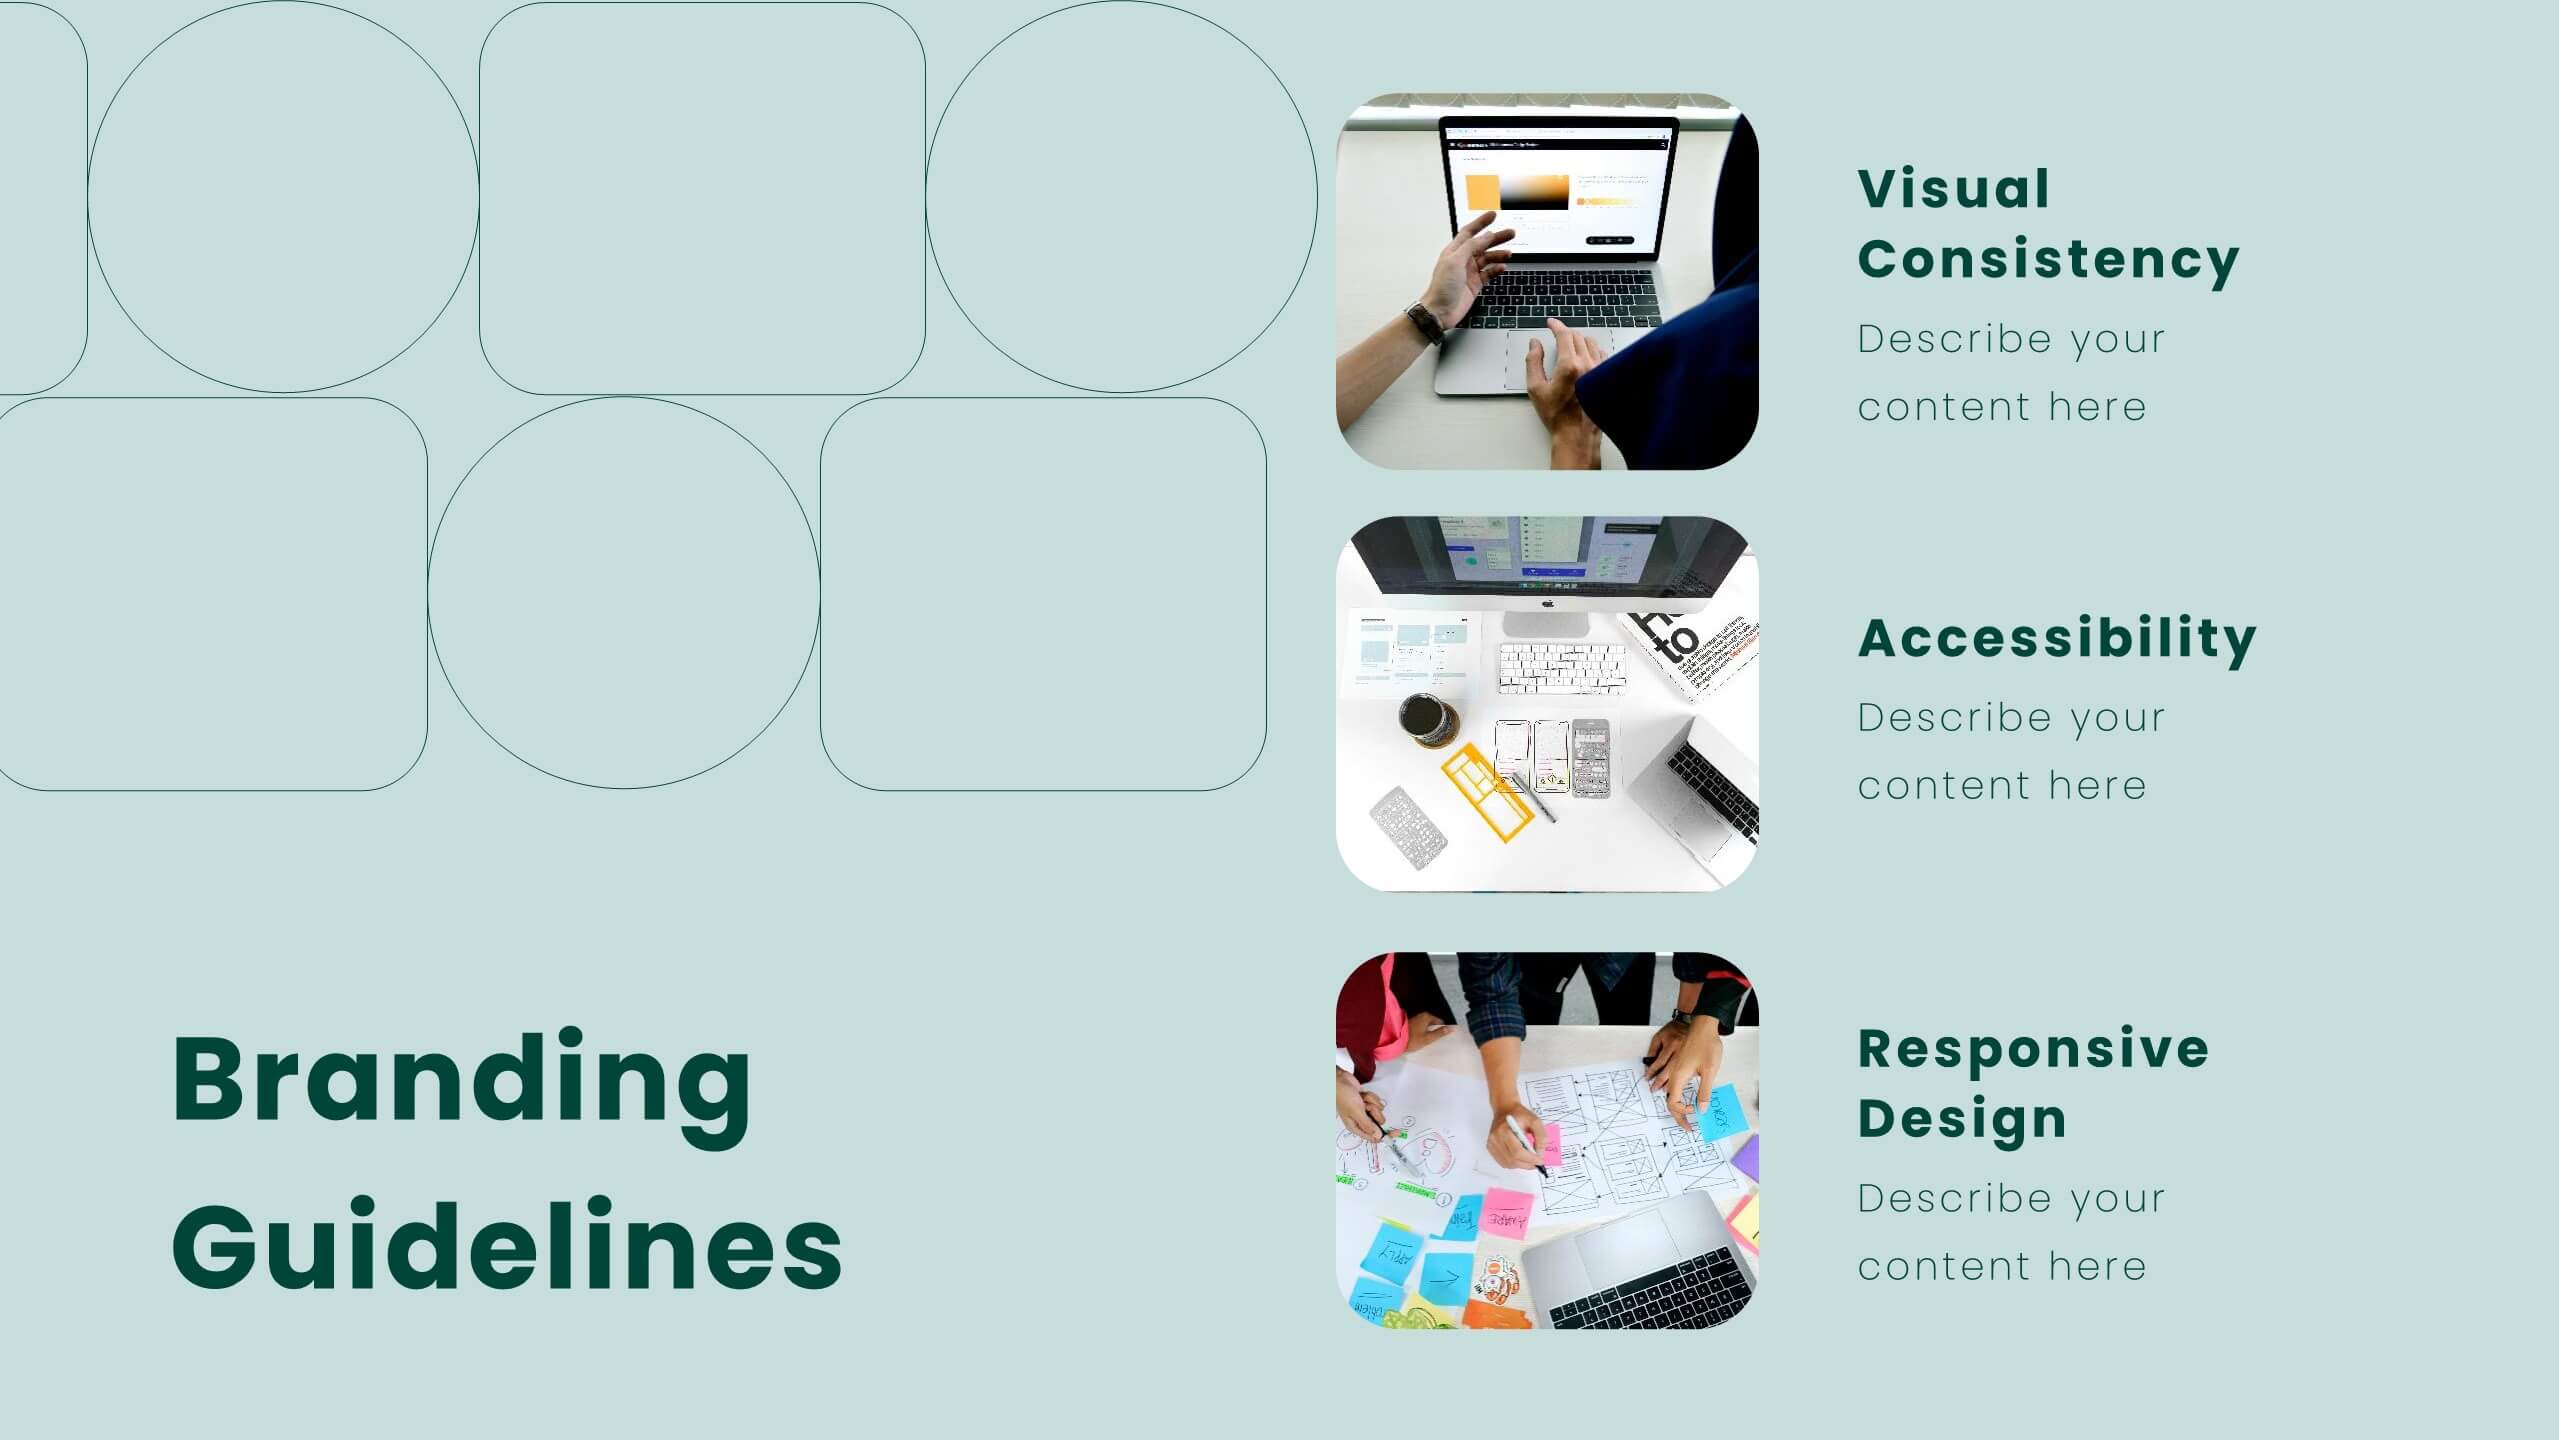
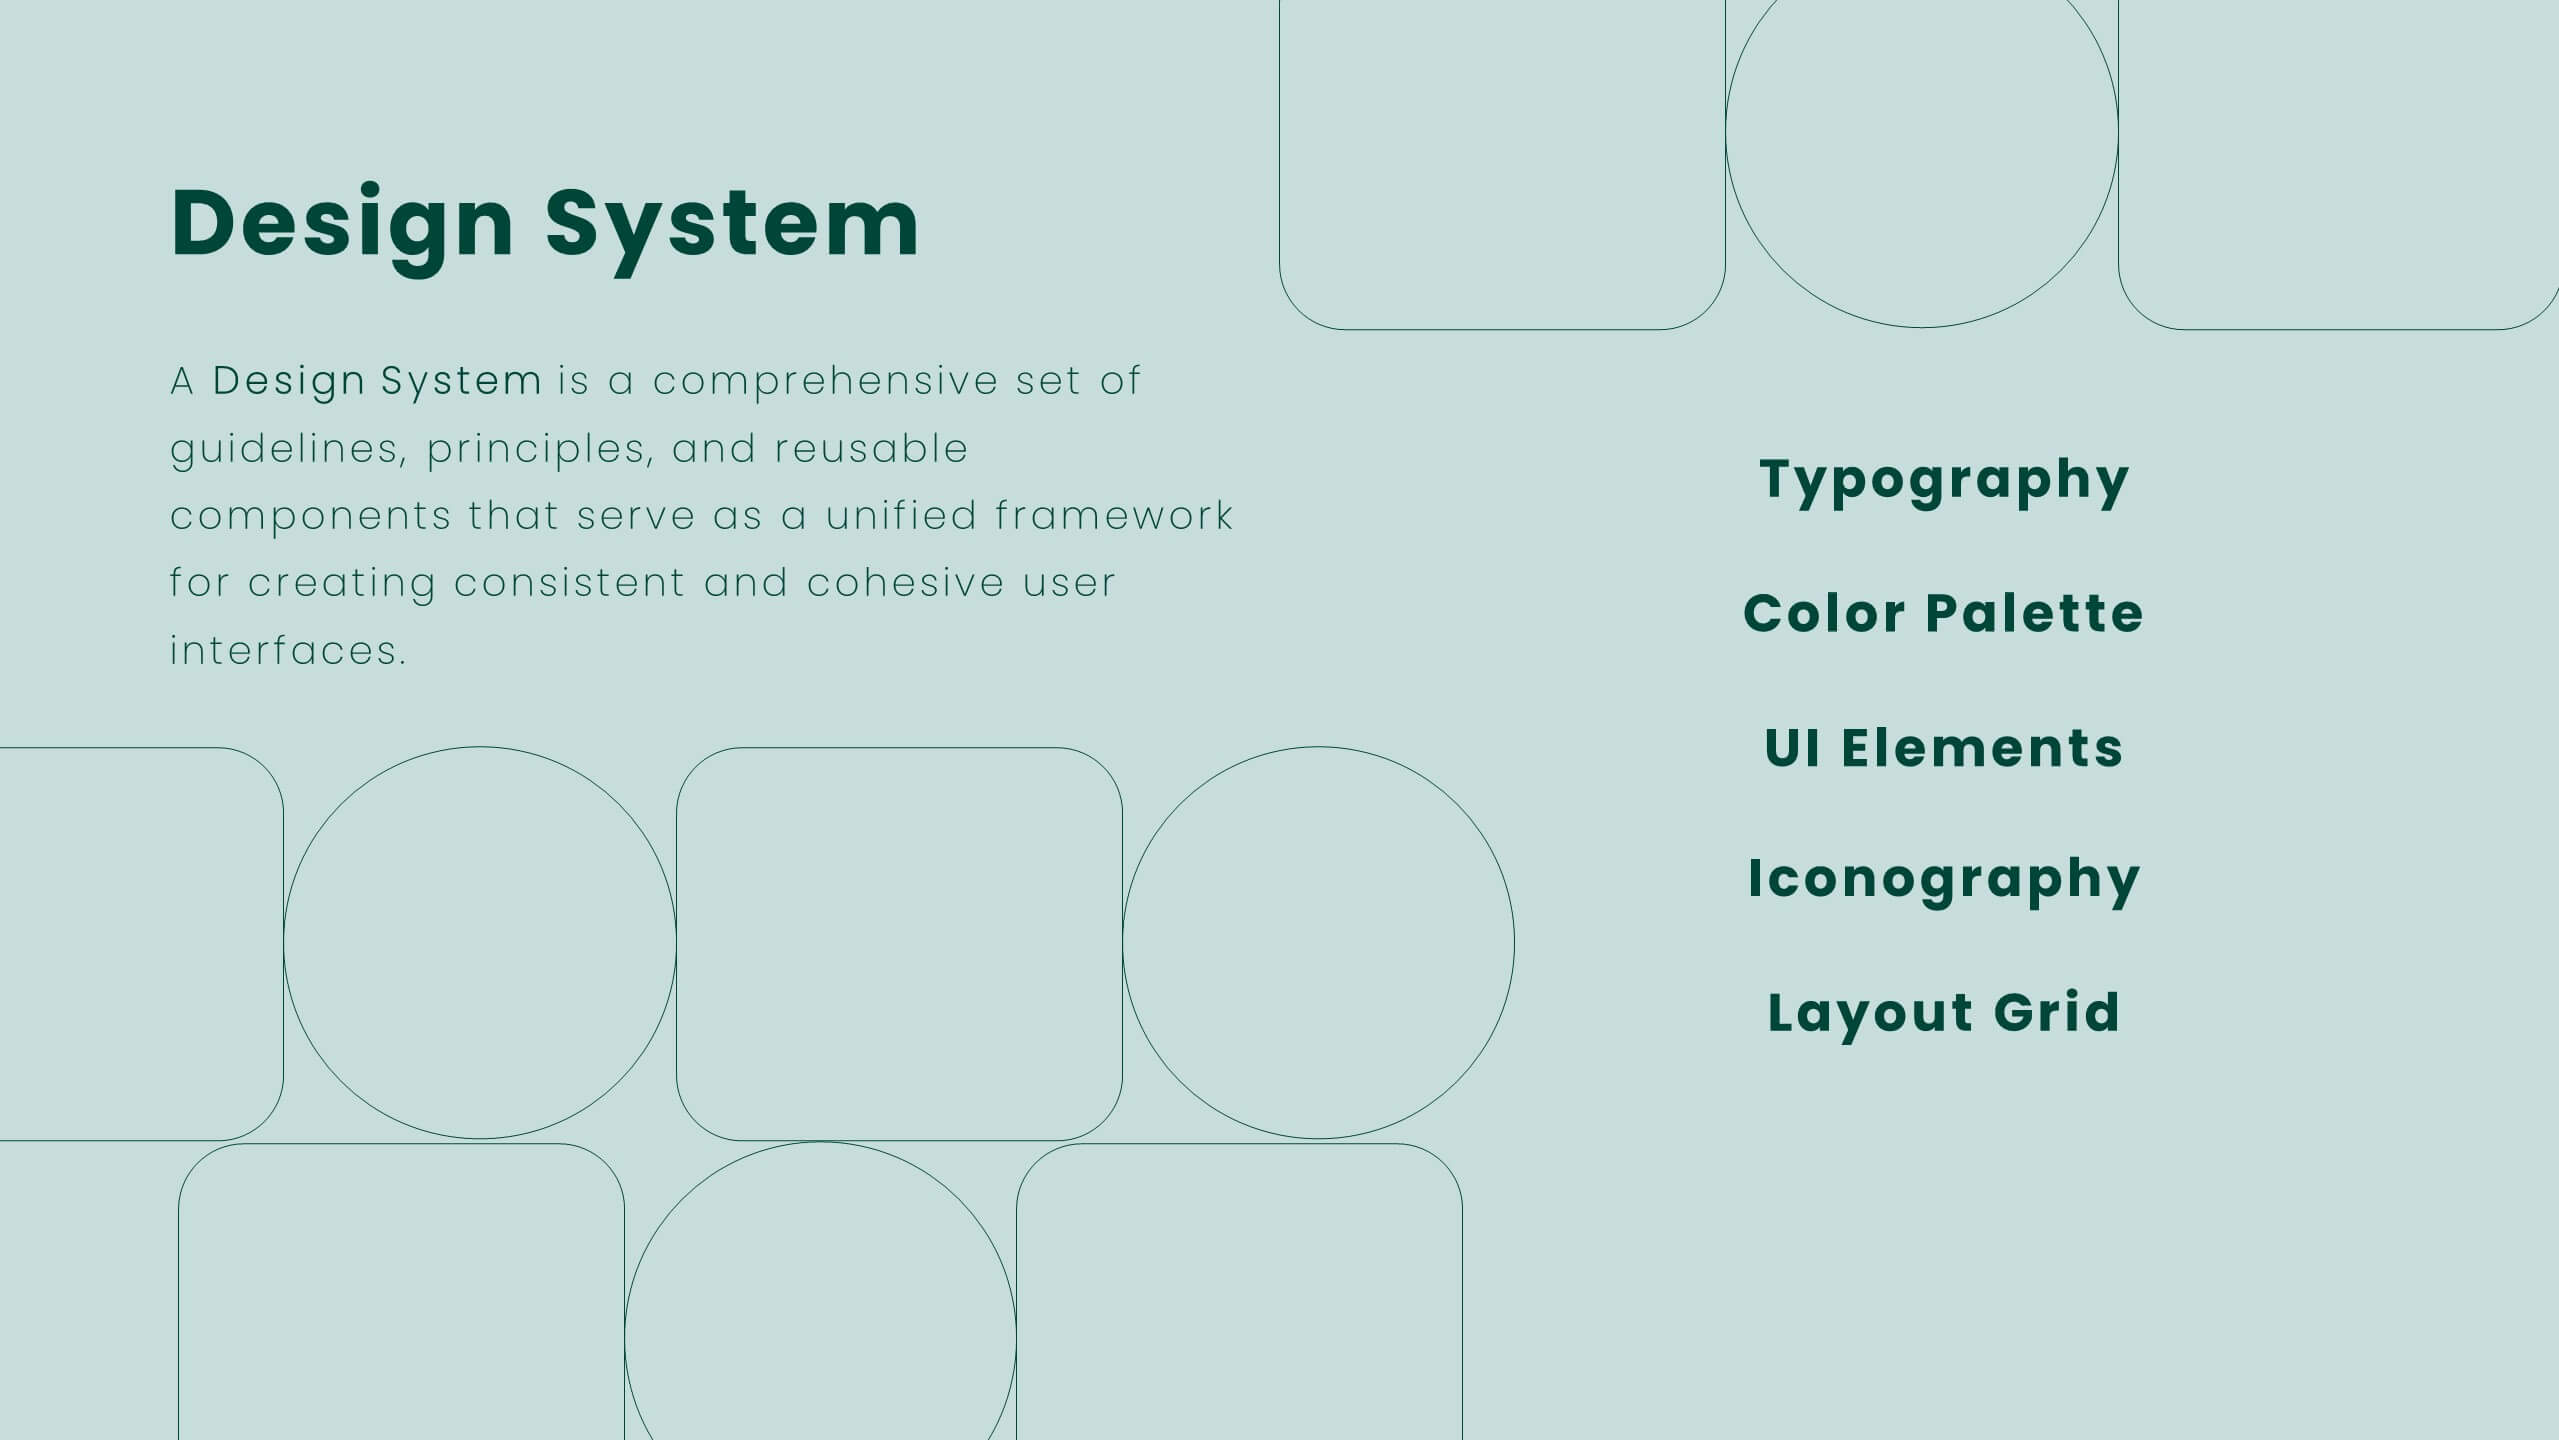
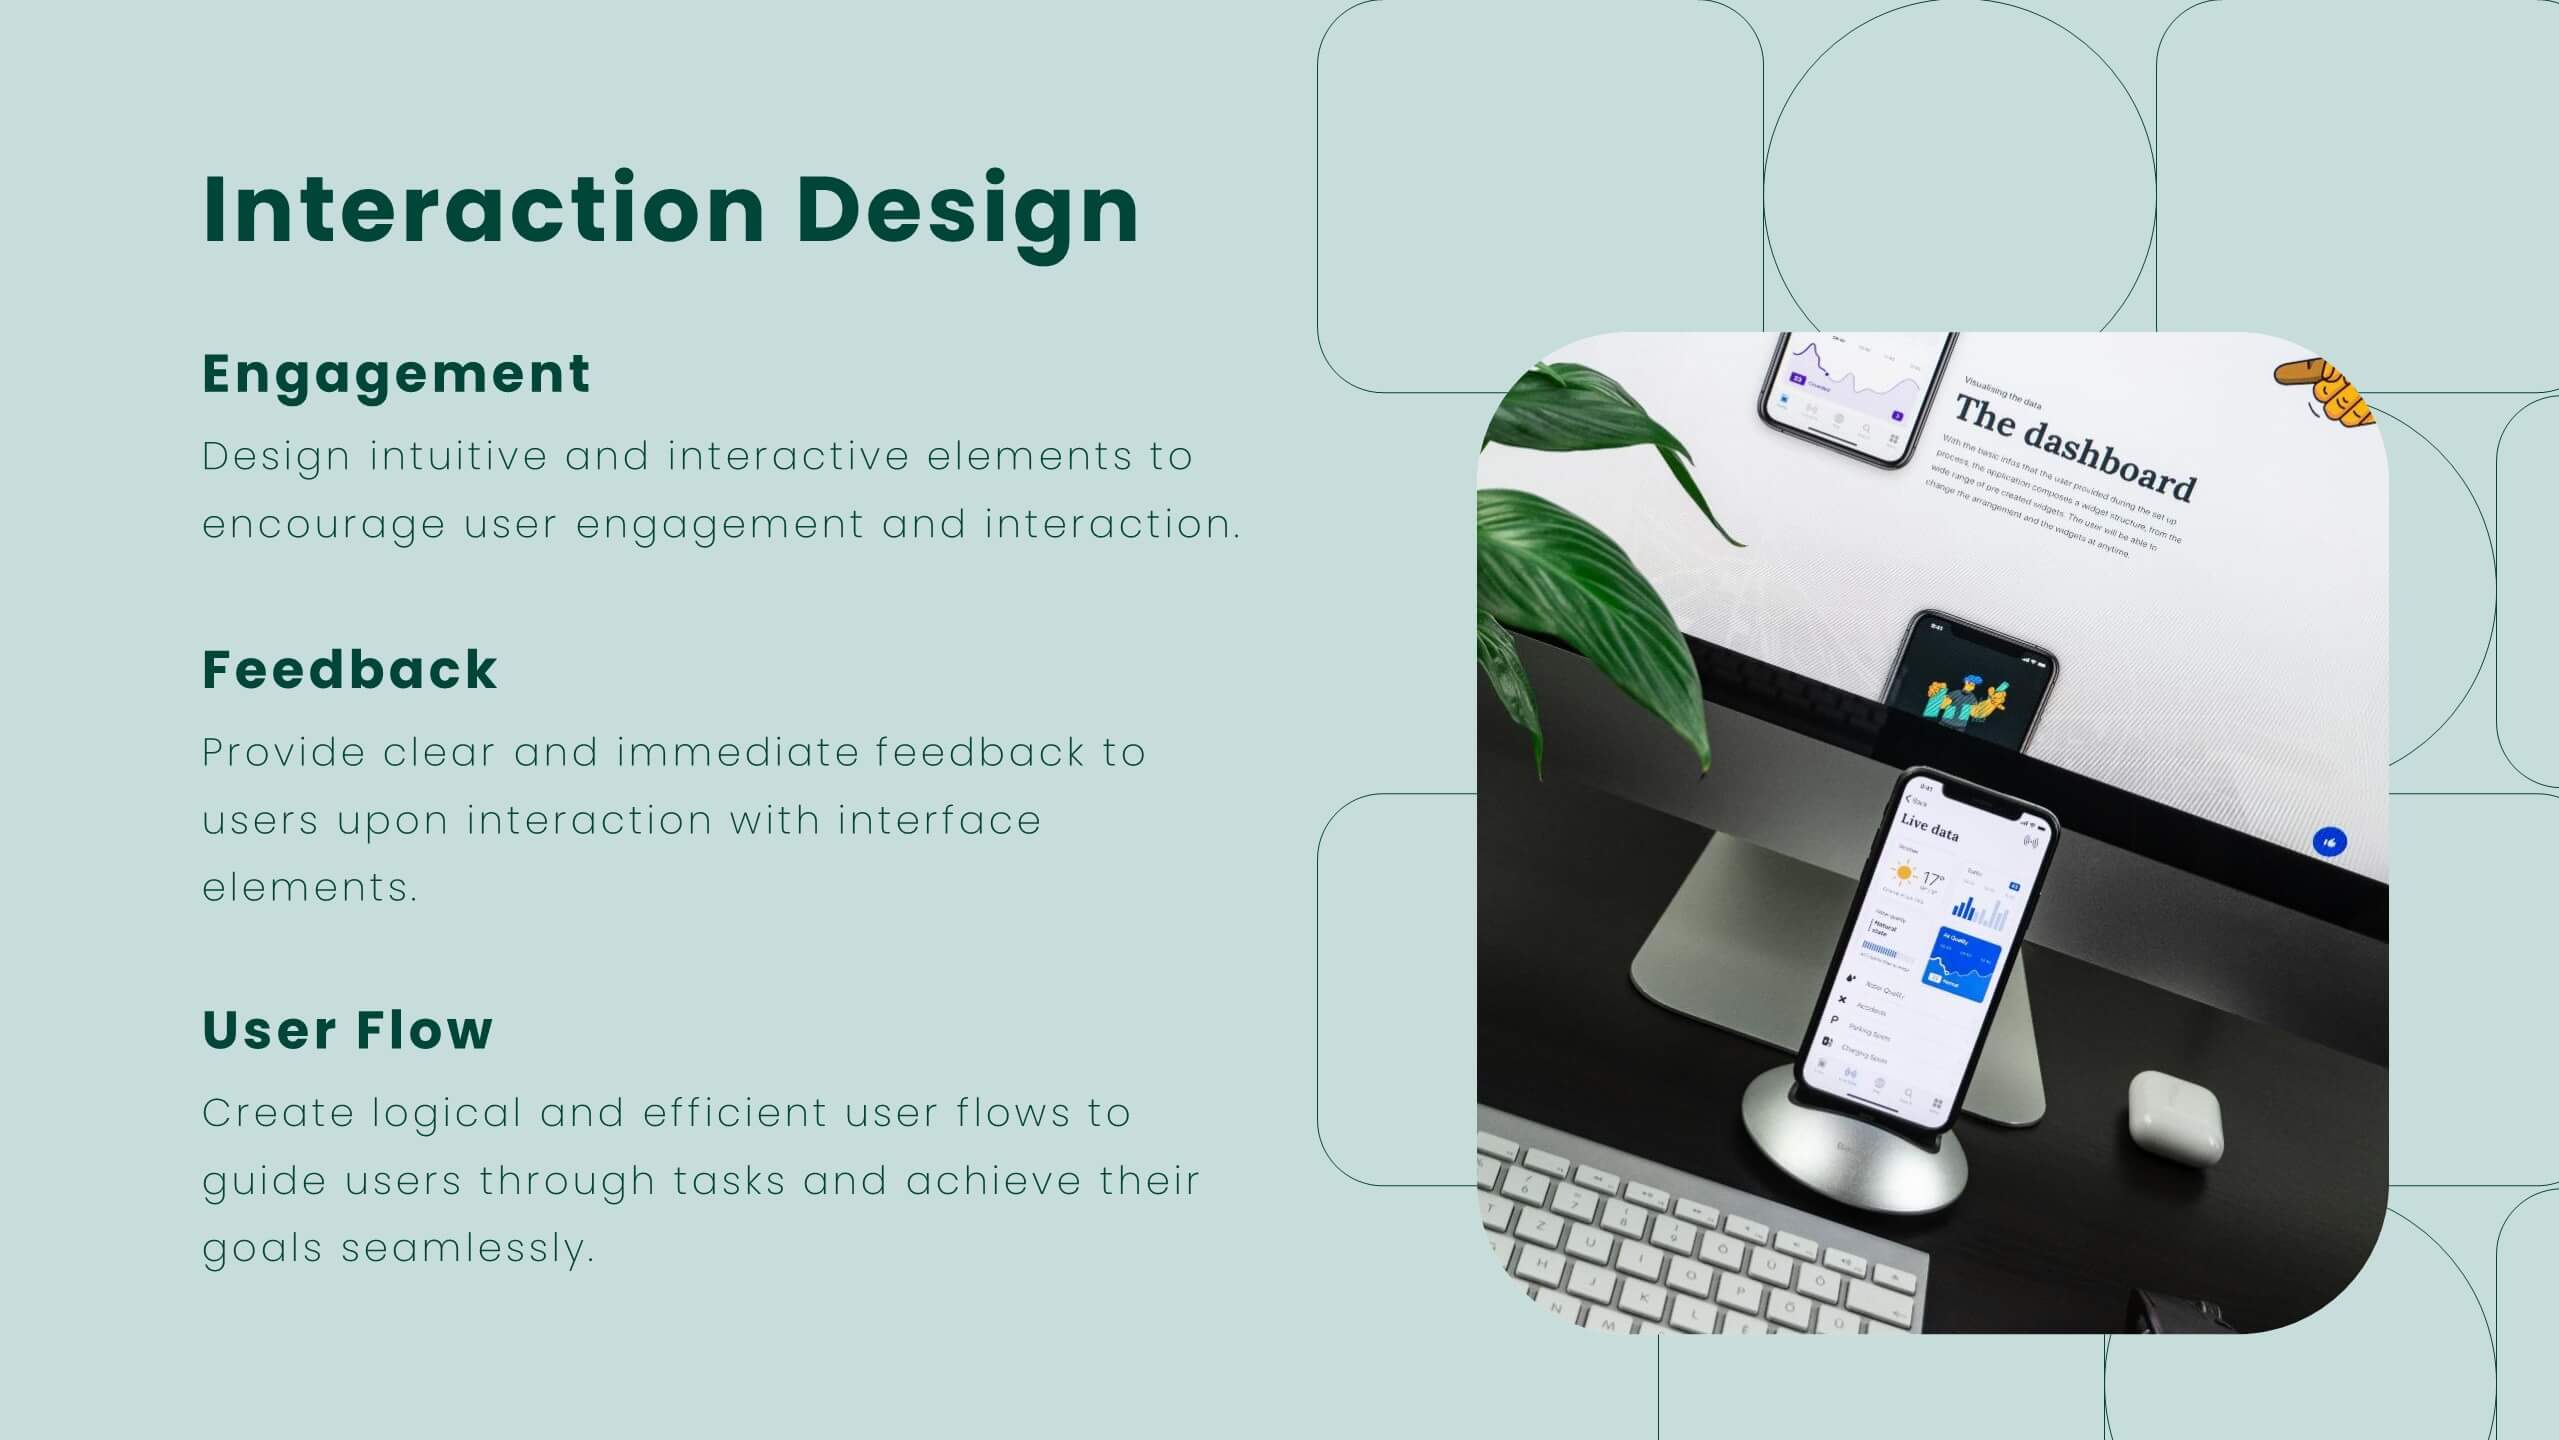
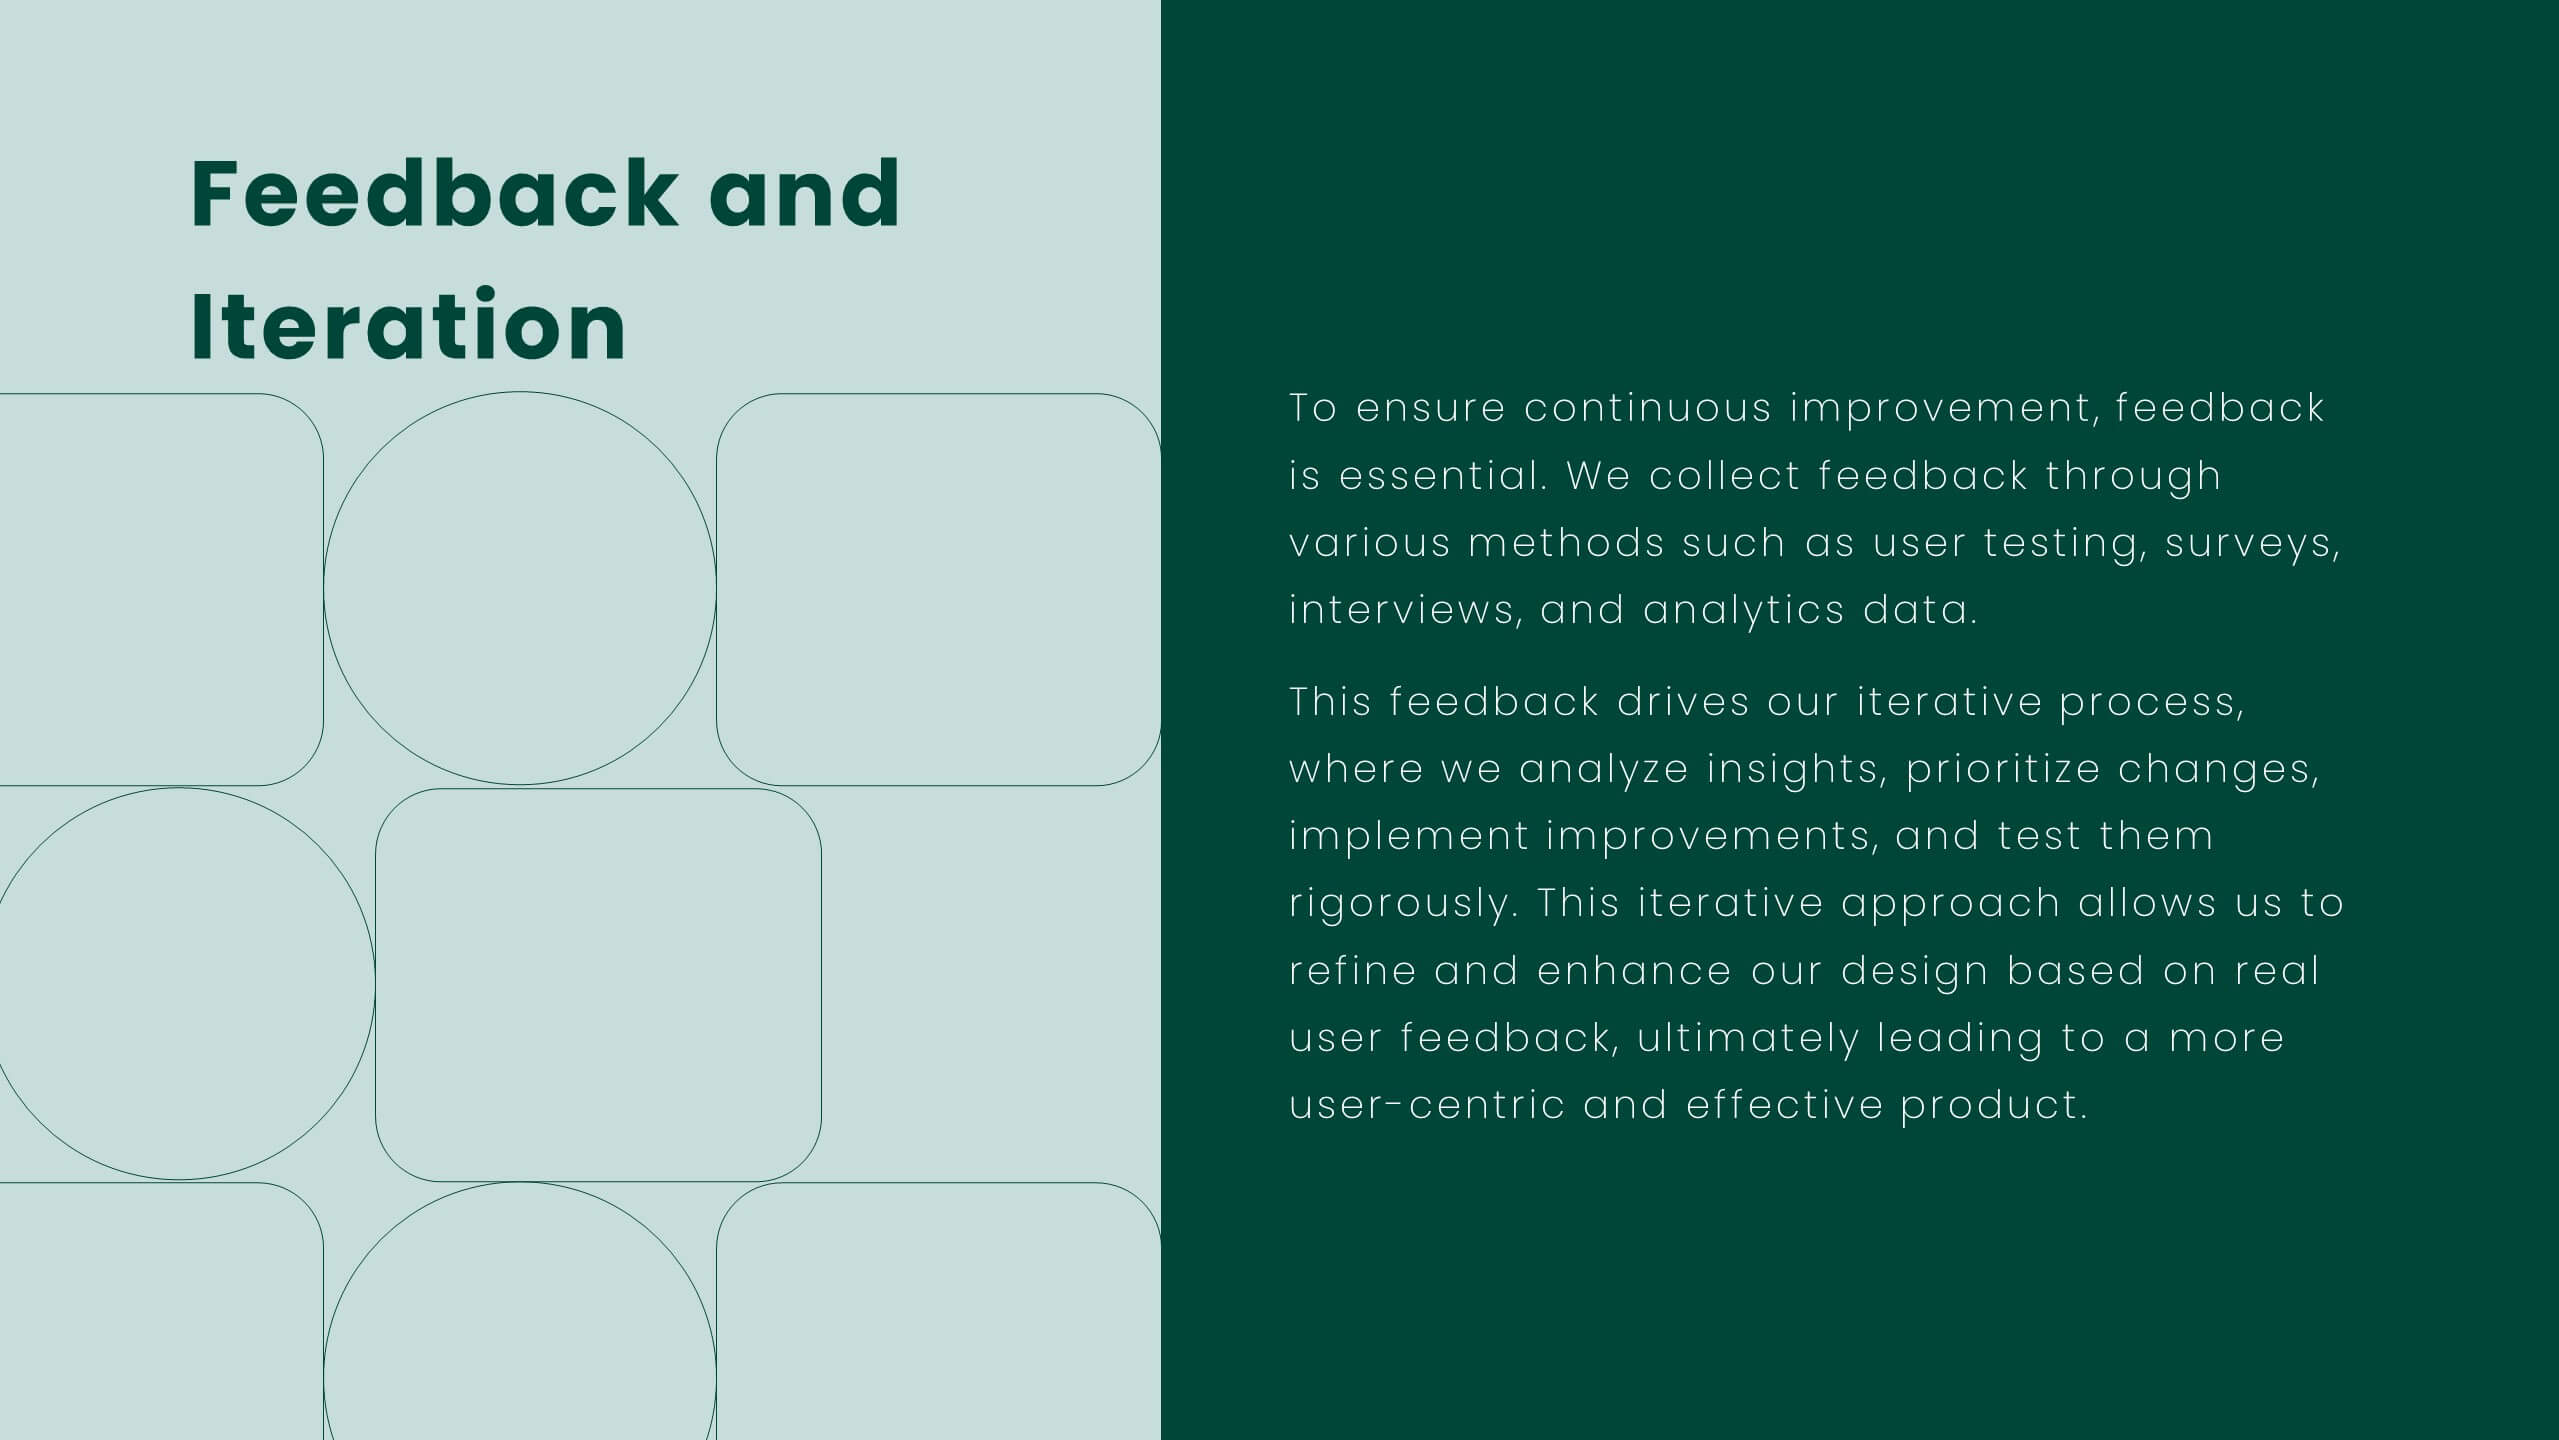
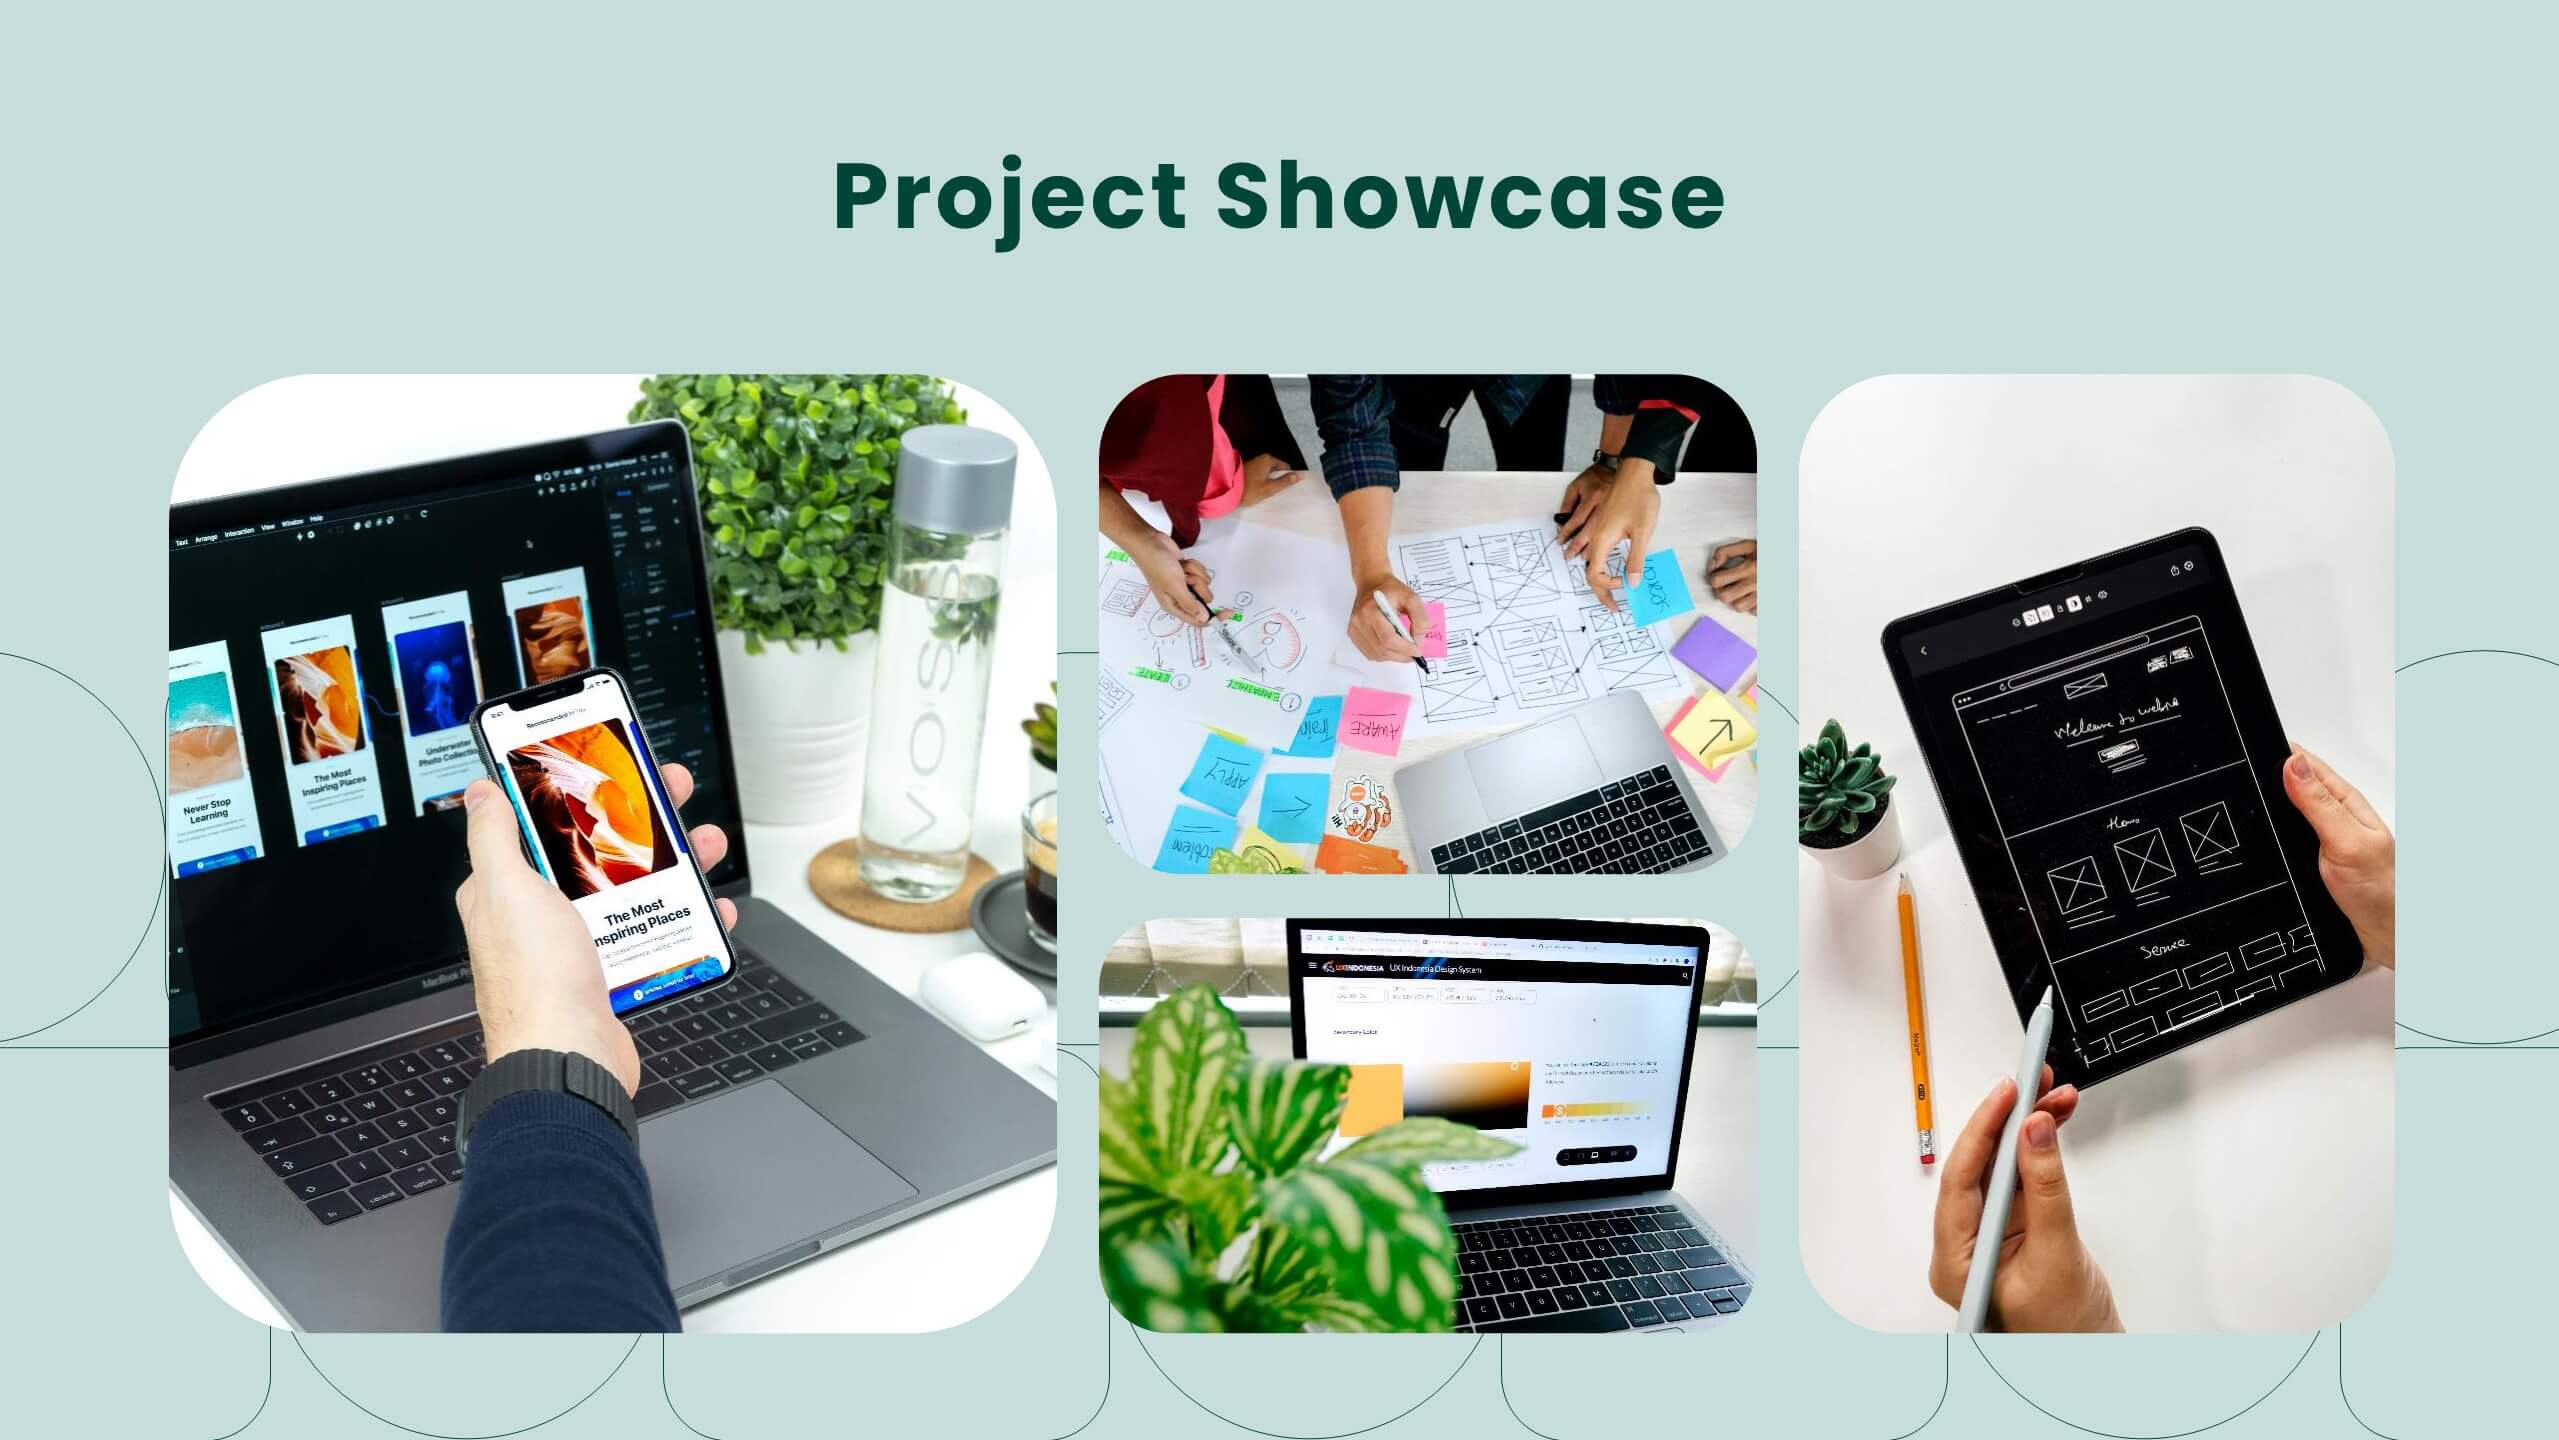
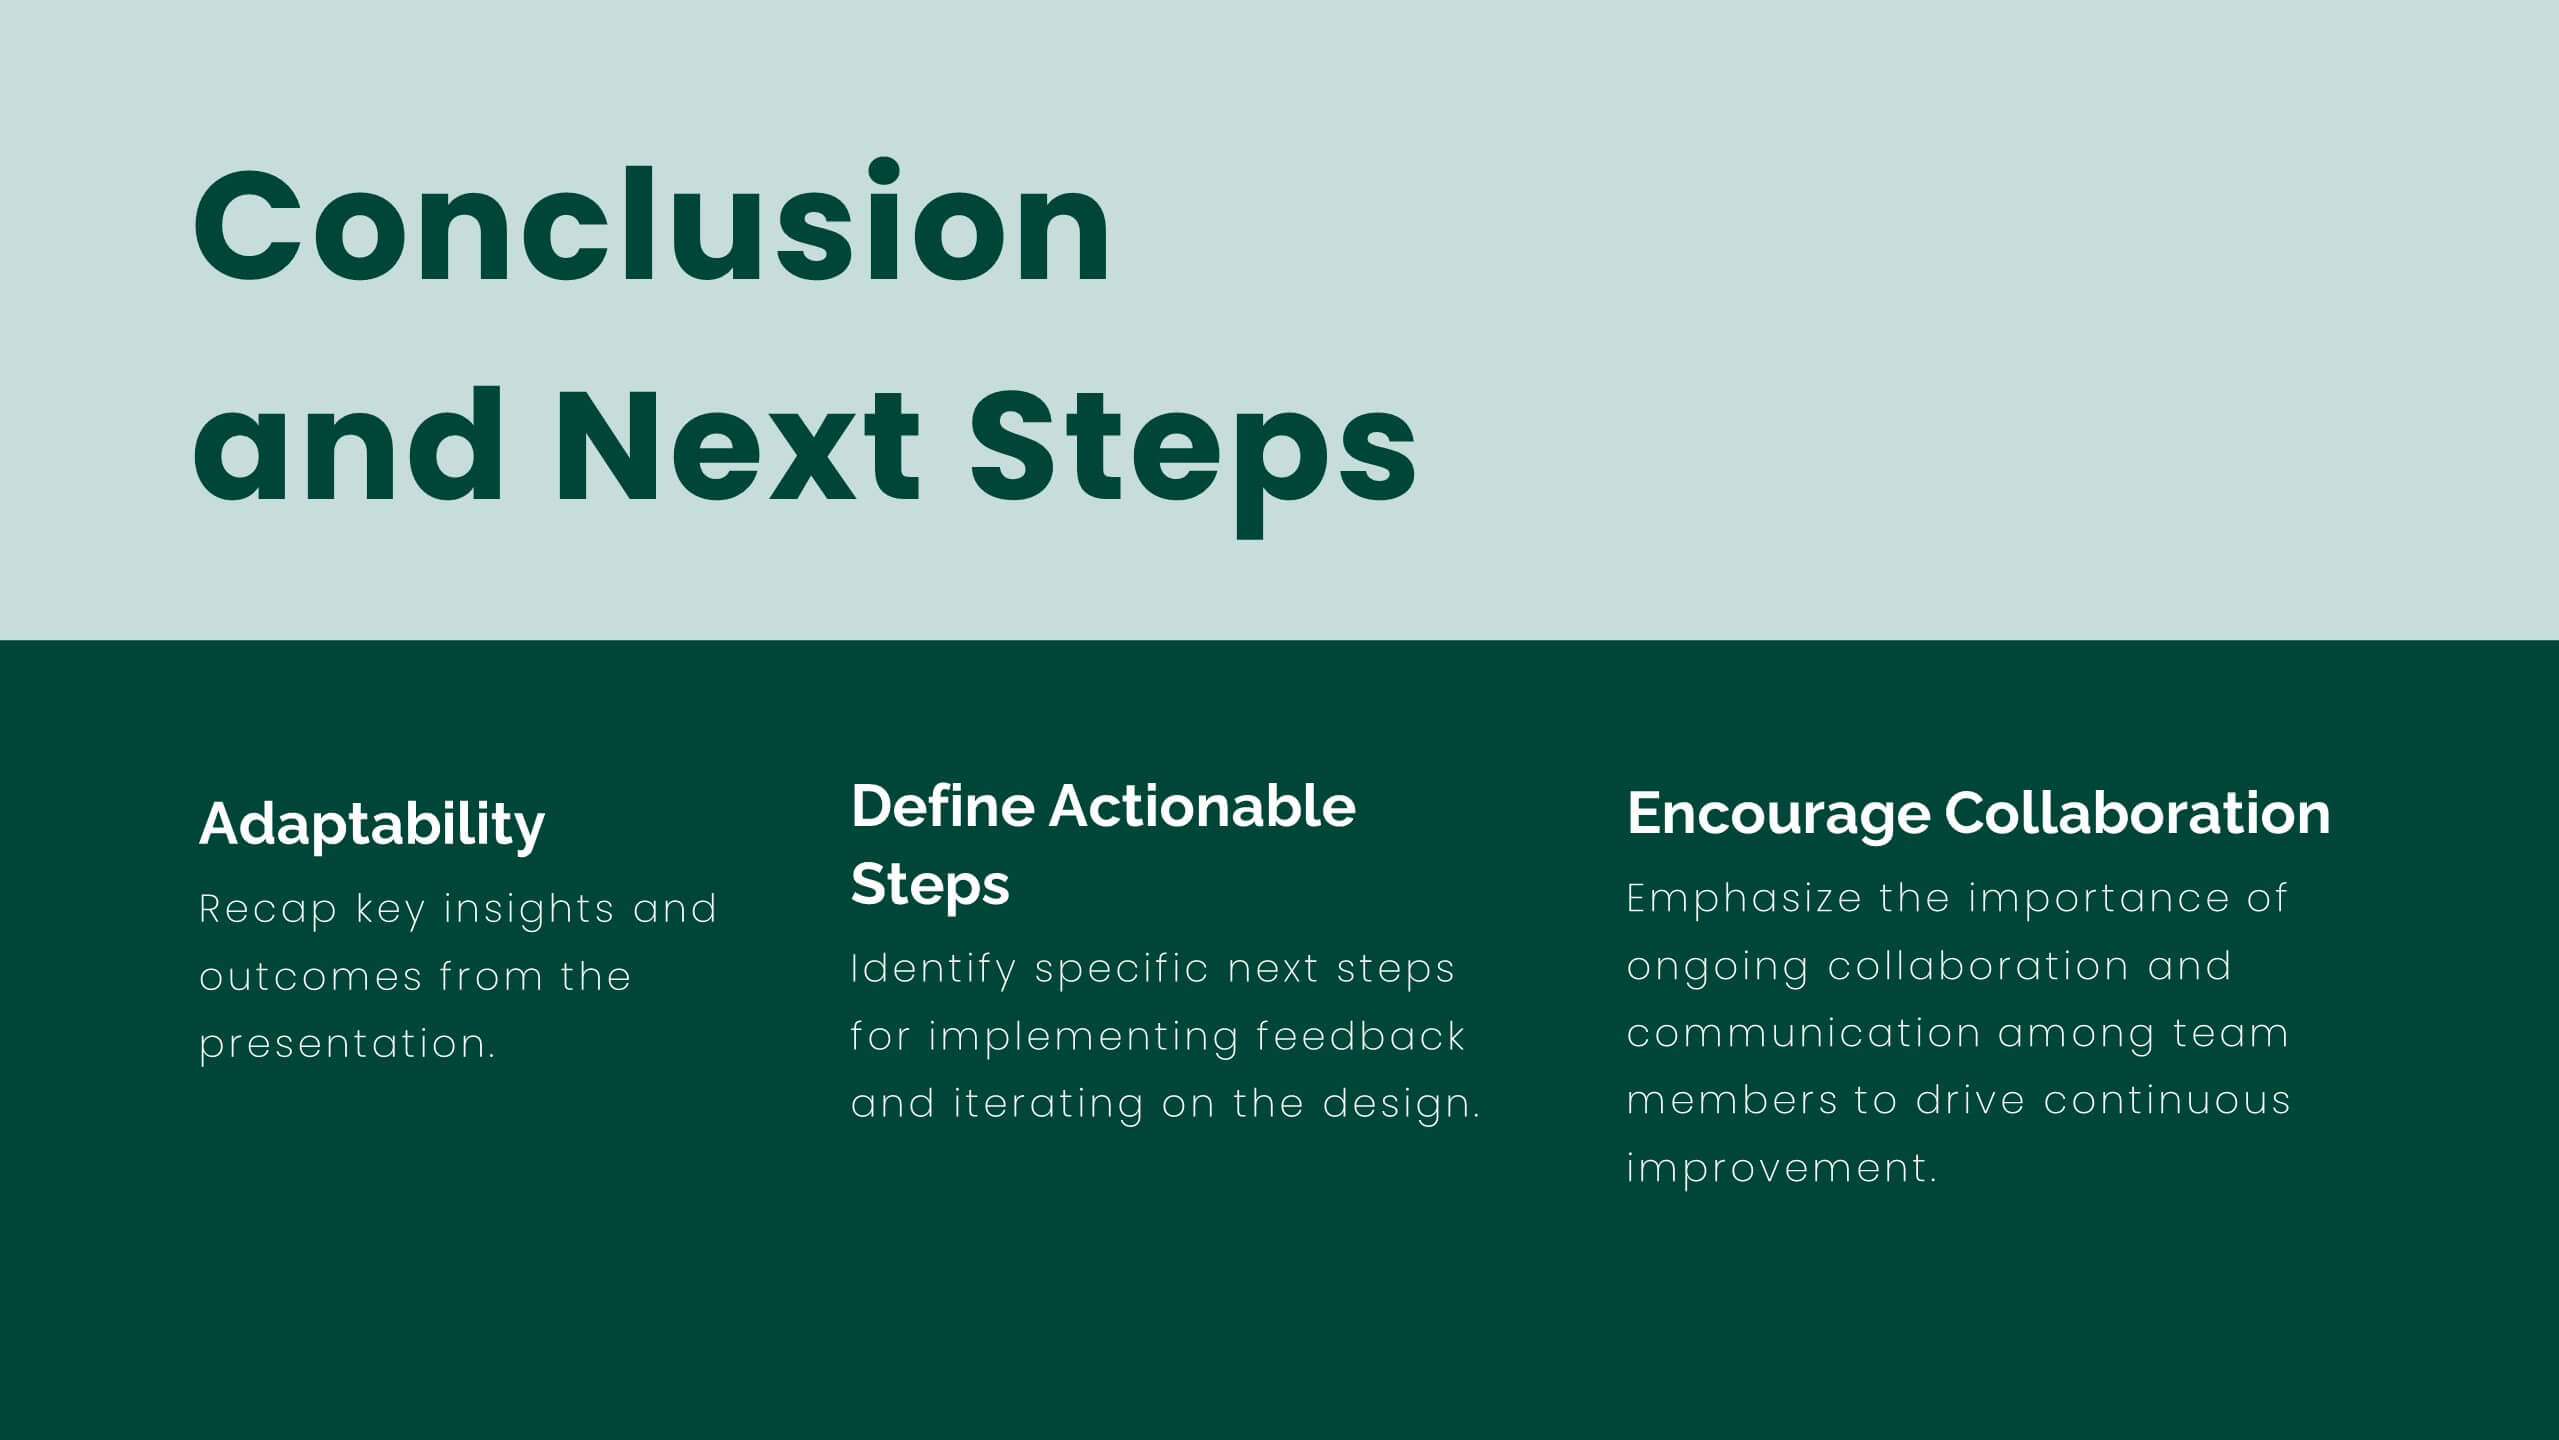
Lumina UX Case Study Presentation
Create compelling UX case studies with this modern template. Cover user research, personas, wireframes, and prototyping. Perfect for showcasing UI design principles, responsive design, and usability guidelines. Highlight feedback, iteration, and project showcase. Compatible with PowerPoint, Keynote, and Google Slides. Elevate your UX presentations and impress stakeholders with clear, detailed insights.


5 diapositivas
USA Economy Infographics
The U.S. economy has a significant impact on the global economy and serves as a benchmark for economic performance. These vertical infographics are the perfect tool to present your key facts, statistics, and trends to help the audience understand the economic landscape of the country. The visually appealing design included, coupled with concise and relevant information, helps to effectively communicate the complexities of the economy. Whether used for educational purposes or as a reference tool, these templates provides a comprehensive overview of the USA economy and its key components. Fully compatible with Powerpoint, Keynote, and Google Slides.


22 diapositivas
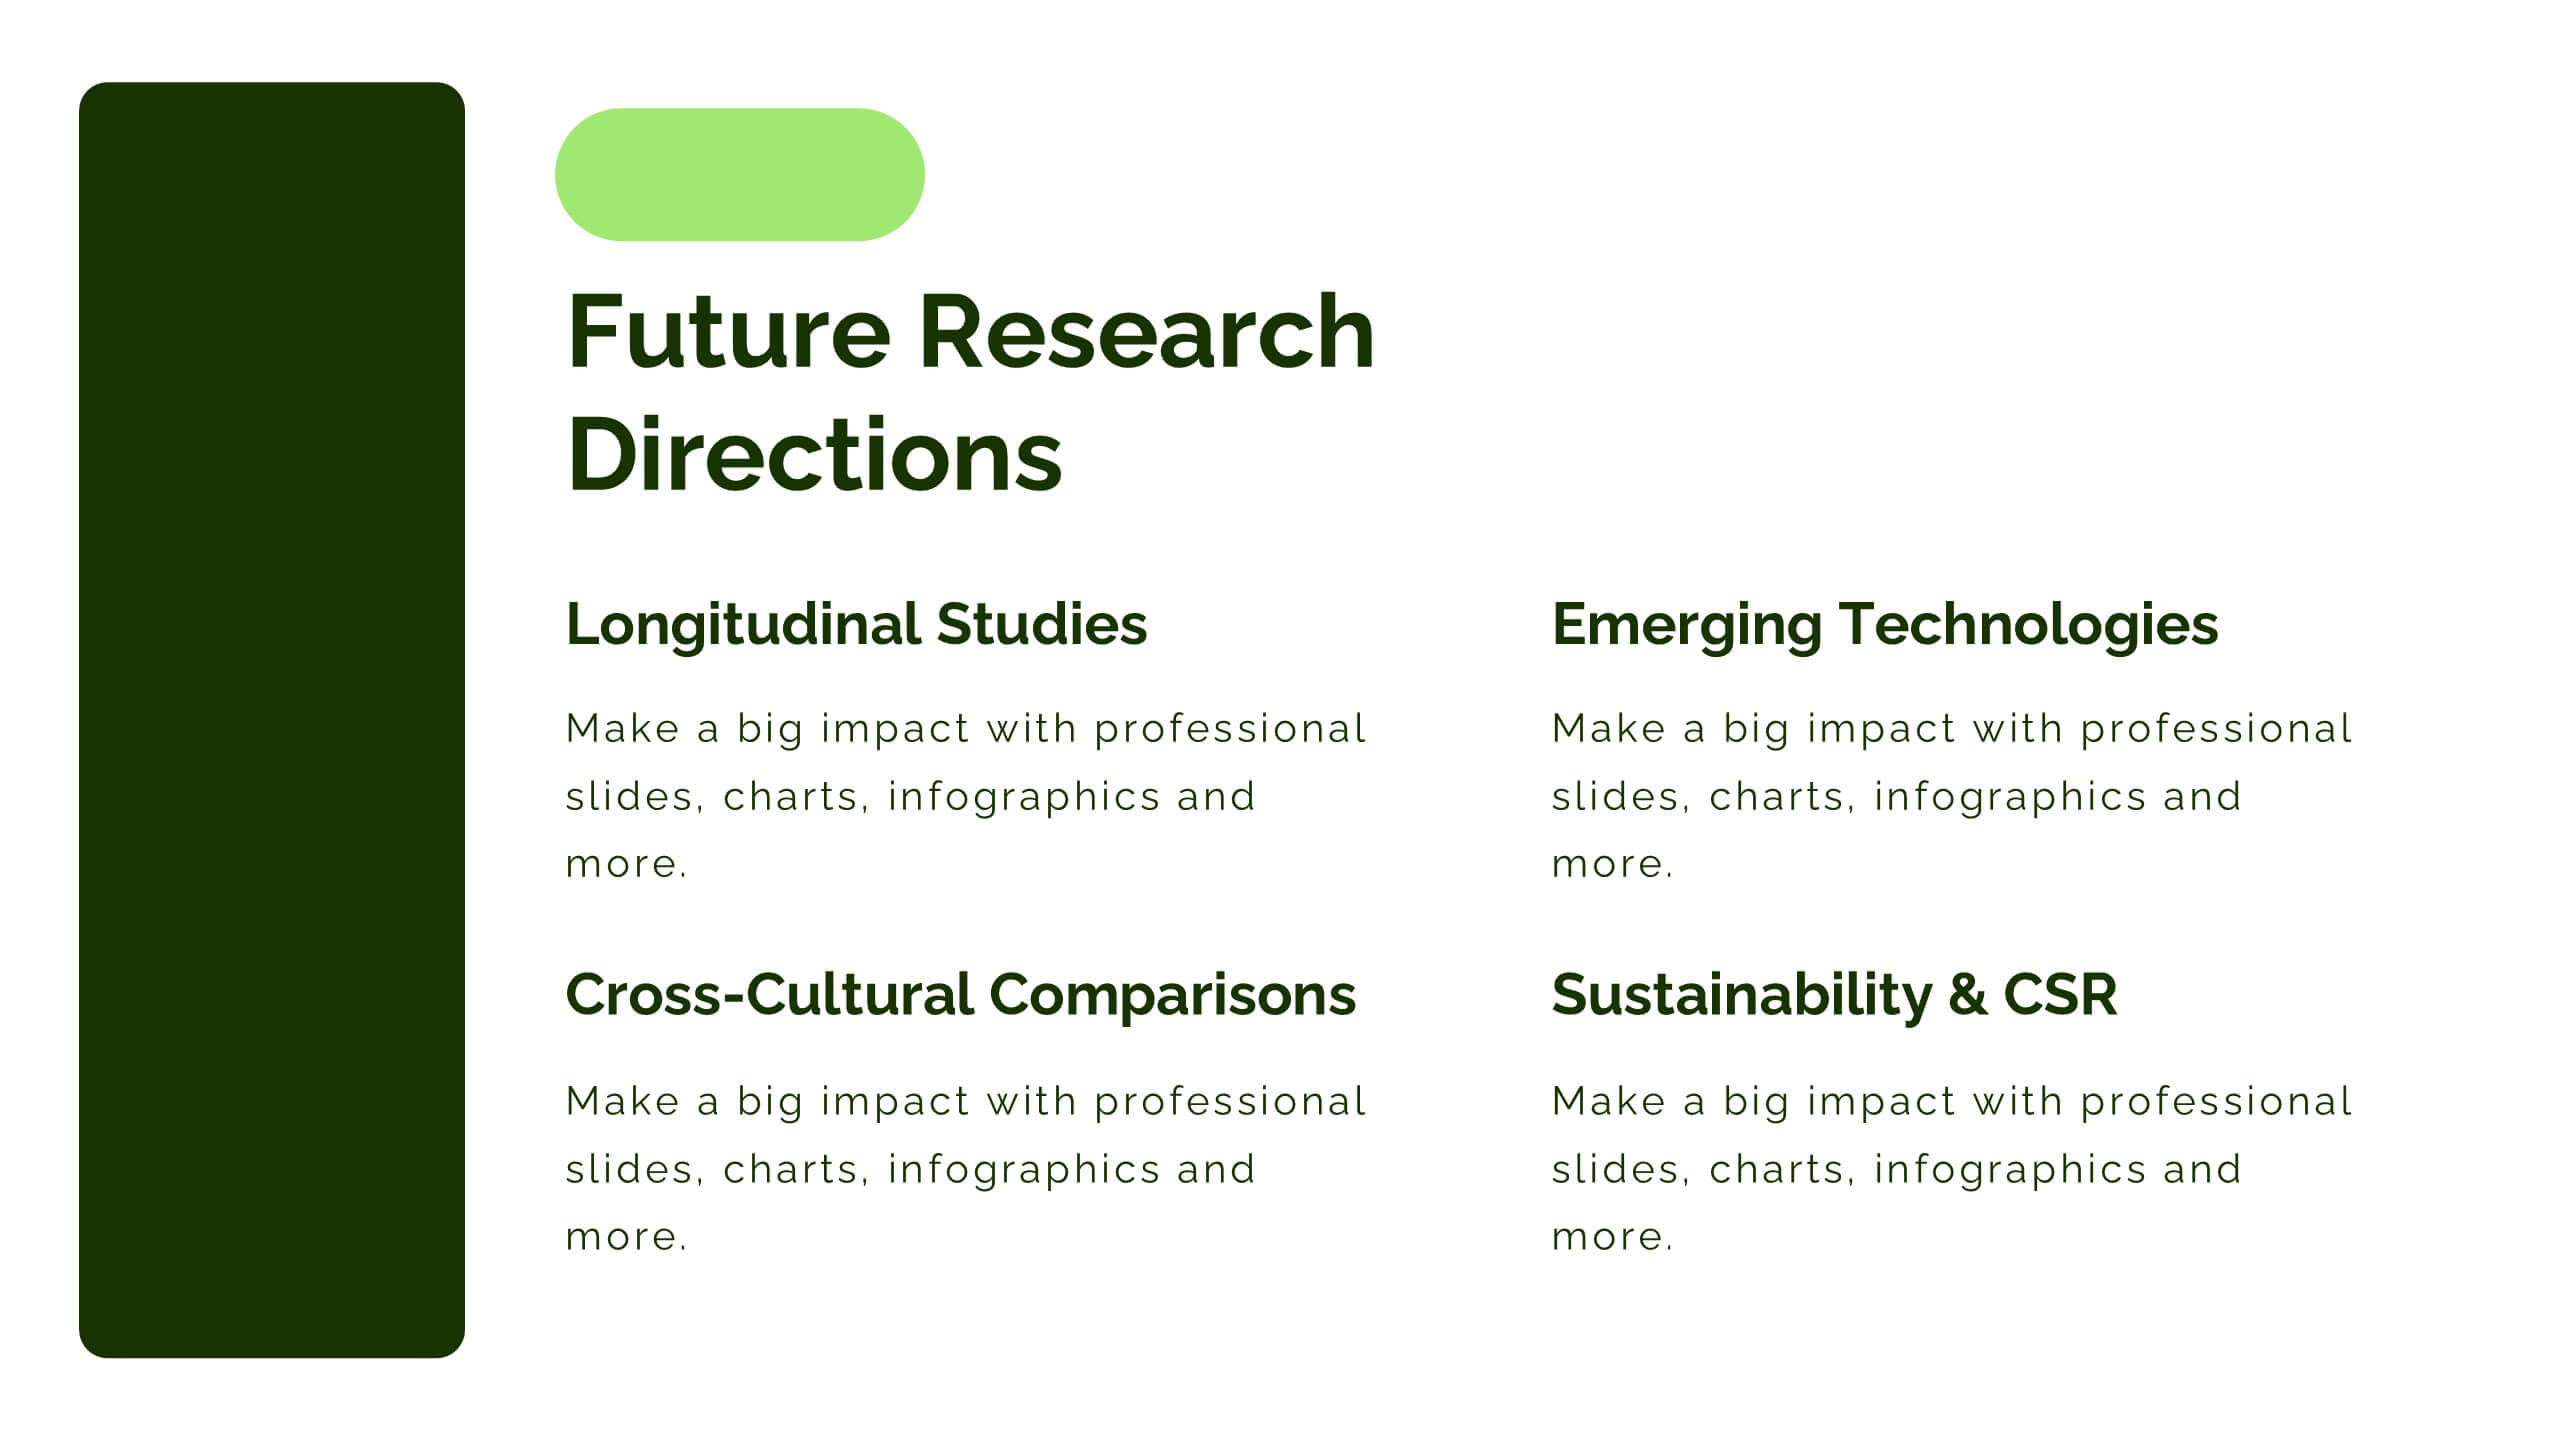
Galvonic Research Proposal Presentation
Present research insights professionally with this comprehensive proposal template. Covering objectives, methodology, findings, and implications, it provides a clear structure for academic or market research projects. Compatible with PowerPoint, Keynote, and Google Slides, it’s ideal for presenting detailed analysis, conclusions, and future directions.


6 diapositivas
Bubble Chart Data Visualization Presentation
Make your data pop with visuals that tell a story at a glance. This modern presentation transforms raw numbers into clear, engaging bubble charts that simplify complex insights and comparisons. Fully editable and compatible with PowerPoint, Keynote, and Google Slides for effortless customization and professional results.


4 diapositivas
Social Media Analytics Dashboard Presentation
Easily monitor and report on your content performance with the Social Media Analytics Dashboard Presentation. This sleek, modular layout combines key metrics like items, uploads, comments, and feeds with a vertical bar chart to visualize insights across platforms. Ideal for campaign reviews, stakeholder updates, or team reporting. Fully customizable in PowerPoint, Keynote, and Google Slides.


23 diapositivas
Imaginix Digital Strategy Presentation
Plan and execute your business strategy with this sleek and modern template. Covering key areas such as SWOT analysis, competitive landscape, performance metrics, and implementation plans, it’s perfect for professionals aiming to optimize digital initiatives. Fully customizable and compatible with PowerPoint, Keynote, and Google Slides.


5 diapositivas
How Alcohol Affects The Body Infographics
The effects of alcohol can vary depending on factors such as the amount consumed, frequency of consumption, individual tolerance, and overall health. These infographic templates can be used as informative resources that illustrate the impact of alcohol on the human body. This template is designed to help educate and raise awareness about the physiological and health effects of alcohol consumption. Compatible with Powerpoint, Keynote, and Google Slides. With its visually appealing design, organized sections, and clear information, this template will help create awareness and promote responsible alcohol consumption practices.


6 diapositivas
First-Time Buyer Tips Infographic
Navigate the thrilling world of first-time purchases with our "First Time Buyer Tips" Infographic Template. This vibrant tool is crafted to guide newcomers through the buying process with clarity and confidence. Each slide is a step-by-step beacon, illuminating the path with expert advice, from understanding budgeting basics to mastering negotiation tactics. Designed with the novice buyer in mind, this template features a series of easy-to-follow visuals and succinct tips that demystify the complexities of making major purchases. The clean, engaging design ensures that each piece of advice is both accessible and memorable, ideal for personal finance websites, real estate blogs, or consumer education workshops. Customize the color schemes, fonts, and layouts to align with your branding, making it a seamless addition to your educational materials. Equip your audience with the knowledge they need to make informed, confident decisions with this indispensable guide.


3 diapositivas
Clear Navigation Table of Content Presentation
Streamline your presentation flow with this Clear Navigation Table of Content layout. Featuring labeled sections, visual cues, and photo placeholders, this slide helps guide your audience through key topics. Perfect for reports, proposals, or training decks. Fully customizable in PowerPoint, Keynote, and Google Slides for seamless integration and personalization.


6 diapositivas
5-Step SEO Marketing Funnel Presentation
Ignite your marketing story with a bold, flowing visual that makes every step feel purposeful and easy to follow. This presentation breaks down each stage of the SEO funnel, helping you explain strategy, performance, and conversion paths with clarity. Fully compatible with PowerPoint, Keynote, and Google Slides.


5 diapositivas
Timeline Road Infographics
Timelines are important tools for organizing and presenting information chronologically. This timeline infographic is designed to help ensure that all your tasks are completed on time, and that the project stays on track. This is perfect for identifying potential issues that may arise during a project, so that they can be addressed before they become major problems. This template consists of a road or a horizontal line, with markers or milestones placed at specific intervals. Each marker represents a significant event or achievement, and is accompanied by a short description, date or time frame.