


Características


¿Tienes alguna pregunta?
Recomendar
8 diapositivas
Business Growth and Progress Tracking Presentation
Visualize success with this upward-arrow roadmap template designed to highlight four key stages of business development. Ideal for managers, analysts, and entrepreneurs, this slide uses milestone icons and clean, directional layout to emphasize progress. Fully editable in PowerPoint, Keynote, and Google Slides for seamless customization.


22 diapositivas
Pearl Product Launch Pitch Deck Presentation
Make your product launch shine with this sleek, pearl-inspired presentation! Perfect for pitching your product’s unique value, market positioning, and growth potential, this template is designed to captivate investors and stakeholders. Its elegant, minimalist layout keeps your message front and center. Compatible with PowerPoint, Keynote, and Google Slides.


6 diapositivas
Efficient Scheduling and Time Management Presentation
Stay on time and on target with the Efficient Scheduling and Time Management presentation slide. Designed with smartwatch graphics showing time progression, this layout visually emphasizes planning, deadlines, and time-based tasks. Ideal for outlining agendas, productivity methods, or resource allocation strategies. Each time block includes editable text fields for key milestones or steps. Compatible with PowerPoint, Keynote, and Google Slides.


10 diapositivas
Real Estate Market Trends Presentation
Stay ahead of Real Estate Market Trends with this data-driven presentation template. Designed for agents, investors, and analysts, this template visually highlights housing trends, market insights, and investment opportunities with engaging layouts. Fully customizable and available for PowerPoint, Keynote, and Google Slides, ensuring a professional and compelling presentation.


20 diapositivas
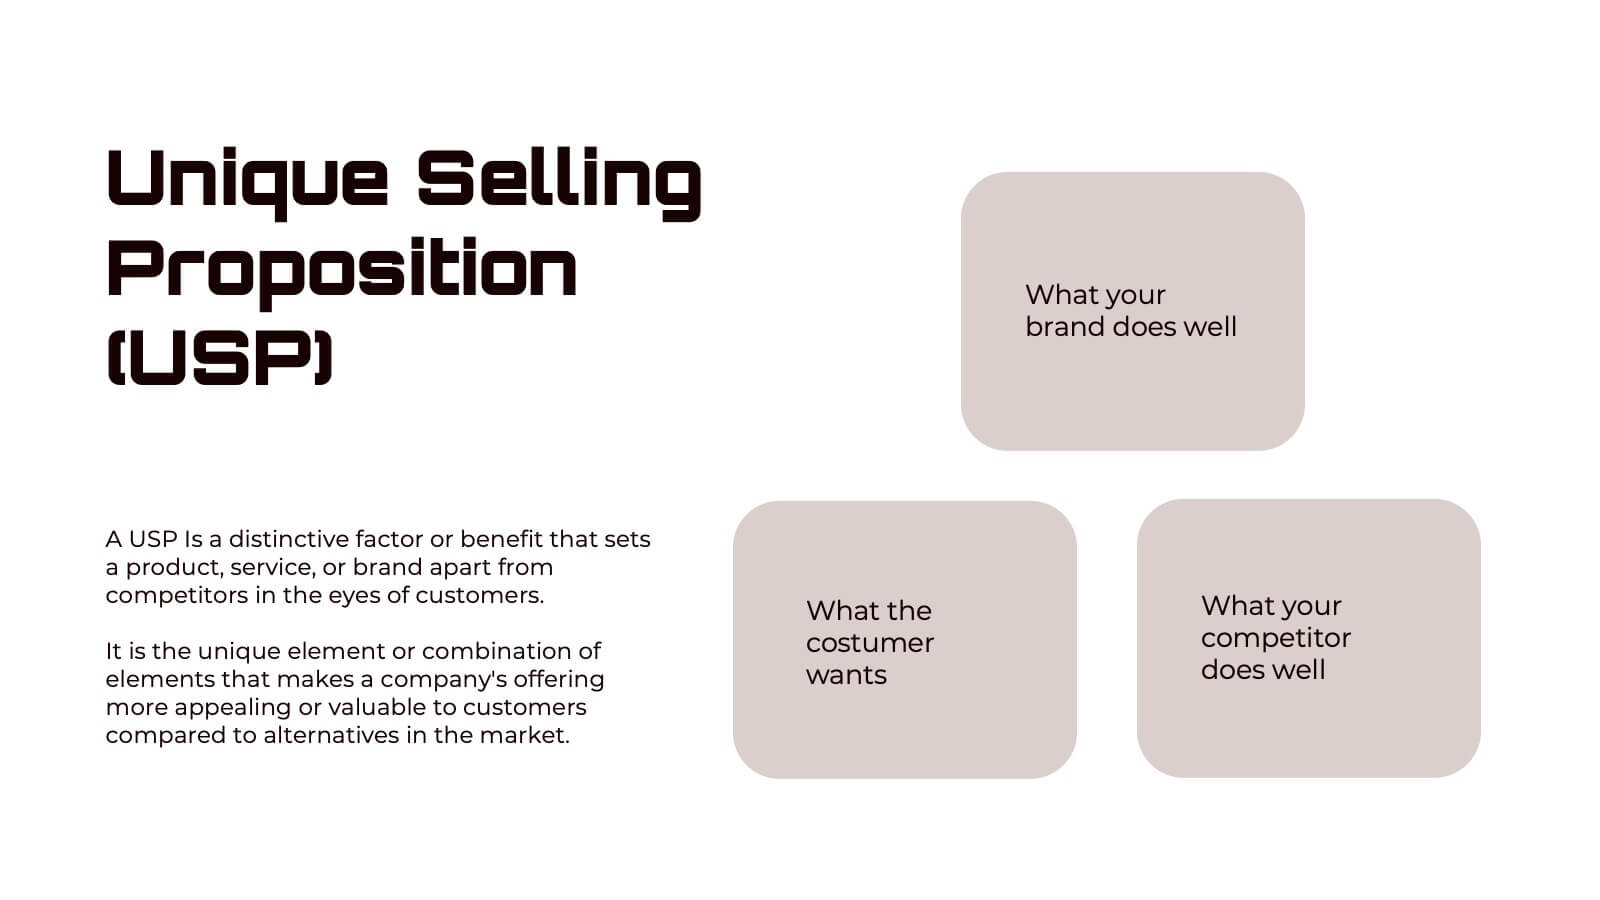
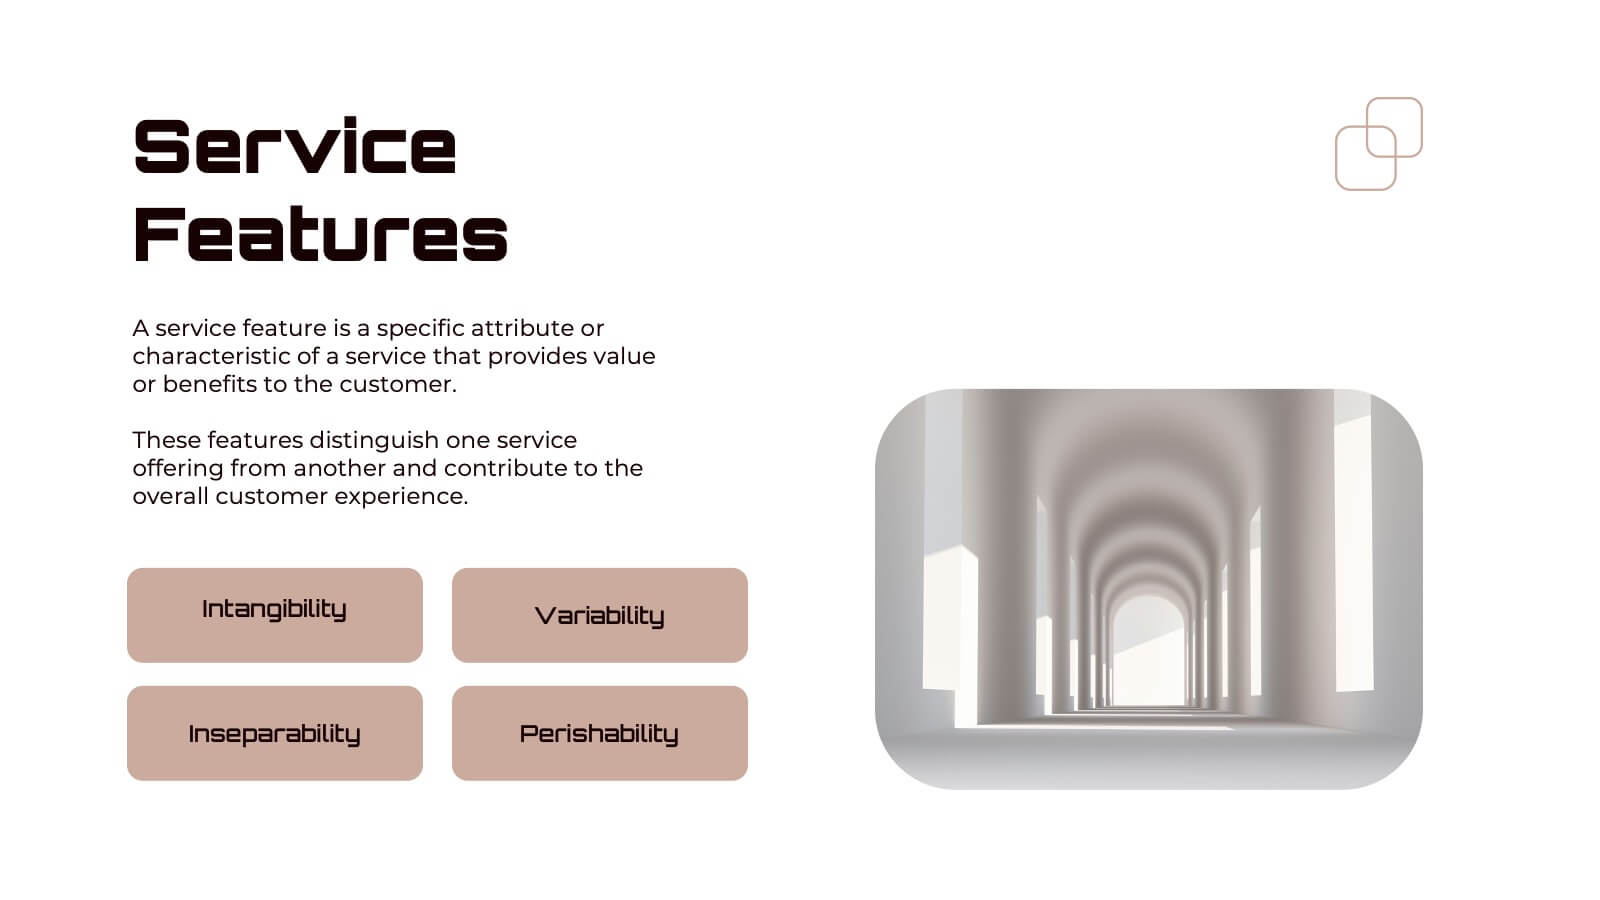
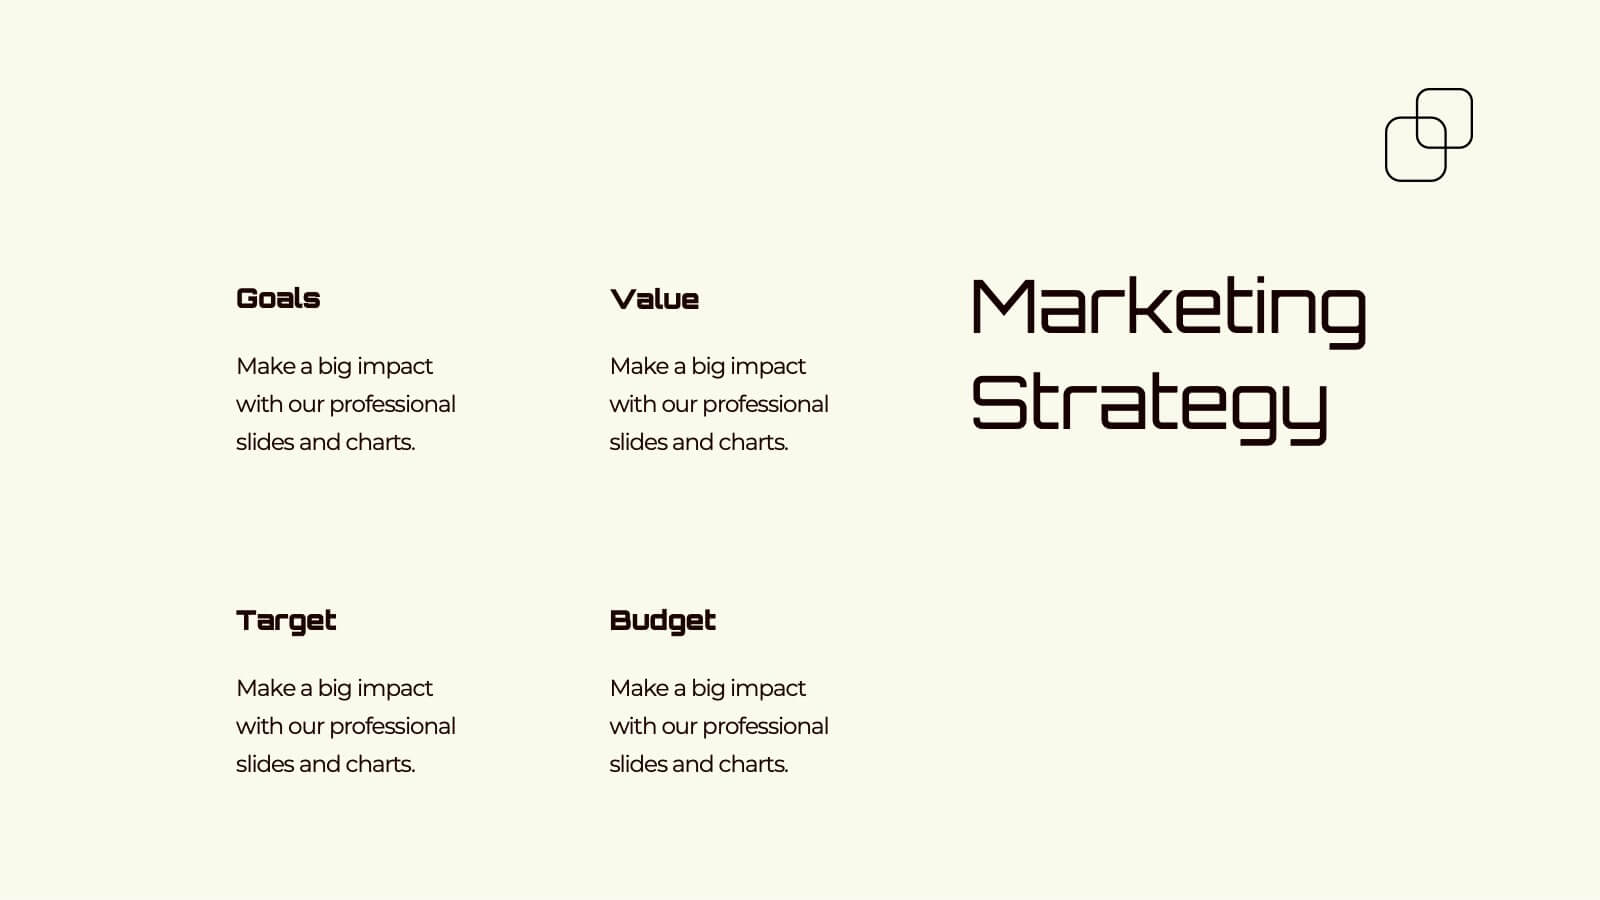
Unity New Product Proposal Presentation
Unveil your product strategy with this modern, comprehensive template! Highlight your company overview, product features, and unique selling proposition. Perfect for presenting market analysis, pricing strategy, and technical specifications. Ideal for product managers and developers. Compatible with PowerPoint, Keynote, and Google Slides.


4 diapositivas
Business Strategy Puzzle Graphic Presentation
Bring your ideas together with a design that snaps every strategic point into place. This presentation turns complex planning into a clear, engaging visual puzzle that highlights key insights, goals, and outcomes. Ideal for business reviews, team alignment, and decision-making sessions. Fully compatible with PowerPoint, Keynote, and Google Slides.


5 diapositivas
New Employee Onboarding Training Presentation
Make a lasting first impression with a fun, visual walkthrough of your company’s onboarding steps. This presentation template breaks down training stages into a clean, engaging flow that helps new hires feel welcomed and informed. It’s fully editable and works seamlessly in PowerPoint, Keynote, and Google Slides.


4 diapositivas
AIDA Marketing Funnel Slide Presentation
Capture attention from the very first slide with a bold, structured layout that turns each stage of your message into a clear, engaging flow. This presentation helps simplify complex decision paths and guide viewers through each step with ease. Fully editable and compatible with PowerPoint, Keynote, and Google Slides.


6 diapositivas
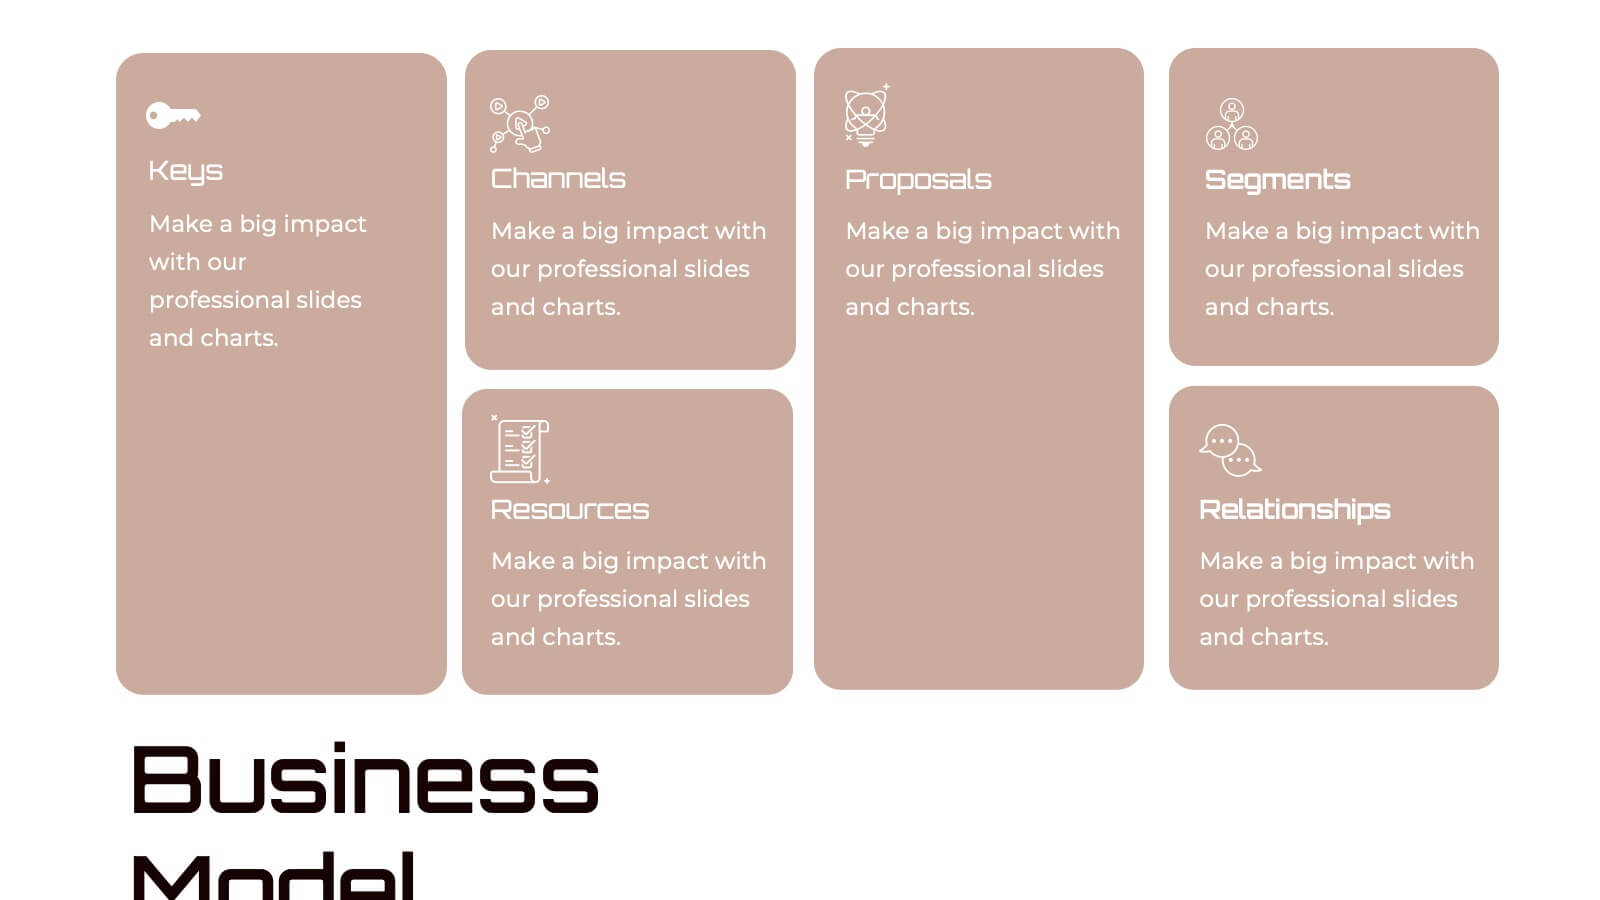
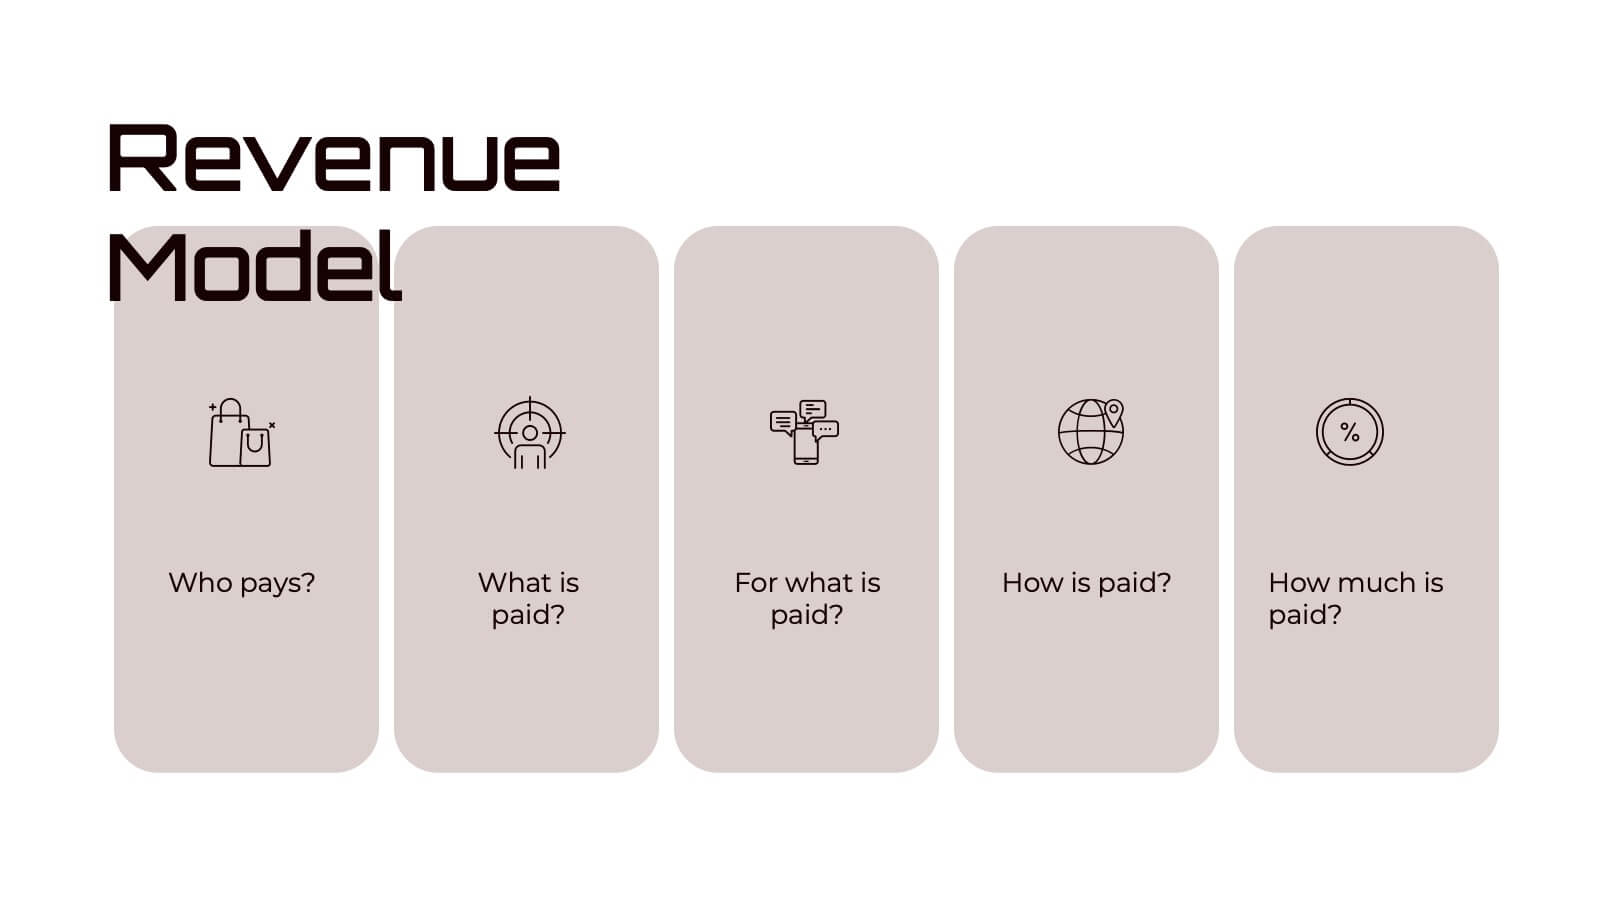
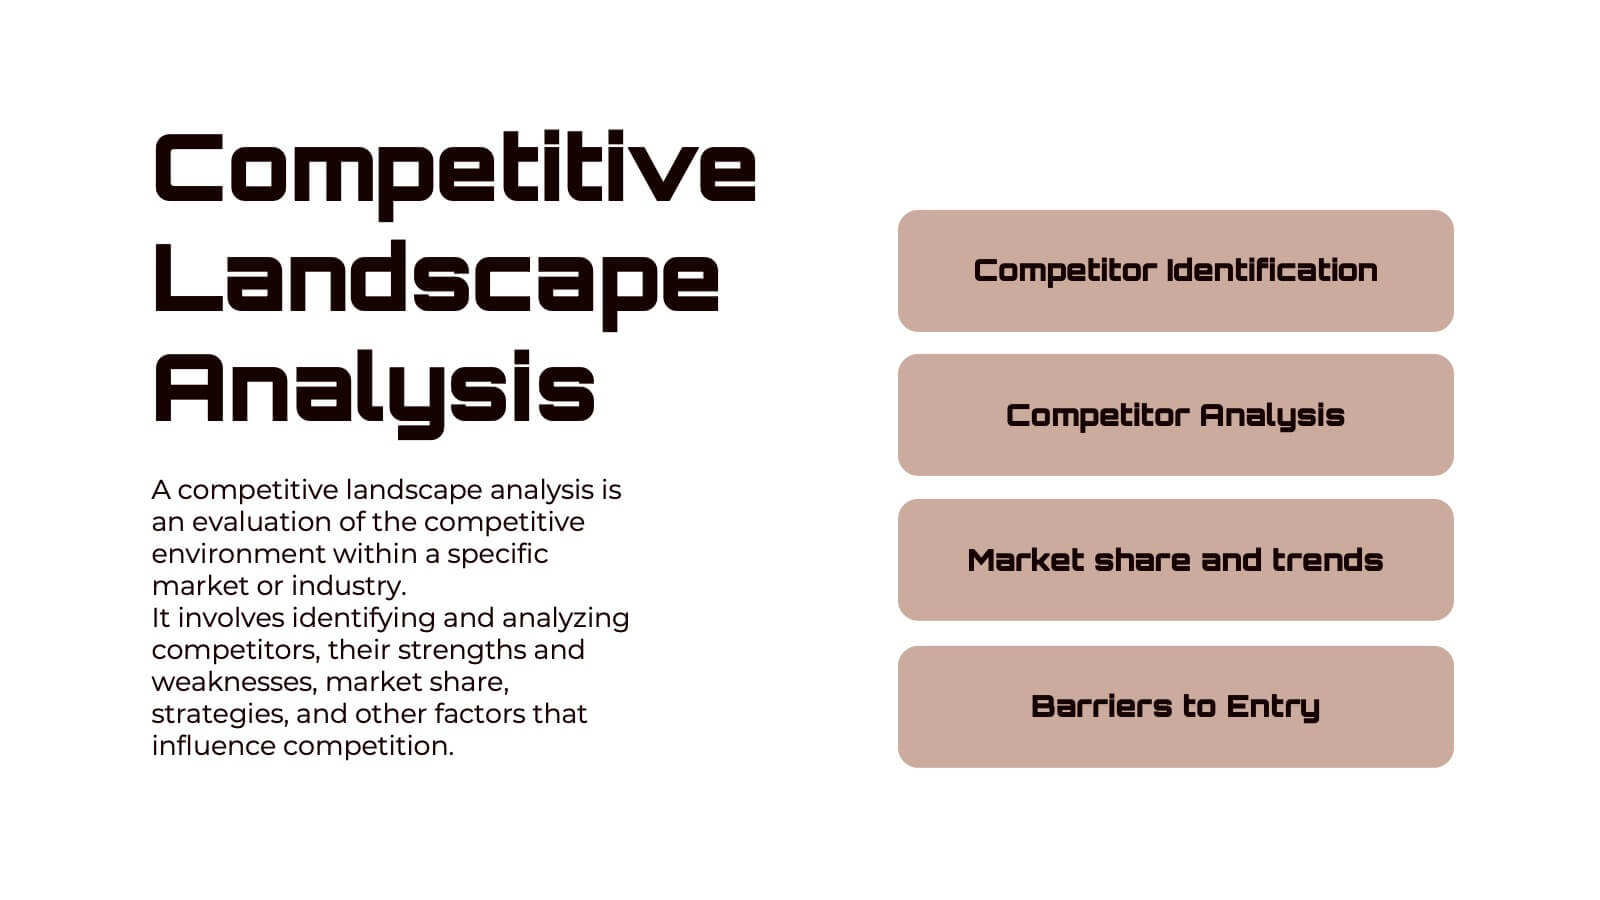
Corporate Framework Planning Presentation
Organize and present your strategic plans with this clean corporate framework layout. Ideal for showcasing six key areas of focus, this slide helps communicate business insights, goals, and execution pillars clearly. Fully editable in Canva, PowerPoint, and Google Slides—perfect for business plans, executive meetings, or internal project reviews.


4 diapositivas
Aviation Industry Overview Presentation
Bring your data in for a smooth takeoff with this clean and modern visual layout. Perfect for presenting industry insights, market trends, or operational performance, this design helps convey complex information with clarity and flow. Fully editable and compatible with PowerPoint, Keynote, and Google Slides for seamless customization.


8 diapositivas
Team Statistics and Rankings Presentation
Showcase match performance, rankings, and team metrics with this Team Statistics and Rankings Presentation. Visualize key game stats using editable diagrams, heatmaps, and comparison scores. Perfect for sports analysts, coaches, or recap slides. Compatible with PowerPoint, Keynote, and Google Slides—fully customizable for your team’s specific data and branding needs.


5 diapositivas
Business Issue Root Cause Identification
Pinpoint the real reasons behind business challenges with this clear and visual layout. This root cause identification template breaks down effects and traces them back to their sources, making it easier to align your team and propose actionable solutions. Fully customizable in PowerPoint, Keynote, and Google Slides.


4 diapositivas
Top Cryptocurrency Market Trends Presentation
Bring financial insights to life with a modern, data-focused layout designed to showcase the latest movements, growth, and innovations in digital assets. Ideal for analysts and entrepreneurs, it turns trends into clear visuals for any audience. Fully compatible with PowerPoint, Keynote, and Google Slides for easy customization and professional results.


21 diapositivas
Rakshasa Project Status Report Presentation
This detailed status report template helps track progress with clarity and precision. Featuring sections on financial summaries, operational updates, key achievements, and market trend analysis, it ensures seamless reporting and decision-making. Perfect for reviewing team productivity, challenges, and upcoming priorities, this template offers easy customization in PowerPoint, Keynote, or Google Slides.


8 diapositivas
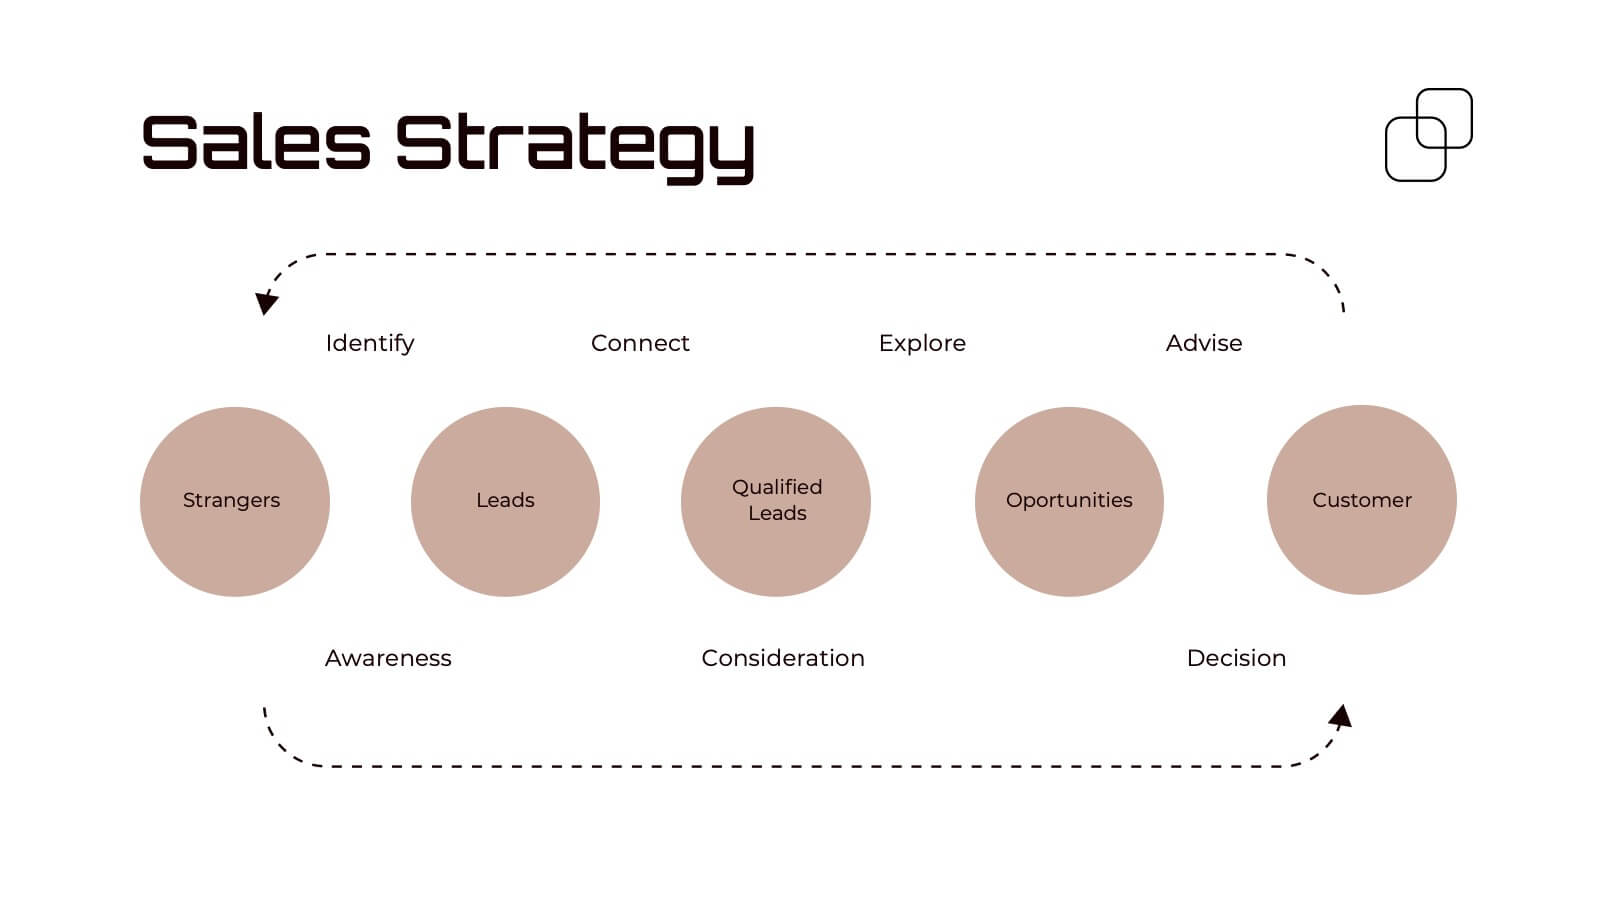
Sales Funnel AIDA Strategy Presentation
Streamline your marketing approach with the Sales Funnel AIDA Strategy Presentation template. Designed to visualize the Attention, Interest, Desire, and Action (AIDA) Model, this engaging funnel graphic effectively illustrates how to guide potential customers through the sales journey. Ideal for marketers, sales teams, and business strategists, this fully customizable template is compatible with PowerPoint, Keynote, and Google Slides.


4 diapositivas
Rewards and Membership Benefits Presentation
Maximize engagement and incentivize loyalty with the "Rewards and Membership Benefits" presentation template. This layout is designed to help businesses effectively communicate the value of their membership programs, highlighting perks and rewards in a visually engaging way. Perfect for marketers aiming to enhance customer retention strategies, it's compatible with PowerPoint, Keynote, and Google Slides.


5 diapositivas
Strategic Budget Planning Forecasting
Tired of messy spreadsheets? This clean and creative template makes budget forecasting easier to visualize and share. Centered around a playful piggy bank illustration, it lets you outline strategic goals, savings plans, and key metrics in a format that’s easy to follow. Fully compatible with PowerPoint, Keynote, and Google Slides.