


Características


¿Tienes alguna pregunta?
Recomendar


4 diapositivas
30 60 90 Day Plan Goals Presentation
Set your roadmap in motion with a clean, visual timeline that makes each milestone easy to follow and present with confidence. This presentation helps you outline priorities, track progress, and communicate clear goals for the first three months. Fully editable and compatible with PowerPoint, Keynote, and Google Slides.


7 diapositivas
AIDA Model Infographic Presentation Template
The AIDA model is the most commonly used marketing communication formula. It describes how people are influenced by advertising, and how brands can use this to their advantage. The AIDA model of marketing is a well-known strategy for organizations to use when presenting products and services. With this template you will be sure you have every element of the AIDA model covered in your presentation. This template will provide you with a perfect and easy way to create your ideal AIDA model presentation. This includes a comprehensive overview of the AIDA marketing funnel and how it works.


7 diapositivas
Gap Analysis Skills Infographic
Gap analysis in a skills context is a process of evaluating the difference or "gap" between the current skills and competencies of an individual or a team and the desired or required skills for a particular role, project, or goal. This infographic template is a crucial tool for personal and professional development, talent management, and strategic planning within organizations. This captivating visual is designed to help individuals and organizations bridge the skills gap effectively. This infographic serves as a compass, guiding you through the essential steps needed to identify, analyze, and close the skills gaps within your organization.


4 diapositivas
Case Analysis for Executive Decision Making Presentation
Guide stakeholders through data-driven insights with the Case Analysis for Executive Decision Making Presentation. This layout uses a clear upward progression with labeled steps to showcase milestones, challenges, or strategic outcomes—perfect for leadership meetings or high-level reviews. Fully customizable in PowerPoint, Keynote, and Google Slides.


4 diapositivas
Commonly Asked Questions Analysis Presentation
Simplify and clarify key topics using this FAQ-style layout, ideal for addressing top customer or stakeholder questions. With a clean lightbulb design and three-part structure, this template keeps content digestible and professional. Fully editable in Canva, PowerPoint, or Google Slides—perfect for onboarding, reports, or support documentation.


6 diapositivas
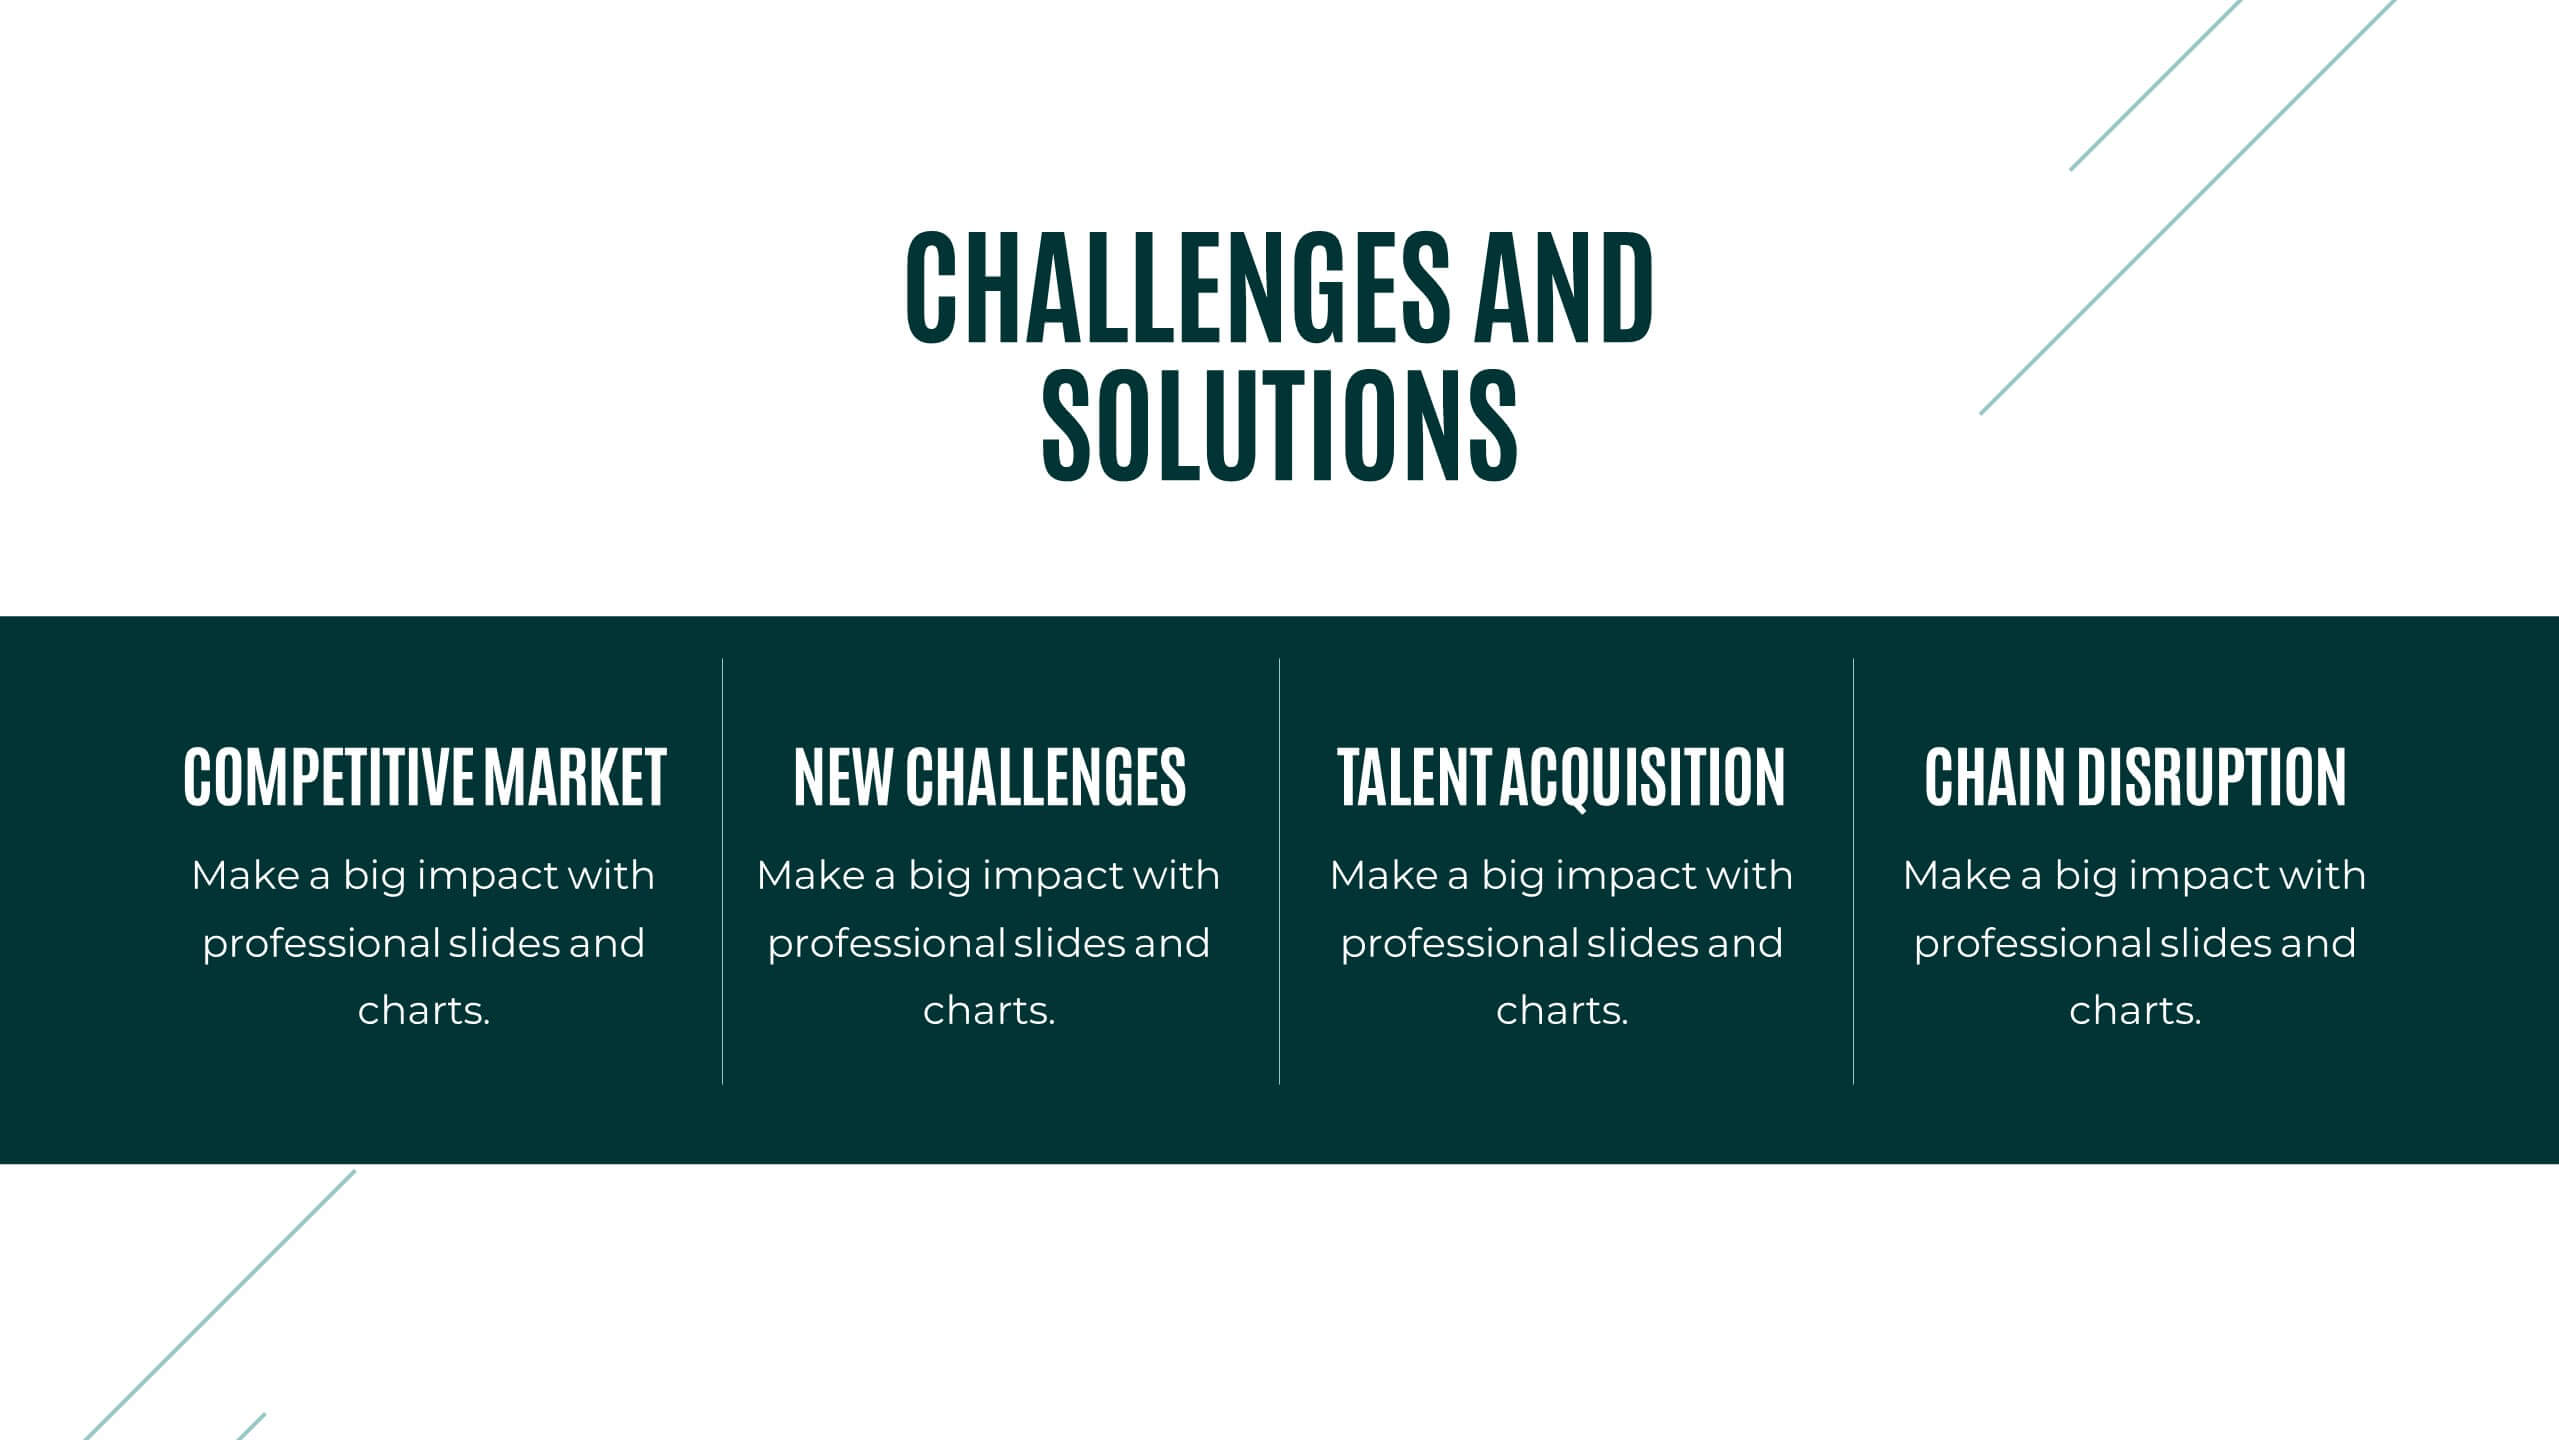
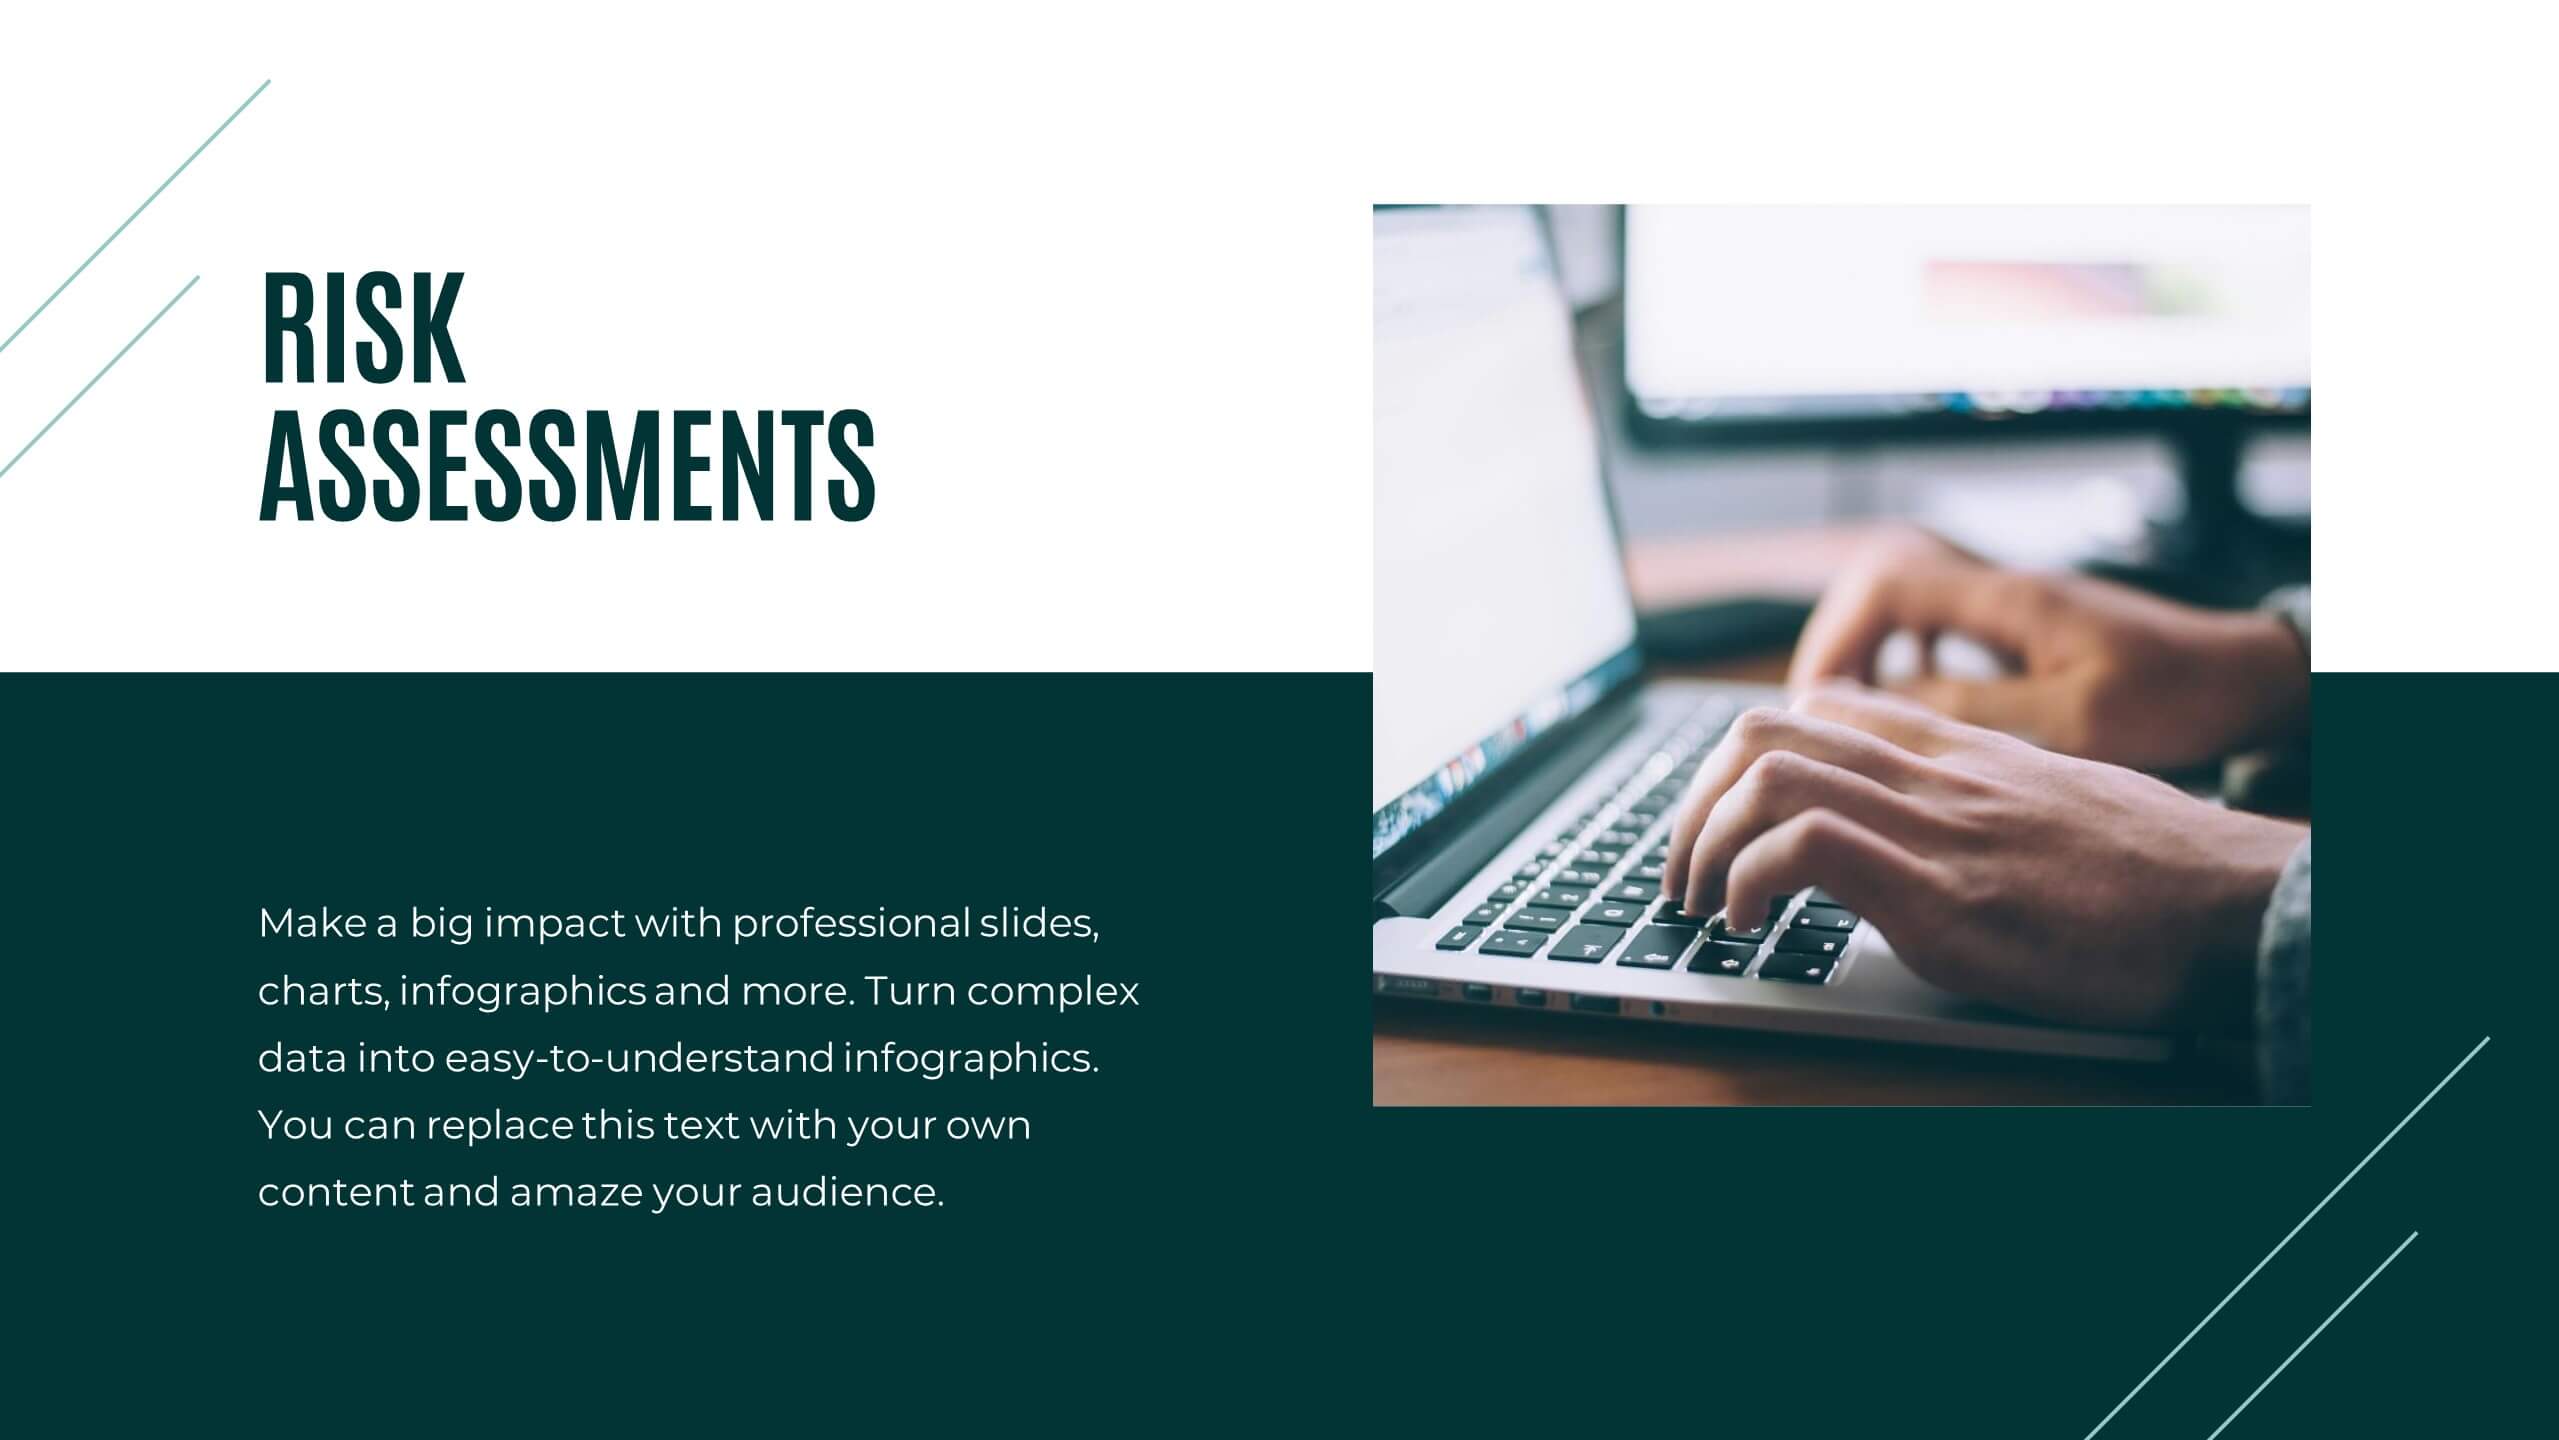
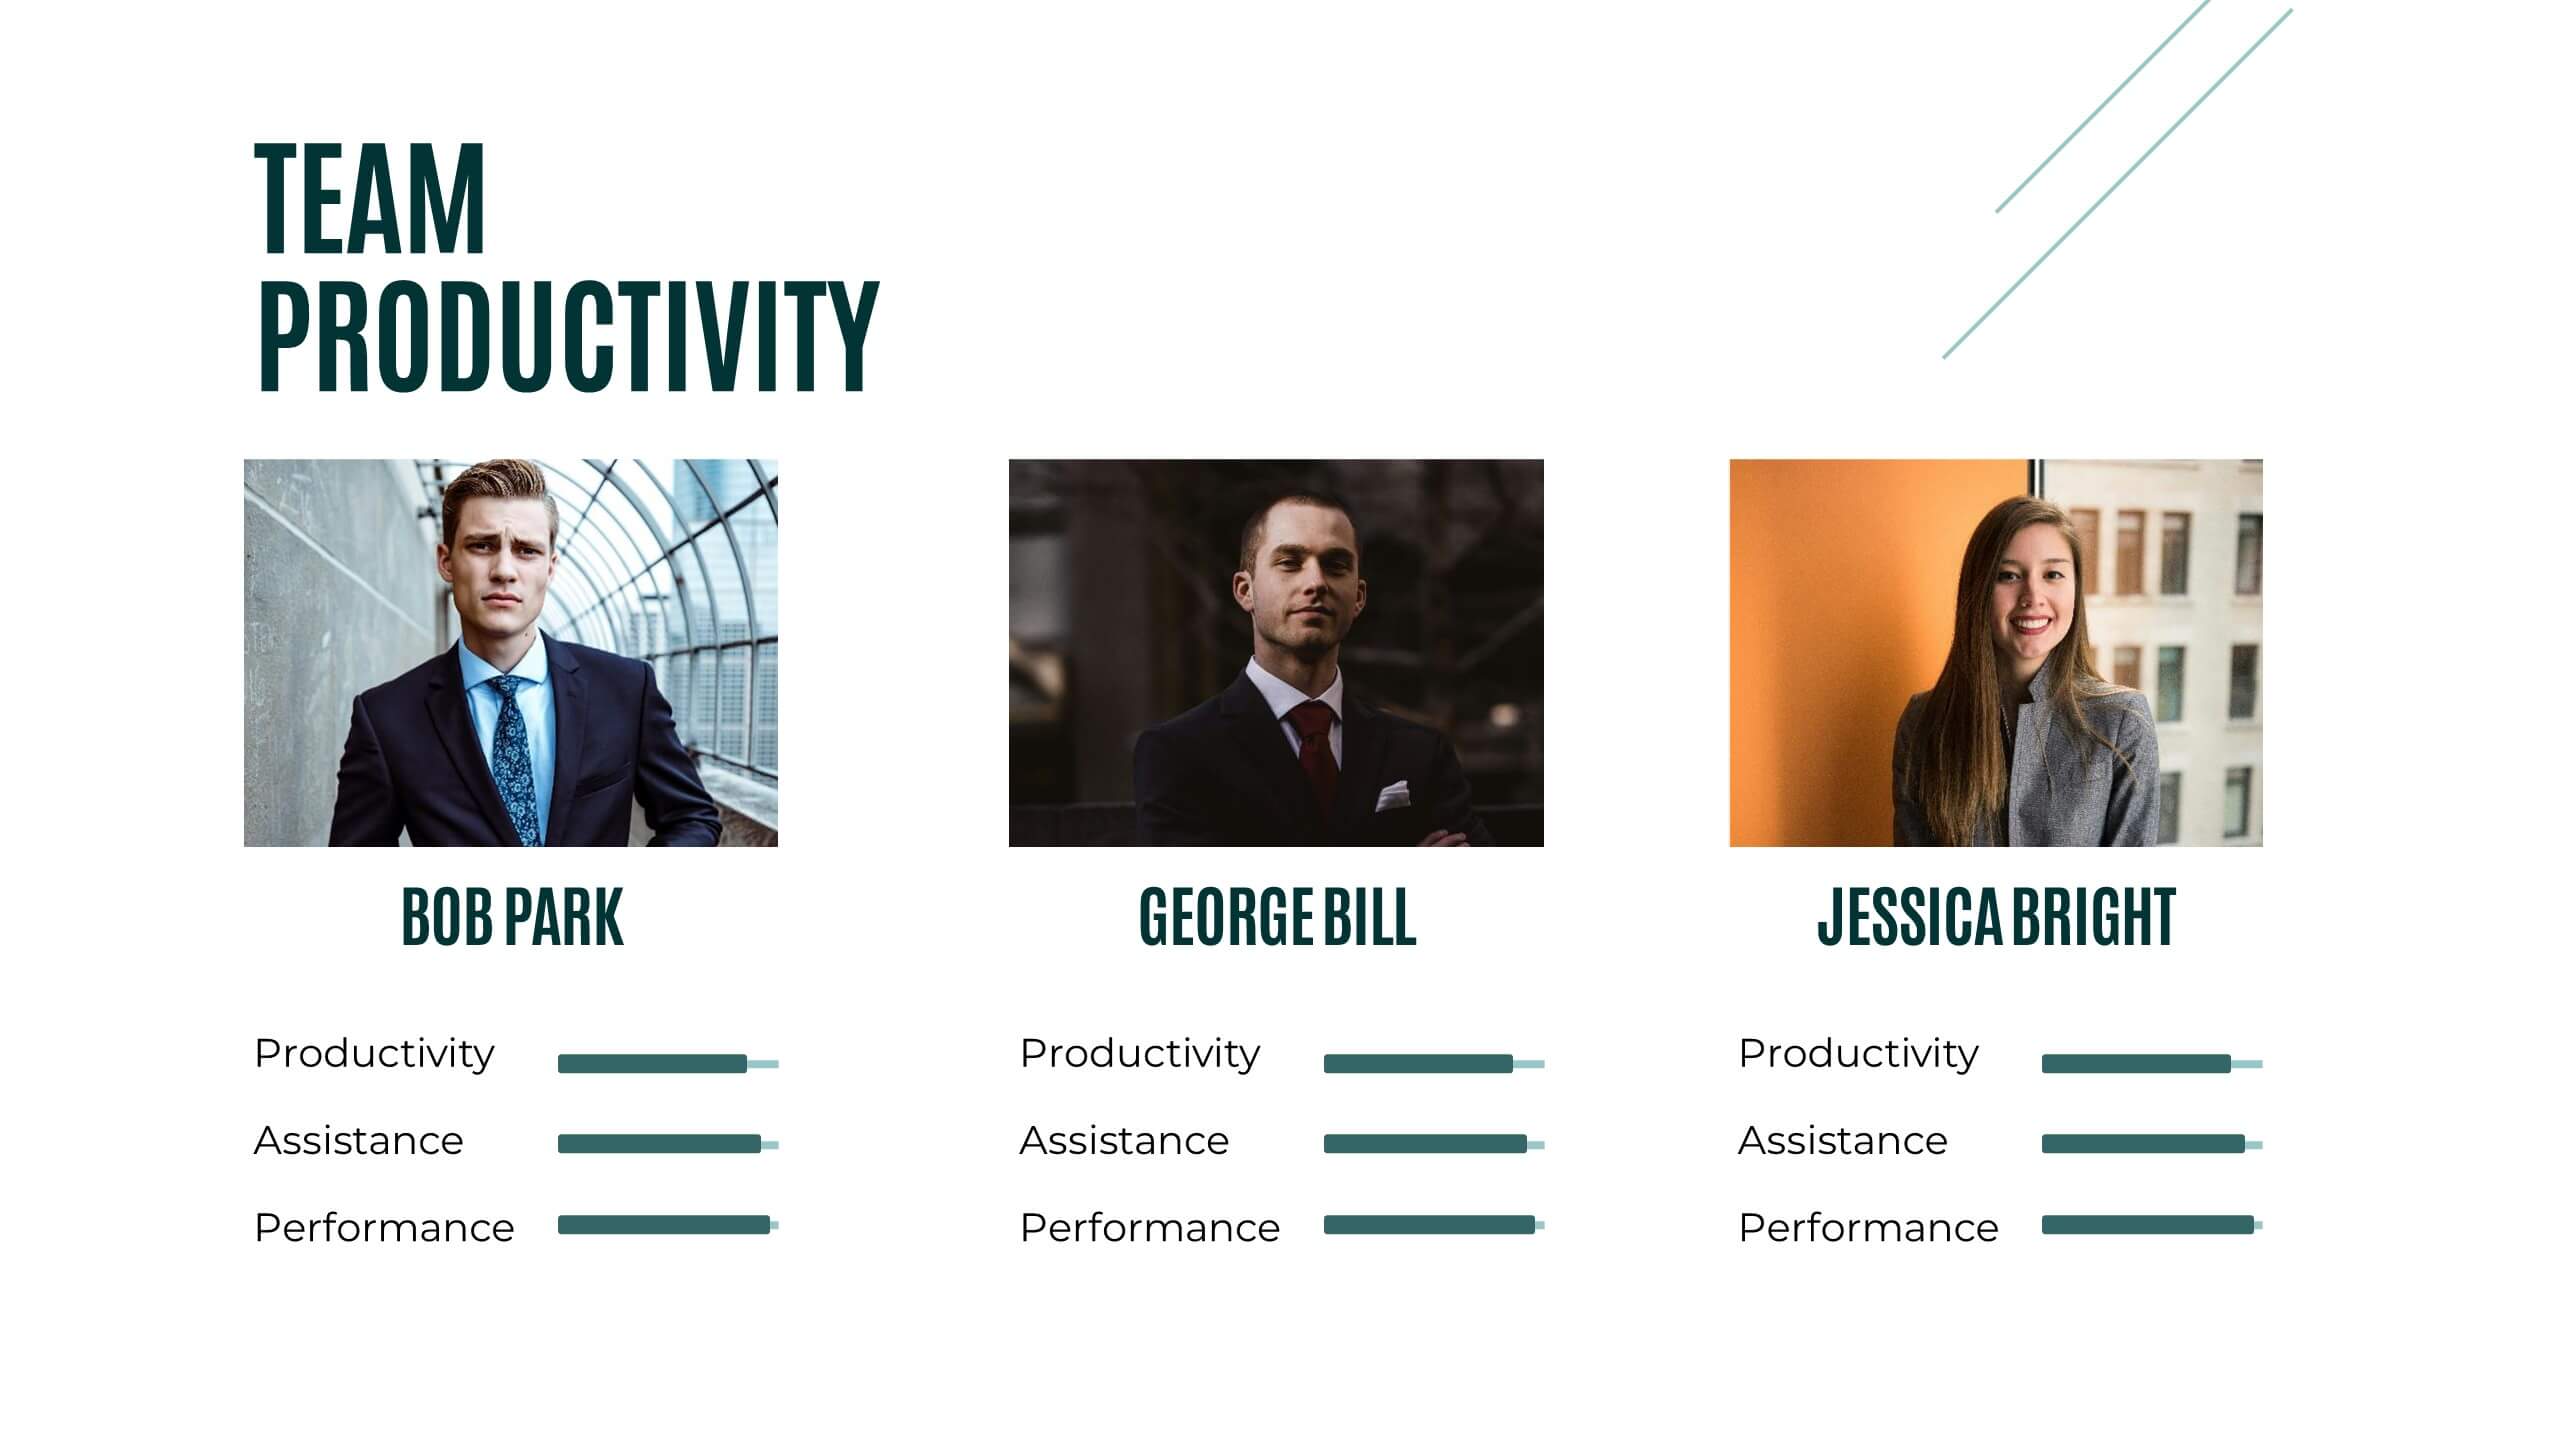
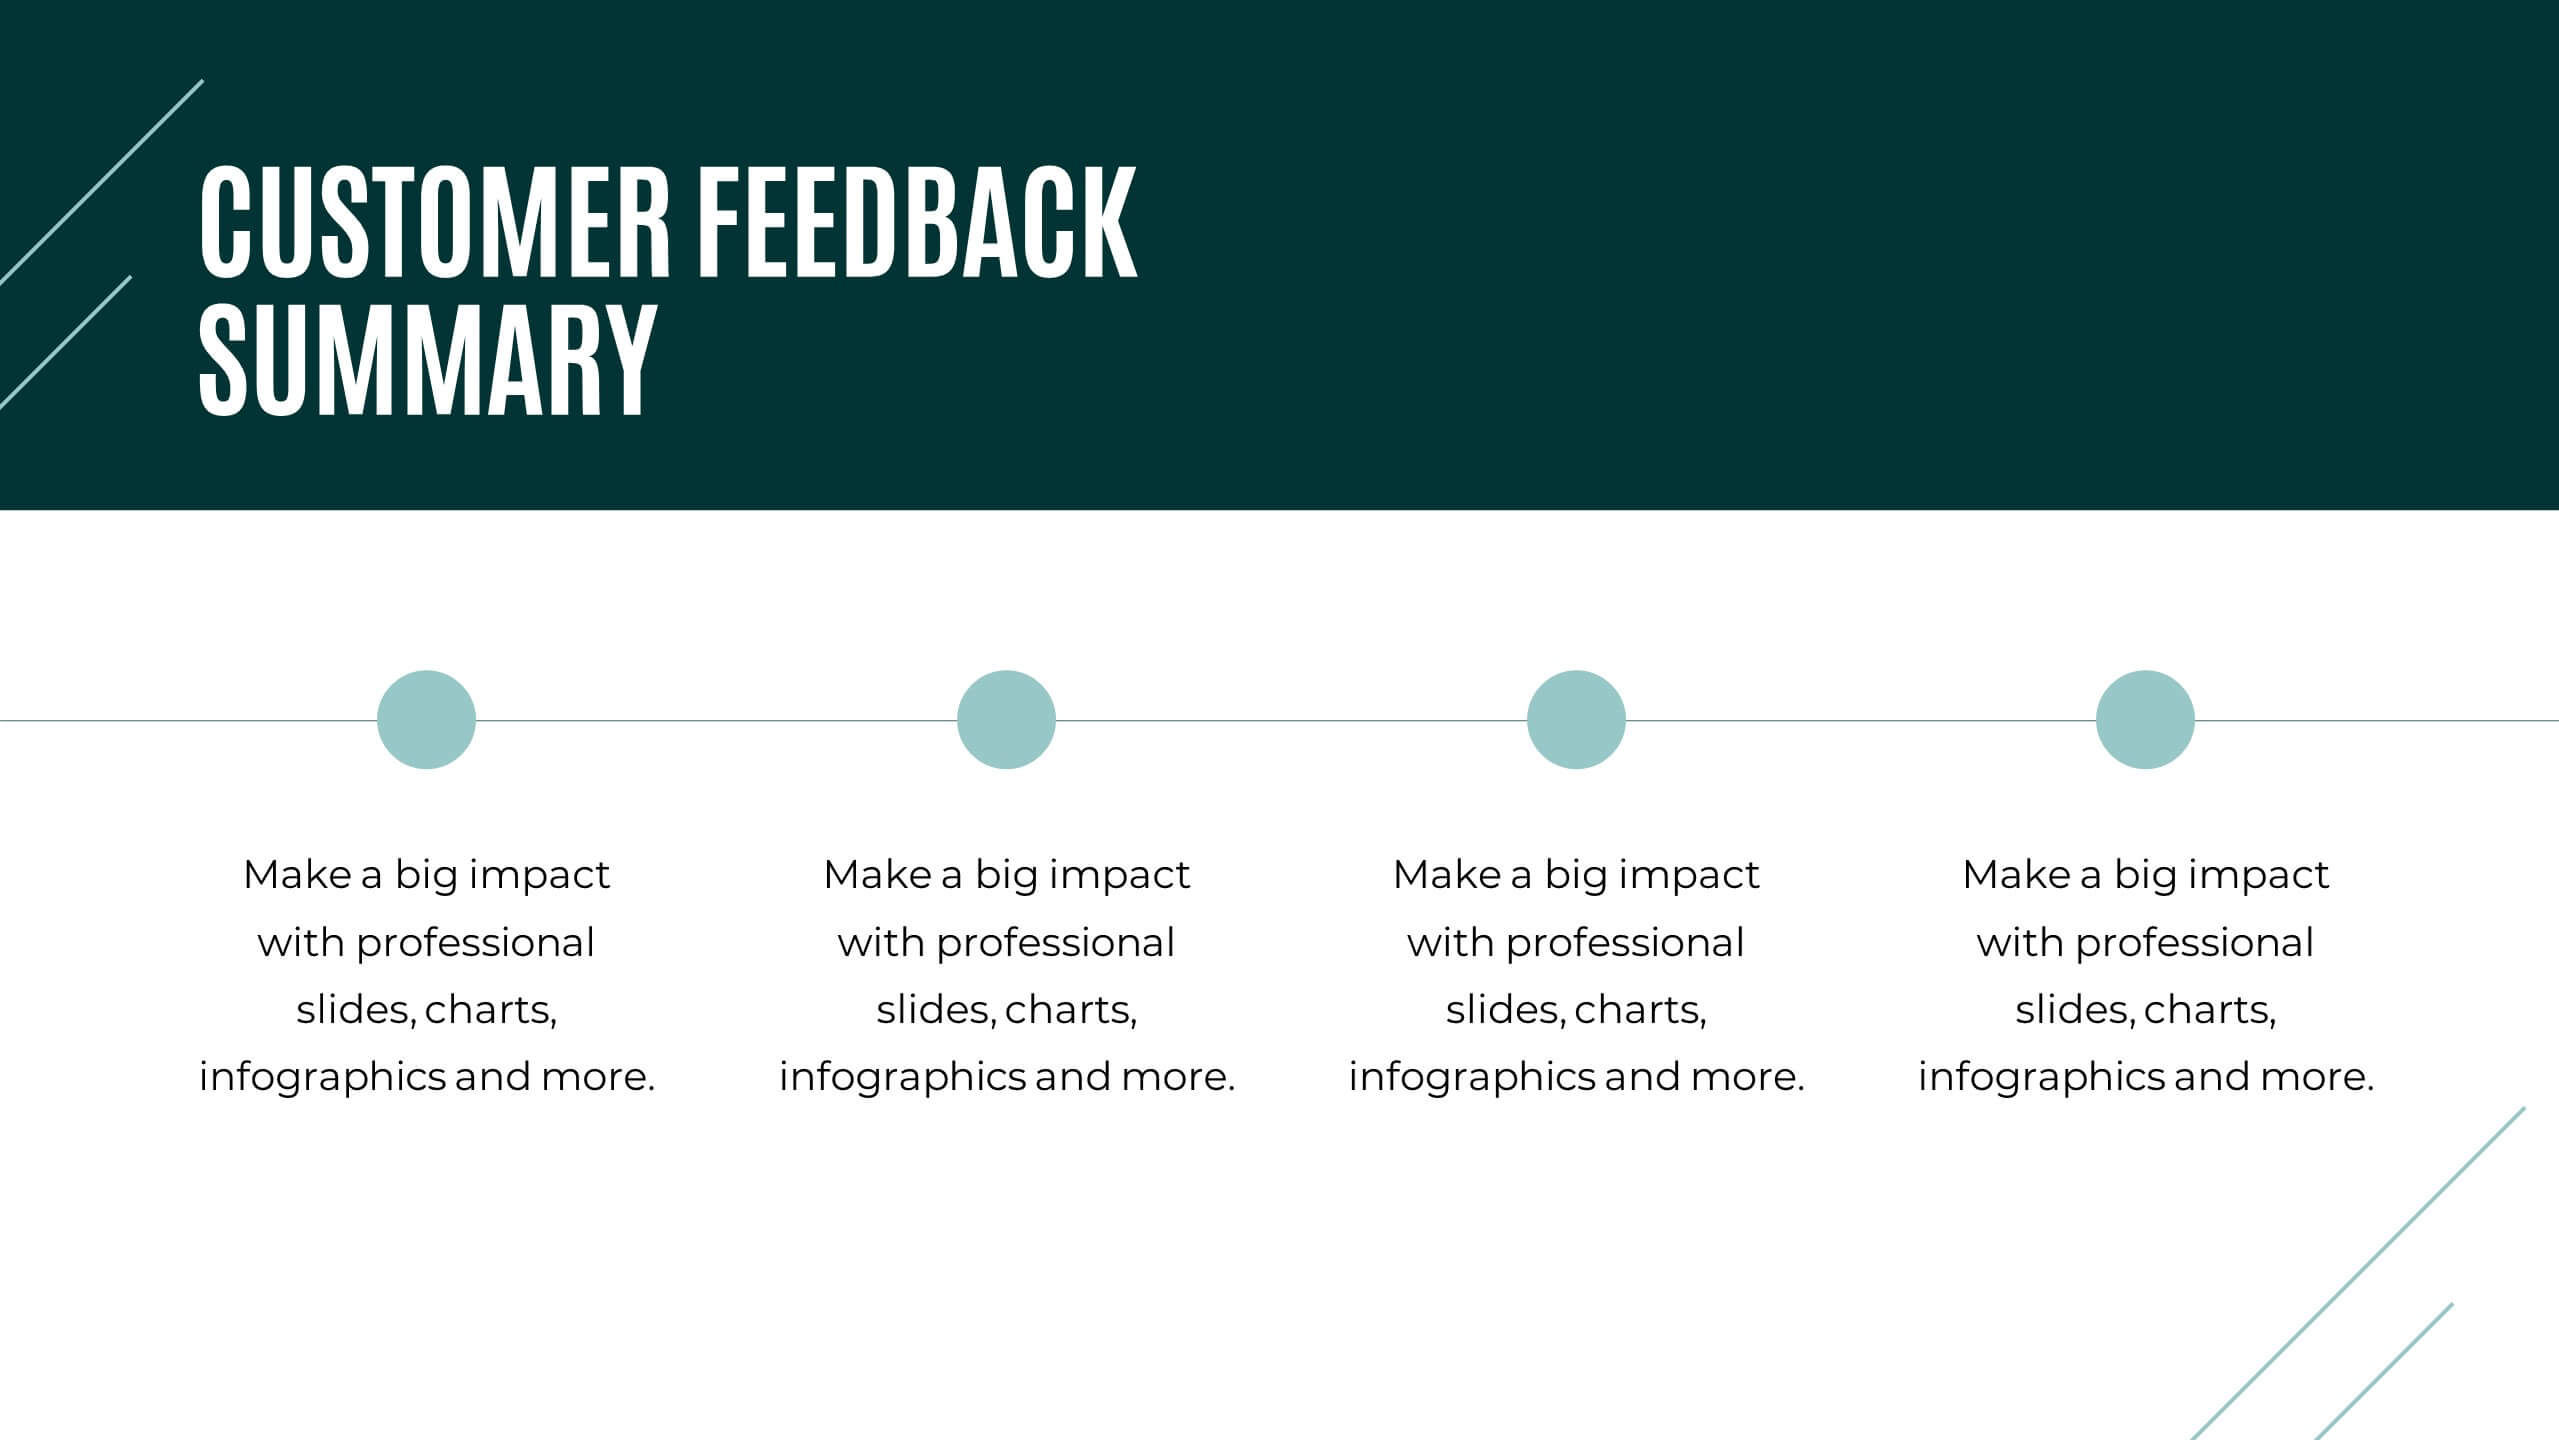
Supply Chain Management Strategy Presentation
Enhance your logistics planning with the Supply Chain Management Strategy template. This visually structured design simplifies key supply chain components, from procurement to distribution, making it ideal for analysts and operations teams. Fully customizable and compatible with PowerPoint, Keynote, and Google Slides for a seamless and professional presentation experience.


5 diapositivas
Human-Centered Design Thinking Strategy
Showcase empathy-driven innovation with the Human-Centered Design Thinking Strategy Presentation. This slide visually emphasizes user-focused thinking by combining a head silhouette with colorful puzzle icons representing each strategic step. Ideal for UX strategy meetings, product development pitches, and innovation workshops, it includes five editable segments labeled A to E, each with matching text fields to explain your core insights or process stages. Compatible with PowerPoint, Keynote, and Google Slides for seamless editing and presentation.


2 diapositivas
Startup Company Illustrations
Ignite your startup spirit with our startup company illustrations pack! These are an exhilarating collection of visuals designed to infuse your presentations with the electrifying energy of new beginnings and innovation. Fully compatible with Powerpoint, Keynote, and Google Slides. Get ready to turbocharge your designs with the infectious excitement of startup culture. Infuse your designs with the boundless possibilities of the startup universe—download our startup company illustrations pack today!


5 diapositivas
South America Location Map Slide Presentation
Highlight your business reach or project data across South America with a clean, professional map layout. This design is perfect for showcasing key locations, regional metrics, or market insights in a visually engaging way. Fully compatible with PowerPoint, Keynote, and Google Slides for effortless customization and presentation.


6 diapositivas
Porter's Five Forces Strategy Presentation
Give your competitive analysis a bold, intuitive flow with a clean layout that visually breaks down each force in a simple, strategic way. This presentation helps you highlight market pressures, evaluate risks, and support smarter decision-making with clarity and confidence. Fully editable and compatible with PowerPoint, Keynote, and Google Slides.


5 diapositivas
Marketing Sales Funnel Presentation
Watch your customer journey come to life with a clean, visual flow that makes each stage easy to understand at a glance. This presentation breaks down your funnel into clear steps, helping you explain conversions, behaviors, and strategy with confidence. Fully compatible with PowerPoint, Keynote, and Google Slides.


7 diapositivas
Best Loyalty Program Infographic
A loyalty program is a structured marketing strategy designed to encourage customers to continue patronizing a business by offering them rewards, discounts, or other incentives based on their repeat purchases or engagement with the brand. This infographic template is a delightful and visually appealing guide to the world of rewarding loyalty. Dive into this vibrant infographic and discover how to spread happiness among your cherished customers through a top-notch loyalty program. Compatible with Powerpoint, Keynote, and Google Slides. Celebrate loyalty and reward your customers in the most delightful way.


22 diapositivas
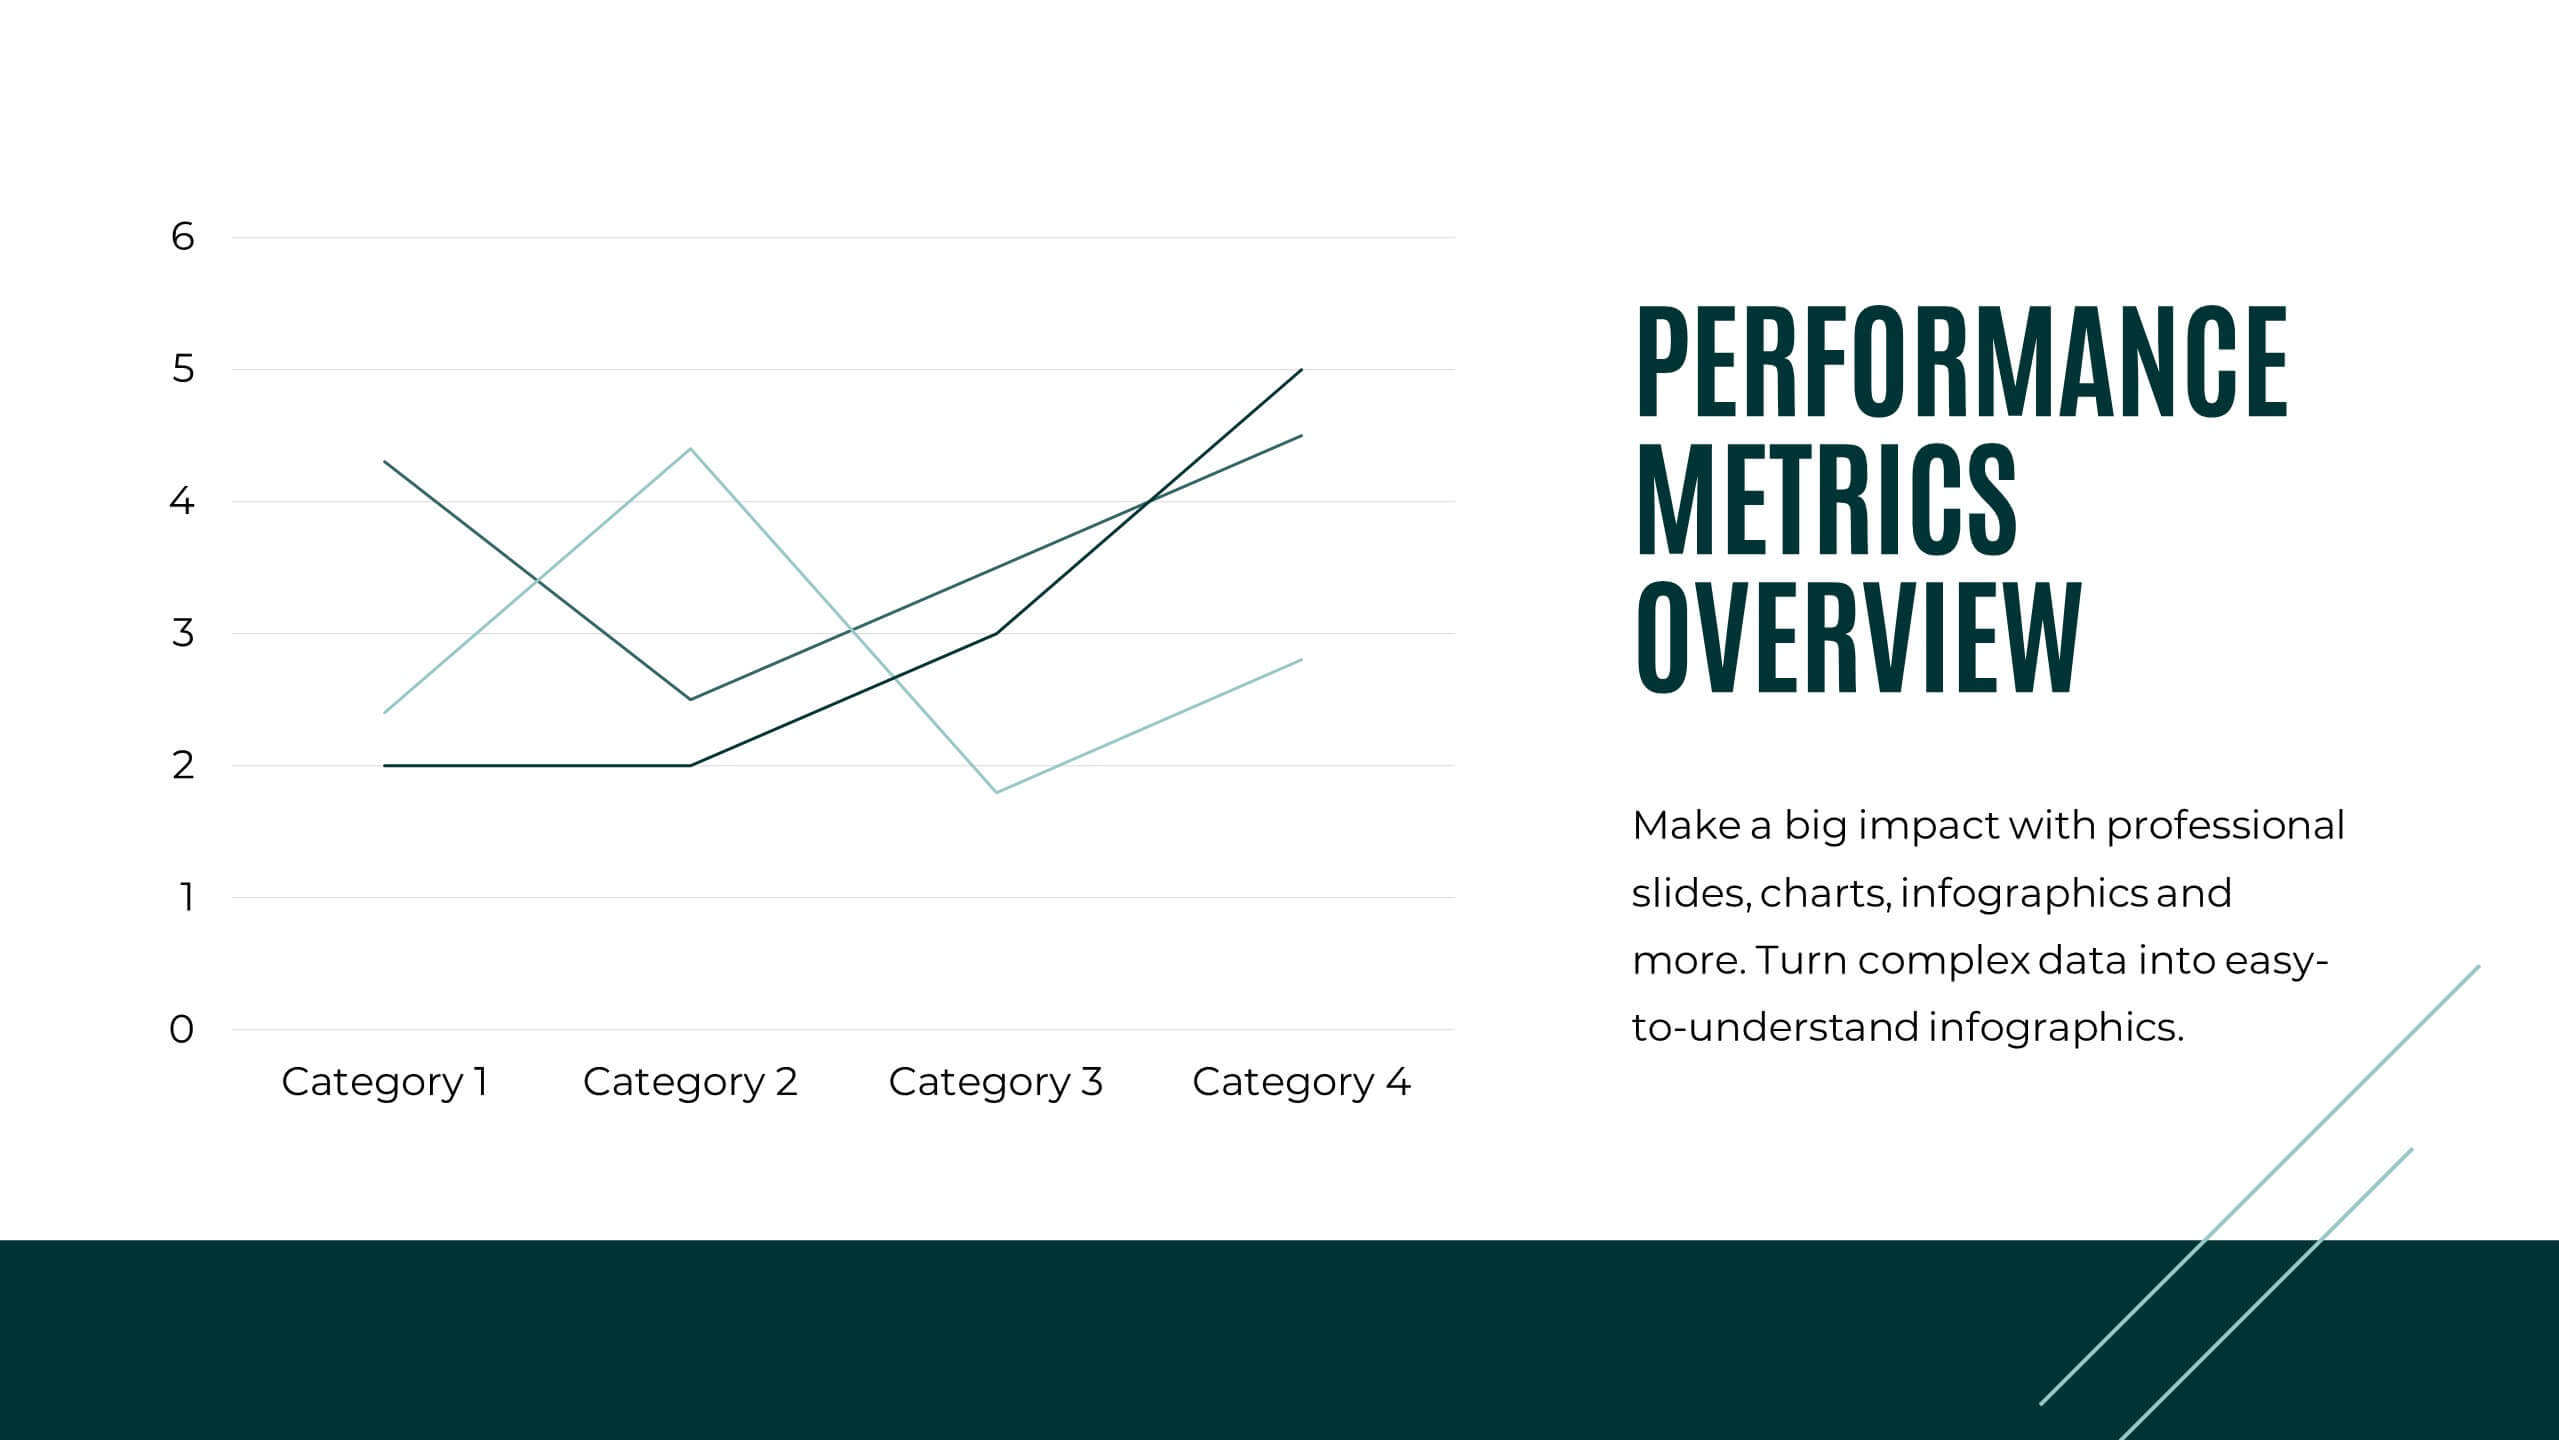
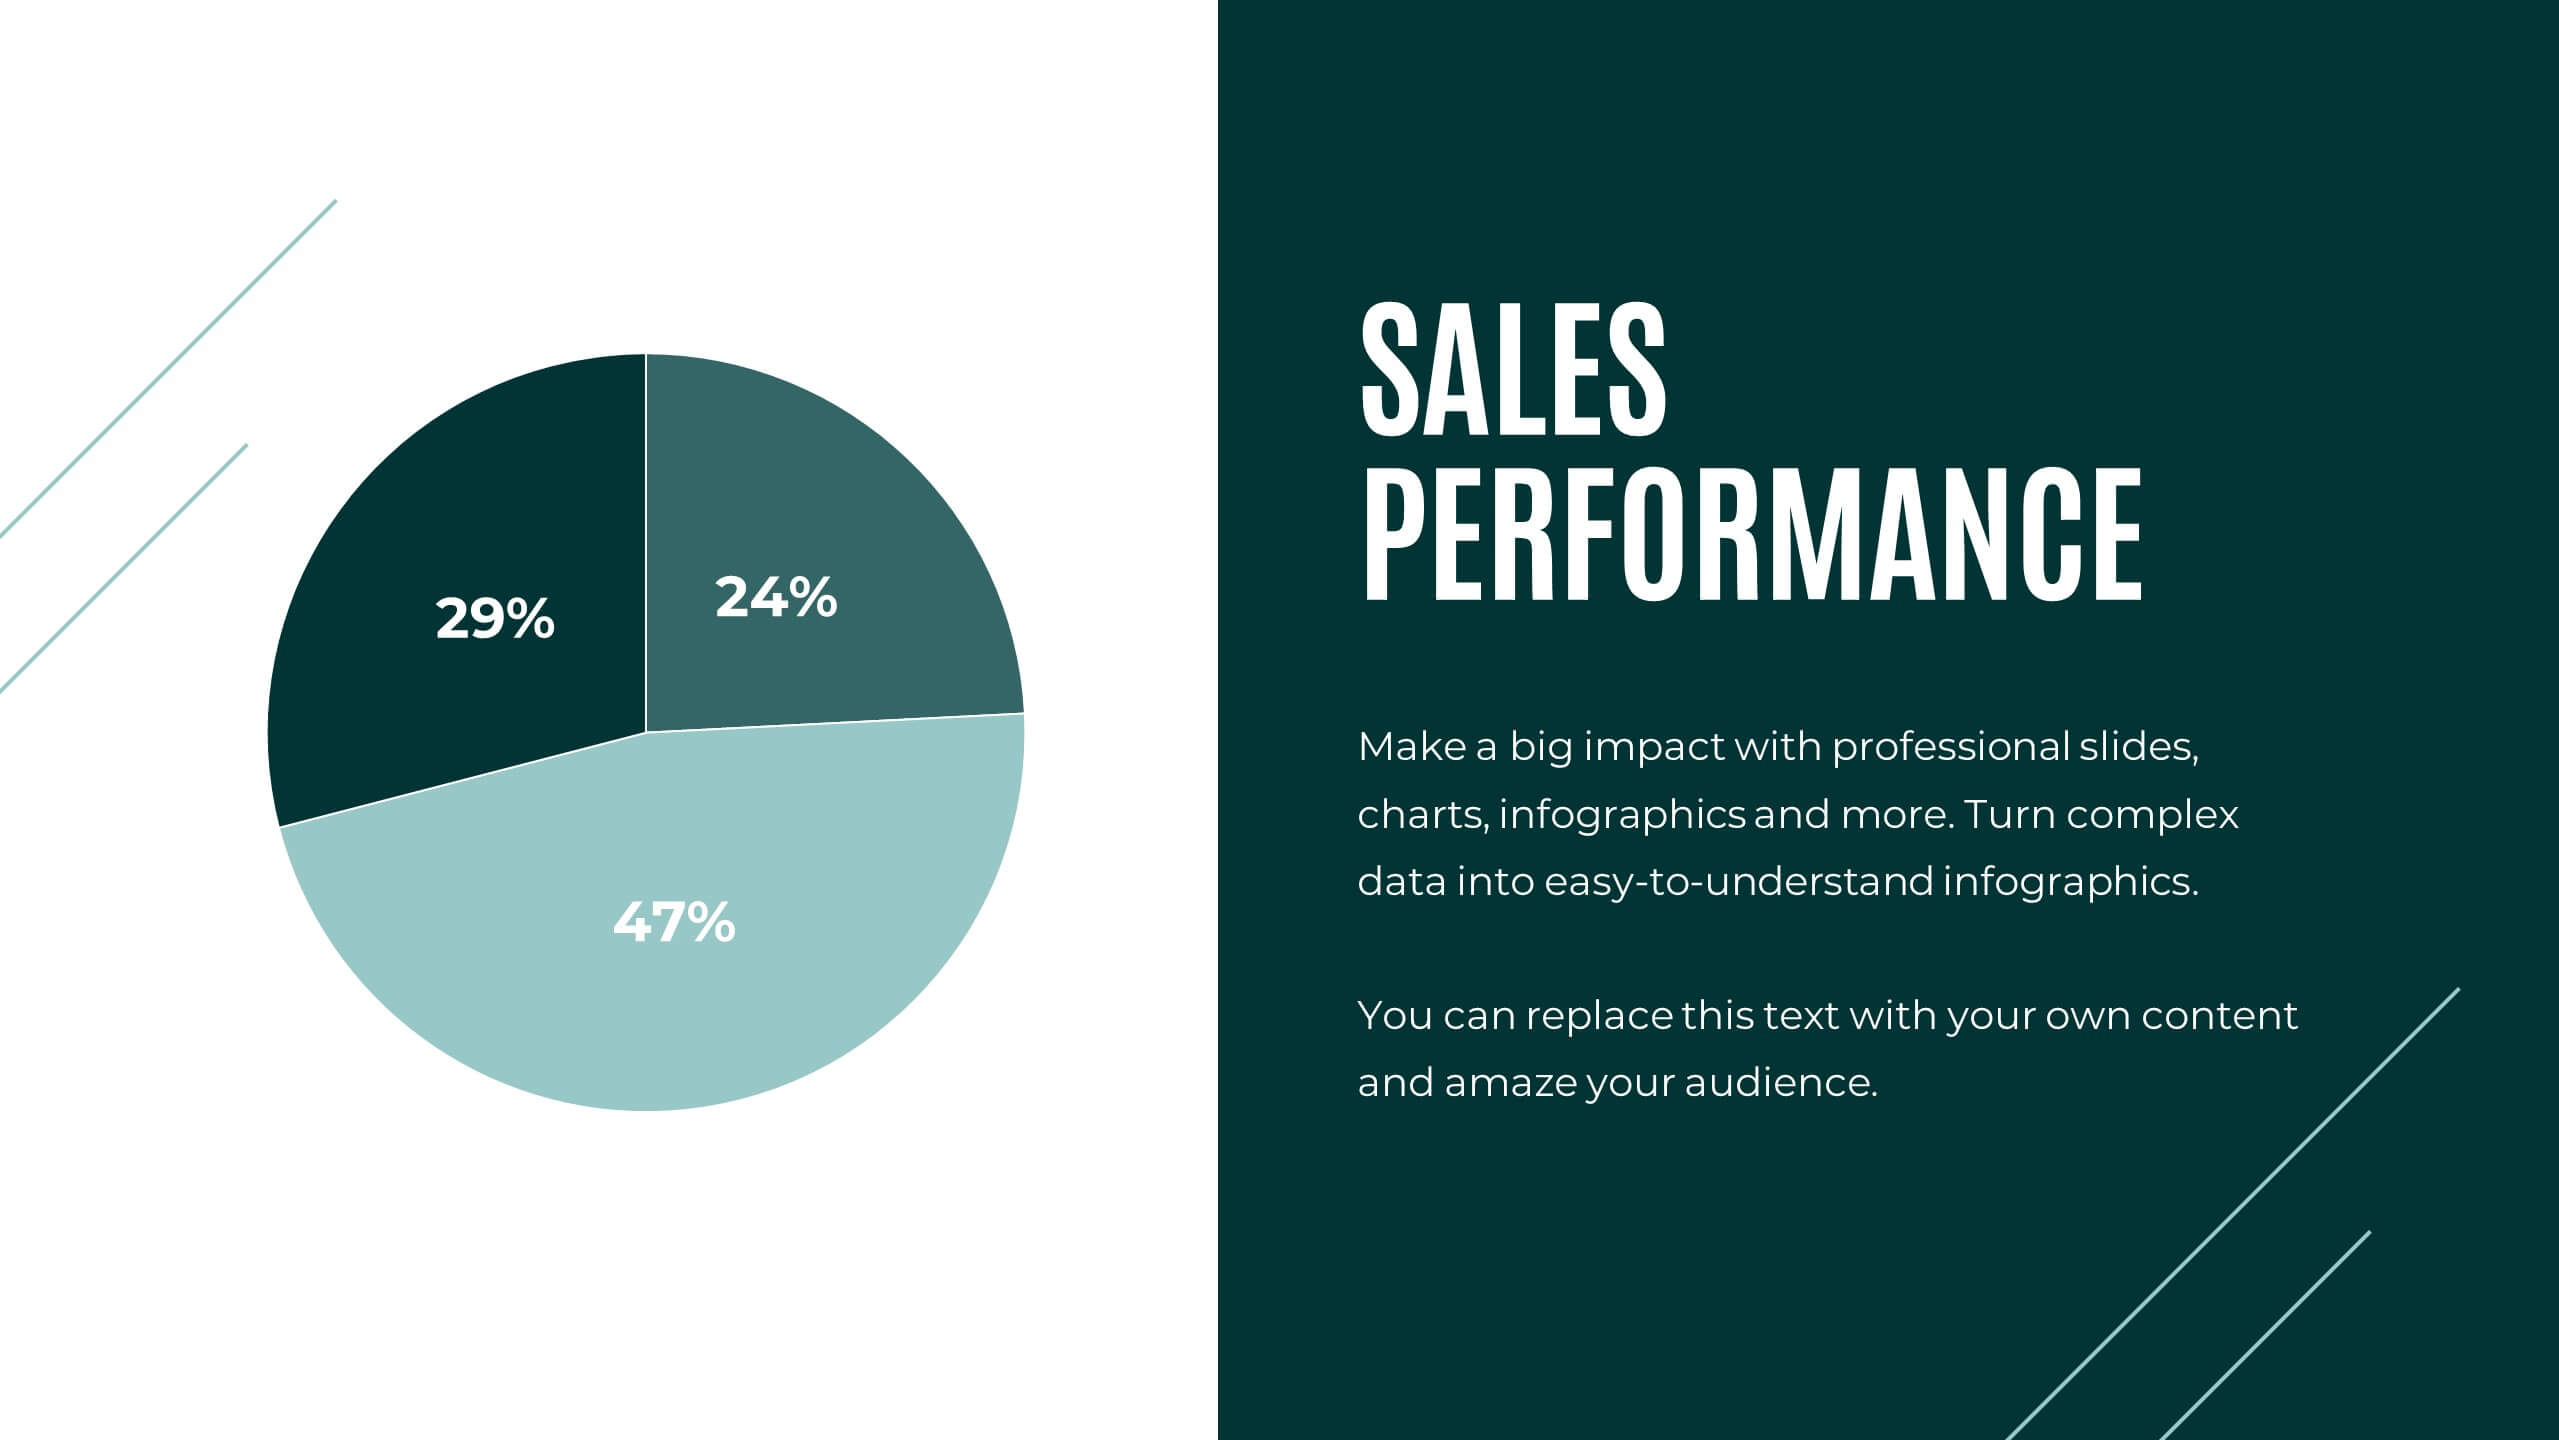
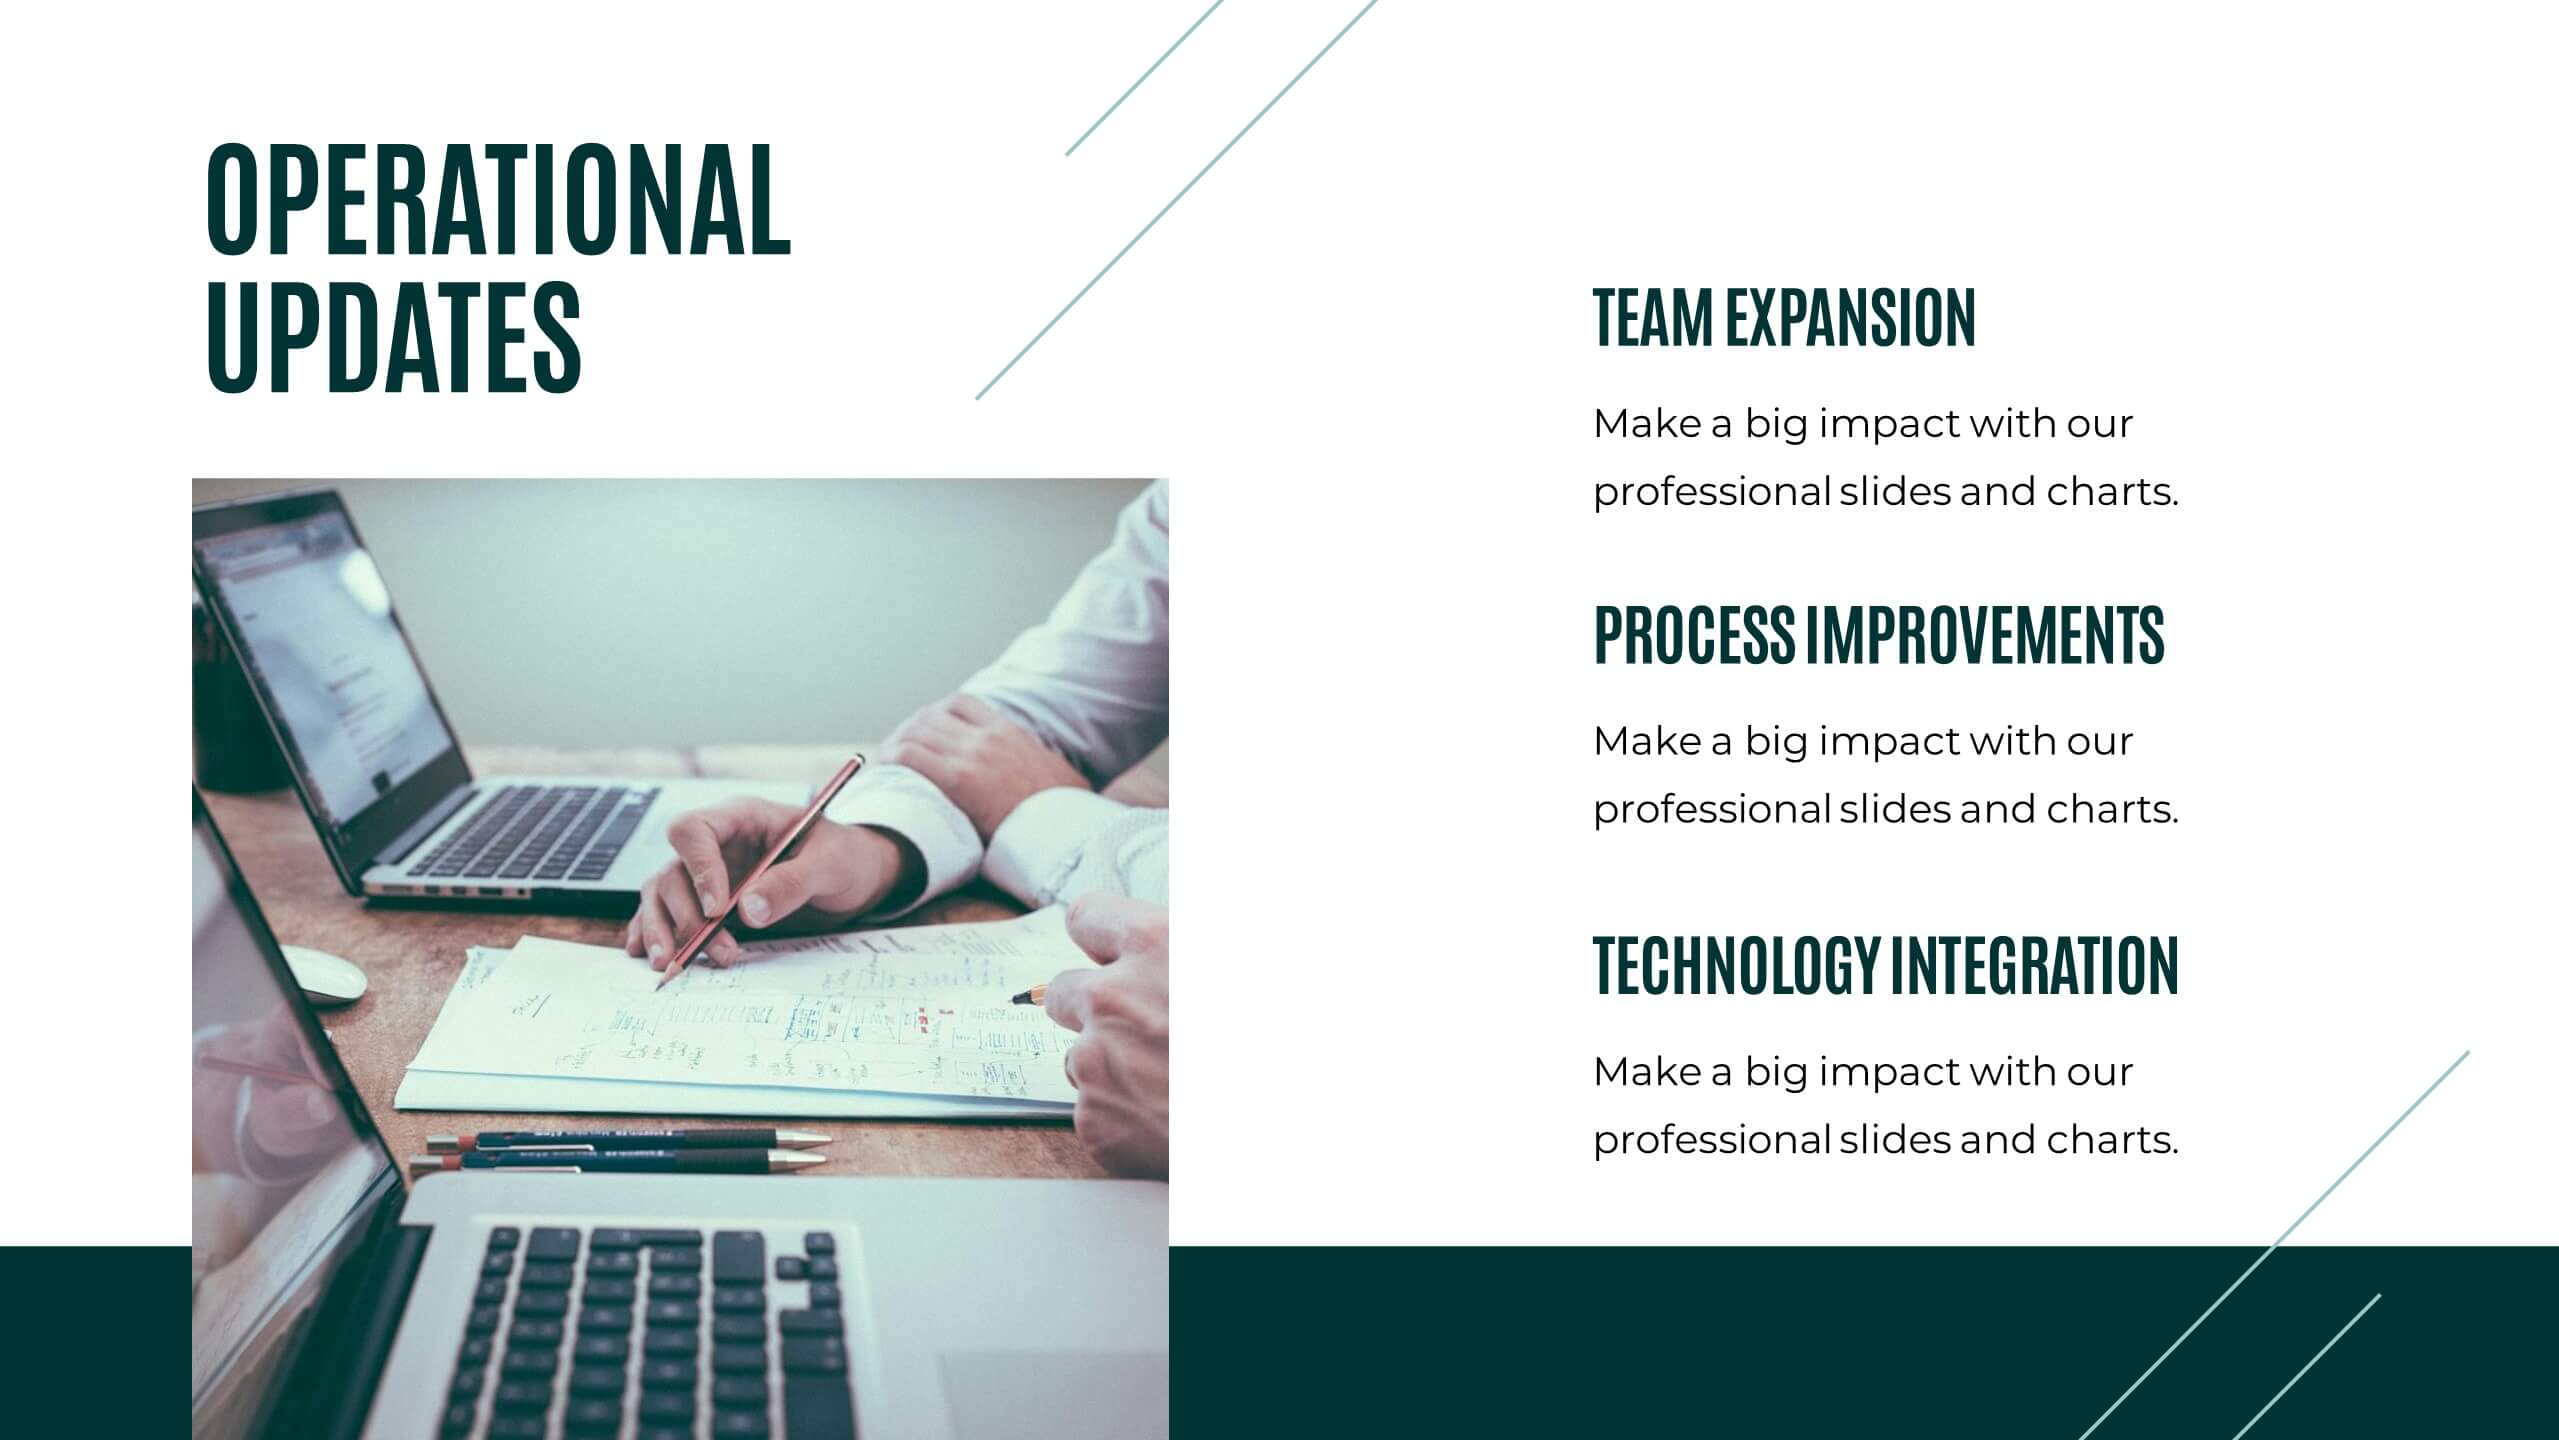
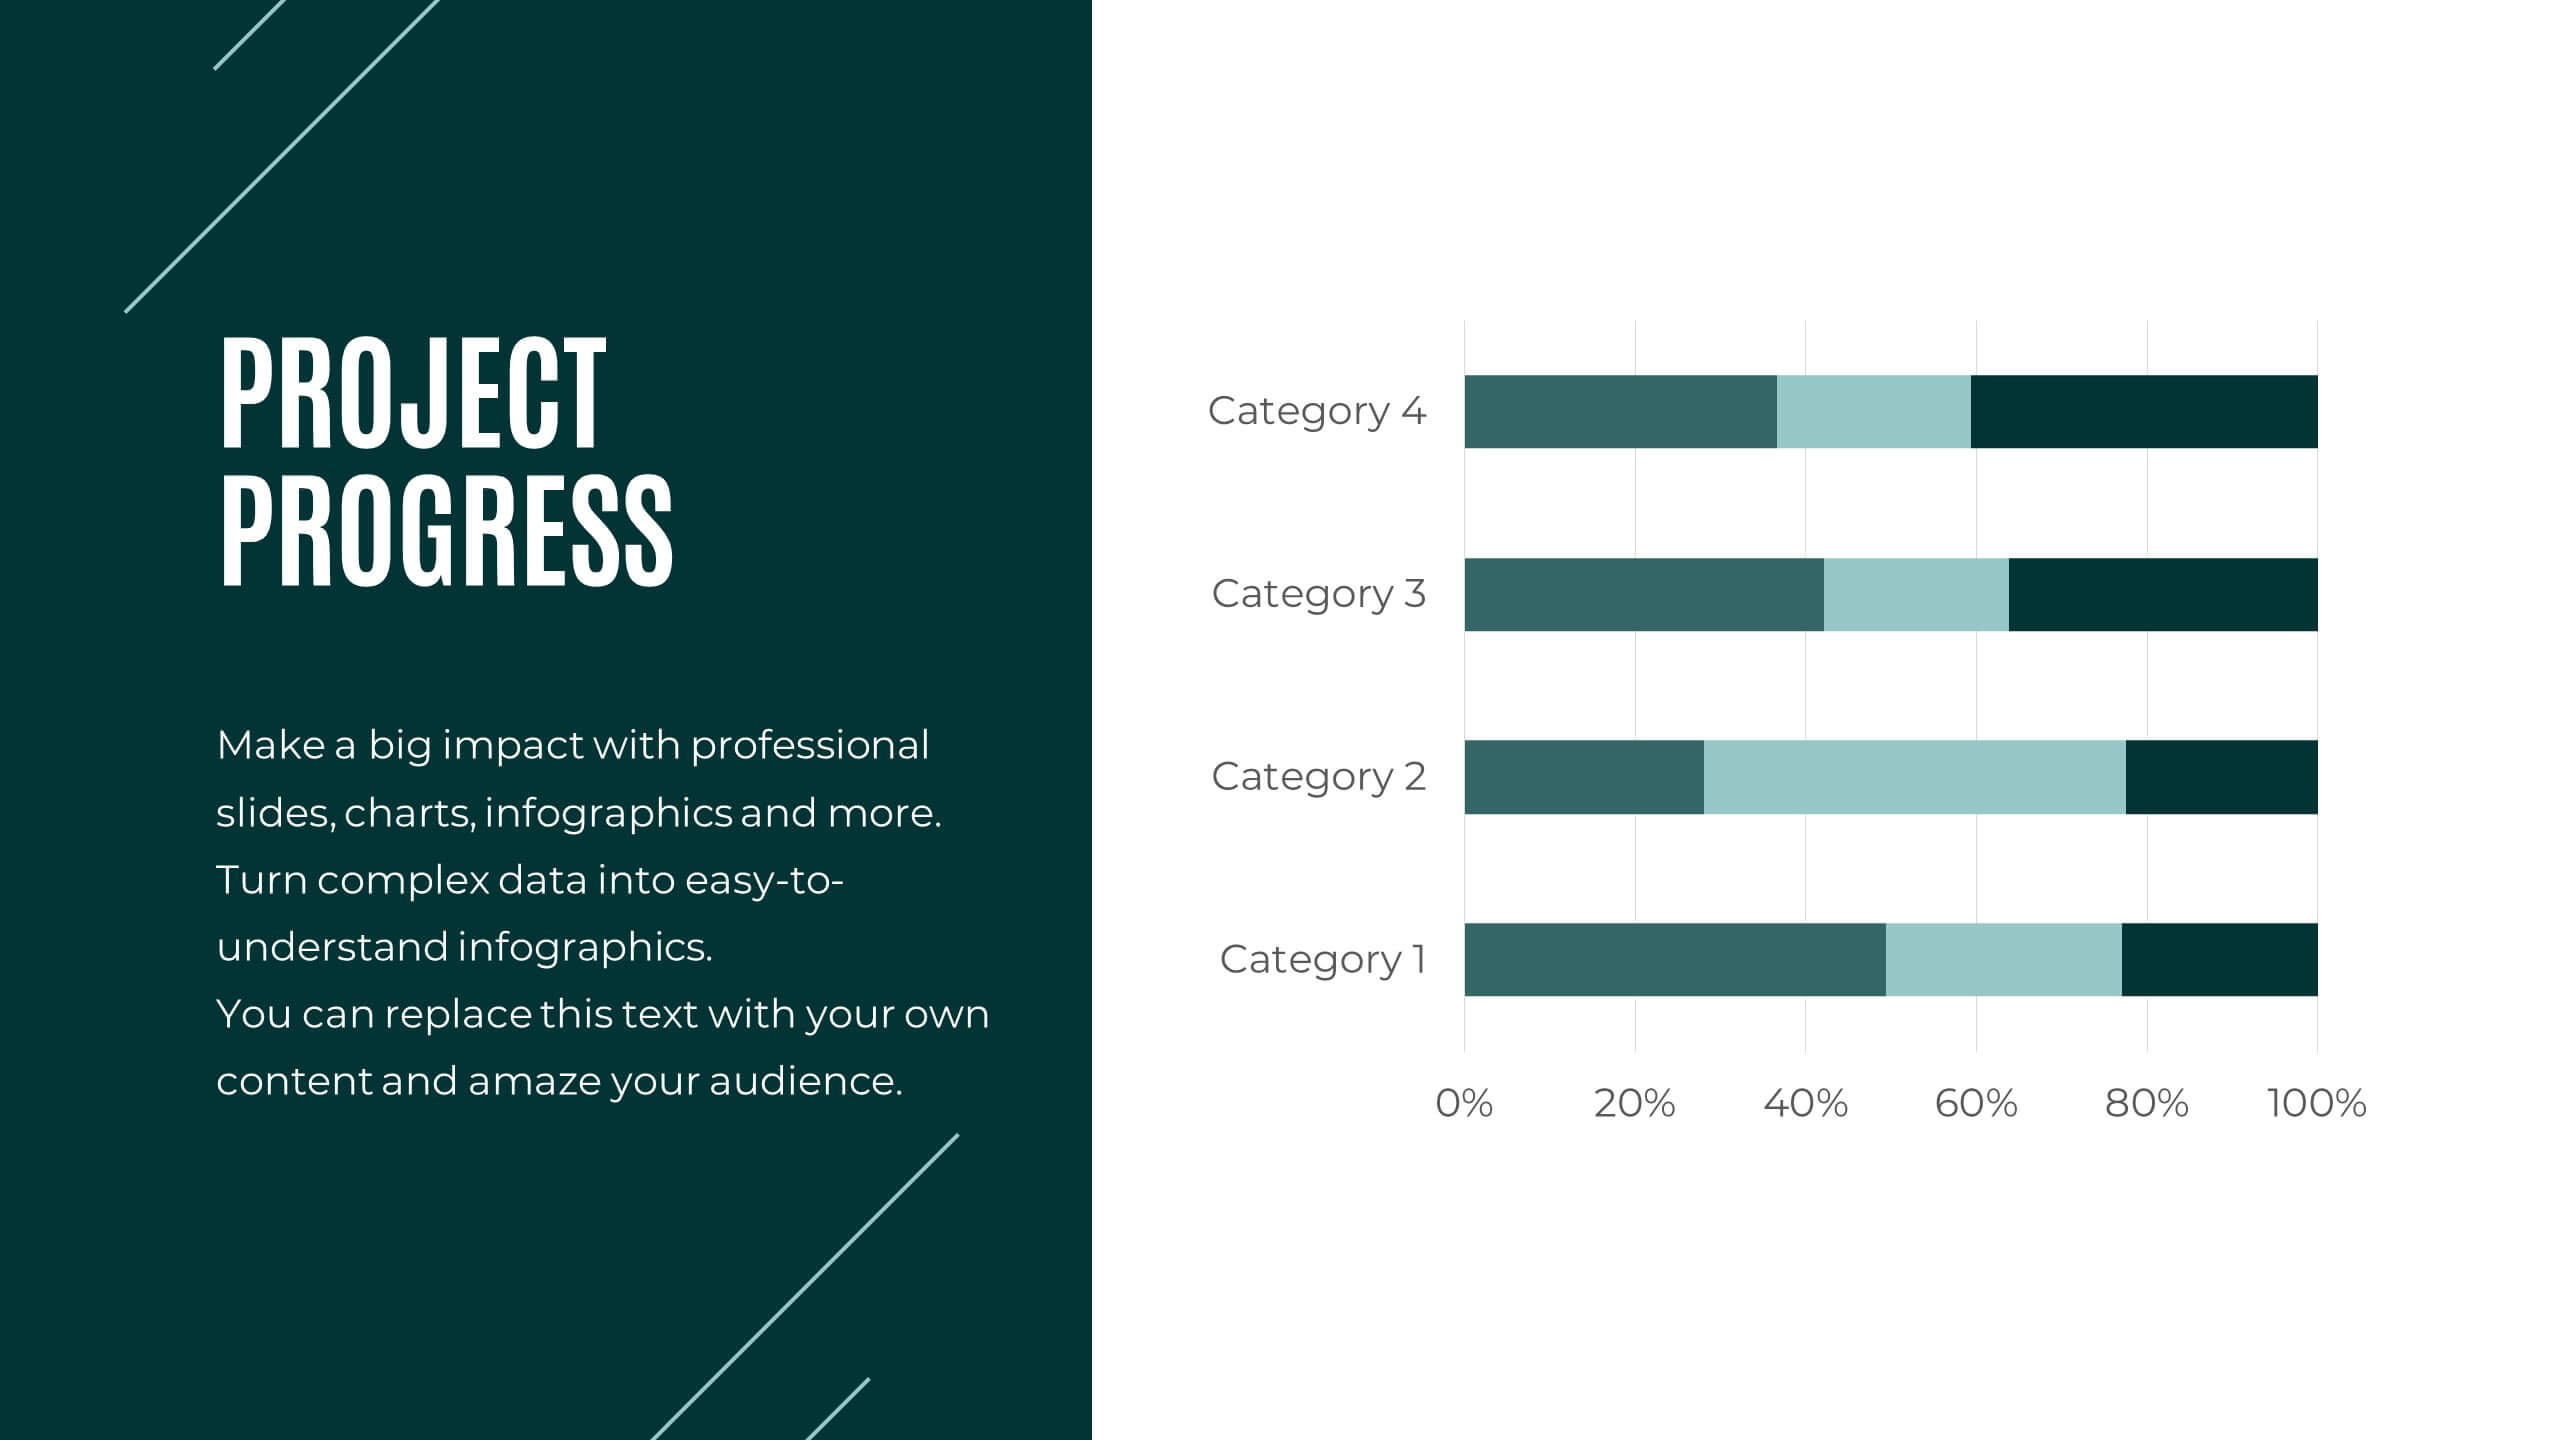
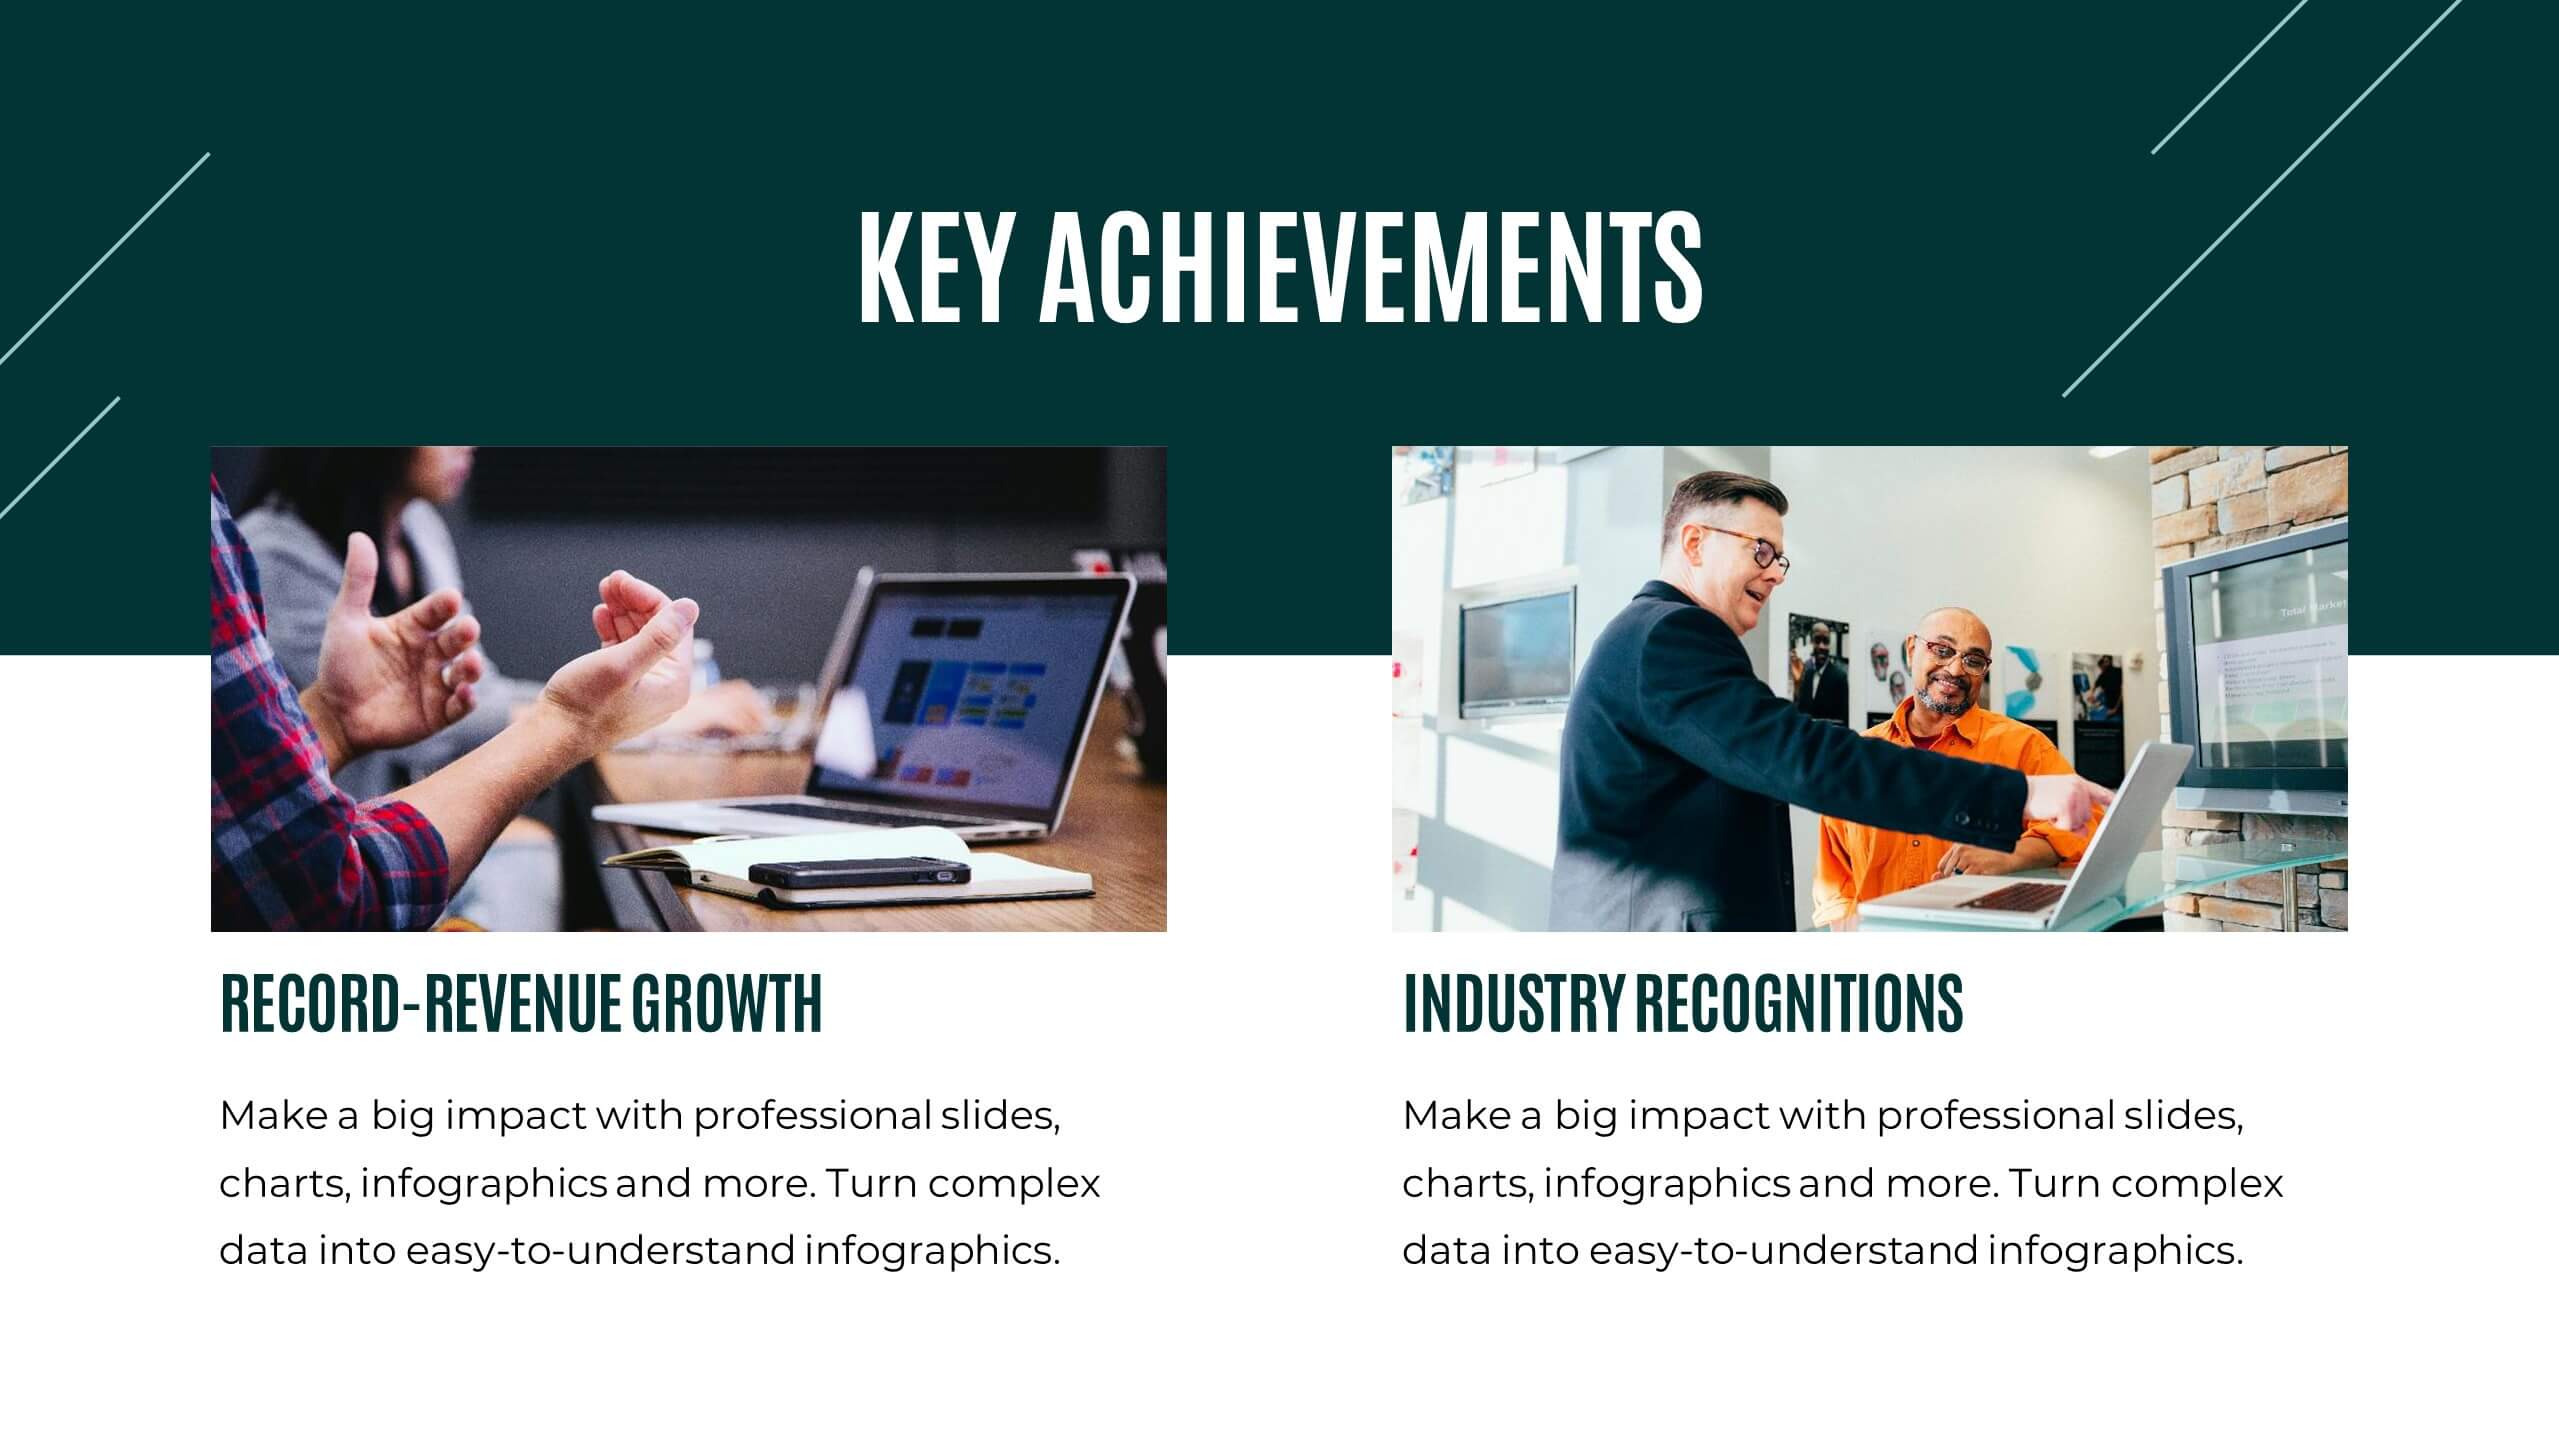
Prism Project Status Report Presentation
Deliver impactful updates with this comprehensive project status report template! Perfect for presenting key highlights, performance metrics, and strategic initiatives. Ideal for project managers aiming to keep stakeholders informed and aligned. Compatible with PowerPoint, Keynote, and Google Slides, this template ensures your reports are clear, professional, and engaging. Keep projects on track!


23 diapositivas
Ignifis Investor Pitch Presentation
Capture investor interest with this dynamic and professional pitch deck presentation template. It includes essential slides such as company overview, problem statement, revenue model, competitive landscape, financials, and growth projections. Designed for clarity and impact, it's fully customizable and perfect for securing funding. Compatible with PowerPoint, Keynote, and Google Slides.


2 diapositivas
Startup Company Profile Introduction Presentation
Make a bold first impression with the Startup Company Profile Introduction Presentation. This modern, vibrant layout is perfect for introducing your startup’s mission, values, and services. With eye-catching visuals and clean structure, it’s fully customizable in Canva, PowerPoint, or Google Slides—making it easy to tailor for pitches or internal use.


5 diapositivas
Benefits of Good Nutrition Infographics
Good Nutrition is crucial for overall health, disease prevention, weight management, mental well-being, energy levels, and various other aspects of our physical and mental health. These vertical infographic templates can be used to present the importance and advantages of maintaining a healthy and balanced diet. These are designed to educate and inspire individuals to make informed choices about their nutrition and overall well-being. Perfect for educational presentations, nutrition workshops, wellness programs, or health-related websites, these templates provide valuable information and visual aids to promote better nutrition choices.


6 diapositivas
Commercial Agriculture Infographics
Explore the world of Commercial Agriculture with our customizable infographic template. This template is fully compatible with popular presentation software like PowerPoint, Keynote, and Google Slides, allowing you to easily customize it to illustrate and communicate various aspects of commercial agriculture. The Commercial Agriculture infographic template offers a visually engaging platform to explore and explain the practices, trends, and challenges in modern agriculture for commercial purposes. Whether you're a farmer, agricultural professional, student, or simply interested in food production and sustainability, this template provides a user-friendly canvas to create informative presentations and educational materials. Deepen your understanding of Commercial Agriculture with this SEO-optimized infographic template, thoughtfully designed for clarity and ease of use. Customize it to highlight key agricultural practices, technologies, crop management, and the importance of sustainable farming, ensuring that your audience gains valuable insights into this vital industry. Start crafting your personalized infographic today to explore the world of Commercial Agriculture.