


Características


¿Tienes alguna pregunta?
Recomendar


6 diapositivas
Creative Cycle Diagram Presentation
Illustrate processes and workflows effectively with this Creative Cycle Diagram. Designed for business, strategy, and creative projects, this fully editable diagram helps visualize cyclical processes with clarity. Customize text, colors, and elements to align with your brand. Compatible with PowerPoint, Keynote, and Google Slides for seamless integration.


4 diapositivas
Communication Model and Channels Presentation
Illustrate how your messages move through various channels using this clean, visual communication model slide. Ideal for team briefings, marketing workflows, or internal training, it simplifies how information is shared across platforms. Fully editable in Canva, PowerPoint, and Google Slides for seamless customization to match your branding and messaging goals.


6 diapositivas
Credit Card Features Overview Presentation
Bring your audience into the world of smart spending with a clean, visual layout that explains key credit card features in a simple, engaging way. This presentation helps you break down benefits, terms, and essential details with clarity and confidence. Fully editable and compatible with PowerPoint, Keynote, and Google Slides.


7 diapositivas
Asia Map Infographic Presentation Template
Asia is the largest, most populous, and most culturally diverse continent. Asia constitutes of nearly one-third of Earth's landmass and is lying entirely north of the equator. The continent is home to a variety of cultures, ethnic groups, and religions. This Asian map template includes the different labeled countries, and graphs with statistics. This can be used to show your audience the geographical layout of Asia, or as an example of what a modern, professional presentation should look like. This template is a great resource for students, teachers and people who want to learn more about Asia.


6 diapositivas
Customer Support Team Infographic
The set of slides presented is meticulously designed to encapsulate the essence of customer support team operations, highlighting various key aspects such as teamwork, communication channels, customer interaction points, and support strategies. Each slide utilizes a clean and professional design, integrating soft color palettes and structured layouts to clearly convey complex information in an accessible way. These slides are particularly useful for customer support teams looking to present or revamp their strategy, showcasing how they handle customer queries and feedback across different platforms. The visual elements such as graphs, hierarchical diagrams, and process flows are strategically used to illustrate the team’s structure, response processes, and efficiency metrics, making it easier for stakeholders to grasp the effectiveness of customer support initiatives. Such a collection is indispensable for training new team members, demonstrating the team's impact on customer satisfaction, and internal reviews to improve service delivery. By using these slides, teams can ensure a consistent understanding of goals, roles, and procedures, which is crucial for maintaining high standards of customer service and team alignment.


23 diapositivas
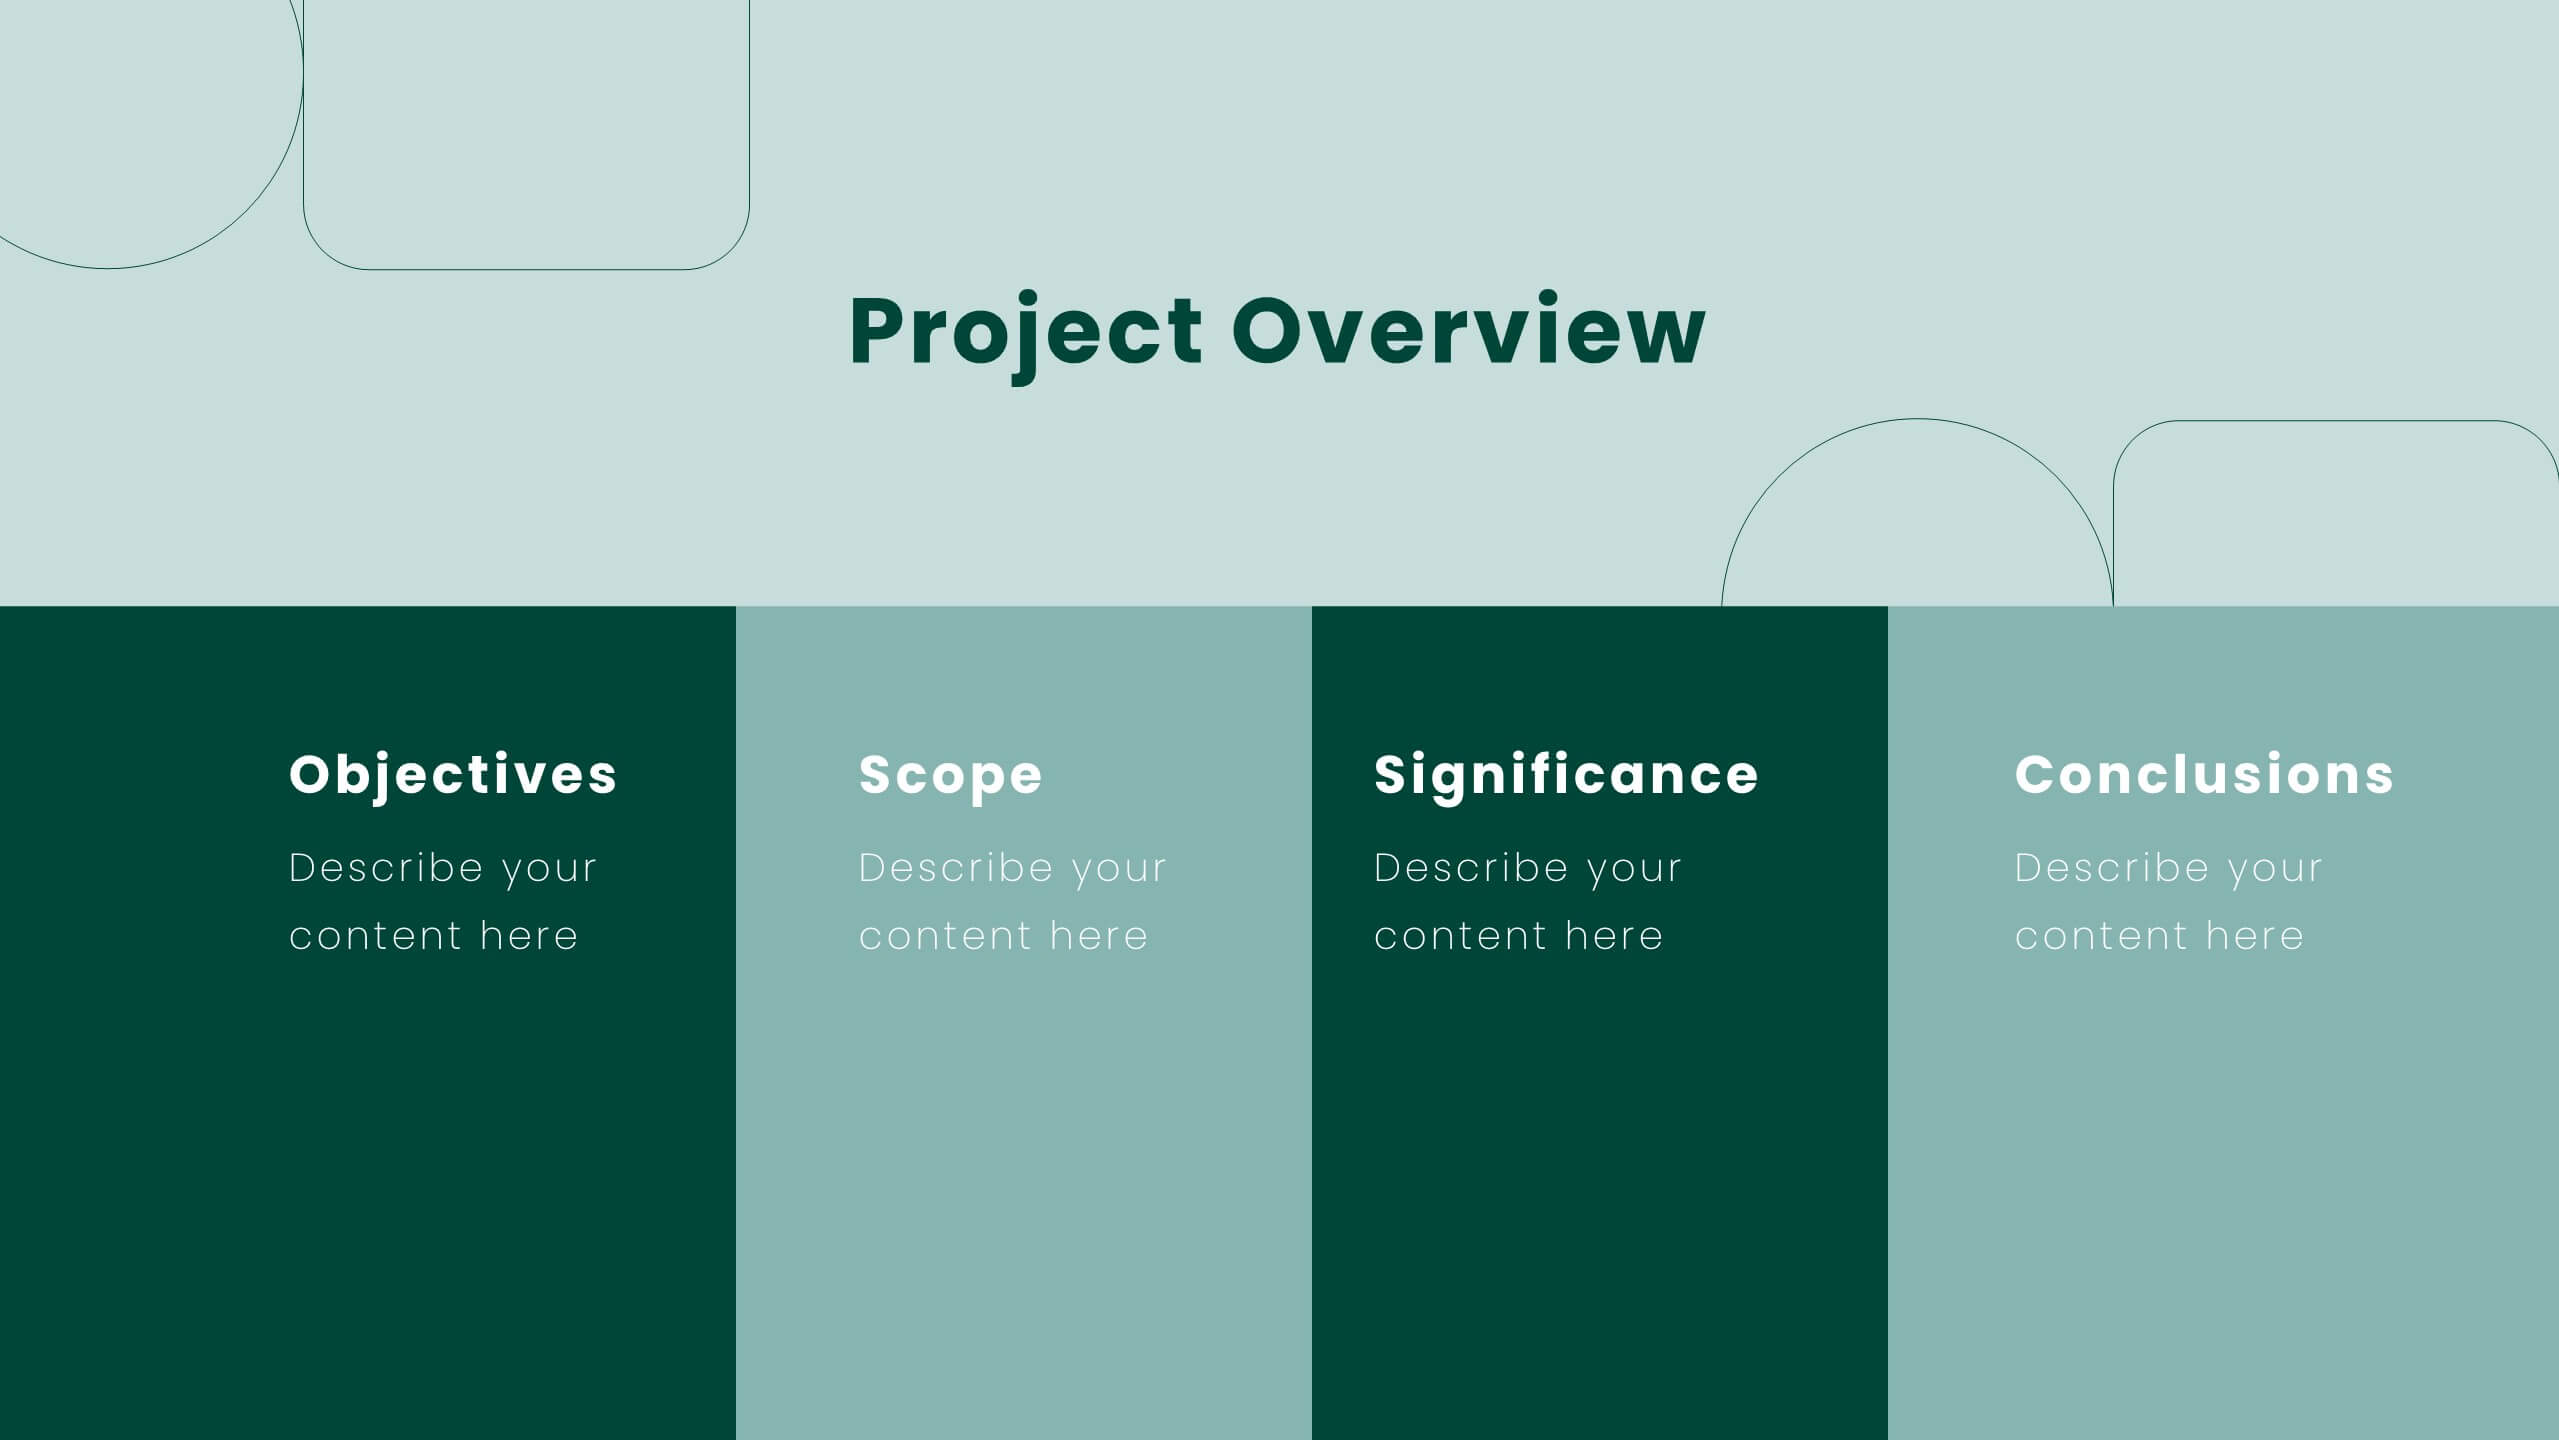
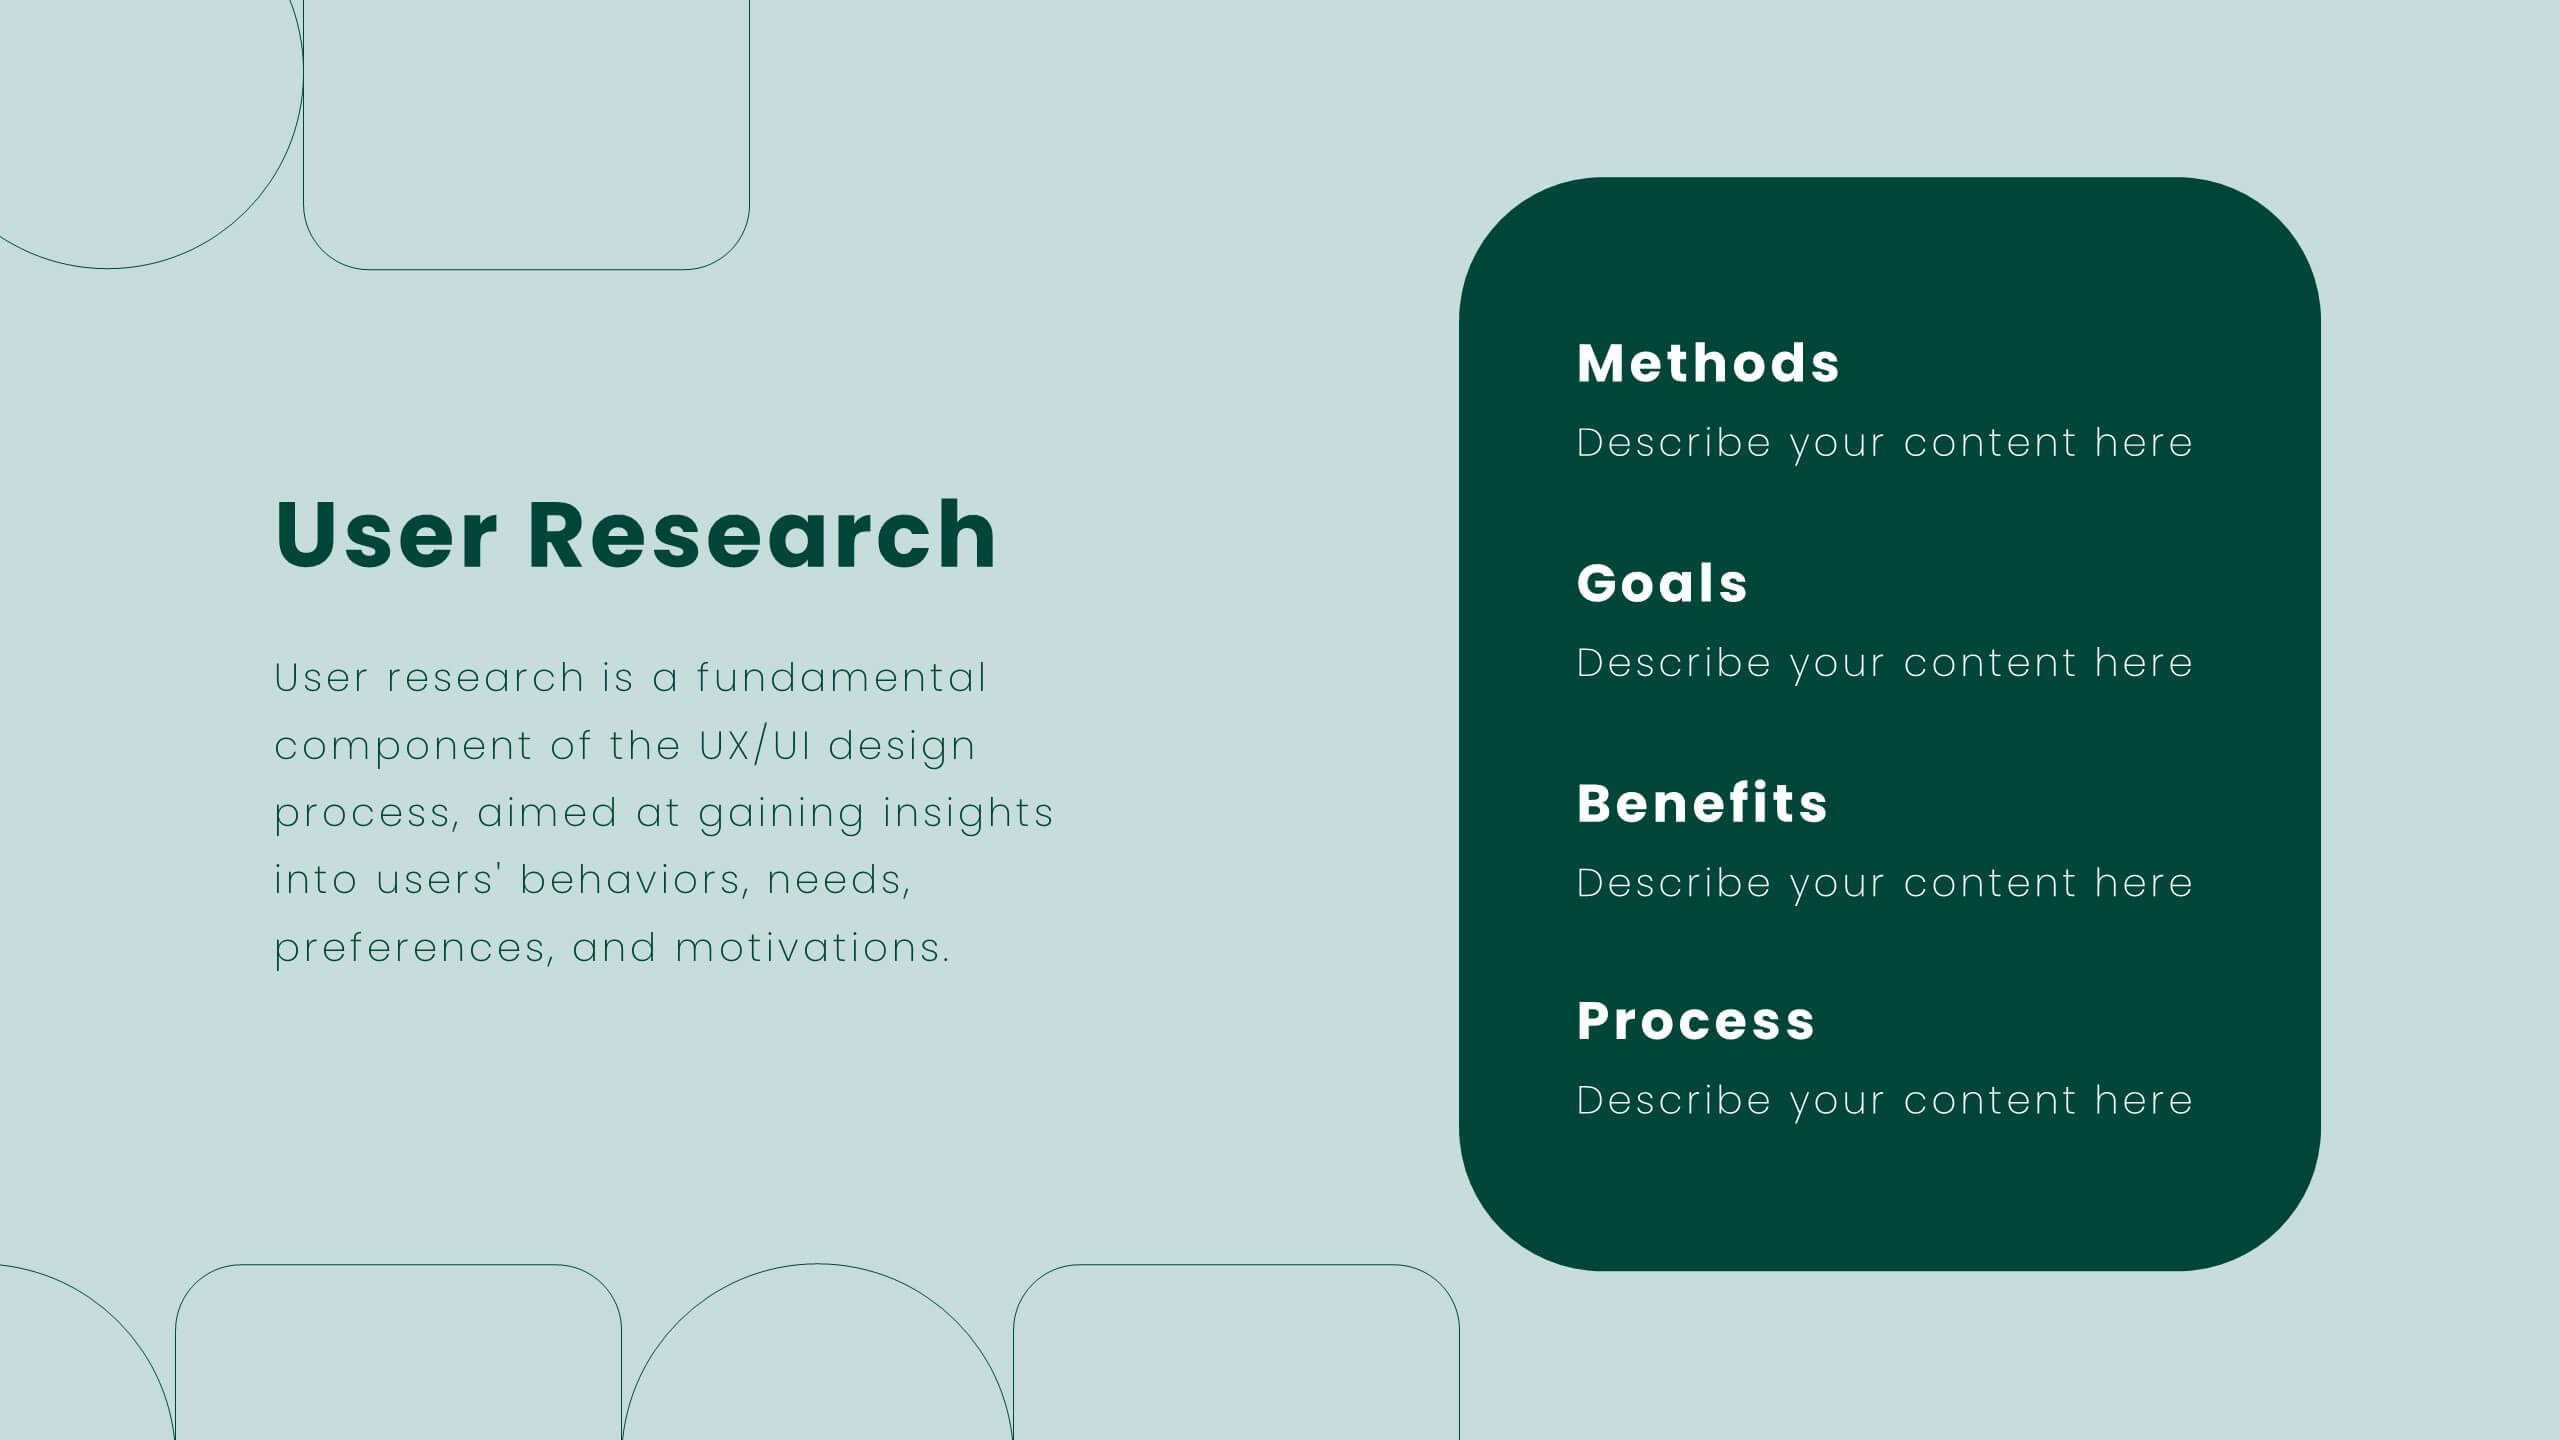
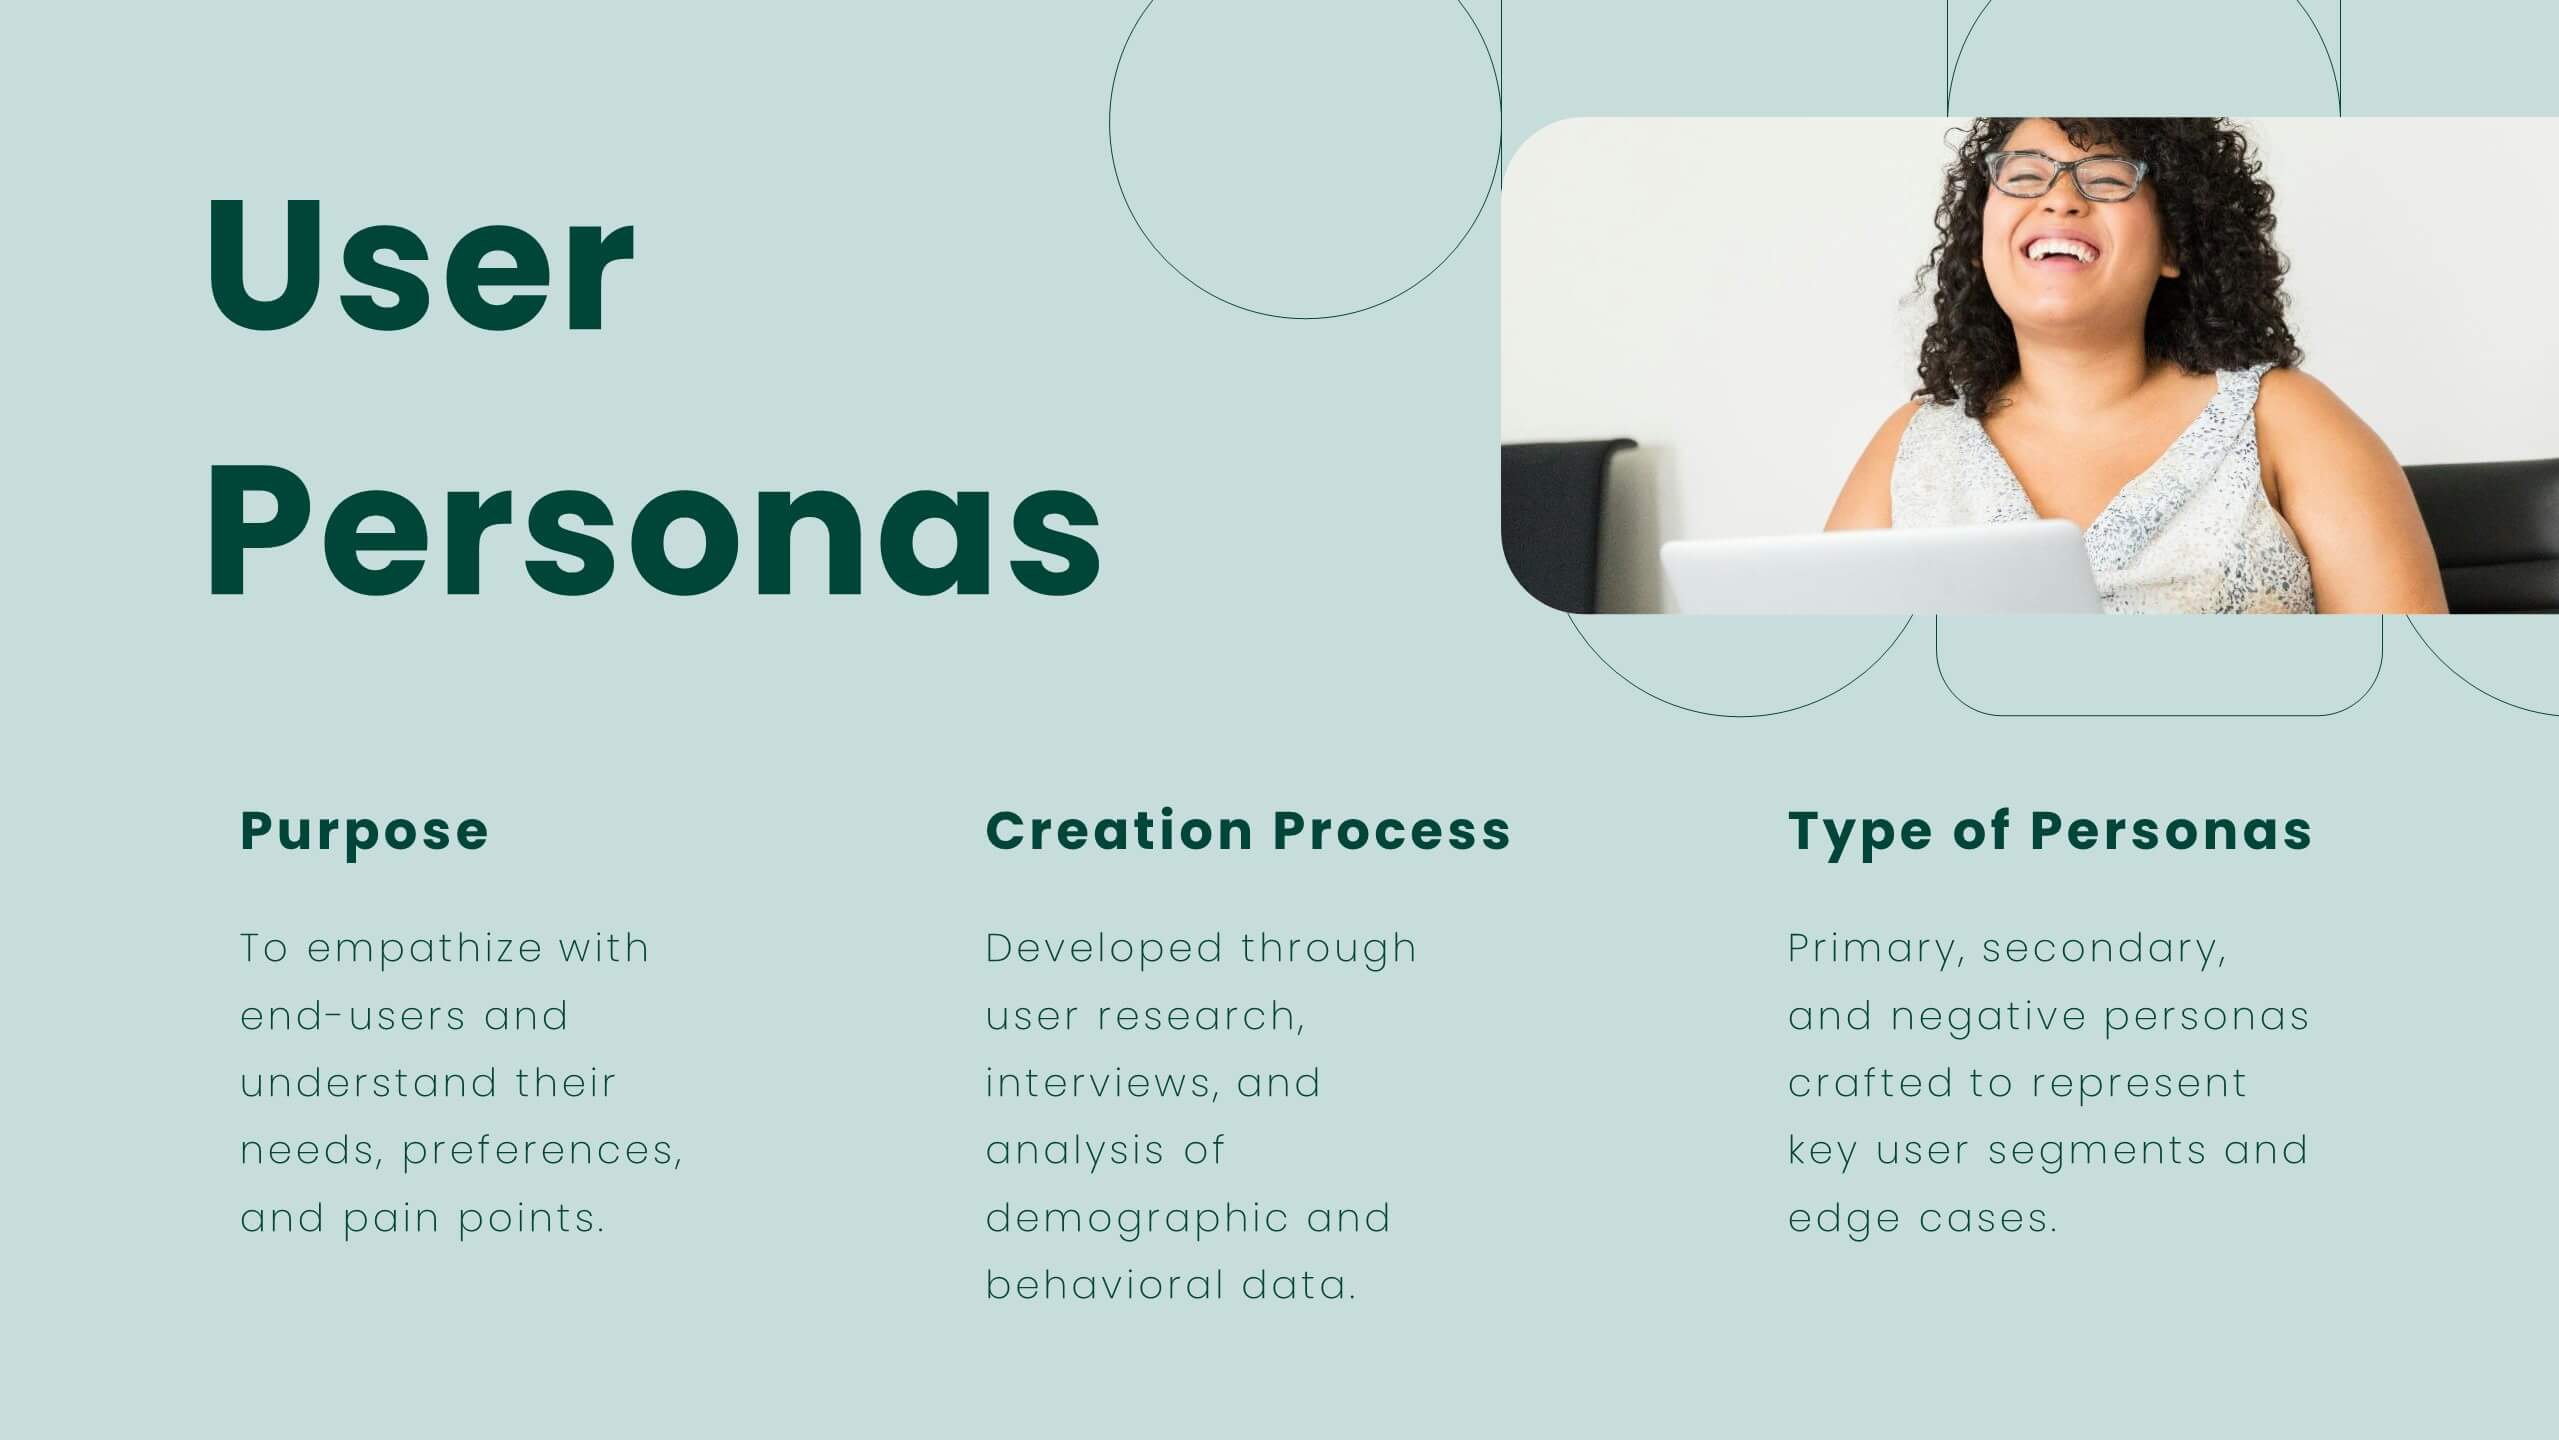
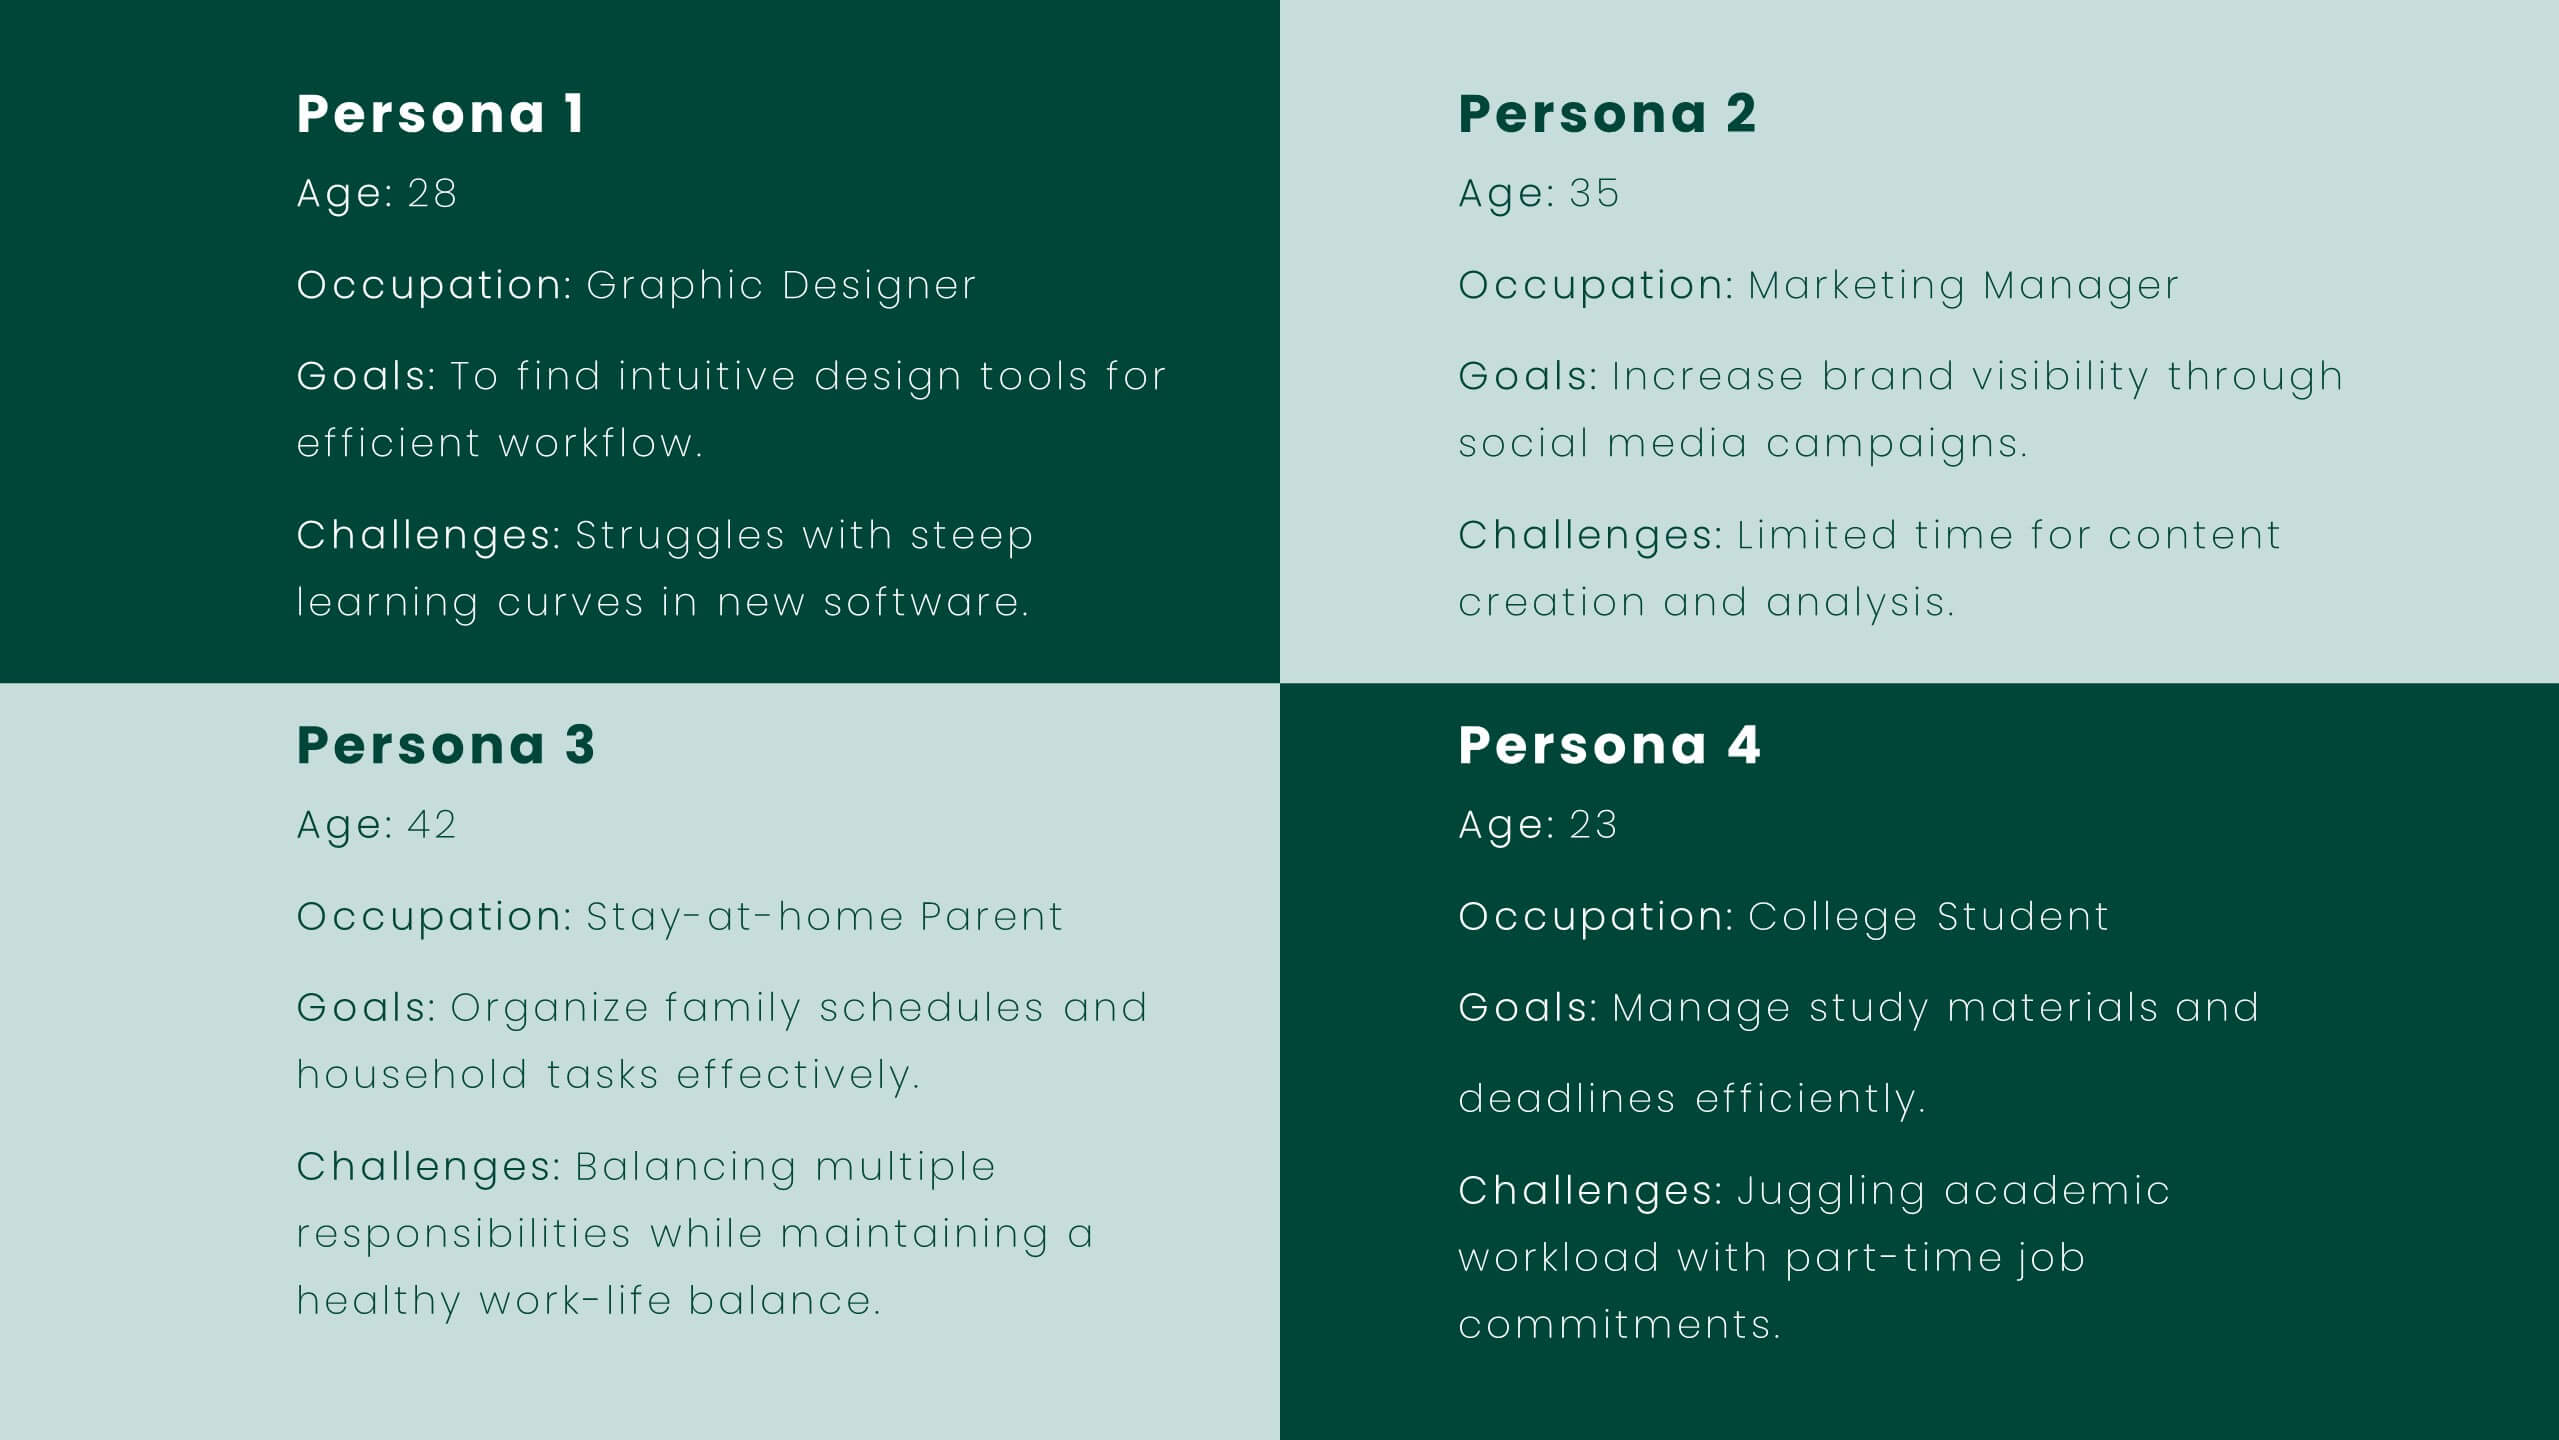
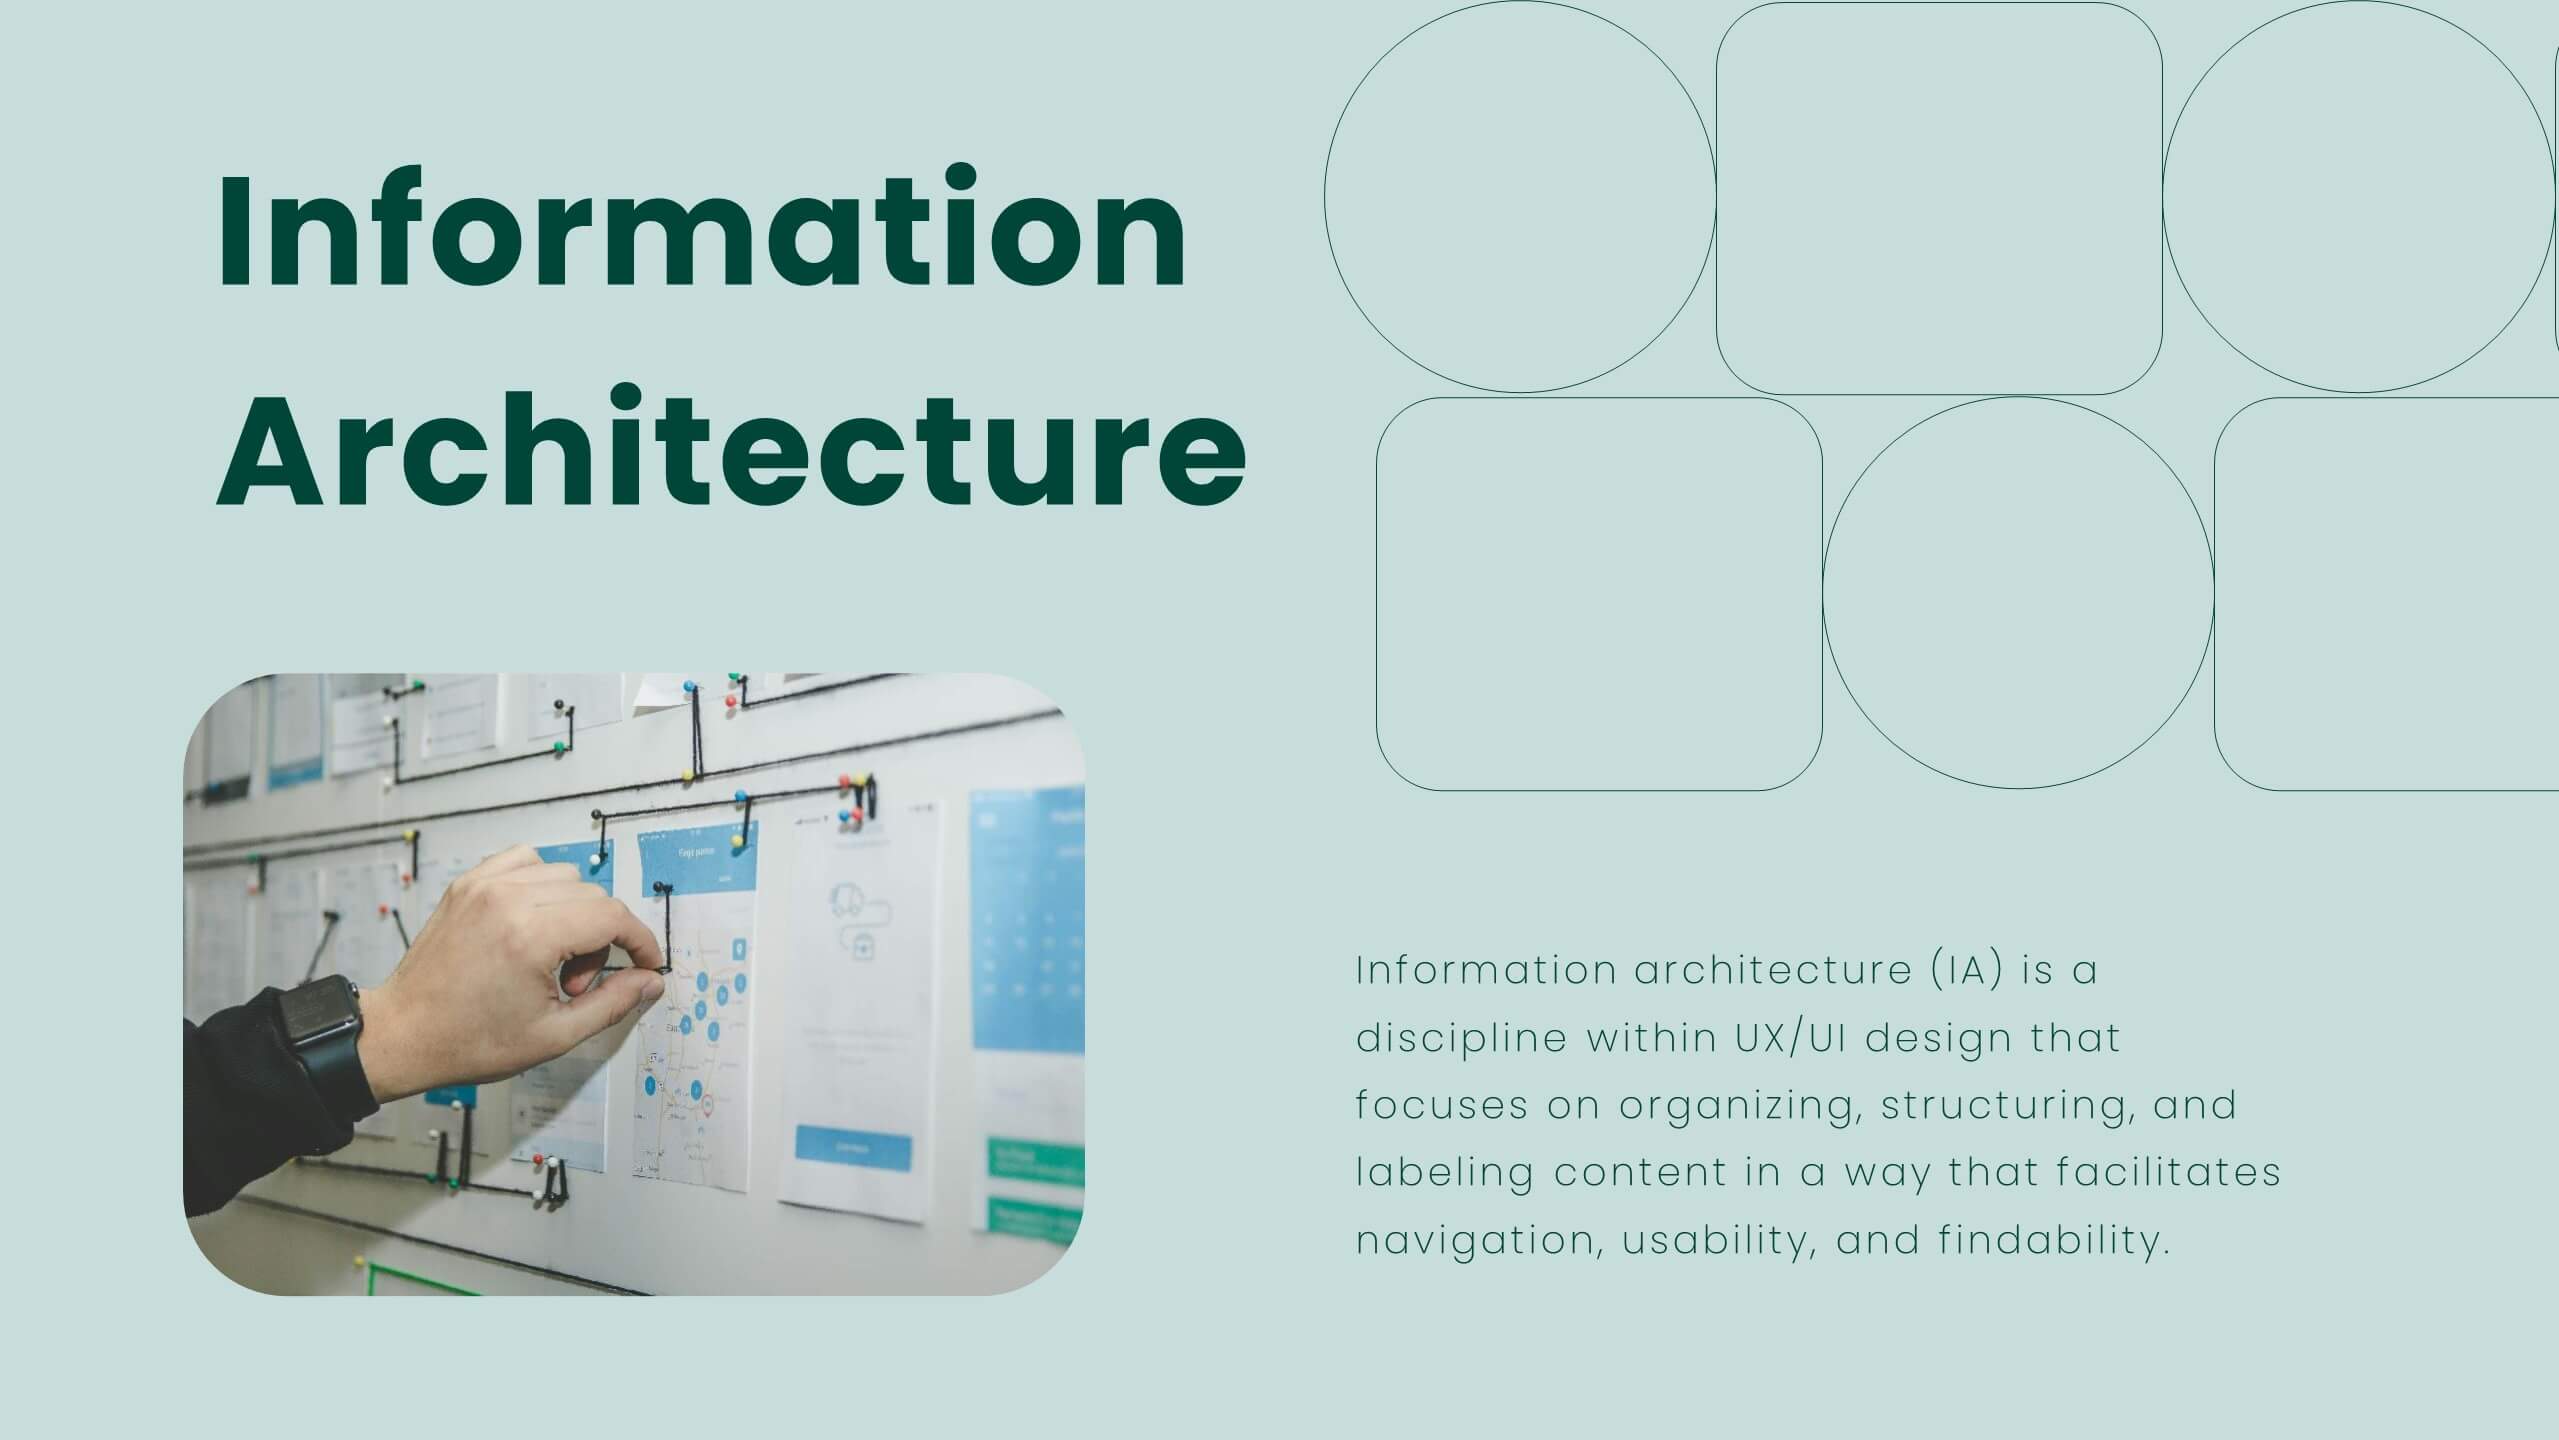
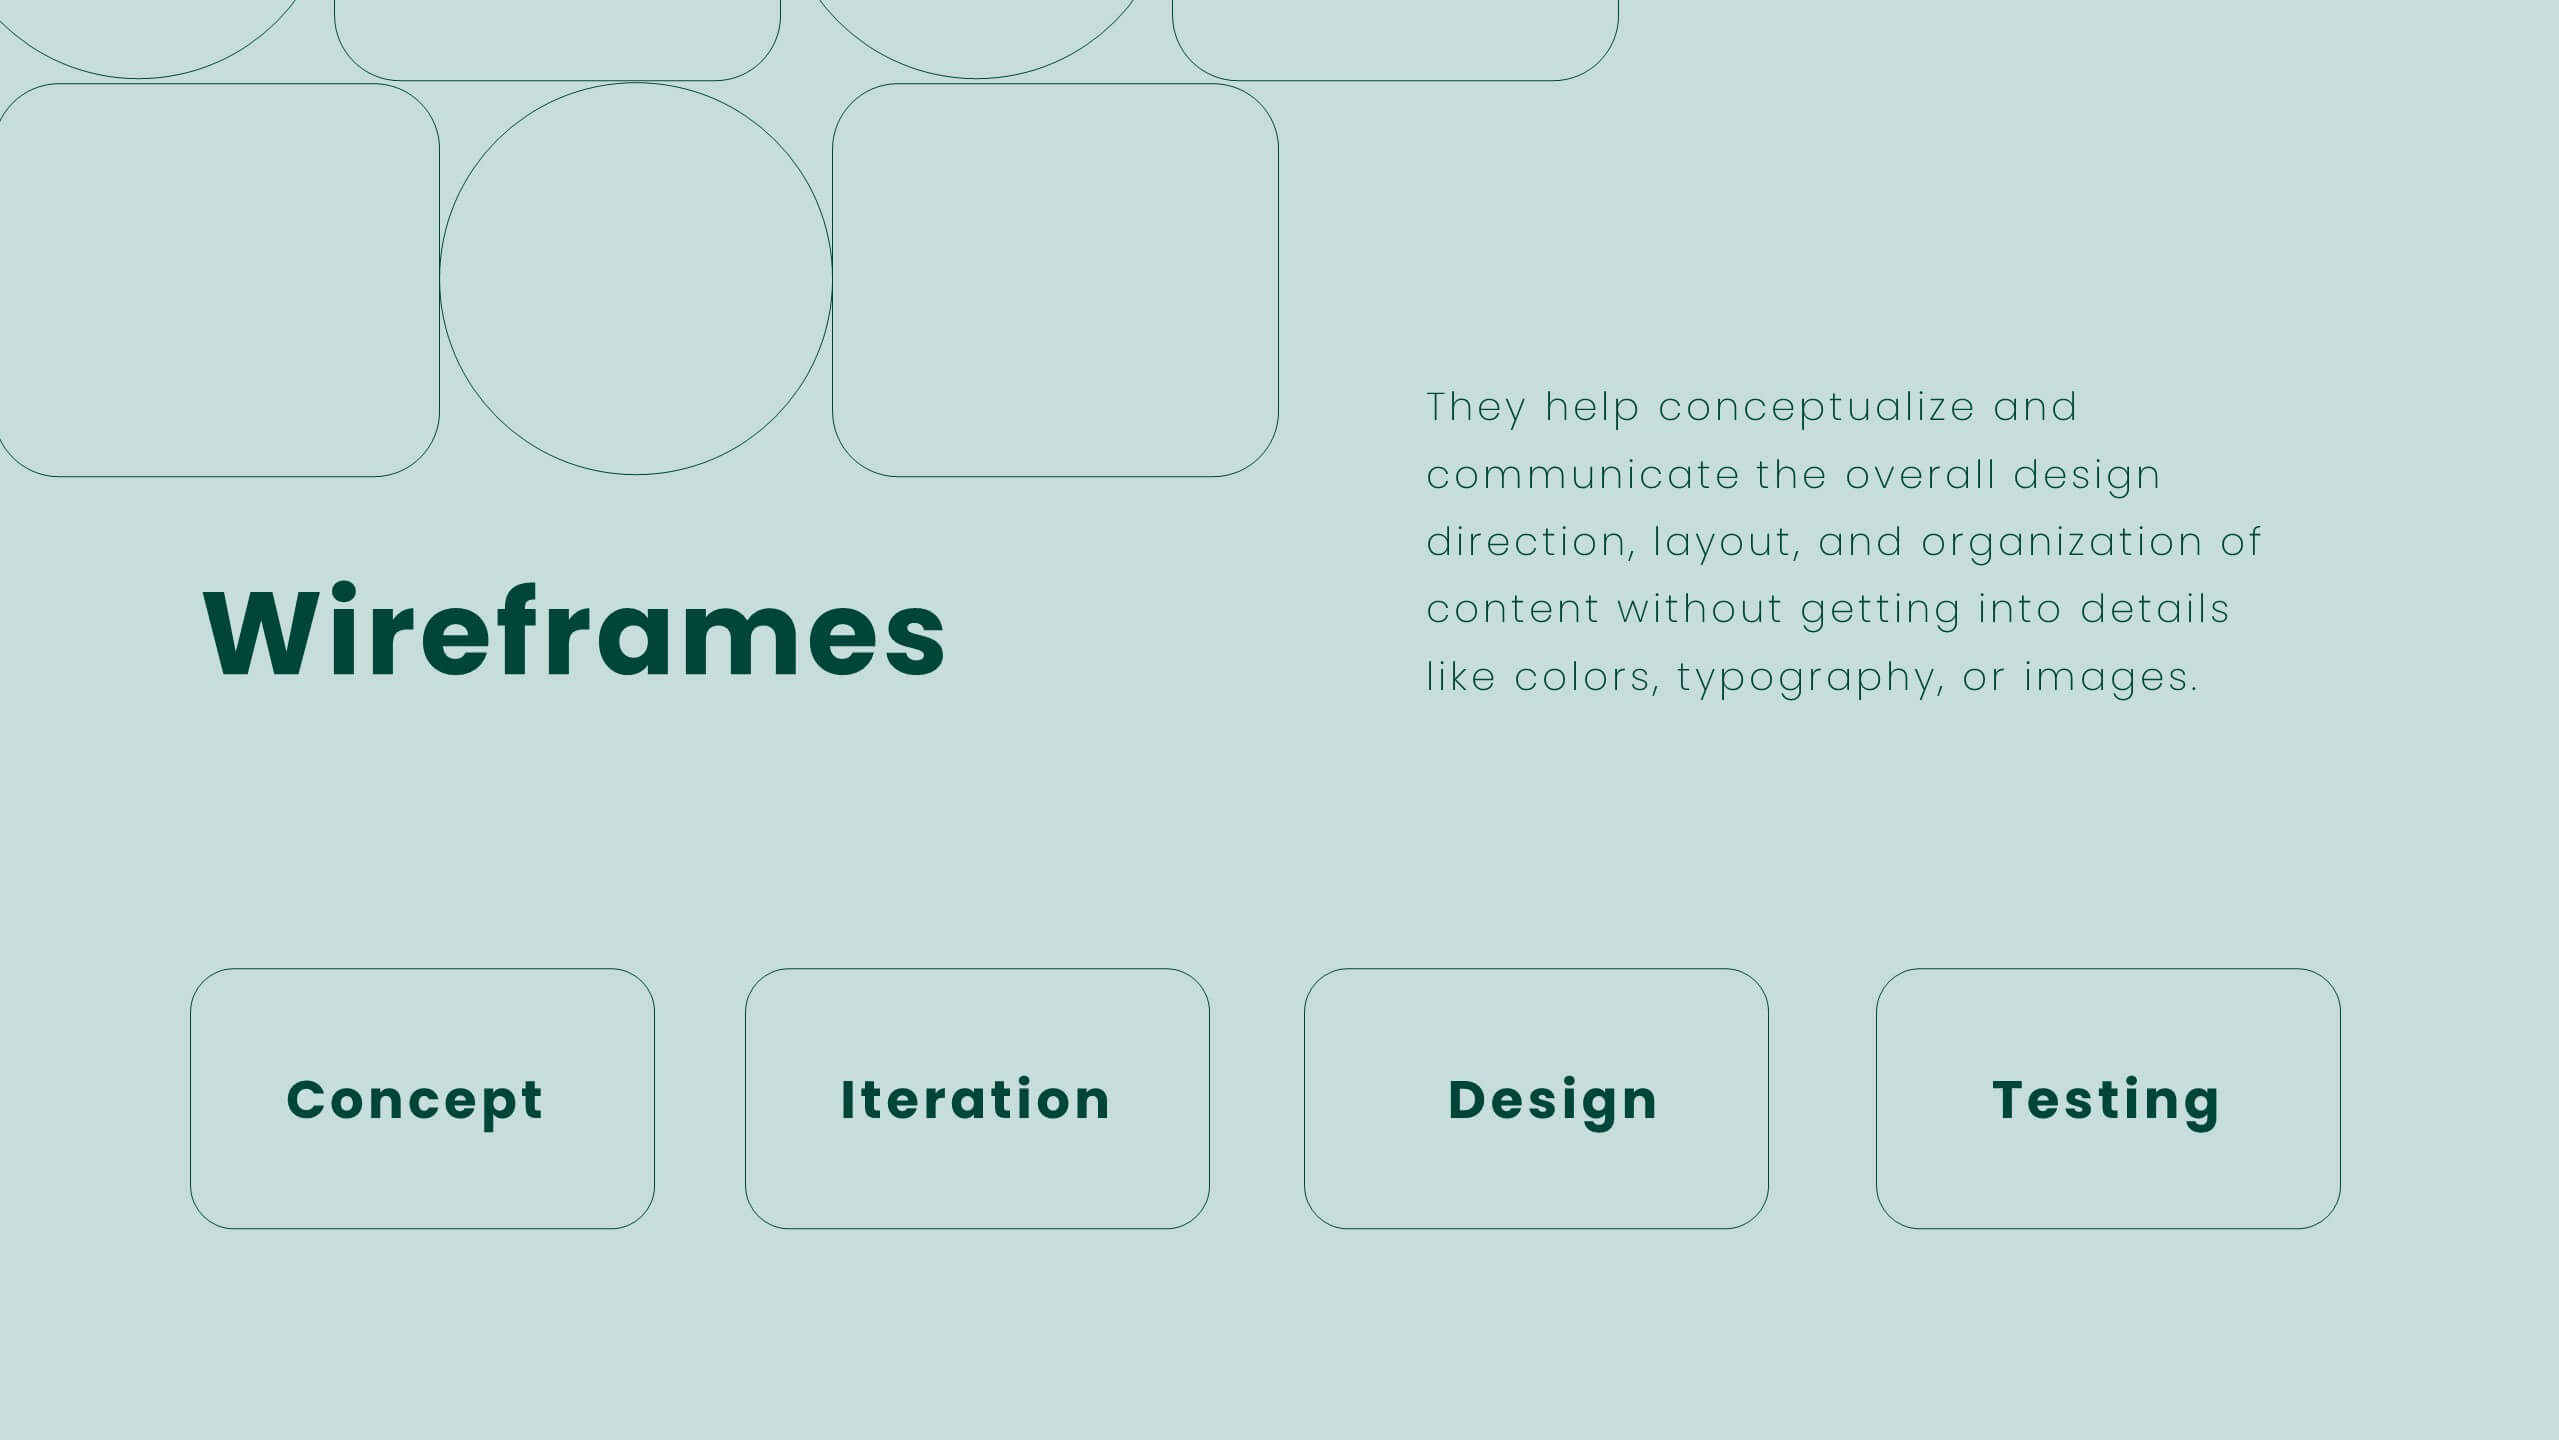
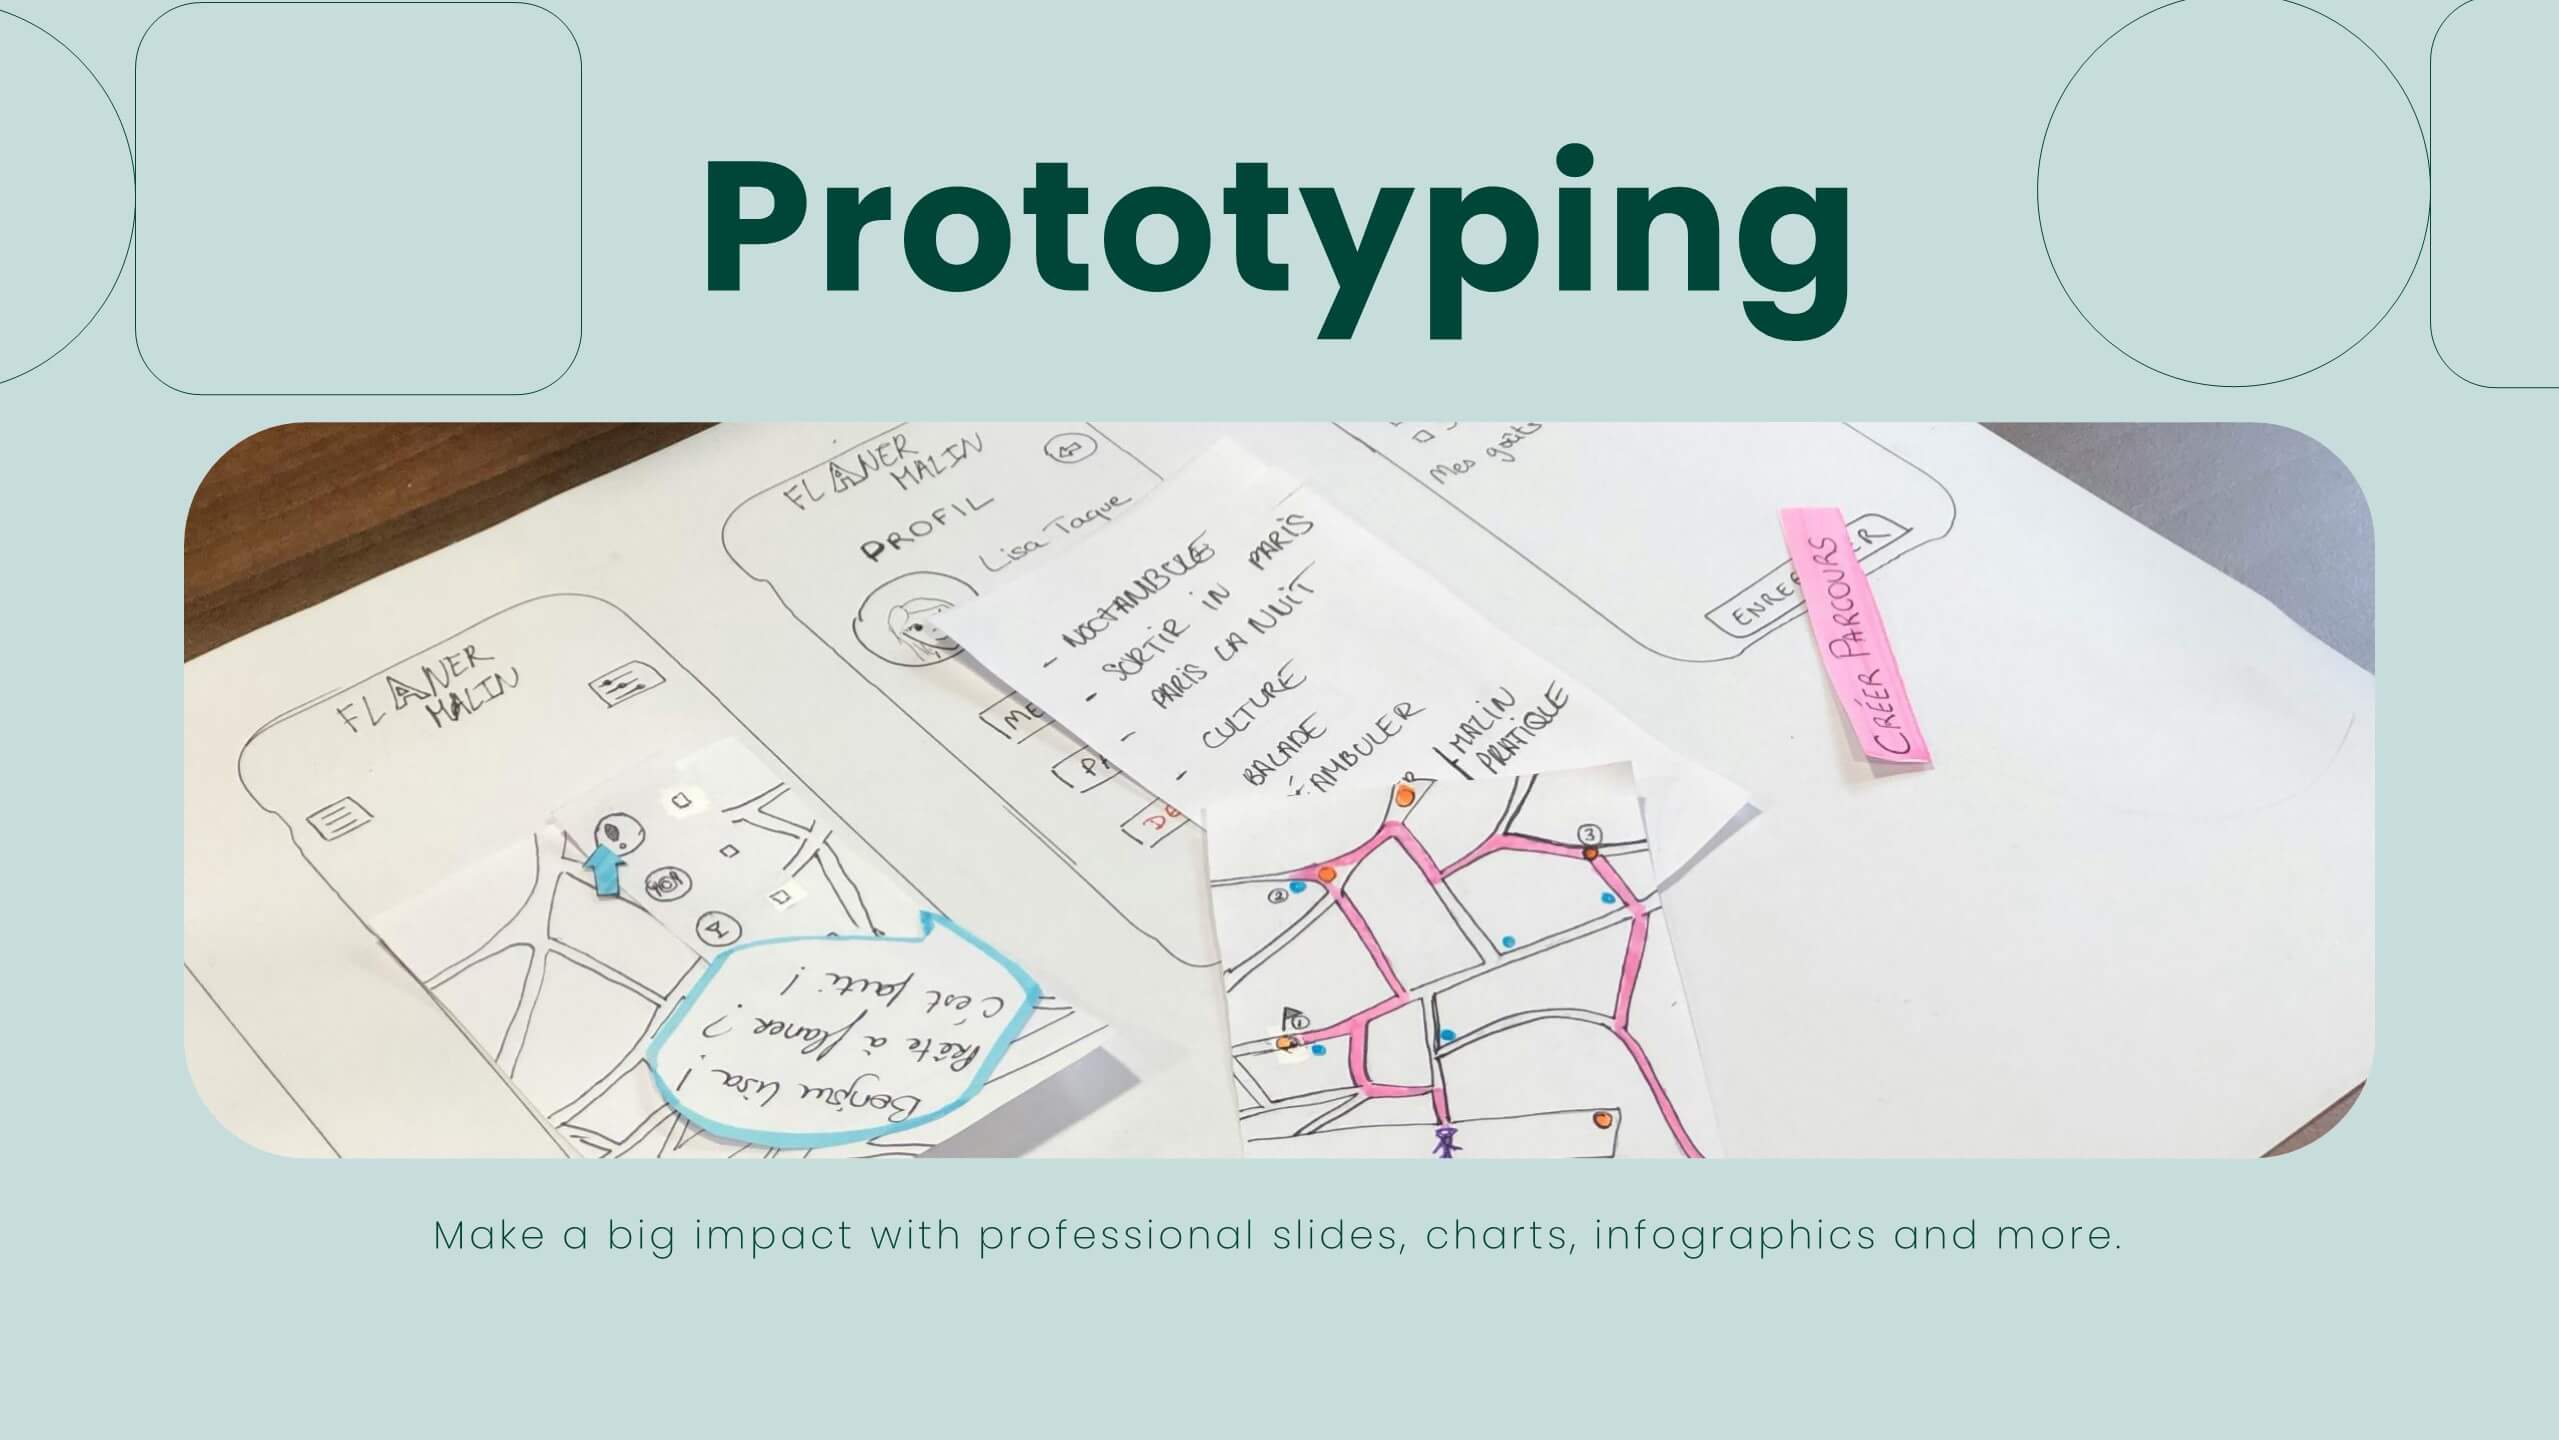
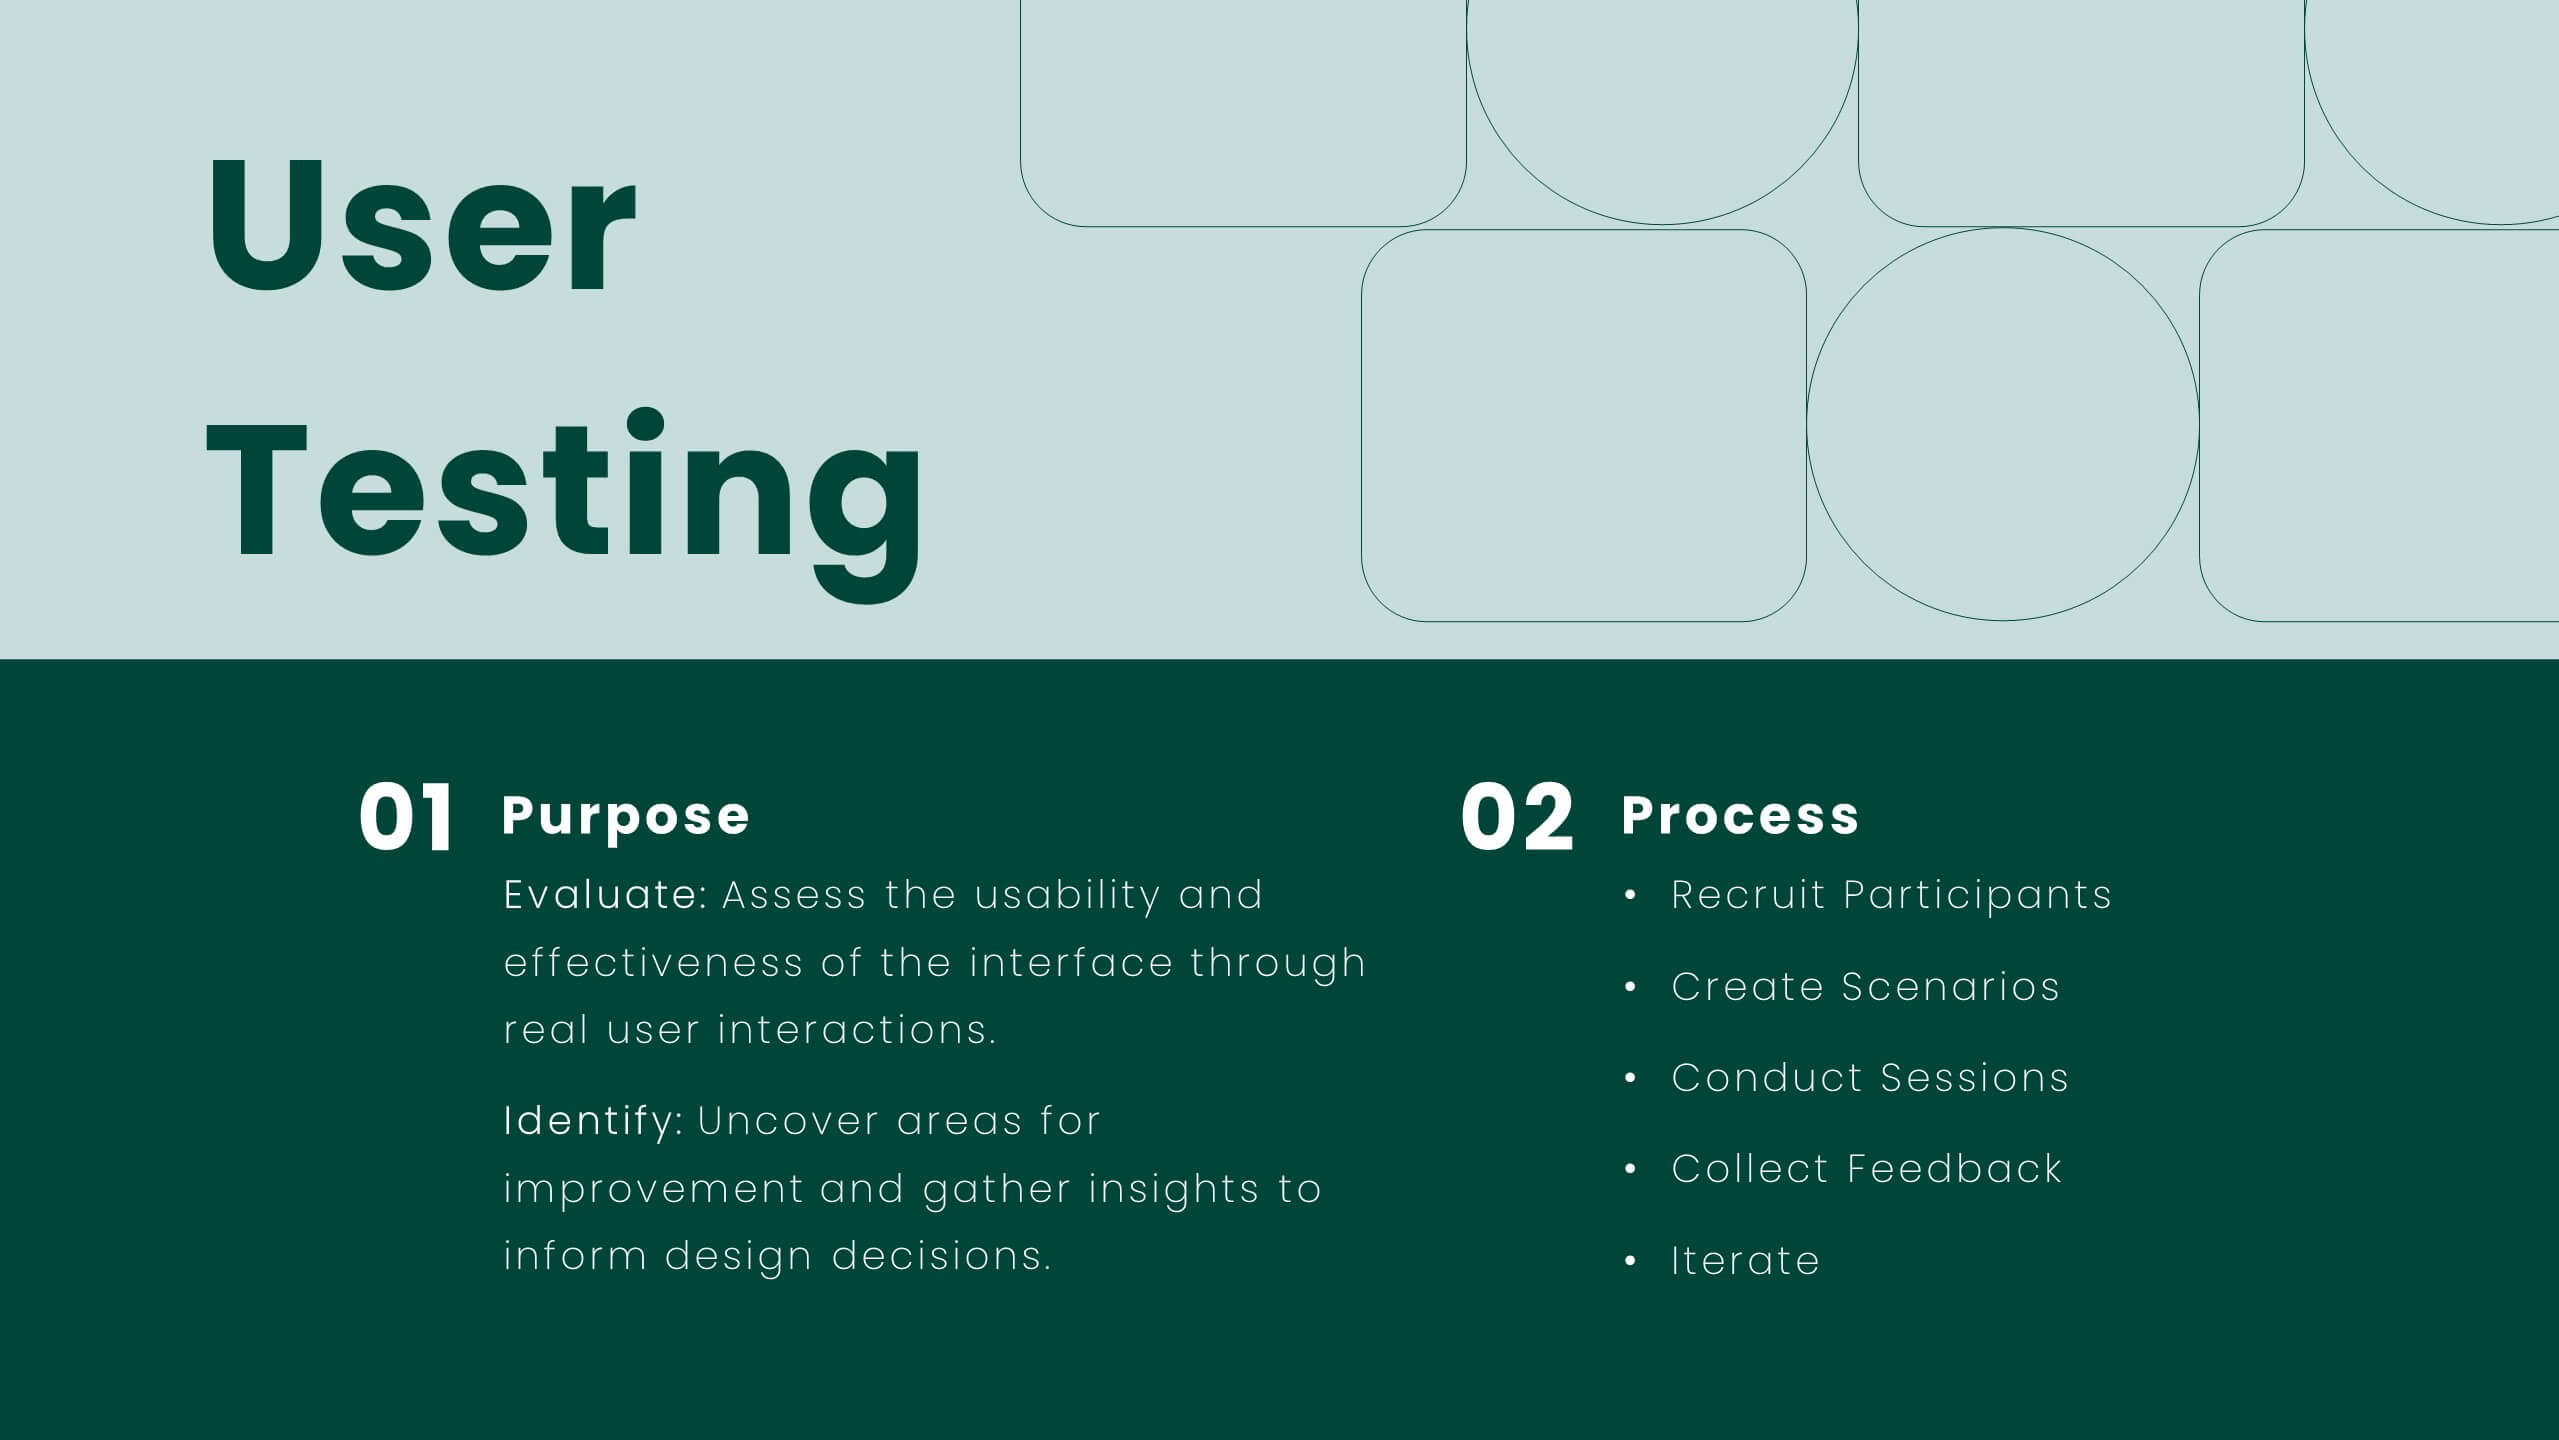
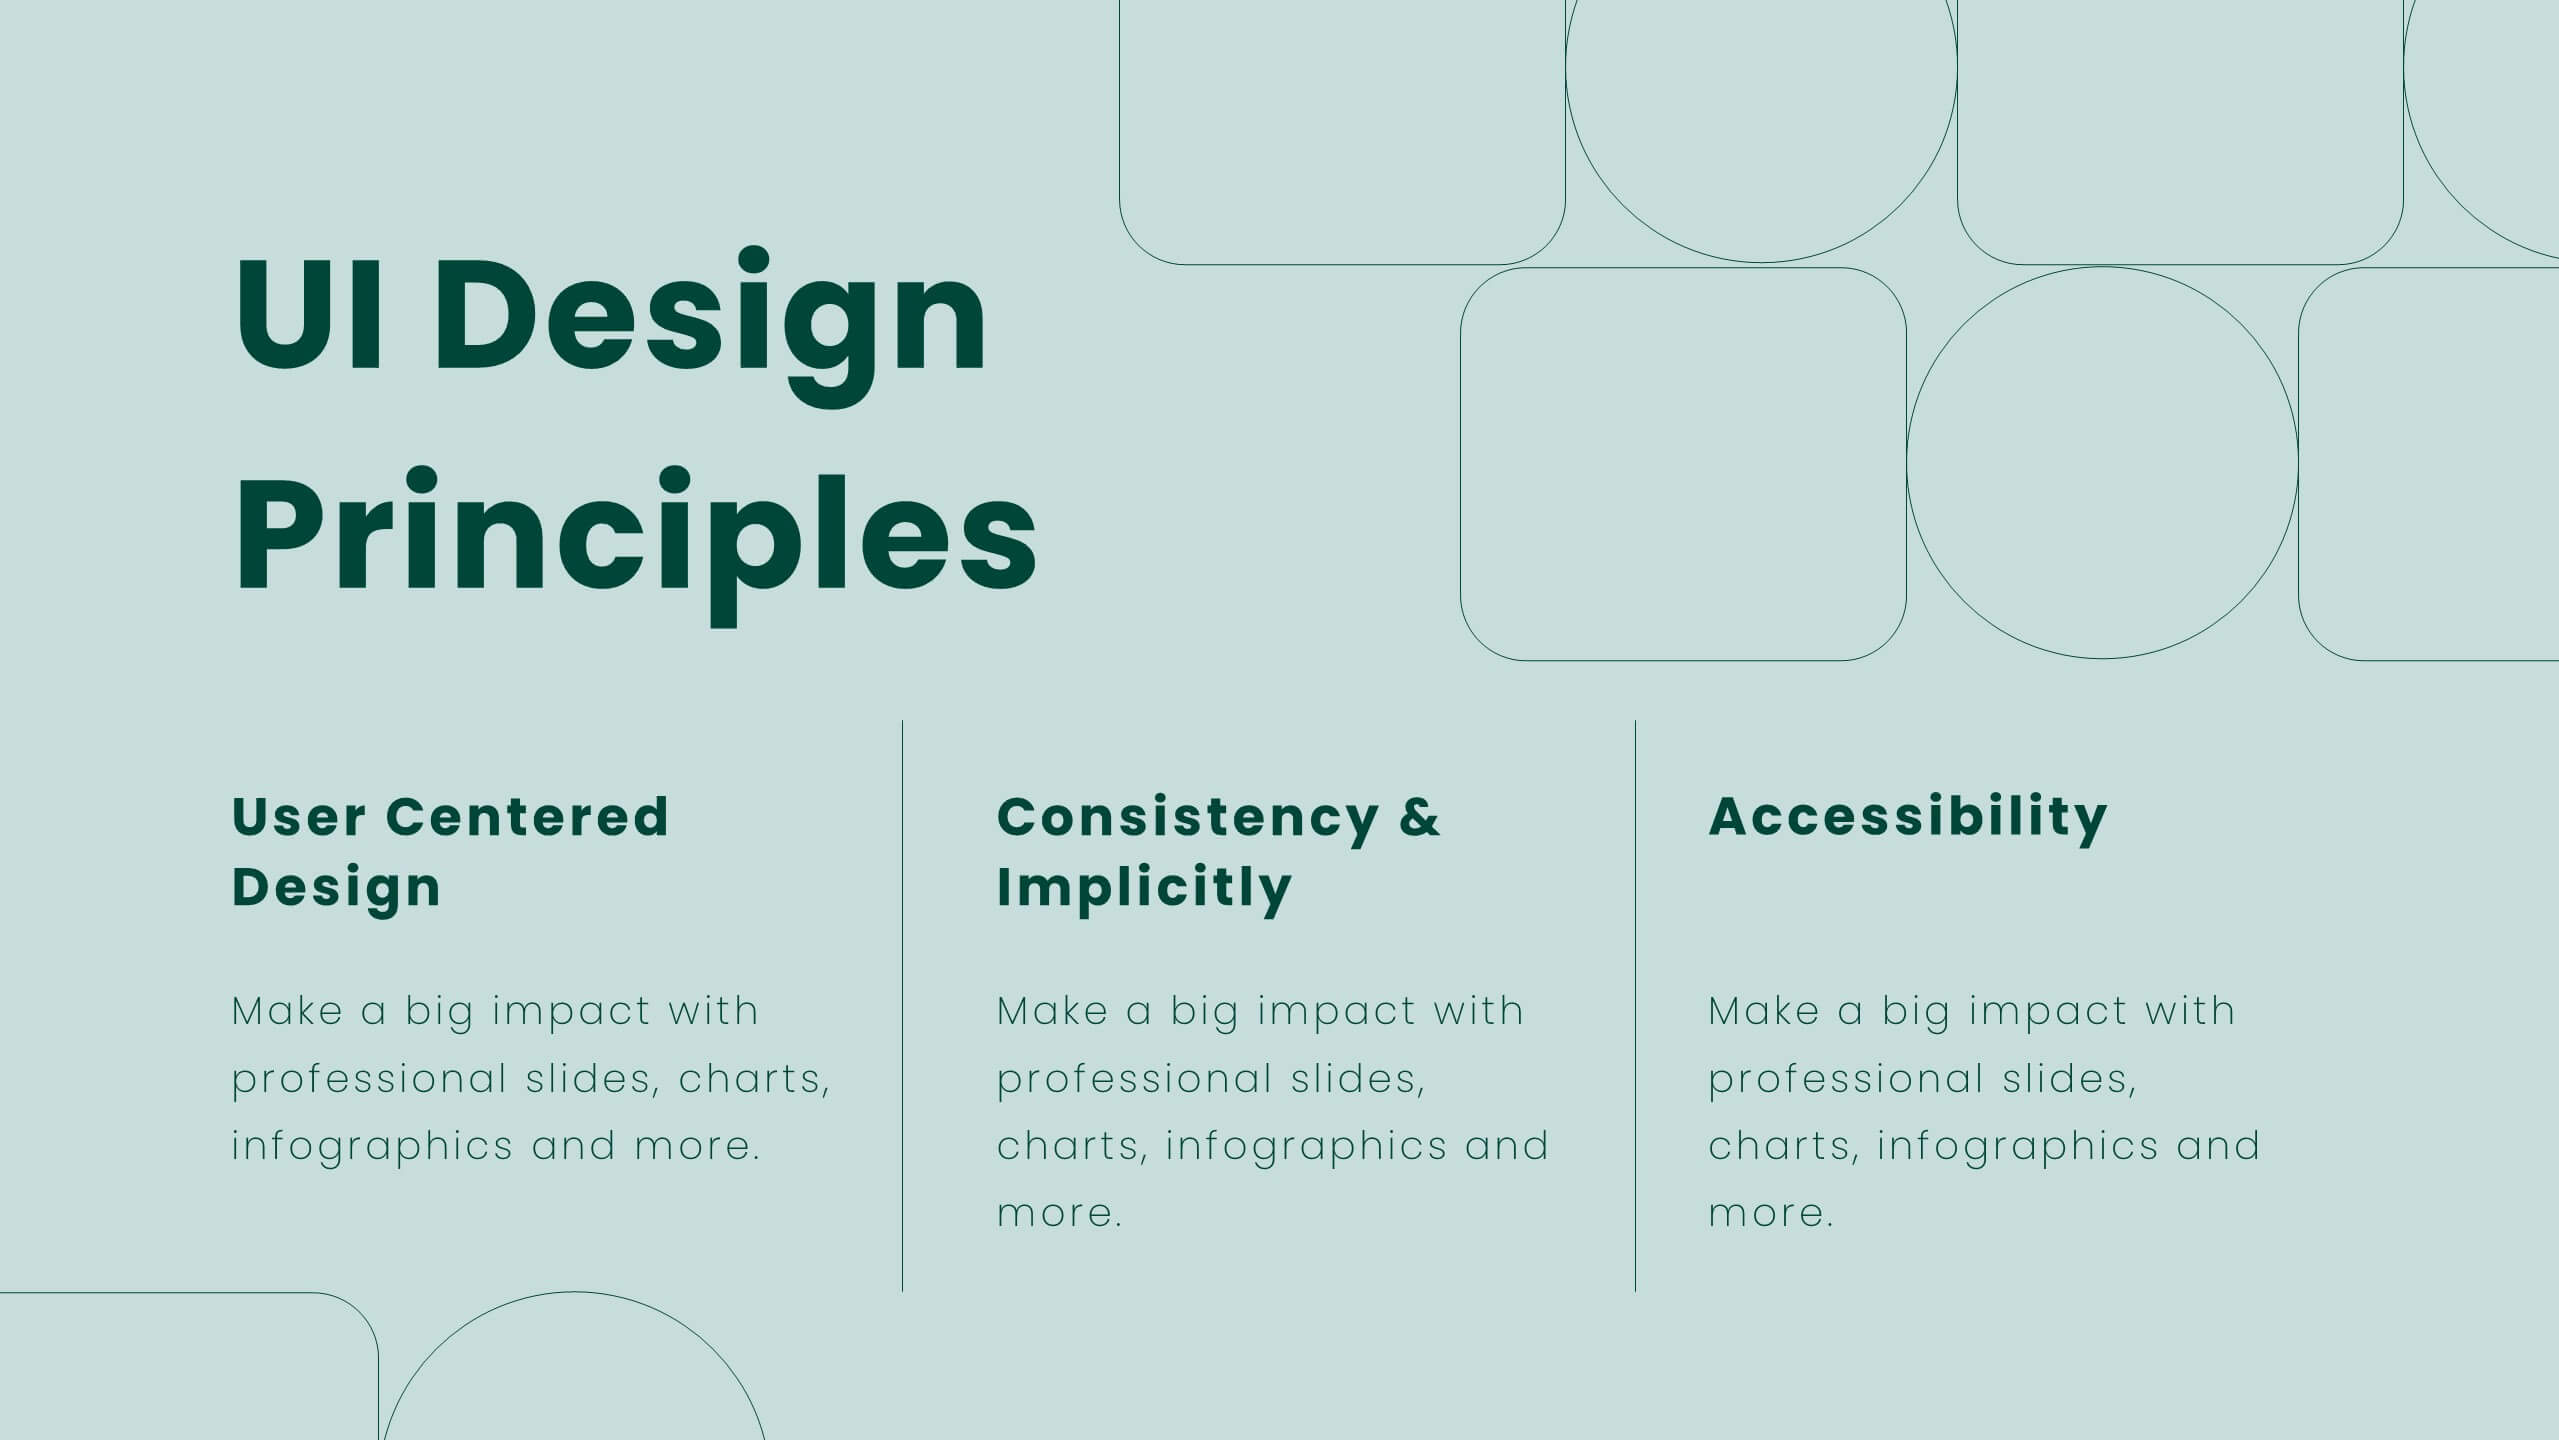
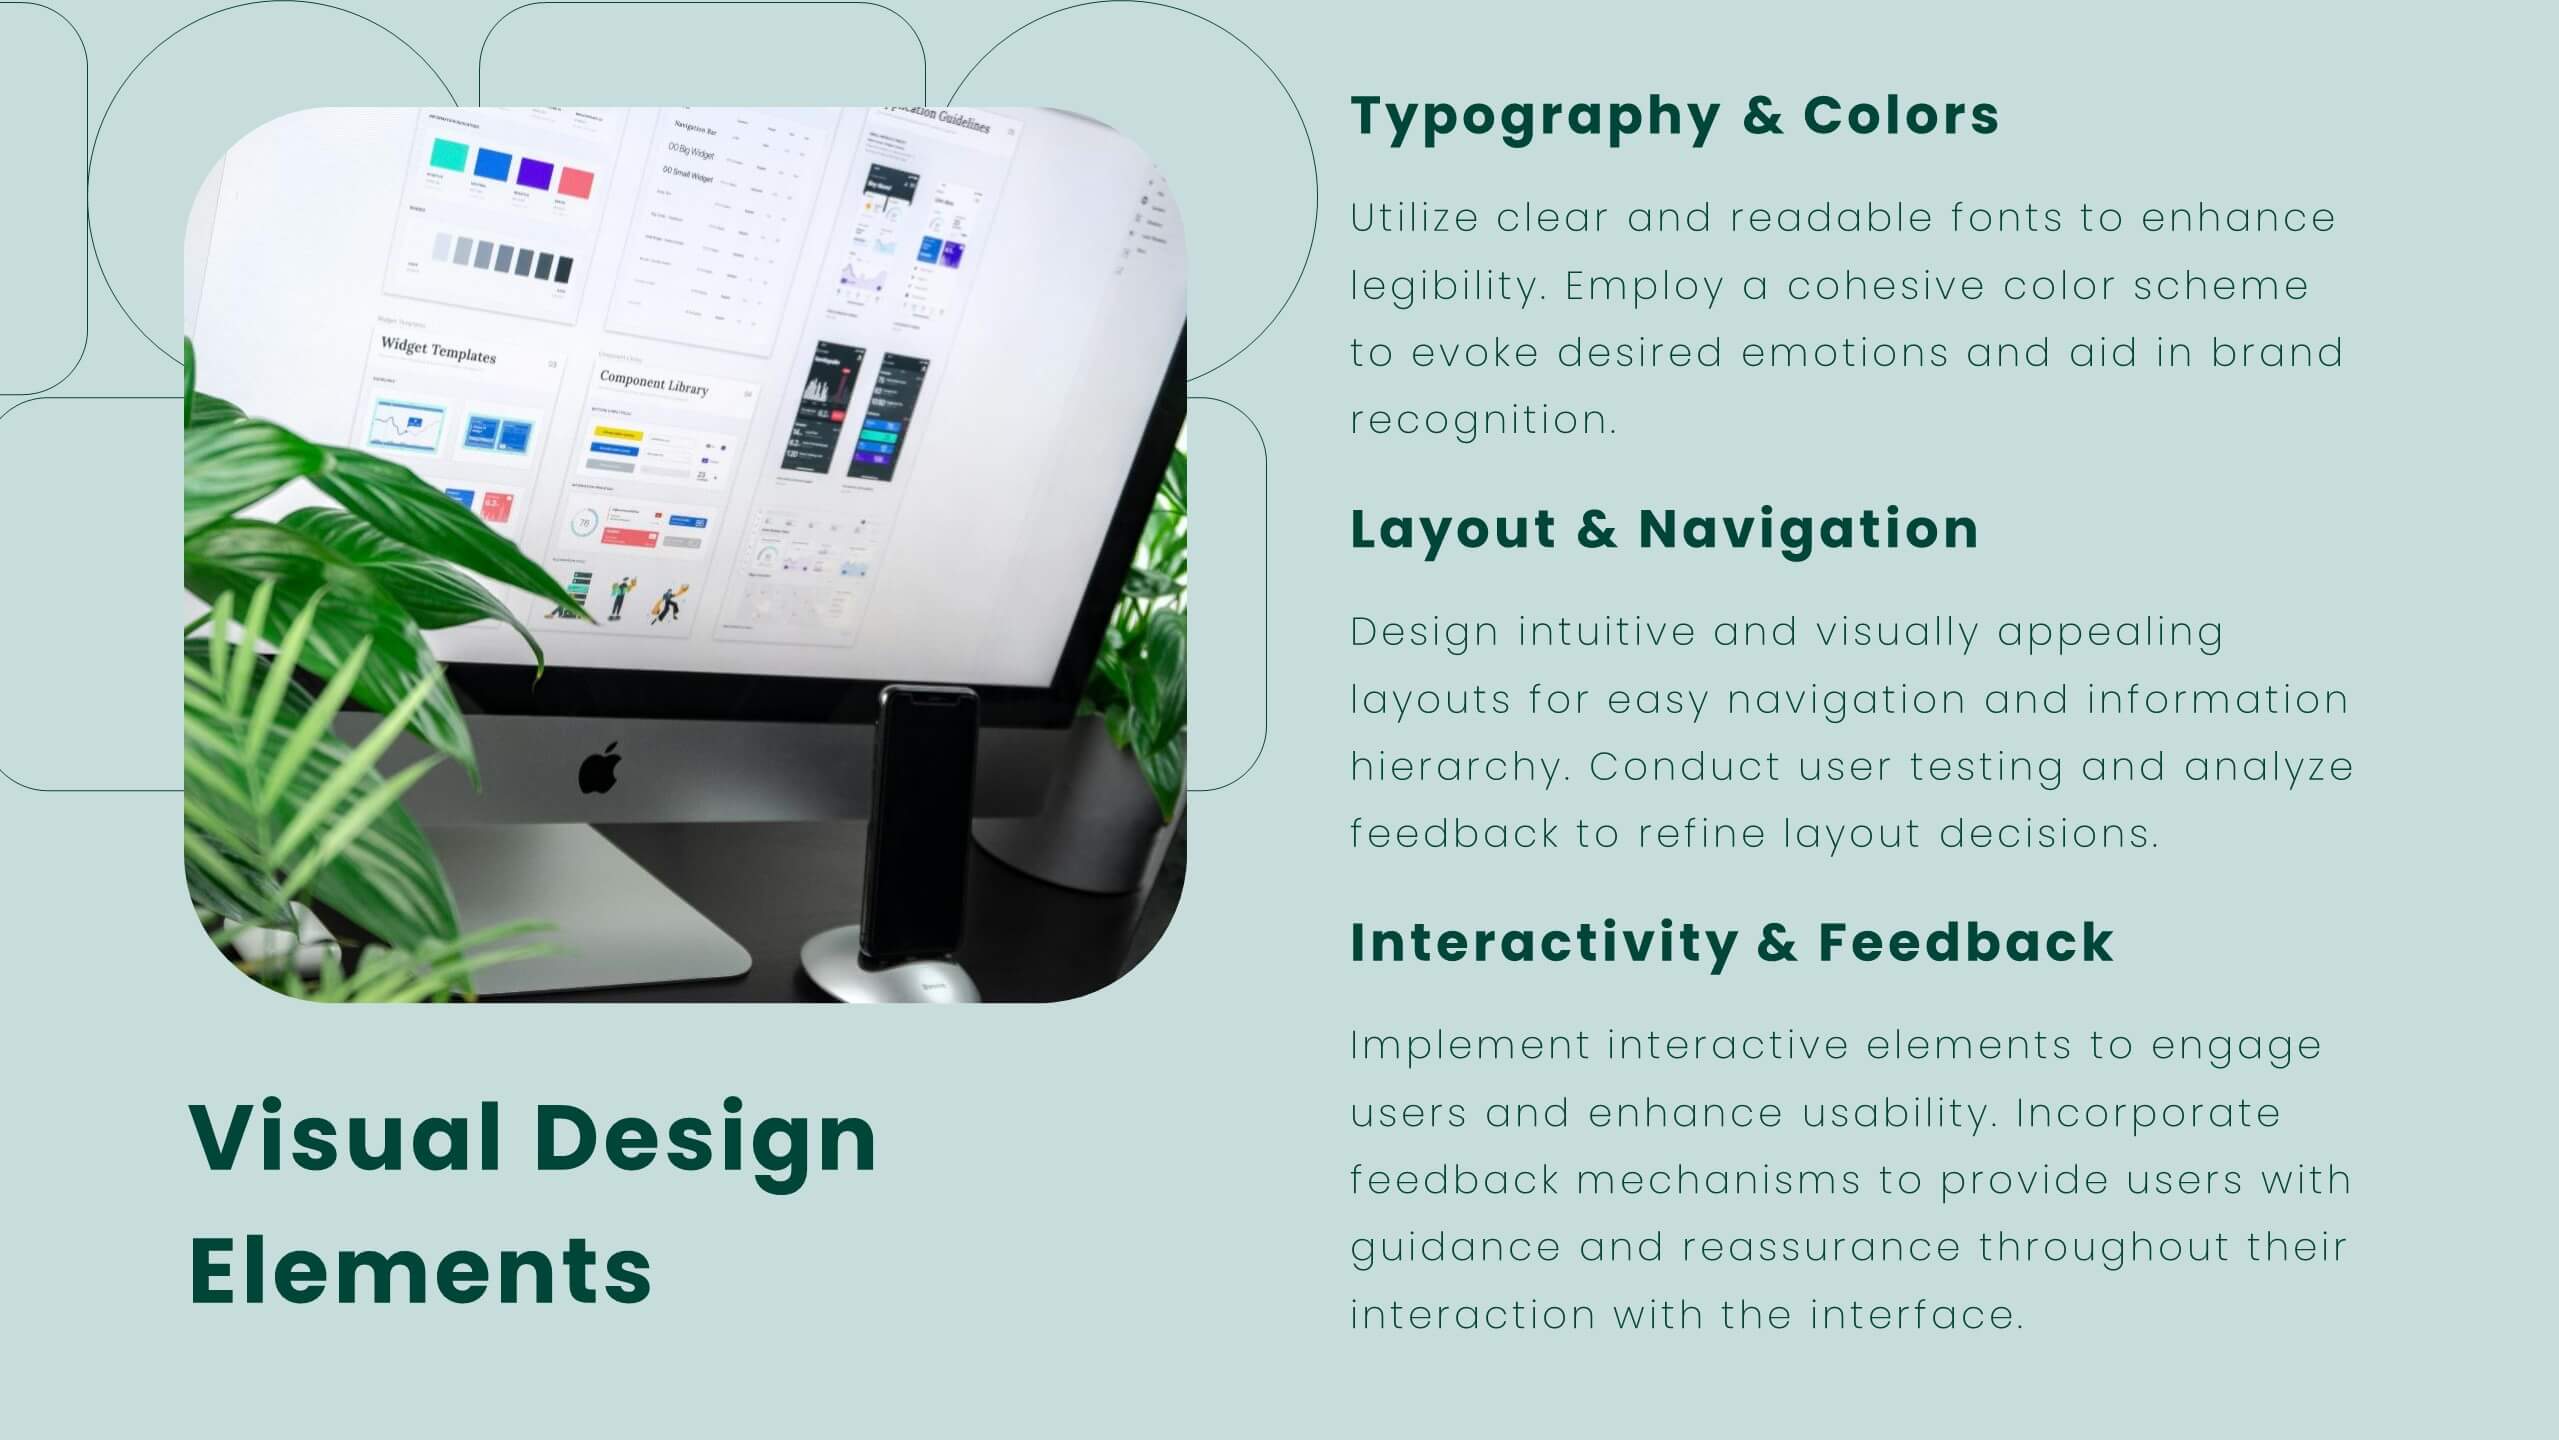
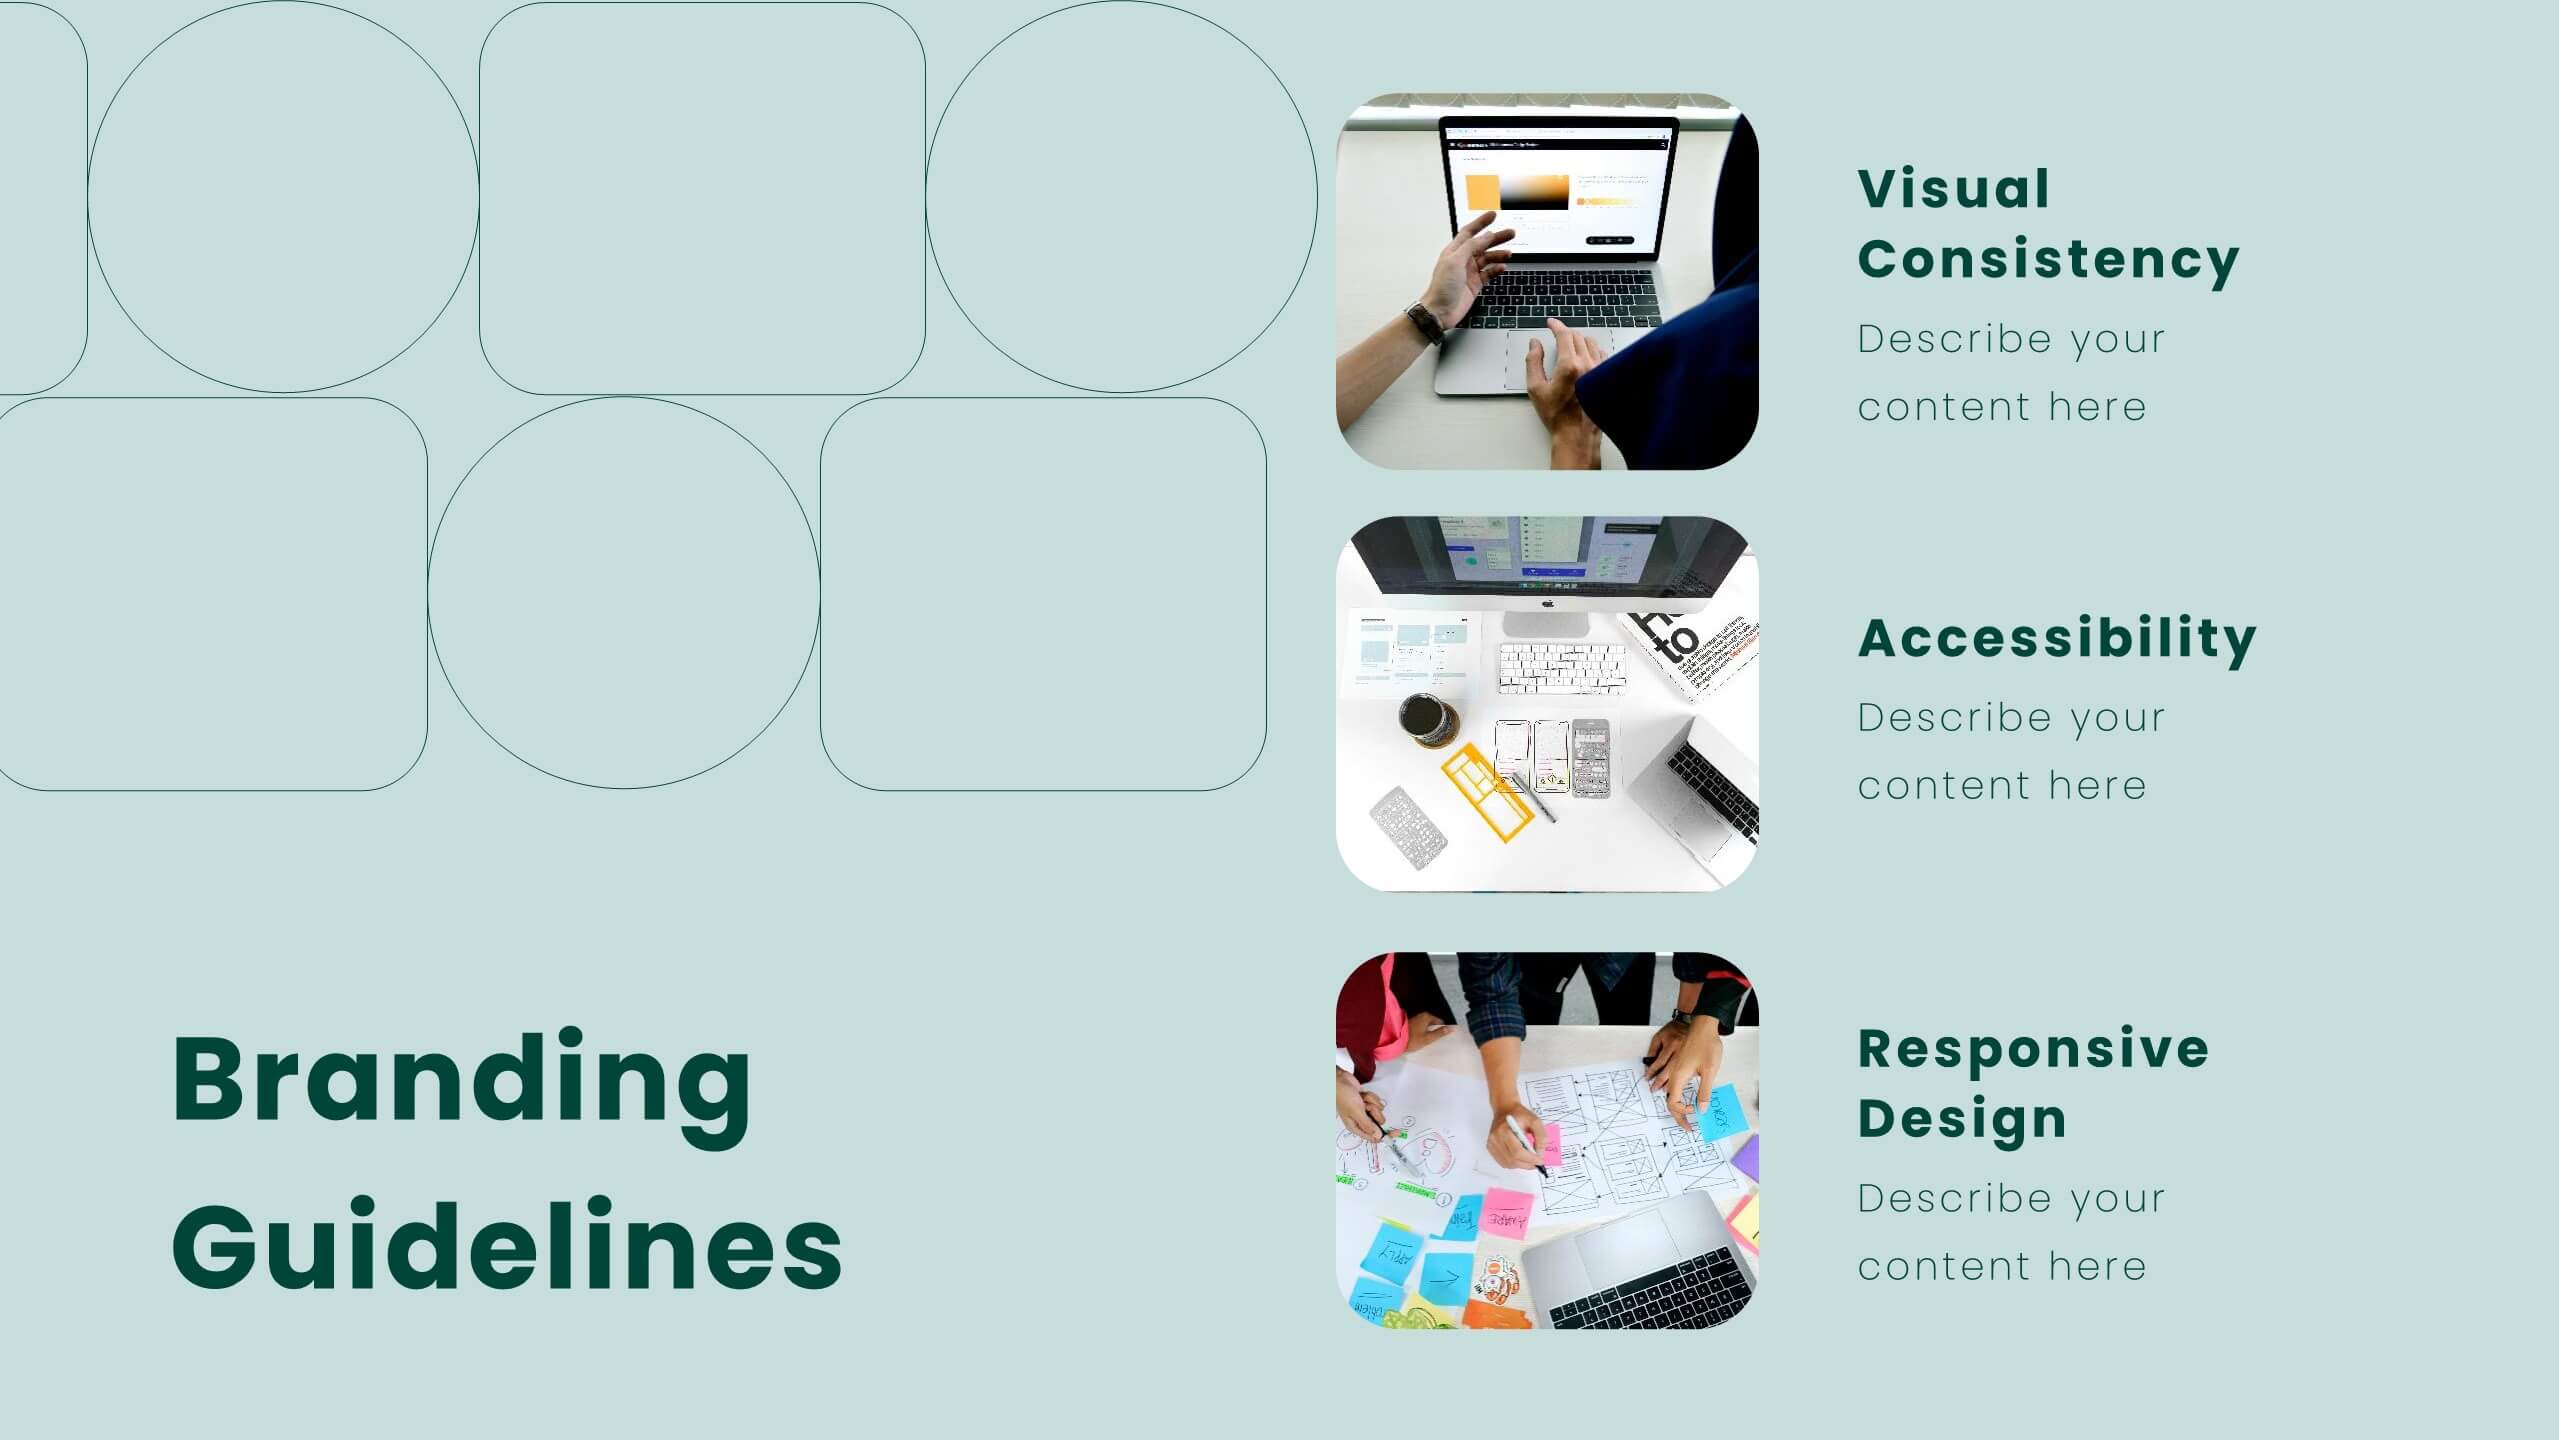
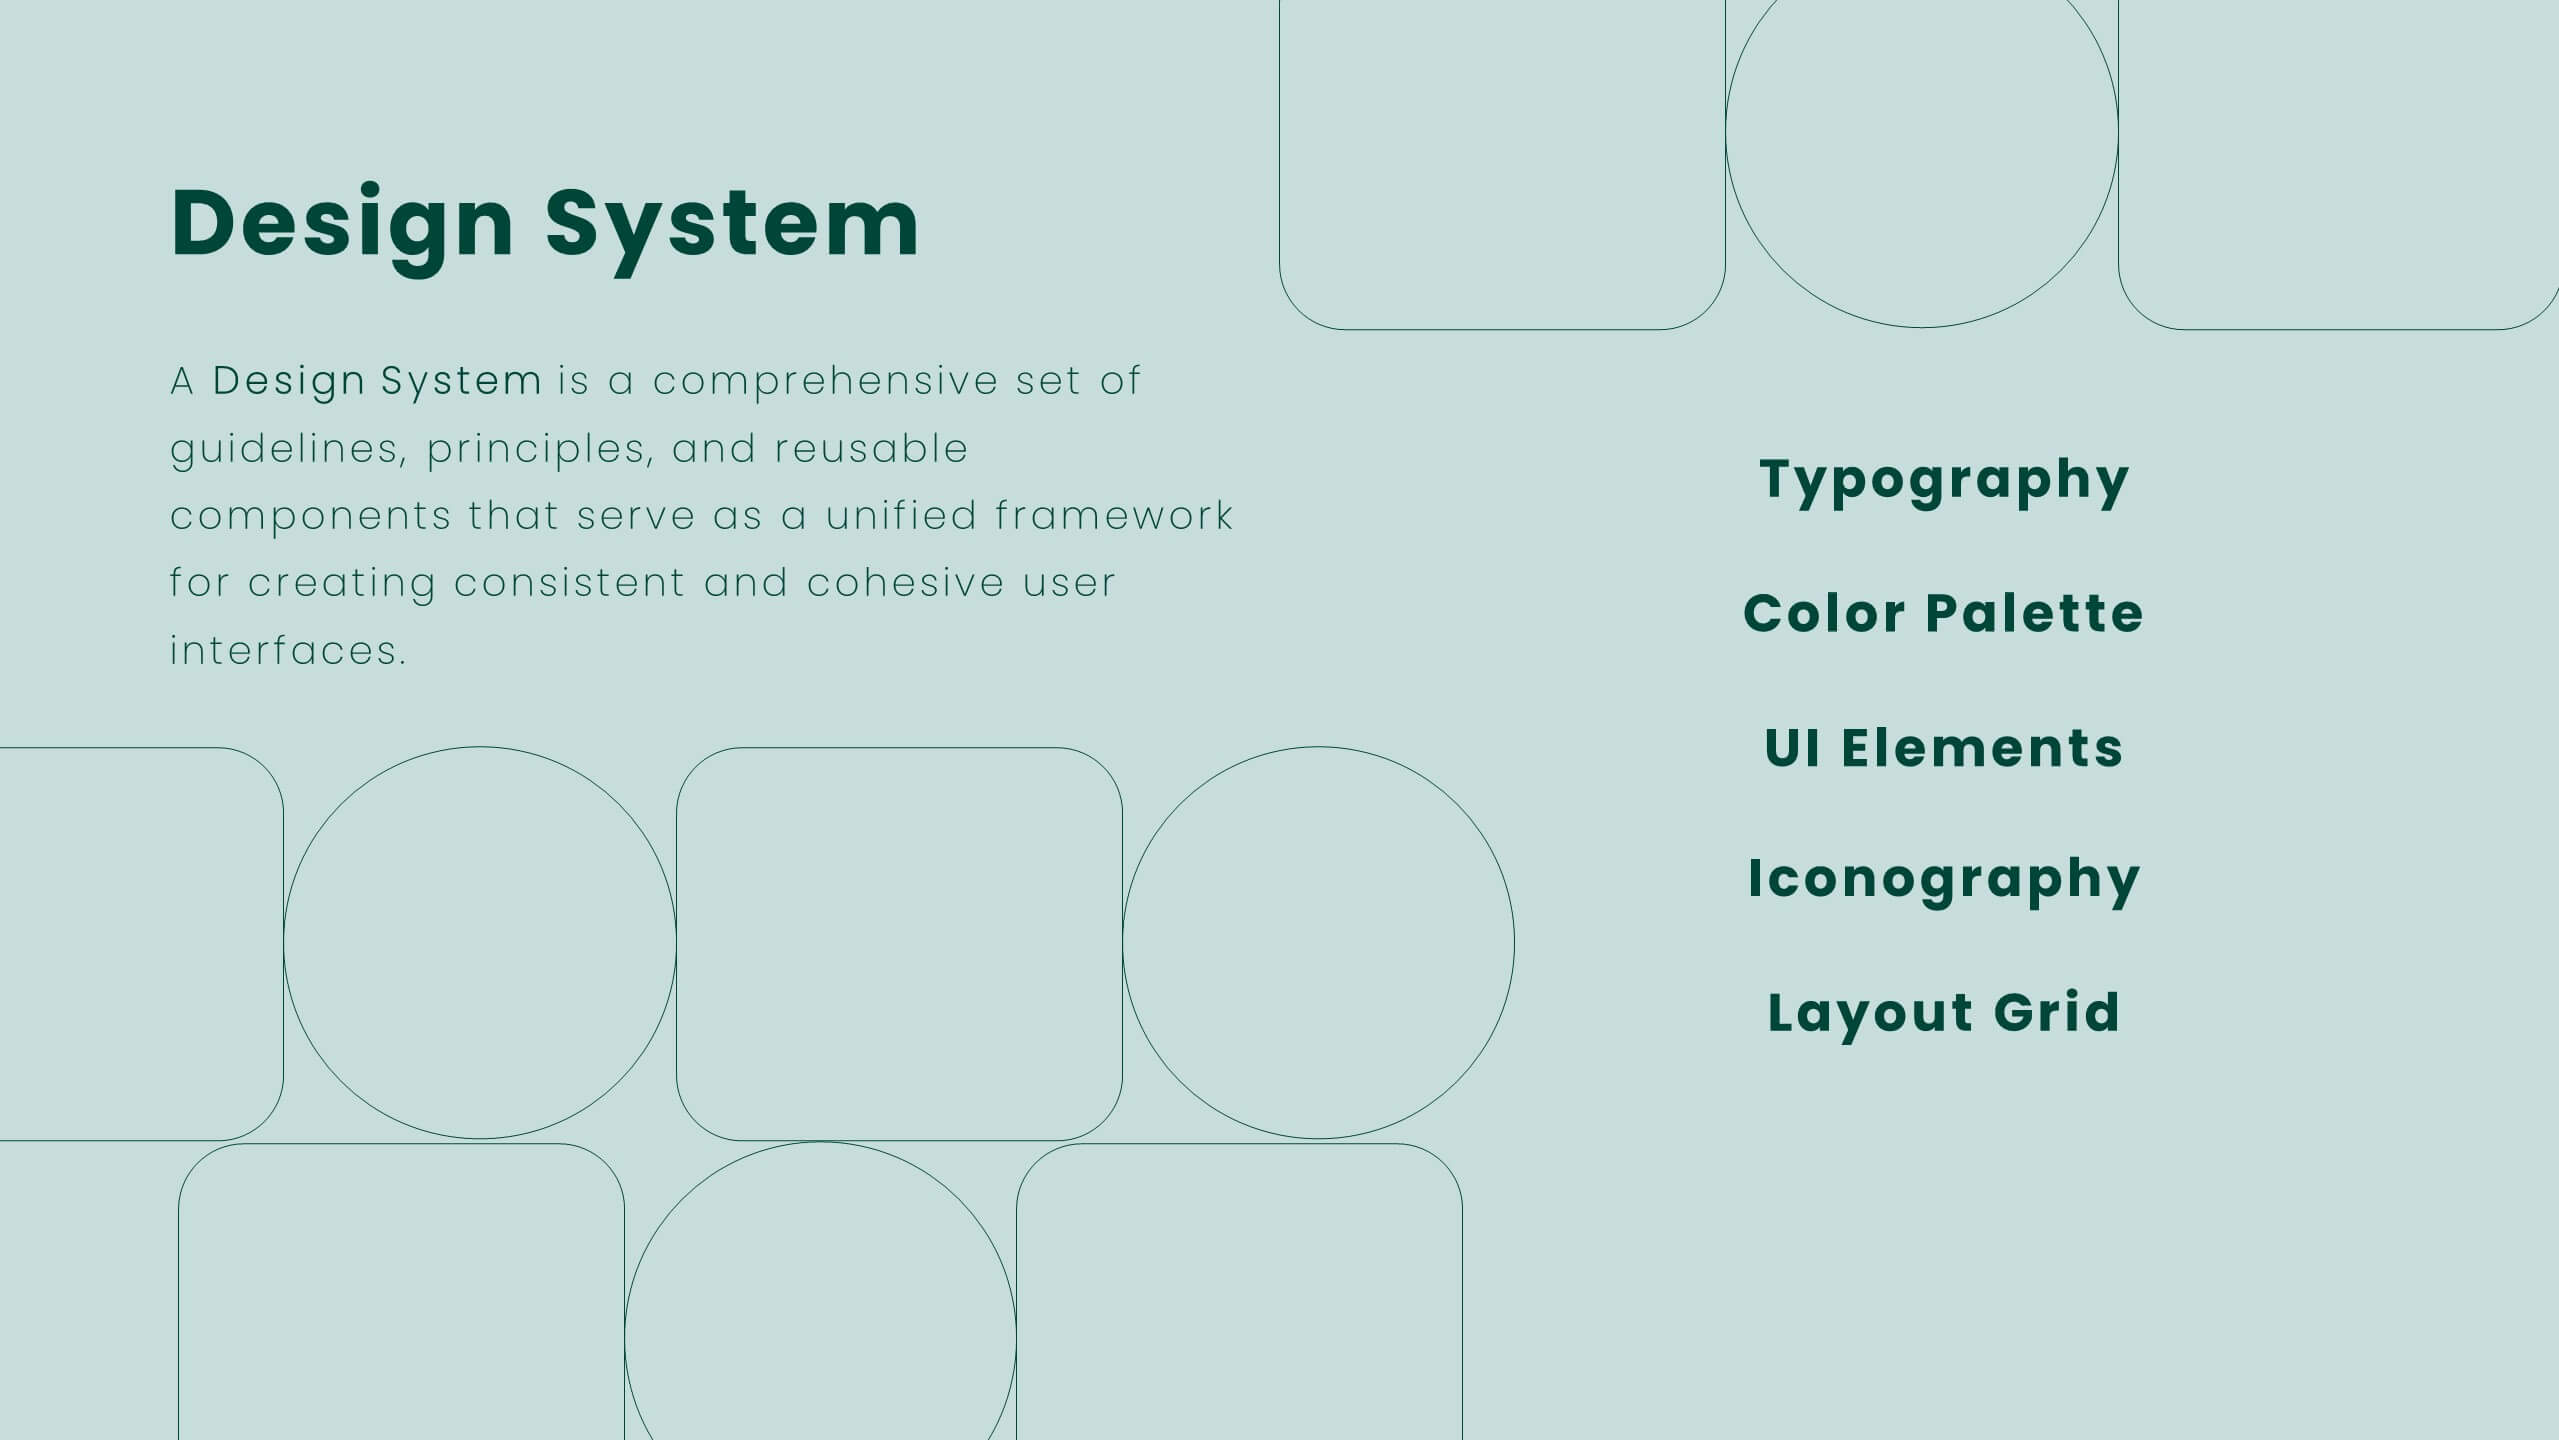
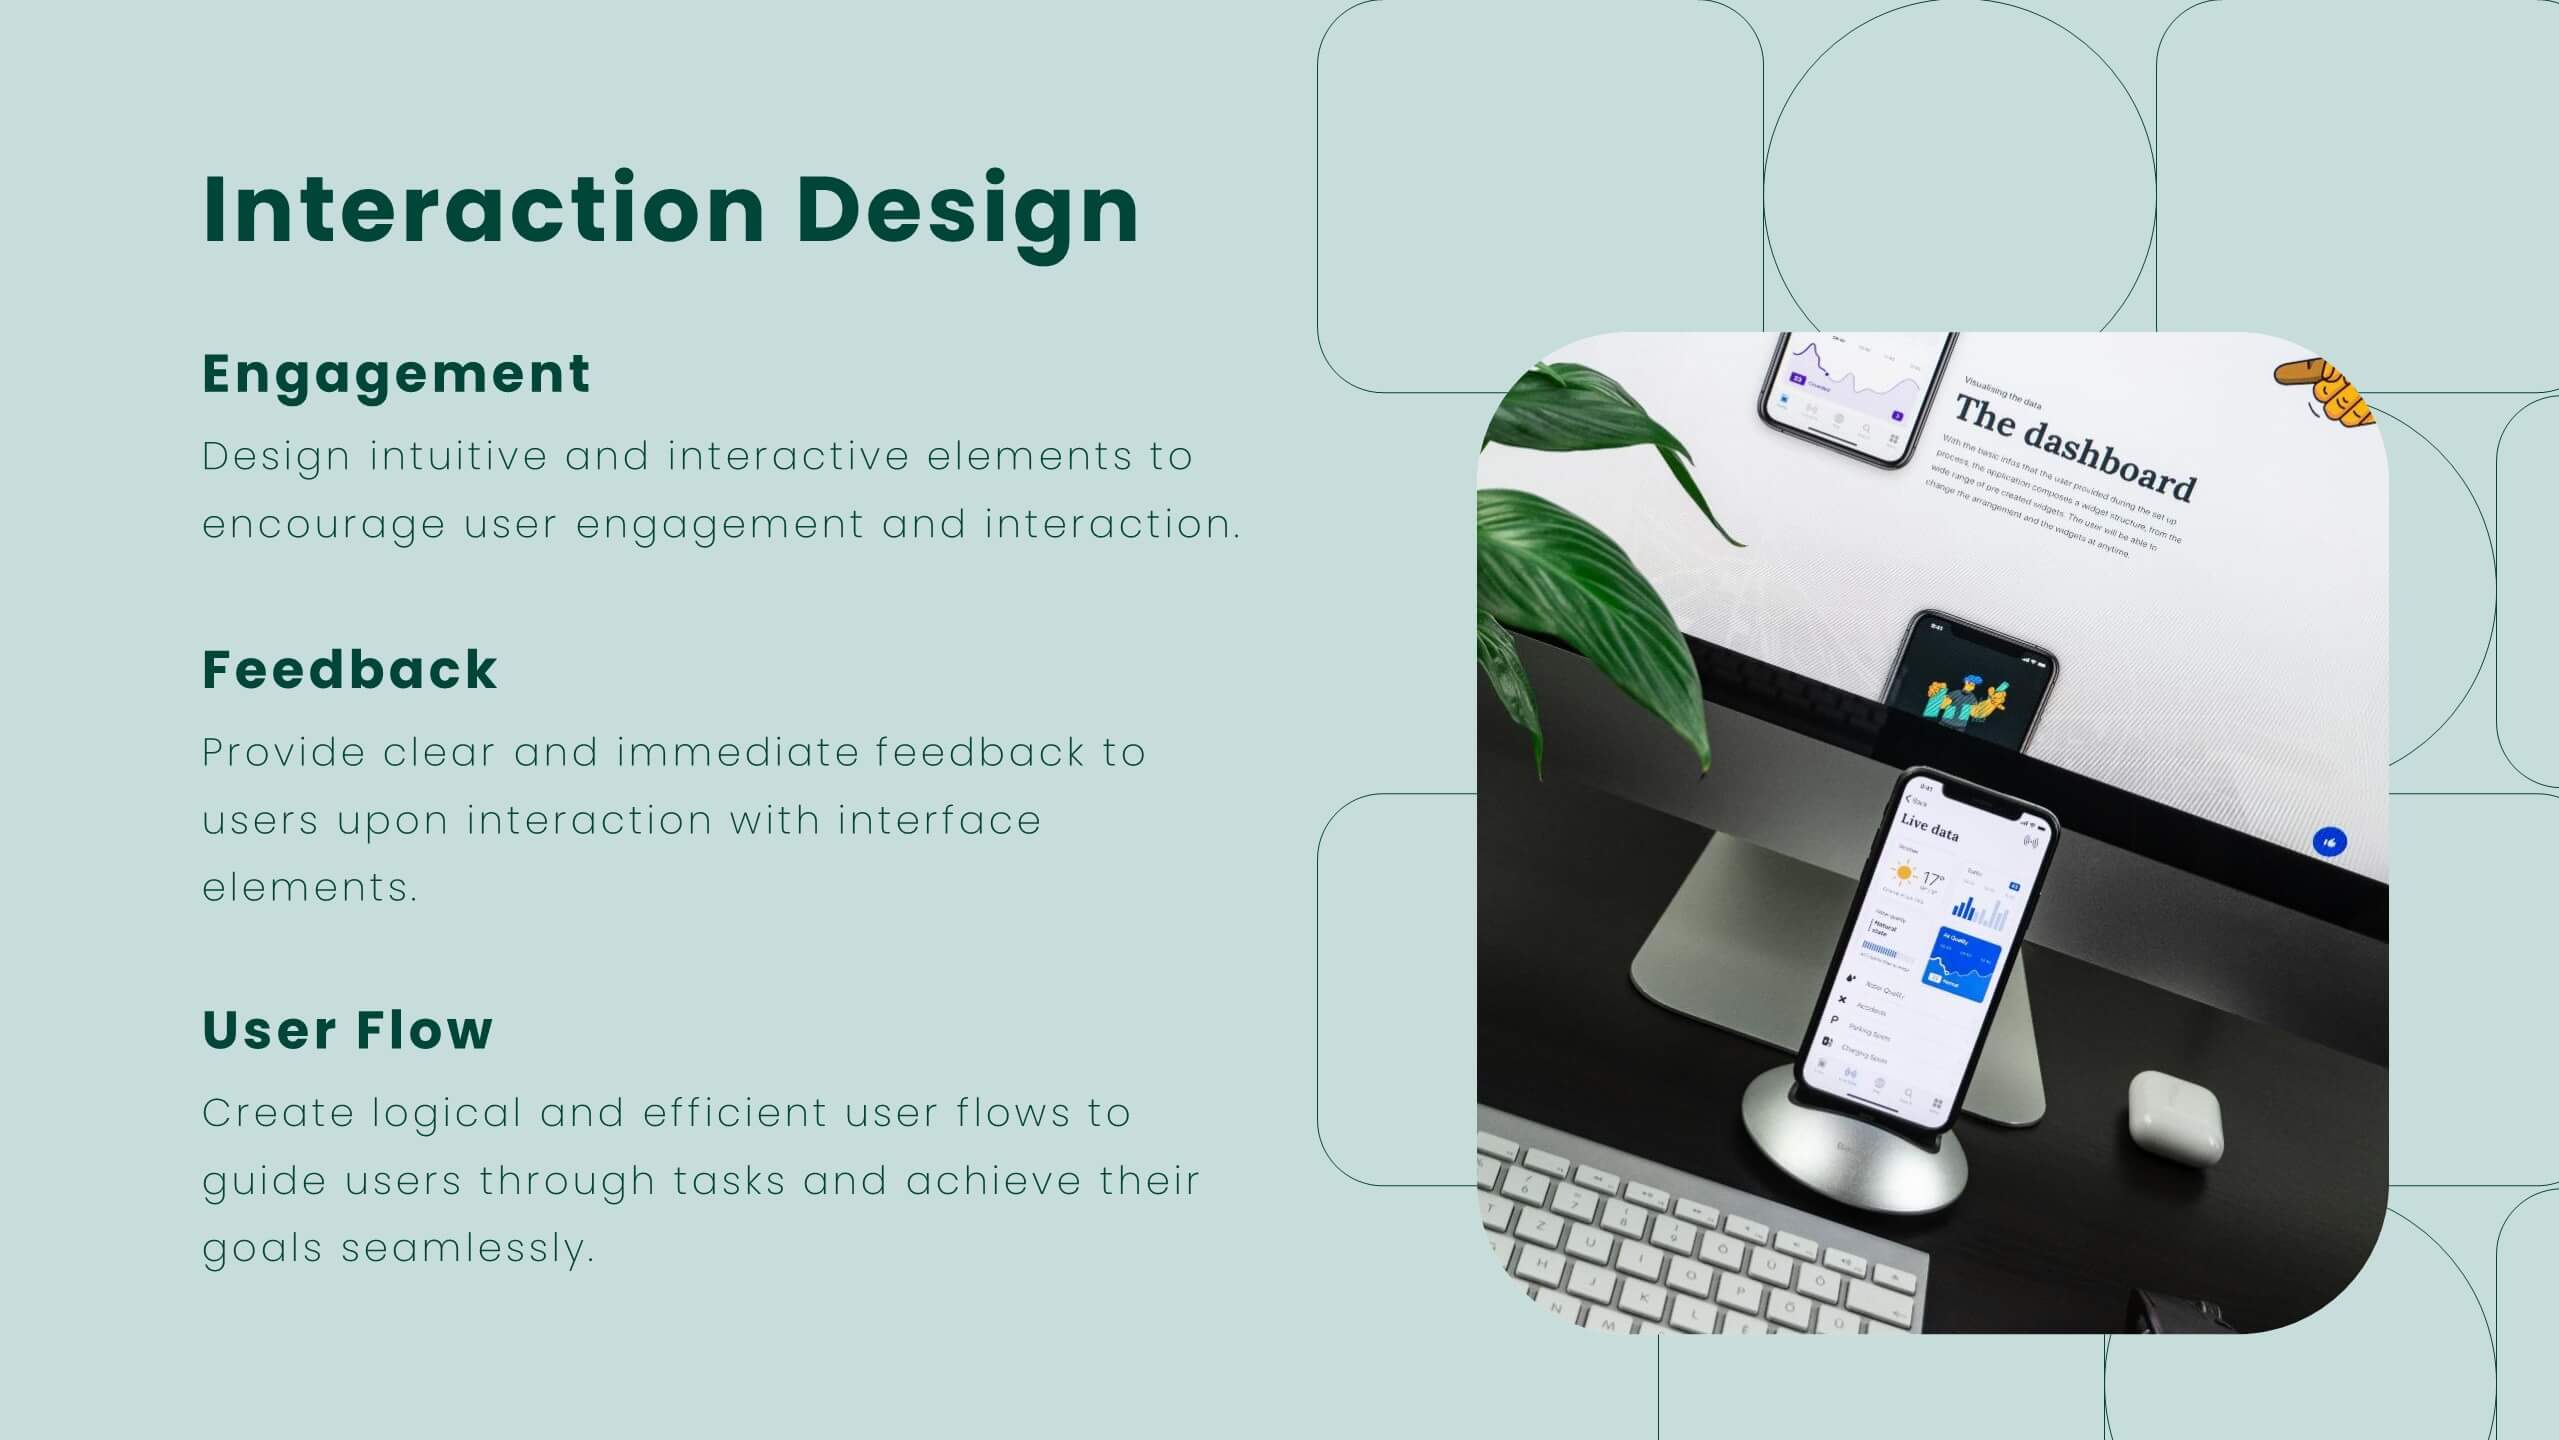
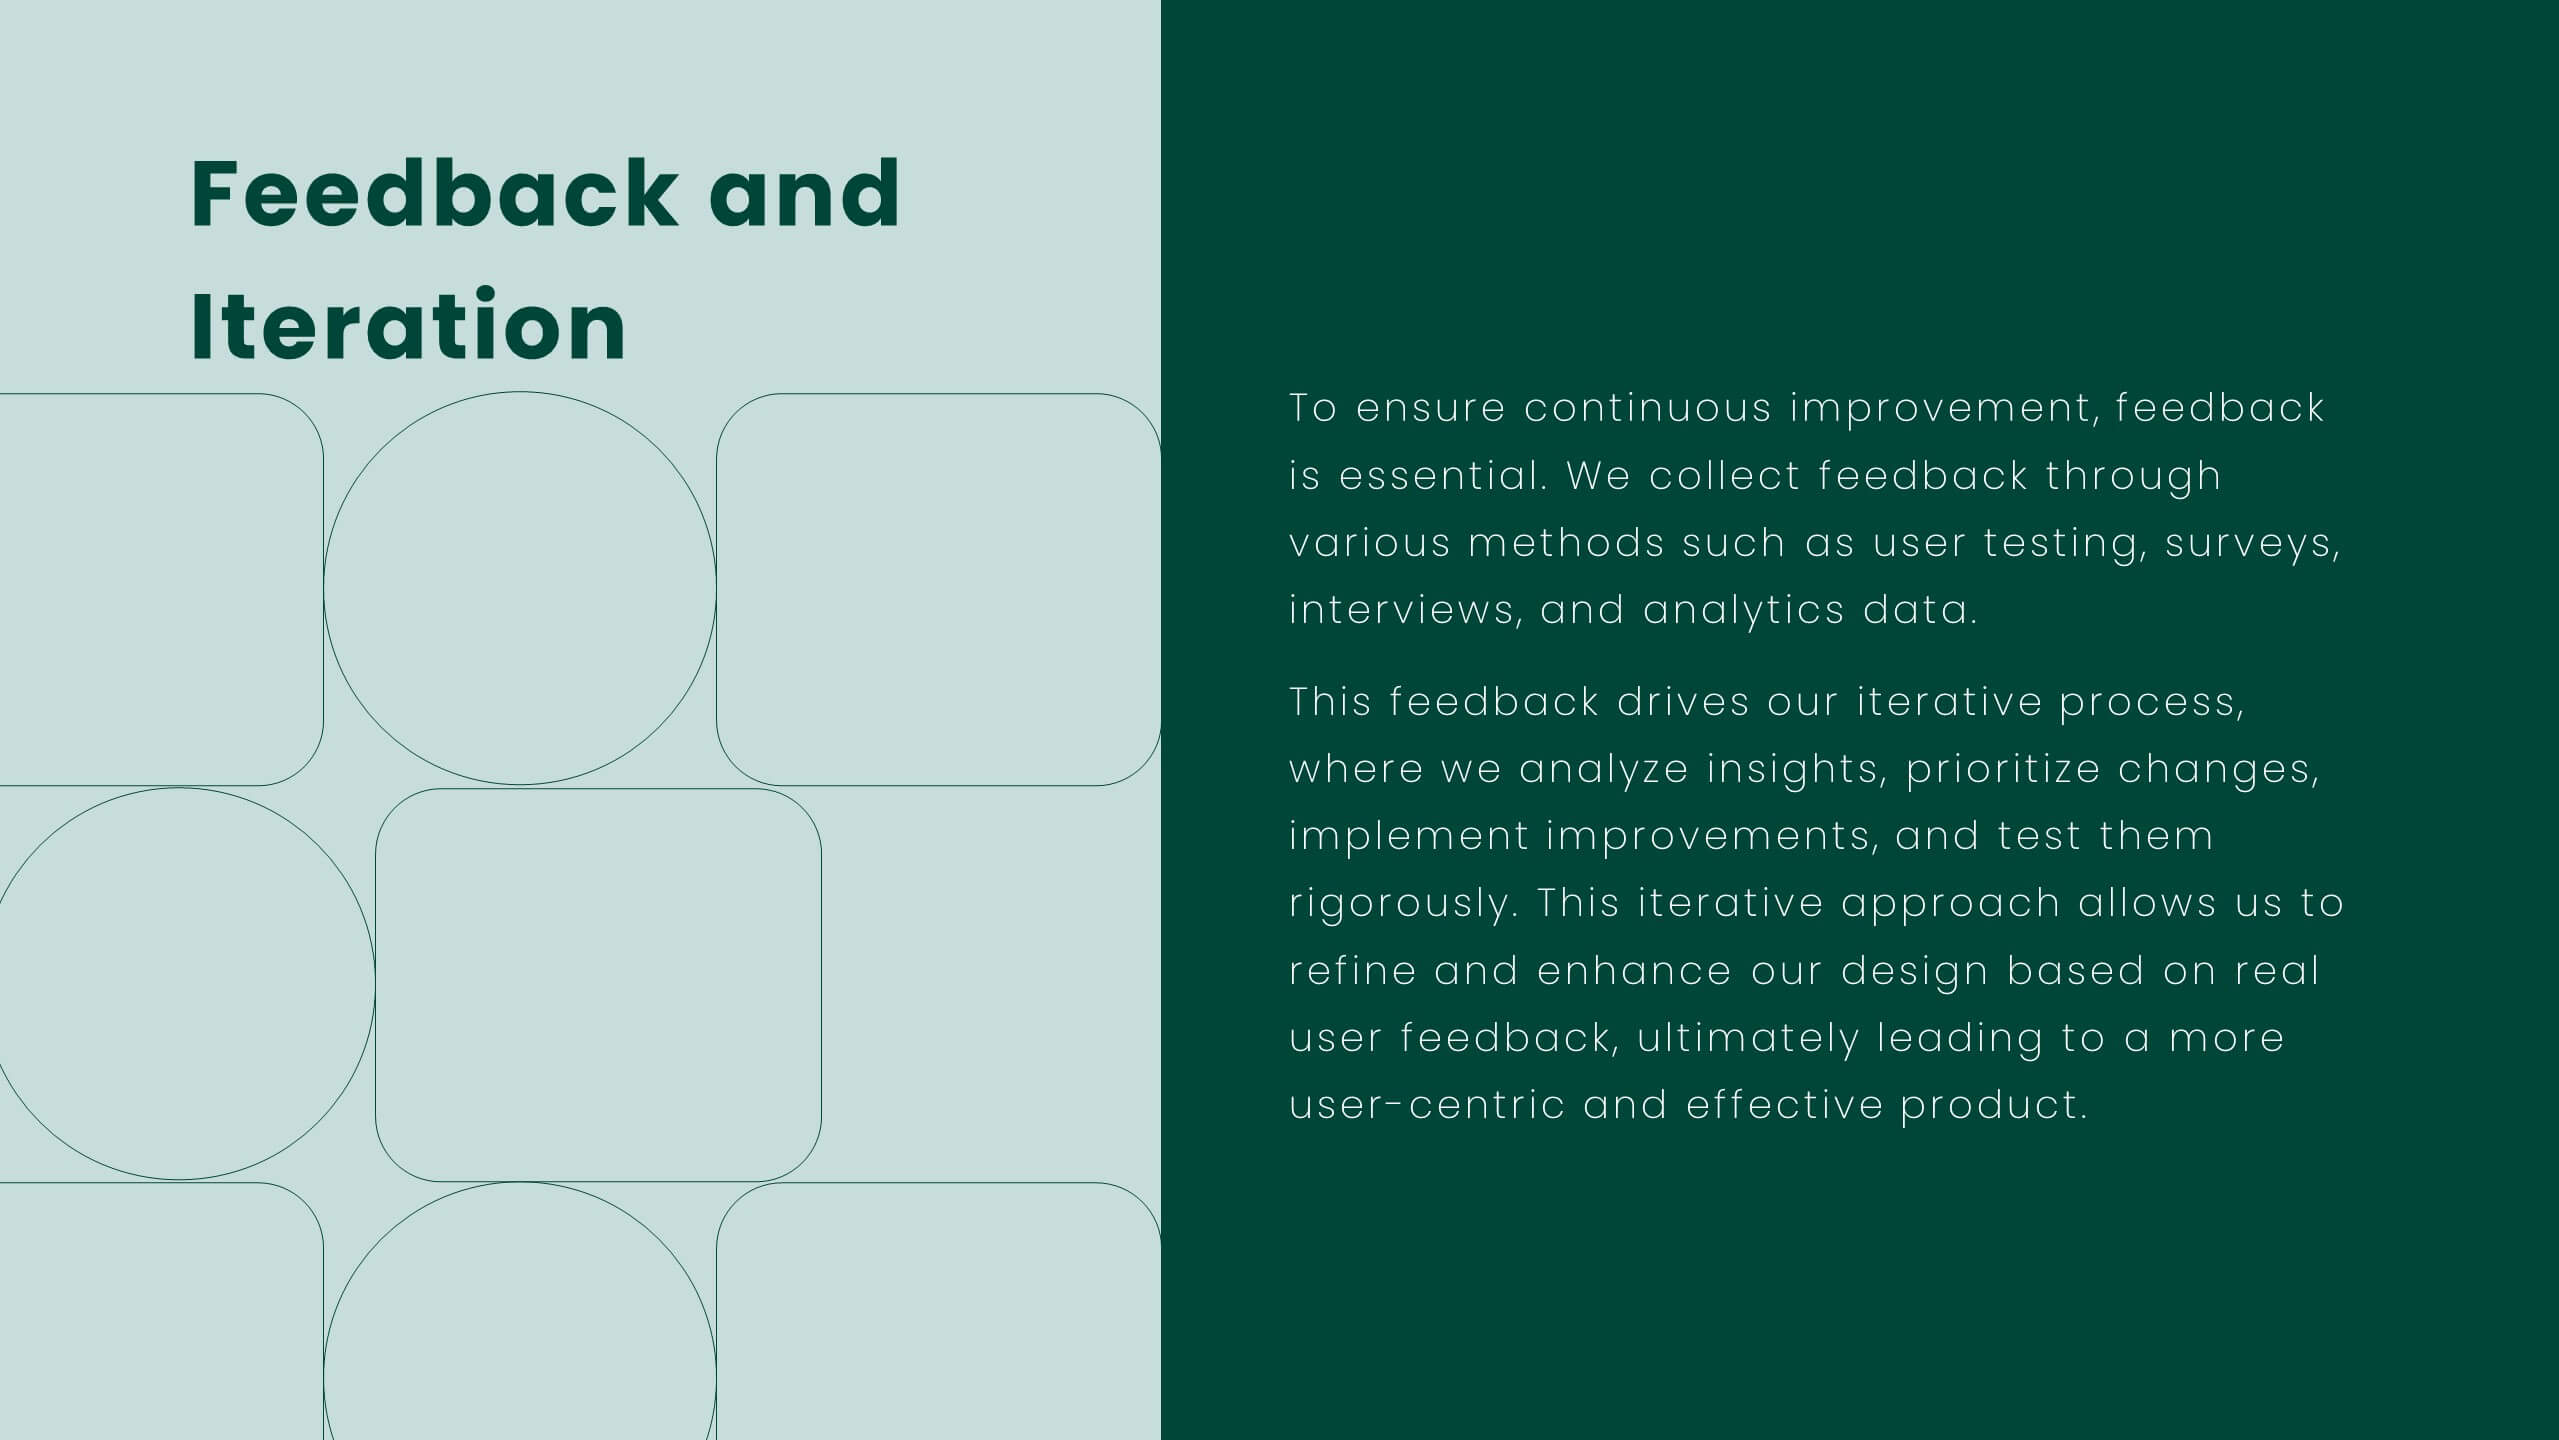
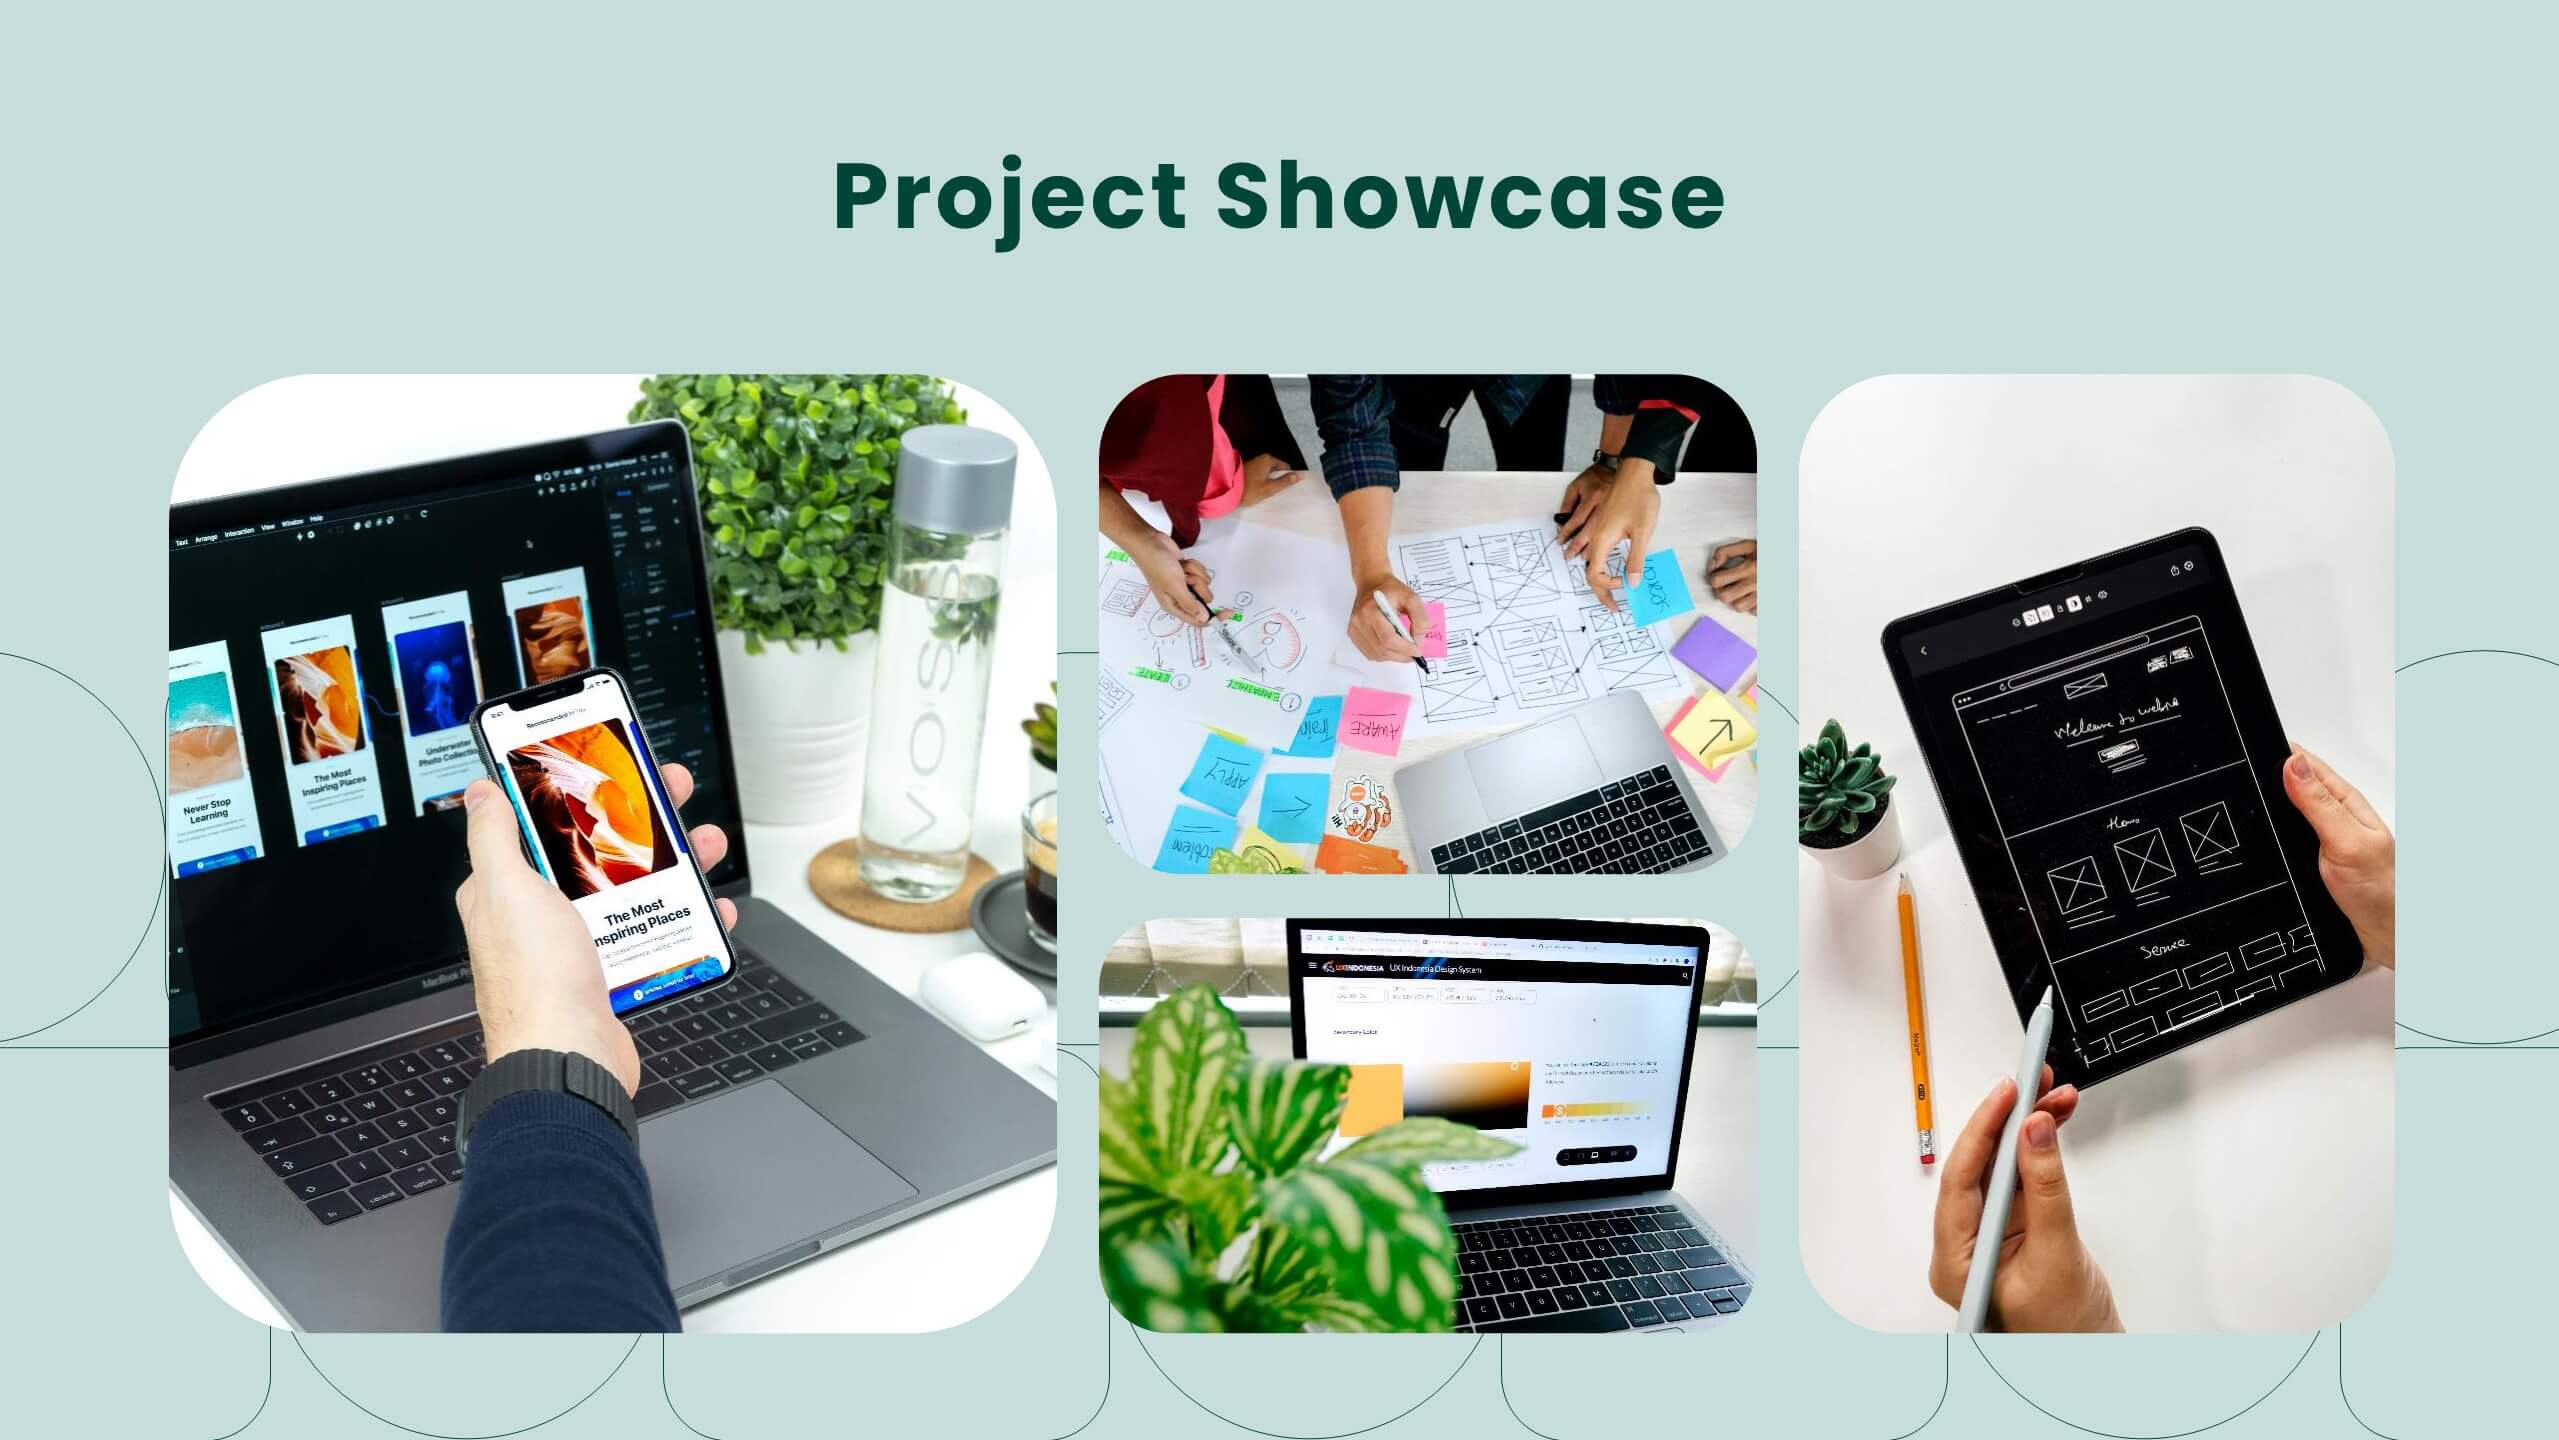
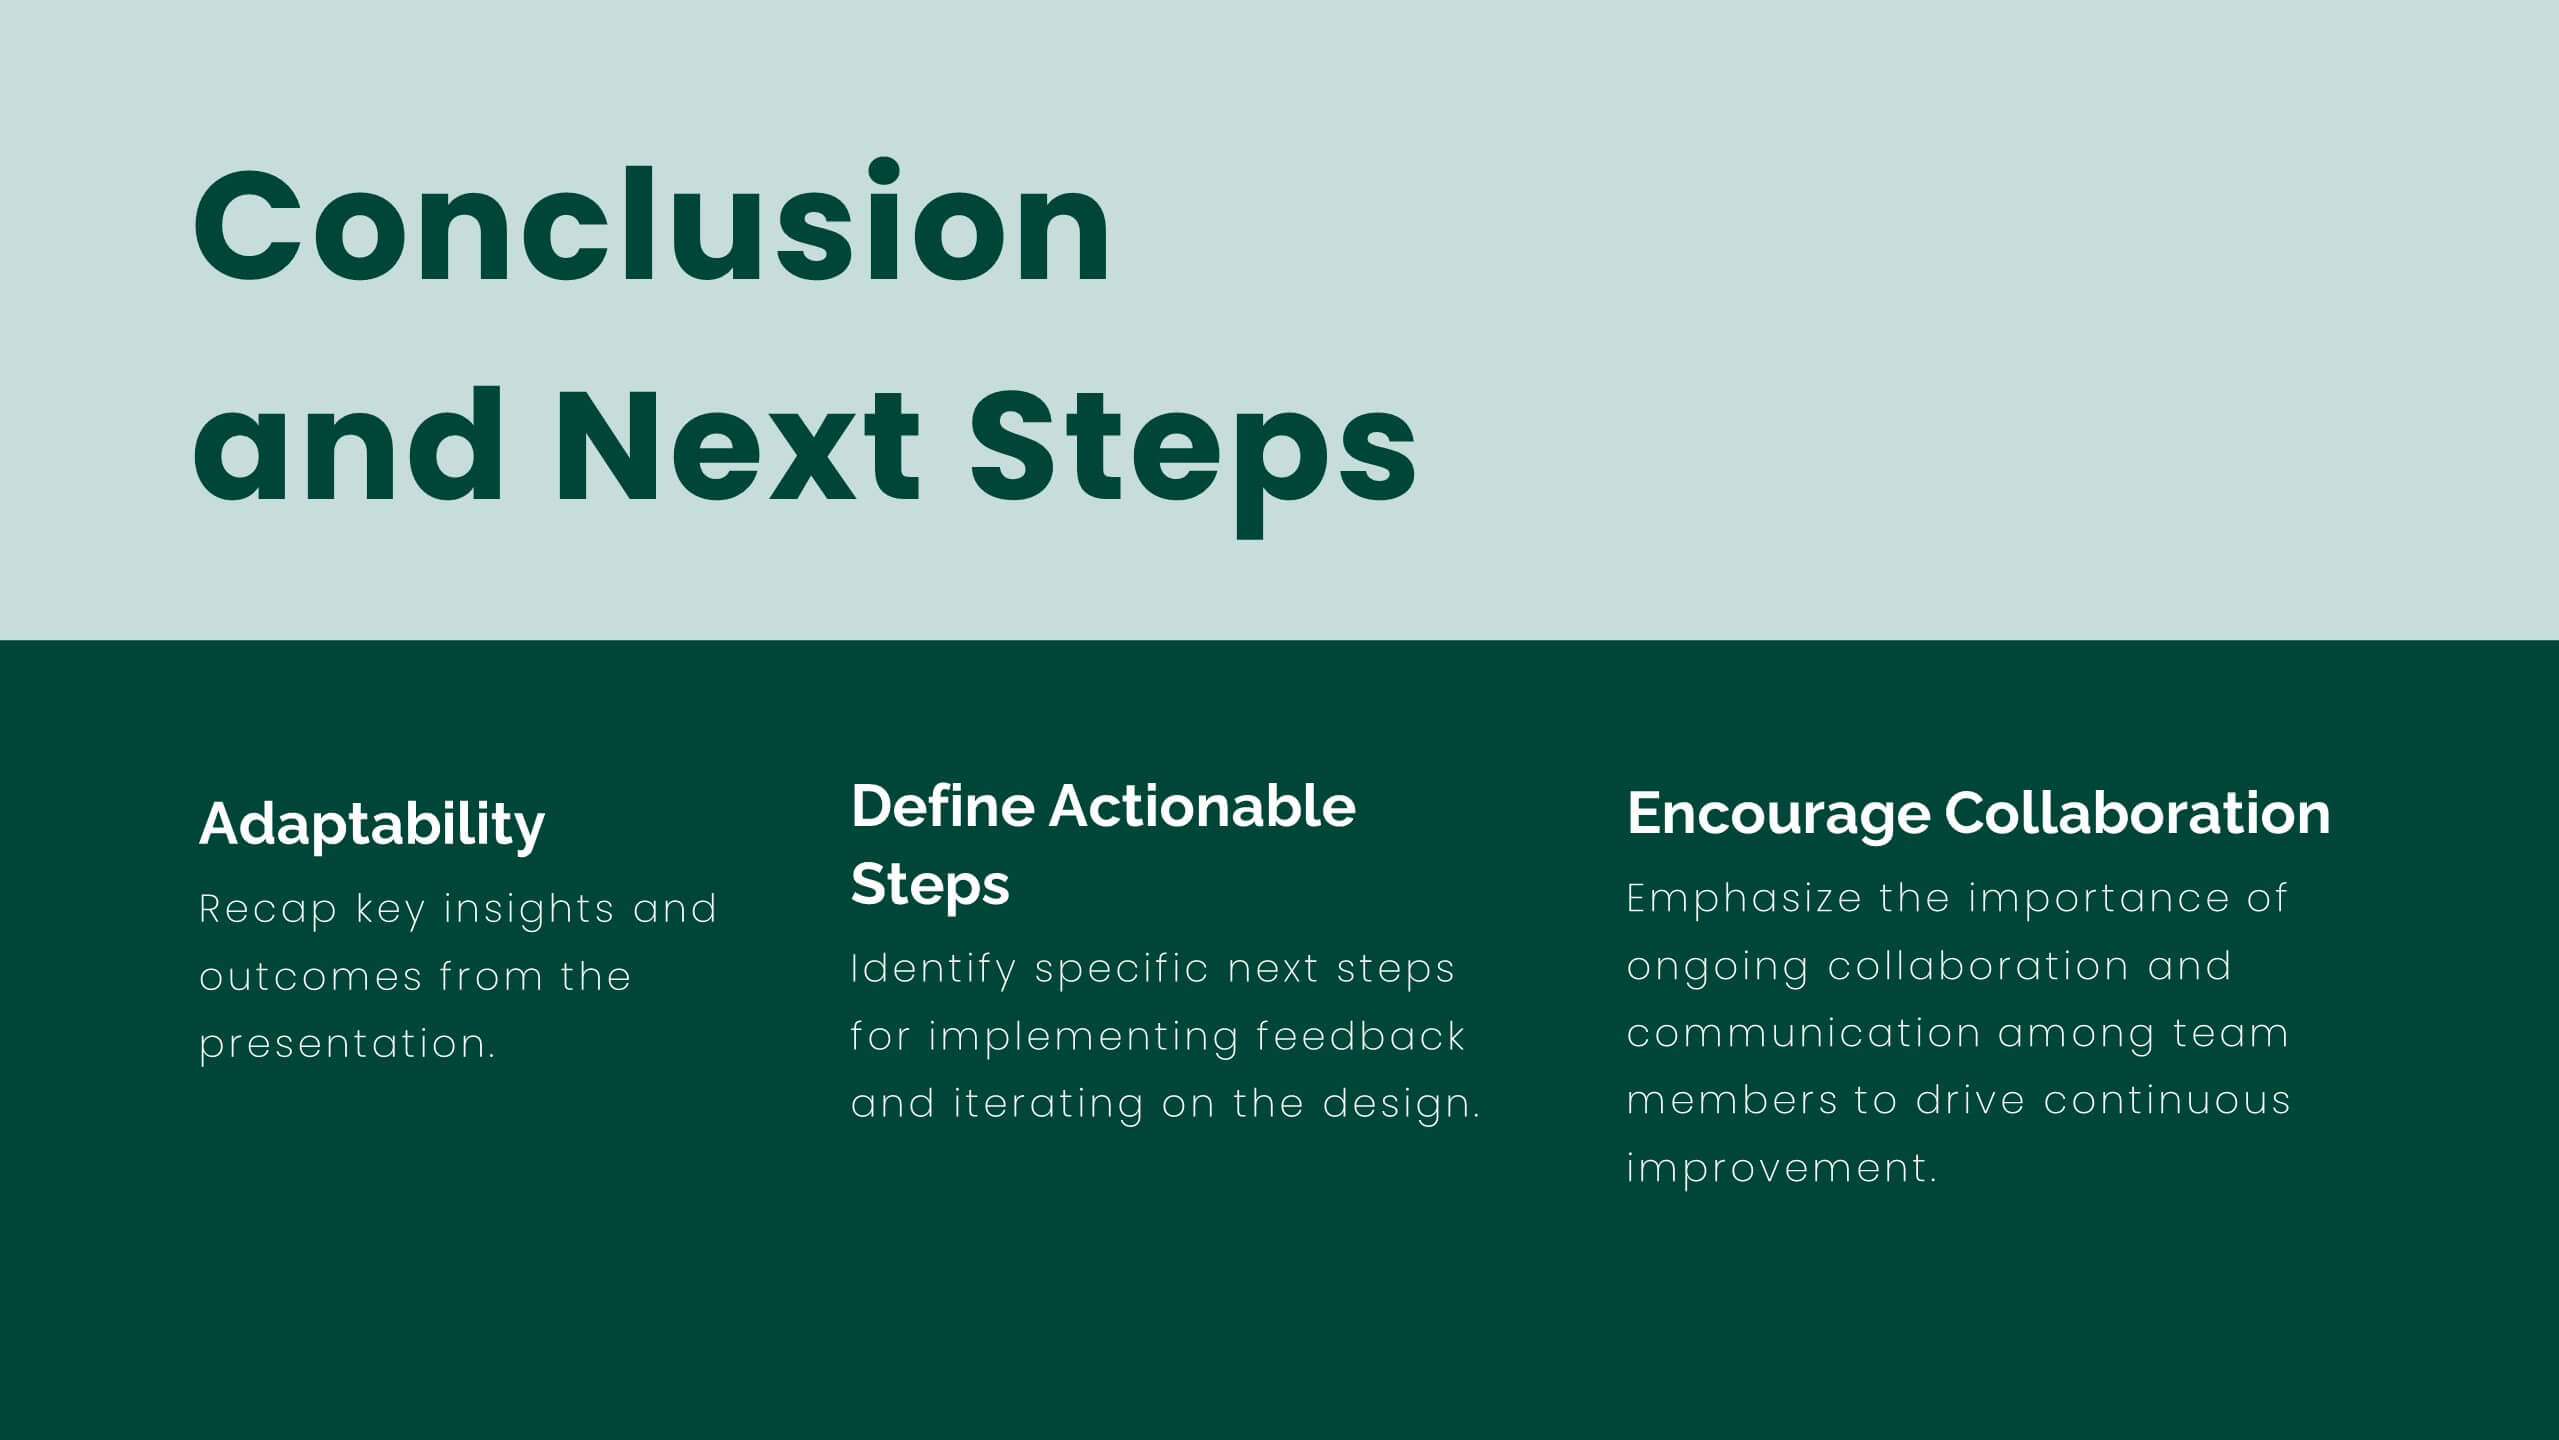
Lumina UX Case Study Presentation
Create compelling UX case studies with this modern template. Cover user research, personas, wireframes, and prototyping. Perfect for showcasing UI design principles, responsive design, and usability guidelines. Highlight feedback, iteration, and project showcase. Compatible with PowerPoint, Keynote, and Google Slides. Elevate your UX presentations and impress stakeholders with clear, detailed insights.


7 diapositivas
Important Stats and Metrics by Numbers Presentation
Display key metrics with impact using this modern numeric infographic layout. Ideal for summarizing performance statistics, benchmarks, or data highlights across six categories. The circular markers and bold percentages enhance readability and focus. Fully editable in Canva—perfect for business reviews, investor decks, or analytical presentations that demand clarity.


5 diapositivas
Benefits of Yoga Infographics
Yoga offers a wide range of benefits for the mind, body, and overall well-being, these also tend to deepen with regular practice. These infographic templates highlight the numerous advantages of practicing yoga. Whether you're a yoga instructor, wellness coach, or health enthusiast, this template provides a comprehensive overview of the physical, mental, and emotional benefits of yoga. The infographics include text boxes, illustrations, and graphs that can be used to promote the advantages of incorporating yoga into one's lifestyle. Compatible with Powerpoint, Keynote, and Google Slides, these are easily customizable.


5 diapositivas
Professional Relationship Network Presentation
Map out key business connections using this Professional Relationship Network template. Ideal for showcasing client relationships, internal team dynamics, or communication hierarchies. This clean, modern design helps clarify roles and links across stakeholders. Fully editable and compatible with PowerPoint, Keynote, and Google Slides for flexible use in any setting.


6 diapositivas
Business Process Flowchart Presentation
Streamline your workflow with the Business Process Flowchart presentation. This structured and visually engaging template helps you map out processes, optimize efficiency, and improve communication within your team. Designed for business analysts, managers, and strategists, this fully editable slide ensures clarity in decision-making and operations. Compatible with PowerPoint, Keynote, and Google Slides.


4 diapositivas
Healthcare Medical Infographic Presentation
Bring your healthcare insights to life with a clean, calming design that makes complex medical data easy to follow. This presentation highlights key health metrics, patient information, and wellness topics using simple visuals and structured layouts for clarity. Fully compatible with PowerPoint, Keynote, and Google Slides.


2 diapositivas
Modern Business Title Slide Presentation
Step into the future of presentations with the "Modern Business Slide," designed to make your corporate message shine. This template features a sleek, minimalist layout with bold typography and a striking visual of a stylish office setting, perfect for making a professional impact. Ideal for any business presentation, it's compatible with PowerPoint, Keynote, and Google Slides, ensuring versatility across different platforms.


5 diapositivas
Problem Statement Slide Presentation
Kick off your presentation with a bold, curiosity-driven slide that clearly defines the challenge your team aims to solve. This layout helps you outline key points, clarify project direction, and focus decision-making with clarity and impact. Fully compatible with PowerPoint, Keynote, and Google Slides.


5 diapositivas
Financial Budget Infographics
Financial goals refer to specific objectives and targets that individuals or businesses set to manage their finances effectively and achieve financial success. These vertical infographics are designed to help individuals and businesses effectively present their financial budgets and plans. Whether you're a financial analyst or a business owner, this template is perfect for conveying complex financial information in a clear and concise manner. These infographics provide an overview of the budget, showcasing key financial goals, total income, and total expenses. This features visuals to help users set and track financial goals.


6 diapositivas
Enterprise Loyalty Program Infographic
A loyalty program is a structured marketing strategy designed to encourage customers to continue doing business with a company or brand by offering various incentives, rewards, and benefits for their ongoing loyalty and repeat purchases. This infographic template is a visual representation of the key components, benefits, and features of a loyalty program designed for a large-scale business or enterprise. This template visually conveys the value of the program, encourages participation, and showcases the benefits that customers can enjoy by becoming loyal members. This is compatible with Powerpoint, Keynote, and Google Slides.


10 diapositivas
5 Step Business Growth Presentation
The "5 Step Business Growth Presentation" template is designed to clearly depict progressive strategies in business development. Featuring a visually engaging staircase-style layout, this infographic effectively guides viewers through sequential stages, making it perfect for presentations that outline growth phases or strategic processes. Each step is color-coded and provides sufficient space to elaborate on key points, ensuring clarity and emphasis on important data. Ideal for use in business strategy meetings or any setting requiring a structured presentation of development stages, this template is versatile and compatible with various presentation platforms, enhancing the visual appeal and comprehension of your message.


7 diapositivas
Performance Summary Infographic
Boost your reporting capabilities with our Infographic Templates, designed to deliver exceptional clarity and impact. This series is perfectly suited for professionals seeking to present performance data compellingly and concisely. With a variety of designs including radial graphs, tiered lists, and comparative bars, these templates allow for an informative and aesthetically pleasing showcase of critical metrics. Each template is customizable, letting you adjust the color schemes and text to fit your corporate style, enhancing both visual appeal and brand consistency. Whether used in PowerPoint, Google Slides, or Keynote, these tools are vital for anyone looking to articulate achievements, assess comparative results, and plan based on solid data insights. They are indispensable for consultants, managers, and team leaders who require clear, persuasive presentation resources to drive decisions and highlight successes.