


Características


¿Tienes alguna pregunta?
Recomendar


4 diapositivas
Visual Decision-Making with Harvey Balls
Make smart decisions faster with this clean and strategic Harvey Balls layout. Ideal for comparing key business factors or project options, this slide helps illustrate progress and priorities through four percentage-based visuals. Fully customizable in PowerPoint, Keynote, and Google Slides.


6 diapositivas
Fishbone Concept Infographic
Dissect complex issues with our Fishbone Concept Infographic, ideal for Powerpoint, Google Slides, and Keynote. This infographic, also known as the Ishikawa or cause-and-effect diagram, is designed for problem-solving and root cause analysis. This template features a series of branching arrows leading to a central spine, enabling you to map out multiple cause-and-effect relationships. Each ‘bone’ represents a category of causes that you can customize to fit your specific analysis needs. With this fishbone infographic, you can effectively organize and present complex data, making it easier for your audience to understand and engage with the content of your presentation.


7 diapositivas
Continuing Education Infographic
Enhance your educational presentations with our continuing education infographic template. This captivating and informative template allows you to present complex educational data in a visually appealing and easily understandable manner. Fully customizable and compatible with Powerpoint, Keynote, and Google Slides. Showcase different educational paths with icons or visuals to illustrate the journey of a student. This infographic will transform educational data into an engaging and informative visual story, providing valuable insights into the world of learning and education.


22 diapositivas
Radiance UX Research Report Presentation
This engaging UX research report template is designed to captivate your audience! With sections like user research, journey mapping, prototyping, and testing, it showcases the entire UX process effortlessly. Fully customizable and compatible with PowerPoint, Keynote, and Google Slides, this template is perfect for presenting your design insights with professionalism and flair.


21 diapositivas
Veridian Agile Project Plan Presentation
Streamline your project management with this agile project plan template, featuring deliverables, timeline, resource allocation, and quality assurance. Ideal for agile teams, it helps in tracking progress and managing risks efficiently. Compatible with PowerPoint, Keynote, and Google Slides, ensuring seamless and impactful presentations.


6 diapositivas
International Breast Cancer Day Infographics
Celebrate International Breast Cancer Day with our customizable infographic template, designed to raise awareness and share vital information about breast cancer. This template is fully compatible with popular presentation software such as PowerPoint, Keynote, and Google Slides, allowing you to easily personalize it to convey your unique message. The International Breast Cancer Day infographic template serves as a versatile canvas for displaying facts, statistics, prevention methods, and support resources related to breast cancer. Whether you're a healthcare professional, advocate, or someone passionate about promoting breast health, this template offers a user-friendly platform to create informative presentations and awareness materials. Make an impact with this SEO-optimized International Breast Cancer Day infographic template, meticulously crafted for clarity and ease of use. Customize it to share stories of survivors, highlight the importance of early detection, and spread the message of hope and support. Start creating your personalized infographic to contribute to the cause today!


21 diapositivas
Astral Startup Business Plan Presentation
This sleek and professional Startup Business Plan template is designed to help you convey your startup’s potential to investors and stakeholders effectively. With a minimalist design and a structured flow, it covers all essential aspects of your business plan, from mission and vision to financial overview and growth plan. Each slide is crafted to present critical information in a clear and concise manner, making it easier for your audience to grasp the key points. This template is fully compatible with PowerPoint, Keynote, and Google Slides, allowing you to customize it to suit your branding and presentation style. Use this template to create a compelling and impactful presentation that will leave a lasting impression on your audience.


6 diapositivas
Modern Treatment Plans in Medicine Presentation
Highlight six key elements of your healthcare strategy with the Modern Treatment Plans in Medicine Presentation. This clean, grid-style layout uses pill-shaped icons and vibrant colors to present treatments, initiatives, or categories. Ideal for breaking down complex medical plans. Fully customizable in Canva, PowerPoint, Keynote, and Google Slides.


5 diapositivas
Marijuana Cultivation Infographics
Marijuana cultivation refers to the process of growing and cultivating marijuana plants for various purposes, primarily for medicinal or recreational use. These vertical infographics are designed to provide essential information about the cultivation of marijuana. It offers an in-depth overview of the cultivation process, growing techniques, equipment, and best practices. The template outlines the step-by-step cultivation process of marijuana, starting from seed germination to harvesting and drying. It includes visuals and icons to illustrate each stage, making it easy to understand for beginners and everyone.


6 diapositivas
Environmental Protection and Ecology Plan Presentation
Highlight your green initiatives with the Environmental Protection and Ecology Plan Presentation. Featuring a lightbulb-leaf graphic, this template helps you present sustainability goals, eco strategies, and key action steps clearly. Ideal for environmental reports, proposals, or educational content. Fully customizable in Canva, PowerPoint, or Google Slides.


21 diapositivas
Duskflare Corporate Strategy Proposal Presentation
Present your corporate strategy effectively with this comprehensive template, featuring sections on market trends, SWOT analysis, strategic initiatives, and risk management. Designed for clarity and impact, it’s ideal for outlining high-level goals and action plans. Compatible with PowerPoint, Keynote, and Google Slides for seamless presentations.


21 diapositivas
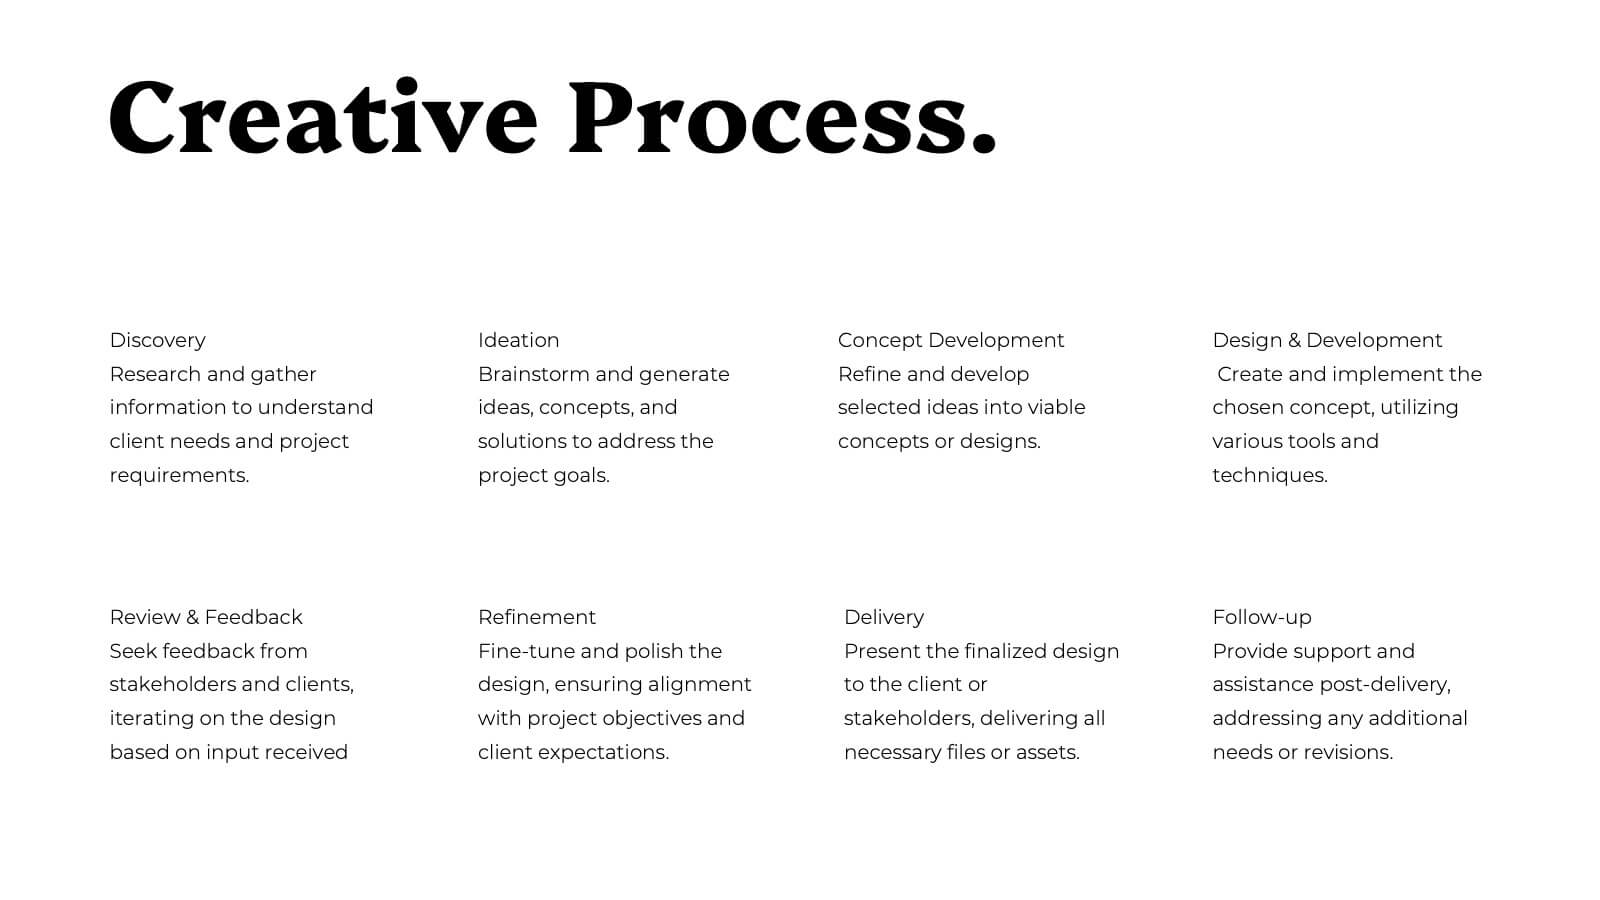
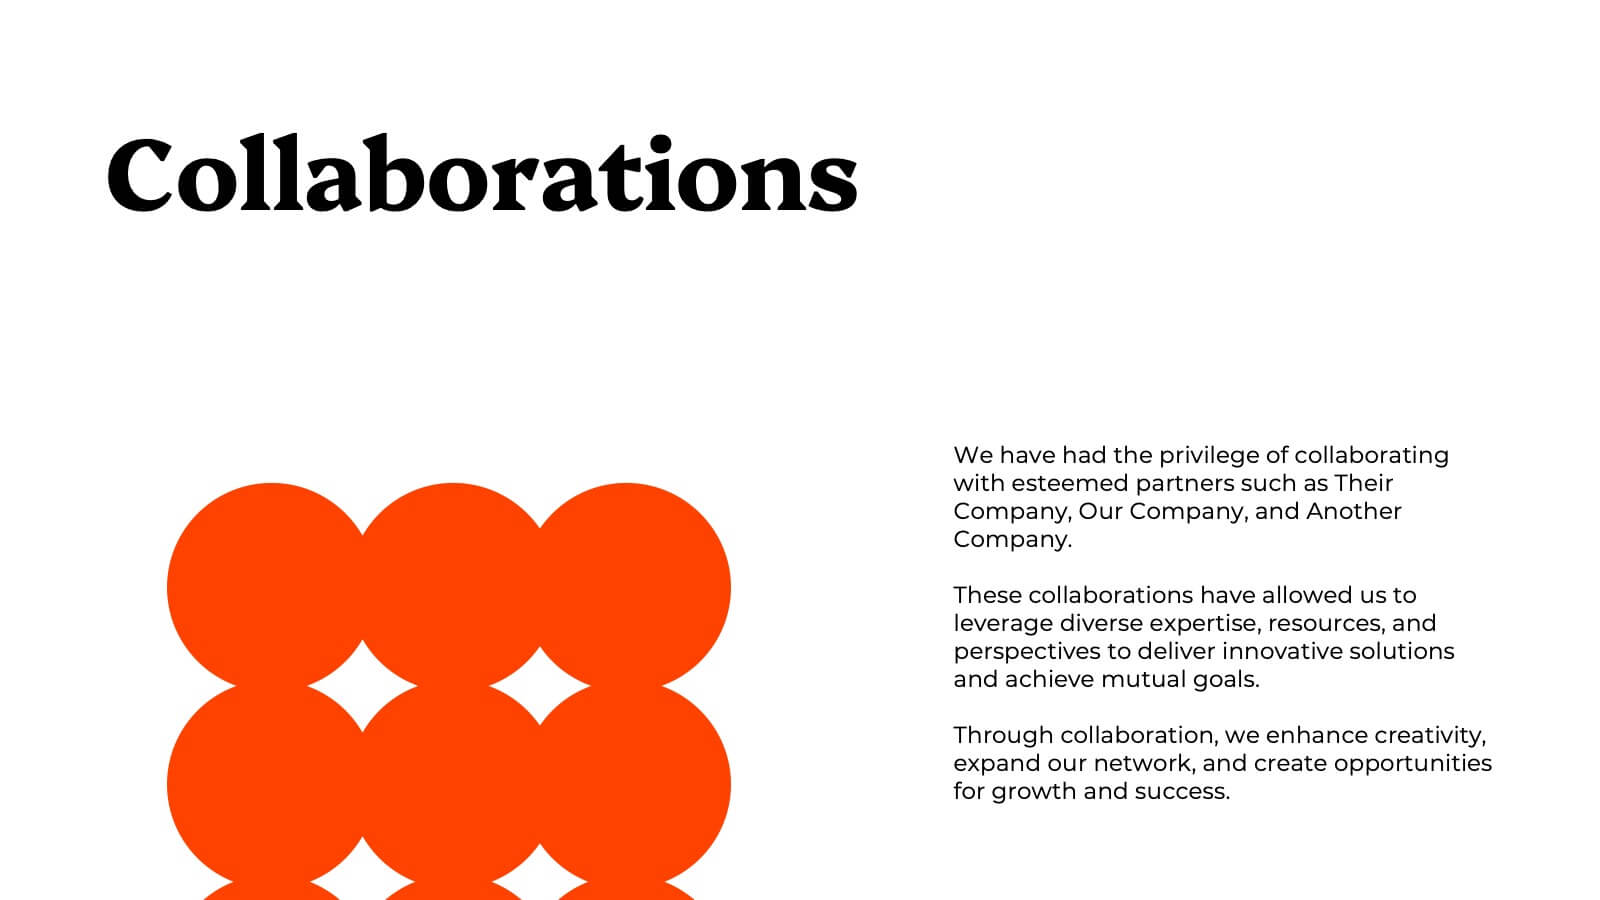
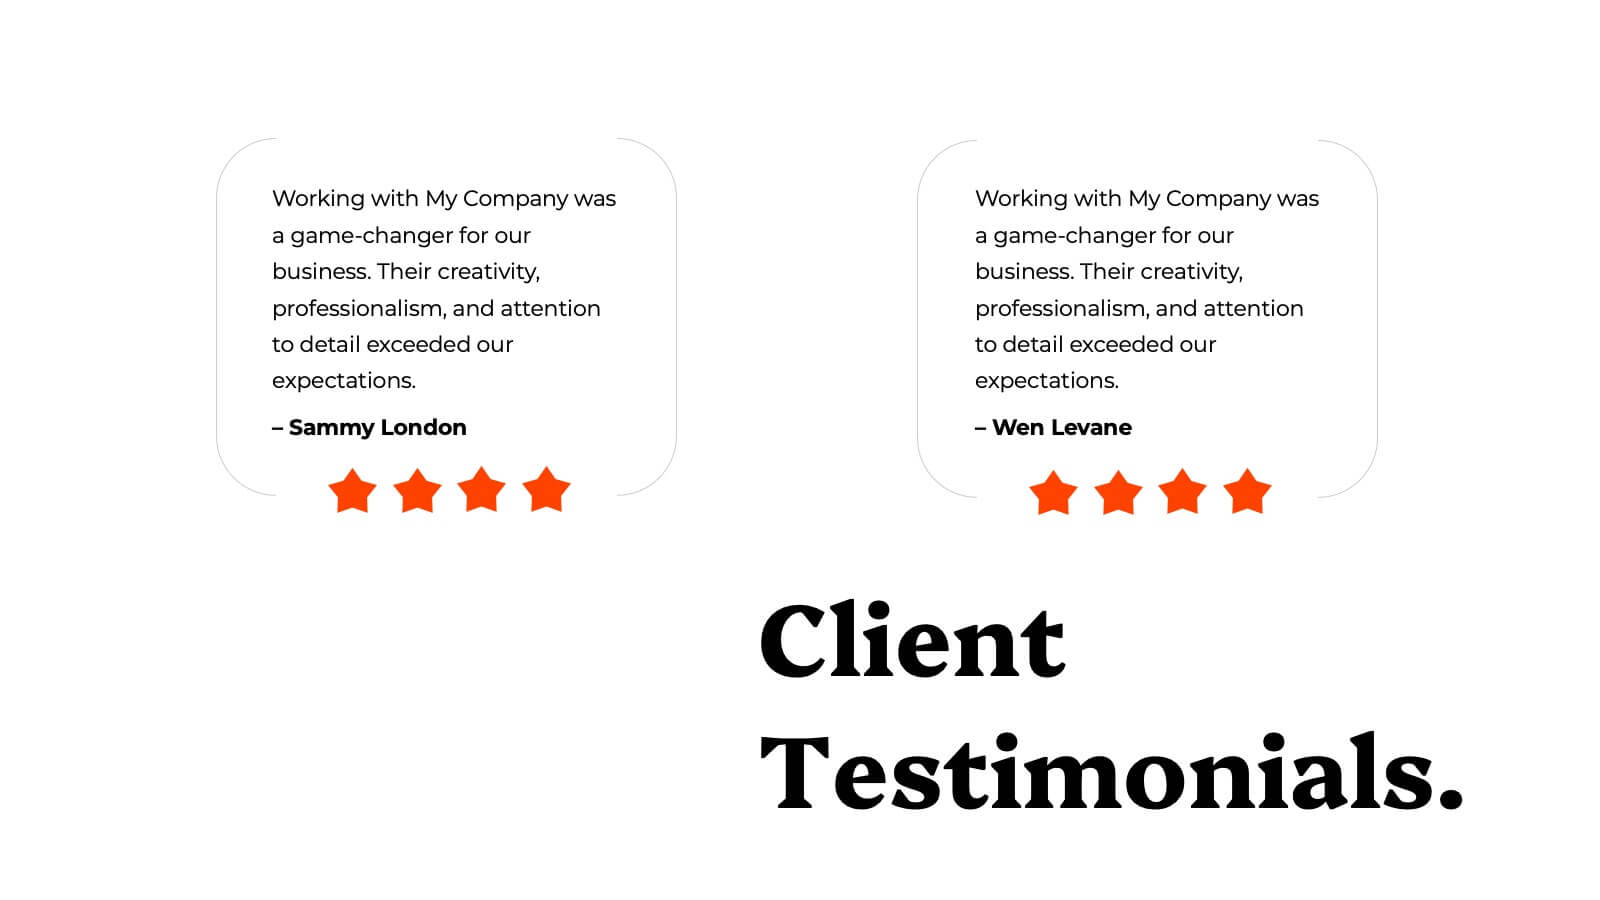
Arcadian Photography Portfolio Template Presentation
Showcase your best work with this sleek and stylish photography portfolio presentation template! It’s perfect for presenting your featured projects, creative process, and client testimonials in a visually stunning way. This template is fully customizable and offers a professional touch to your portfolio, making it ideal for both personal and client presentations. Compatible with PowerPoint, Keynote, and Google Slides.


21 diapositivas
Luminor Project Timeline Presentation
Stay on track and achieve your goals with this dynamic project timeline presentation template. It provides a clear structure to outline key milestones, objectives, budget breakdown, risk management, and resource allocation, ensuring seamless project execution. The modern and professional design enhances communication with stakeholders and team members alike. Fully customizable and compatible with PowerPoint, Keynote, and Google Slides.


5 diapositivas
Myths & Facts About Cases Of Mass Hysteria Infographics
Delve into the intriguing world of collective human psychology with myths & facts about cases of mass hysteria infographics. Set against an engaging purple backdrop, these infographics are designed to captivate, educate, and debunk misconceptions surrounding mass hysteria events. Ideal for historians, educators, psychologists, and students. The creative use of vibrant colors and compelling icons help in breaking down complex psychological phenomena into understandable content, making it easier to spark discussion on this fascinating subject. Whether it's for academic purposes, or informational content, this template stands out by blending education with intriguing storytelling.


26 diapositivas
Philp Presentation Template
Our Philp template is perfect for presenting your furniture shop business. It has a modern design, allowing you to make your product/service stands out from the crowd, and it’s easily customizable so that it can be tweaked to your exact needs. This template contains slides with beautiful graphics and captions describing the most important aspects of your business. Our presentation template can be used to promote your products, services, benefits and much more! This template can also be used to present your company's vision and mission, business strategy, portfolio and more.


3 diapositivas
Profitability and Cost Analysis Presentation
Evaluate financial efficiency with this profitability and cost analysis template. Designed for business strategists and financial planners, it helps compare costs against revenue to determine profit potential. The visual balance scale enhances clarity, making complex data easier to digest. Fully customizable and compatible with PowerPoint, Keynote, and Google Slides for seamless editing.


5 diapositivas
Purpose-Driven Mission and Values Presentation
Present your organization’s core purpose and guiding principles with this Purpose-Driven Mission and Values presentation. This clean, flag-style layout is perfect for showcasing five key pillars such as integrity, collaboration, or innovation. Easily customizable in Canva, PowerPoint, or Google Slides to align with your brand.