


Características


¿Tienes alguna pregunta?
Recomendar


26 diapositivas
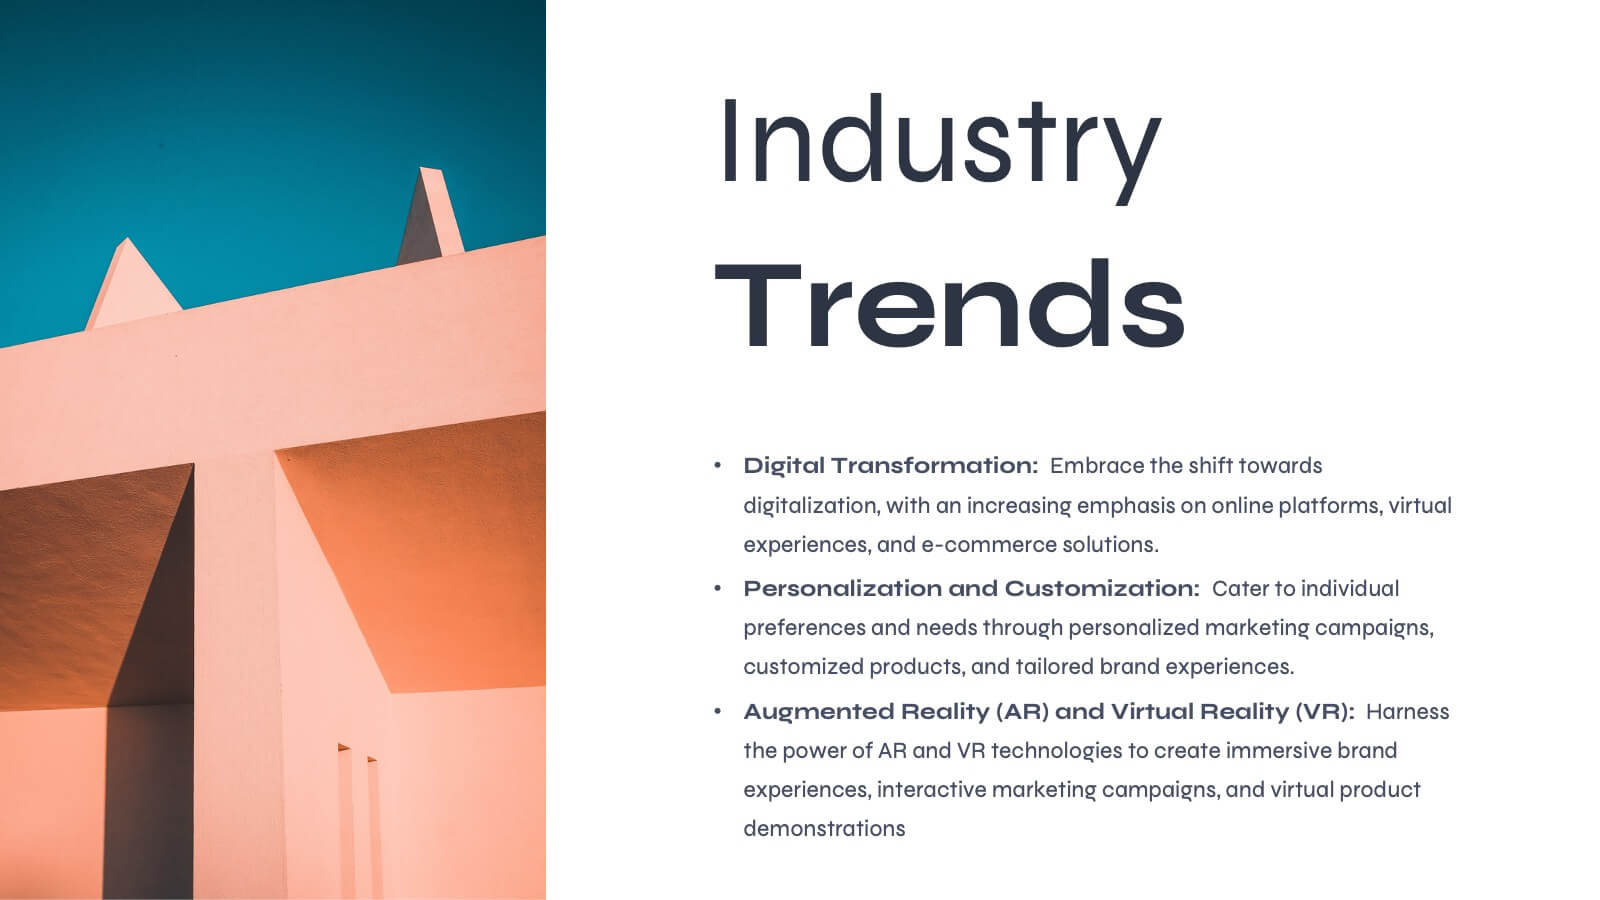
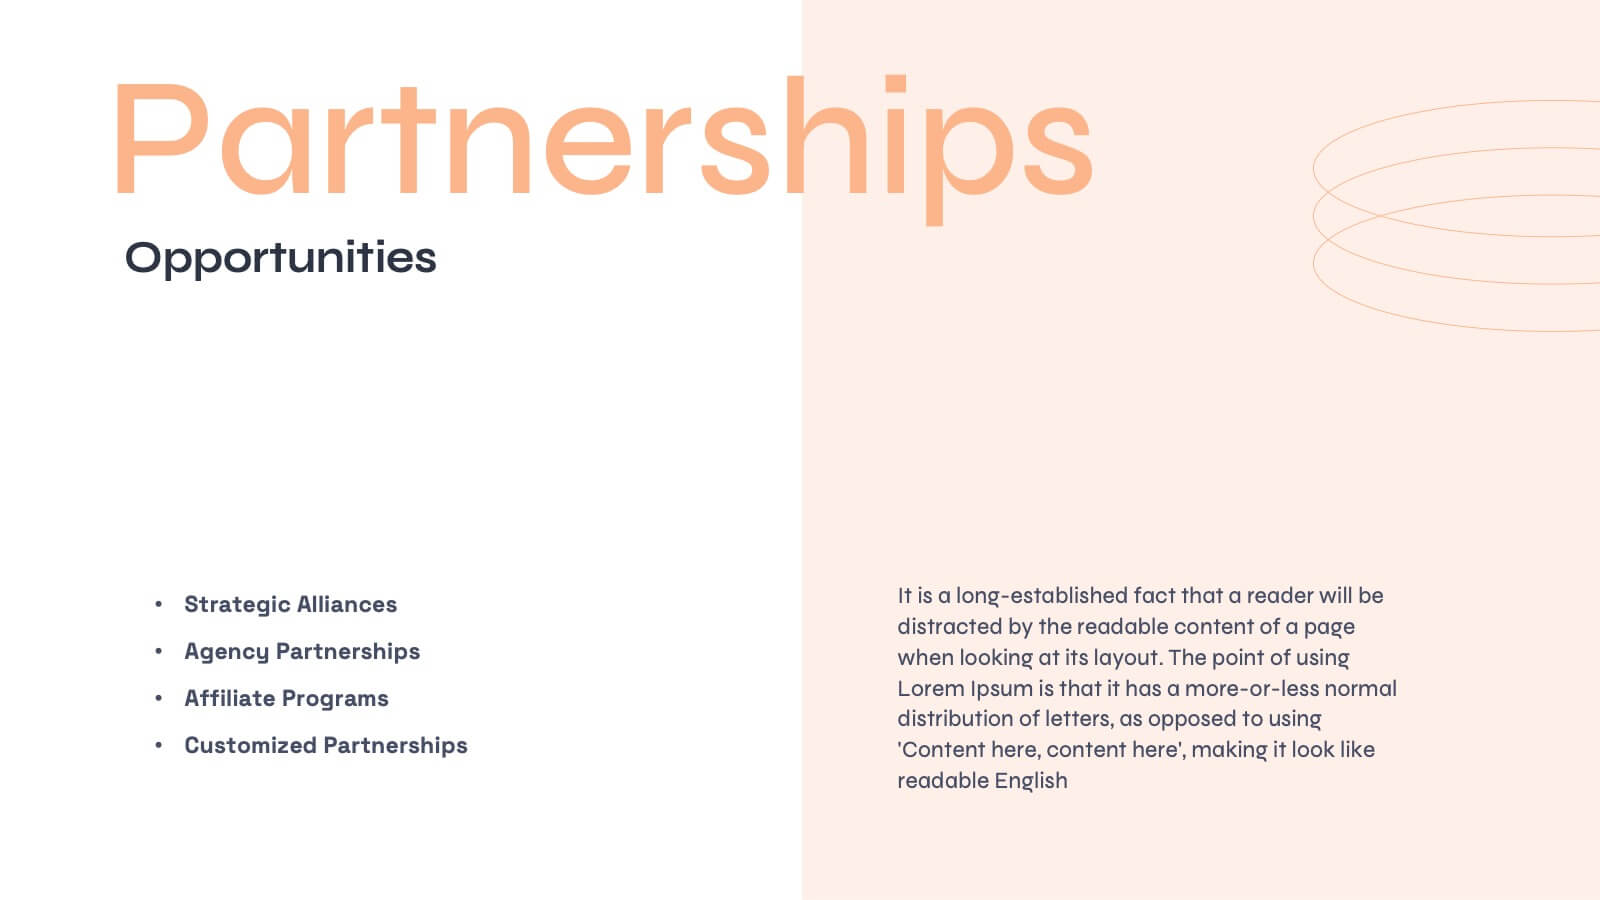
Market Growth Tactics Presentation
Chart a path to success with our Market Growth Tactics presentation template, designed for seamless use in PowerPoint, Keynote, and Google Slides. This template is a vital asset for business strategists, marketing professionals, and consultants who aim to drive growth and capture market share. Our Market Growth Tactics template lays out a strategic framework for identifying and leveraging growth opportunities. It provides a comprehensive array of slides to showcase market analysis, competitive landscape, growth strategies, and execution plans. With customizable elements, you can tailor your presentation to reflect specific market insights and growth targets relevant to your audience. The template is crafted to facilitate clear communication of complex growth strategies, breaking them down into actionable steps with the aid of charts, graphs, and infographics. This helps to convey your message effectively, ensuring that your audience can visualize the growth journey and understand the tactics involved. Elevate your market growth presentations and become an authoritative voice in your industry with our SEO-optimized template, designed to engage, inform, and inspire action towards market expansion.


5 diapositivas
Detailed Project Scope Definition Presentation
Bring structure and clarity to your planning process with a layout designed to define every stage of your project. Perfect for outlining goals, deliverables, and timelines, this presentation keeps information clear and organized. Fully compatible with PowerPoint, Keynote, and Google Slides for easy customization and professional results.


4 diapositivas
Collaborative Team Workflow Presentation
Visualize seamless collaboration with the Collaborative Team Workflow Presentation. This slide design features team icons, branching layouts, and a clean structure to showcase group dynamics and process flow. Perfect for teamwork strategies, HR initiatives, or cross-functional planning. Fully editable in PowerPoint, Keynote, and Google Slides for tailored communication.


5 diapositivas
Comprehensive Sex Education Infographics
Navigate the sensitive landscape of human sexuality education with our comprehensive sex education infographics. Cast on a canvas of bold colors like black, yellow, and red, these infographics delicately handle the topics inherent to sex education. This tool is invaluable for educators, health professionals, advocacy groups, and policymakers who champion for informed, safe, and healthy choices. Compatible with Powerpoint, Keynote, and Google Slides. Ensuring the content resonates with audiences of diverse ages and backgrounds. The inclusion of compelling graphics and intuitive icons, fosters an environment of learning and openness, essential for impactful discussions.


5 diapositivas
Wedding Reception Program Infographics
Embrace the romance with our wedding reception program infographics, the quintessential guide for couples, wedding planners, and event organizers. This template, bathed in soothing light blue and light pink hues, provides an elegant backdrop for your wedding reception's flow of events. With a creative, vertical design, it offers an aesthetically pleasing layout that outlines the festivities, from heartfelt toasts to the final dance. It includes whimsical graphics, versatile icons, and customizable image placeholders, ensuring each moment is beautifully represented. Infuse personality and seamless organization into your special day, making it memorable for everyone involved.


8 diapositivas
4-Quadrant Matrix Presentation
The "4-Quadrant Matrix Presentation" template is meticulously designed for strategic analysis and planning, perfect for visualizing business data across four key areas. Each quadrant highlights a distinct category, allowing for a comprehensive breakdown of information such as performance metrics, risk assessments, market trends, or operational efficiency. The template is color-coded to distinguish between the quadrants, making it visually engaging and easy to understand. Icons within each quadrant can be customized to symbolize different business functions or data points, enhancing the clarity and effectiveness of the presentation. This tool is ideal for executives, managers, and analysts who need to present complex data in a structured and insightful way, enabling informed decision-making and strategic planning in corporate settings.


4 diapositivas
Stakeholder Analysis and Engagement Presentation
Enhance your strategic planning with our Stakeholder Analysis and Engagement Presentation template. Designed to map influence and interest effectively, this tool aids in identifying key stakeholders and tailoring engagement strategies. It’s compatible with PowerPoint, Keynote, and Google Slides, perfect for impactful presentations and workshops.


5 diapositivas
Visual Mind Connections Bubble Chart Presentation
Visualize interconnected concepts with clarity using the Visual Mind Connections Bubble Chart Presentation. This engaging layout centers around a core idea, surrounded by supporting points in a clean, circular flow. Ideal for mapping strategies, team roles, or processes. Fully editable in PowerPoint, Keynote, or Google Slides—perfect for business, education, or coaching.


5 diapositivas
Monthly Financial Report Infographics
Dive into financial analytics with our monthly financial report infographics template. This indispensable tool, designed for finance professionals, managers, and business owners, comes in a stimulating mix of orange, pink, and green, reflecting the dynamic nature of finance. The template stands out with creative graphics, detailed icons, and designated areas for images that encapsulate various financial parameters. Ideal for depicting key statistics, trends, and financial insights in a clear, engaging manner, this vertical-style infographic template is perfect for simplifying complex data, ensuring your monthly reports are both comprehensive and captivating.


20 diapositivas
Oscillation Project Proposal Presentation
This project proposal template is designed to captivate your audience with a bold purple and yellow color scheme, adding a modern flair to your presentation. It includes comprehensive sections like company overview, objectives and goals, methodology, deliverables, and budget breakdown. Perfect for clearly communicating your project vision and strategy, this template streamlines your content while highlighting your professional approach. Compatible with PowerPoint, Keynote, and Google Slides, it provides versatility for seamless delivery across platforms.


6 diapositivas
Closing Summary and Key Takeaways Presentation
Wrap up your presentation with clarity using the Closing Summary and Key Takeaways Presentation. This slide features a semi-circular segmented layout, ideal for highlighting 3–5 final points, action steps, or reflections. Clean, modern, and easy to customize in PowerPoint, Keynote, Google Slides, or Canva—perfect for impactful conclusions.


22 diapositivas
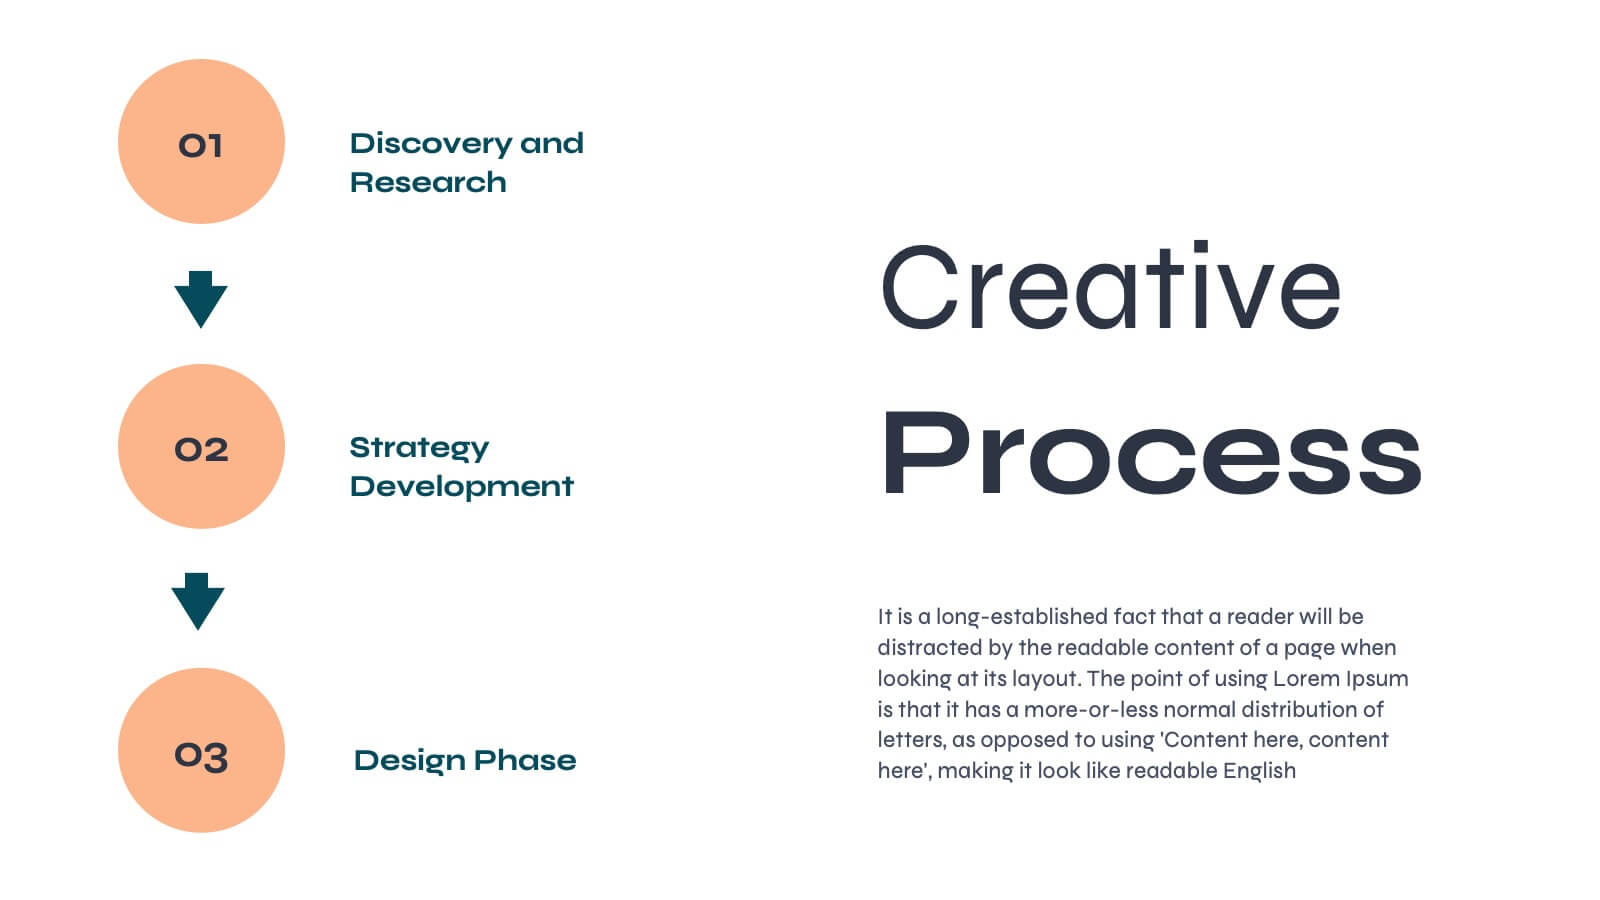
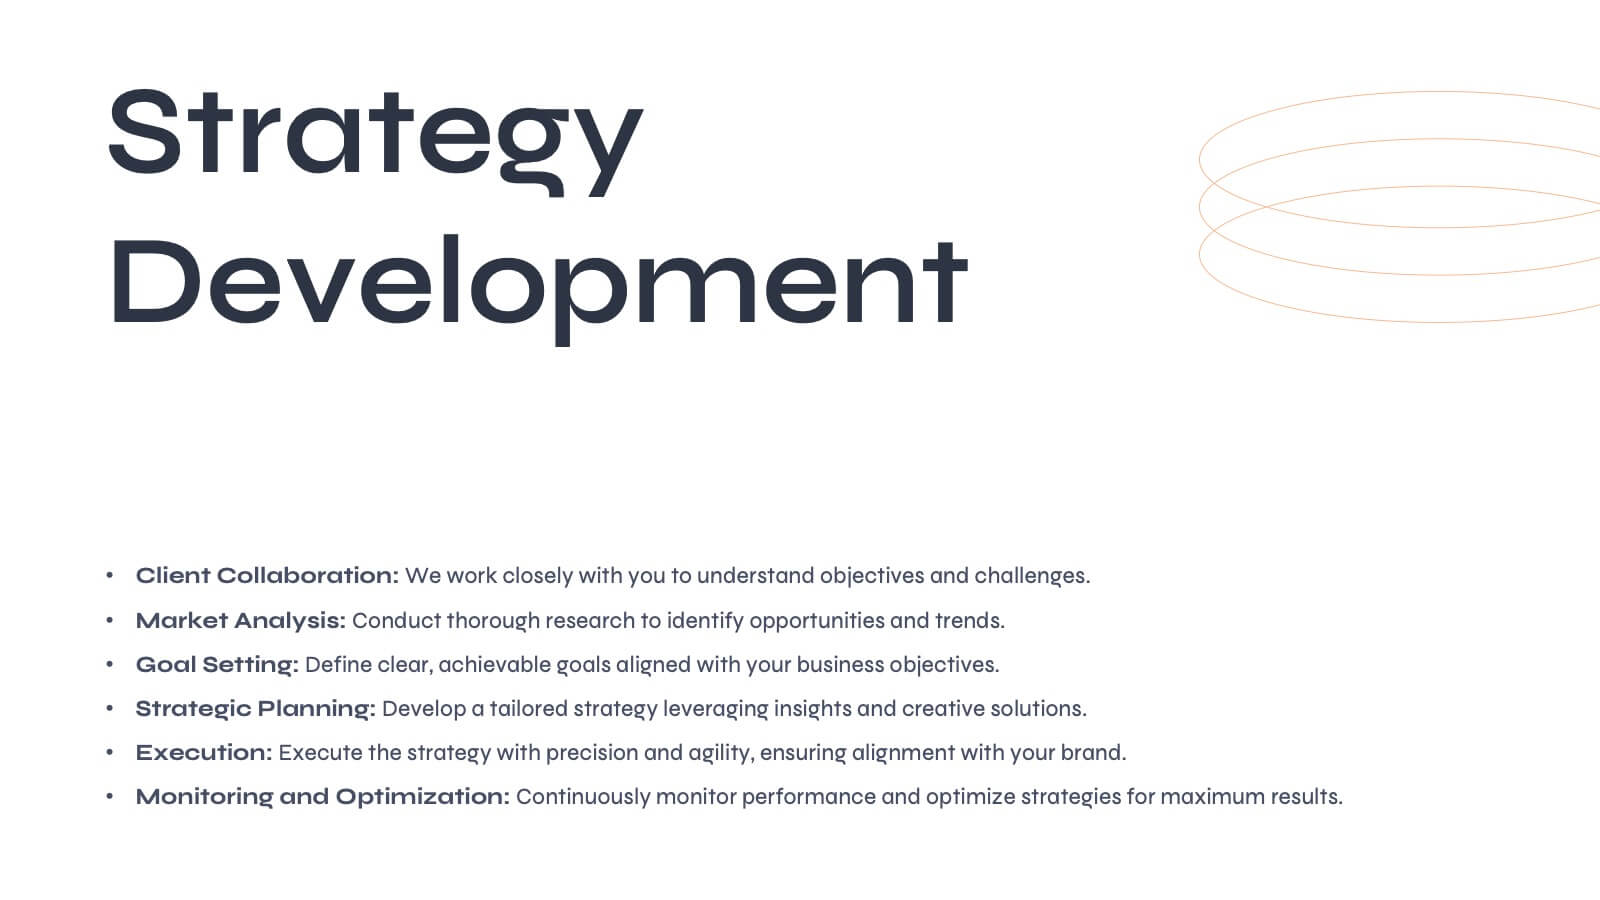
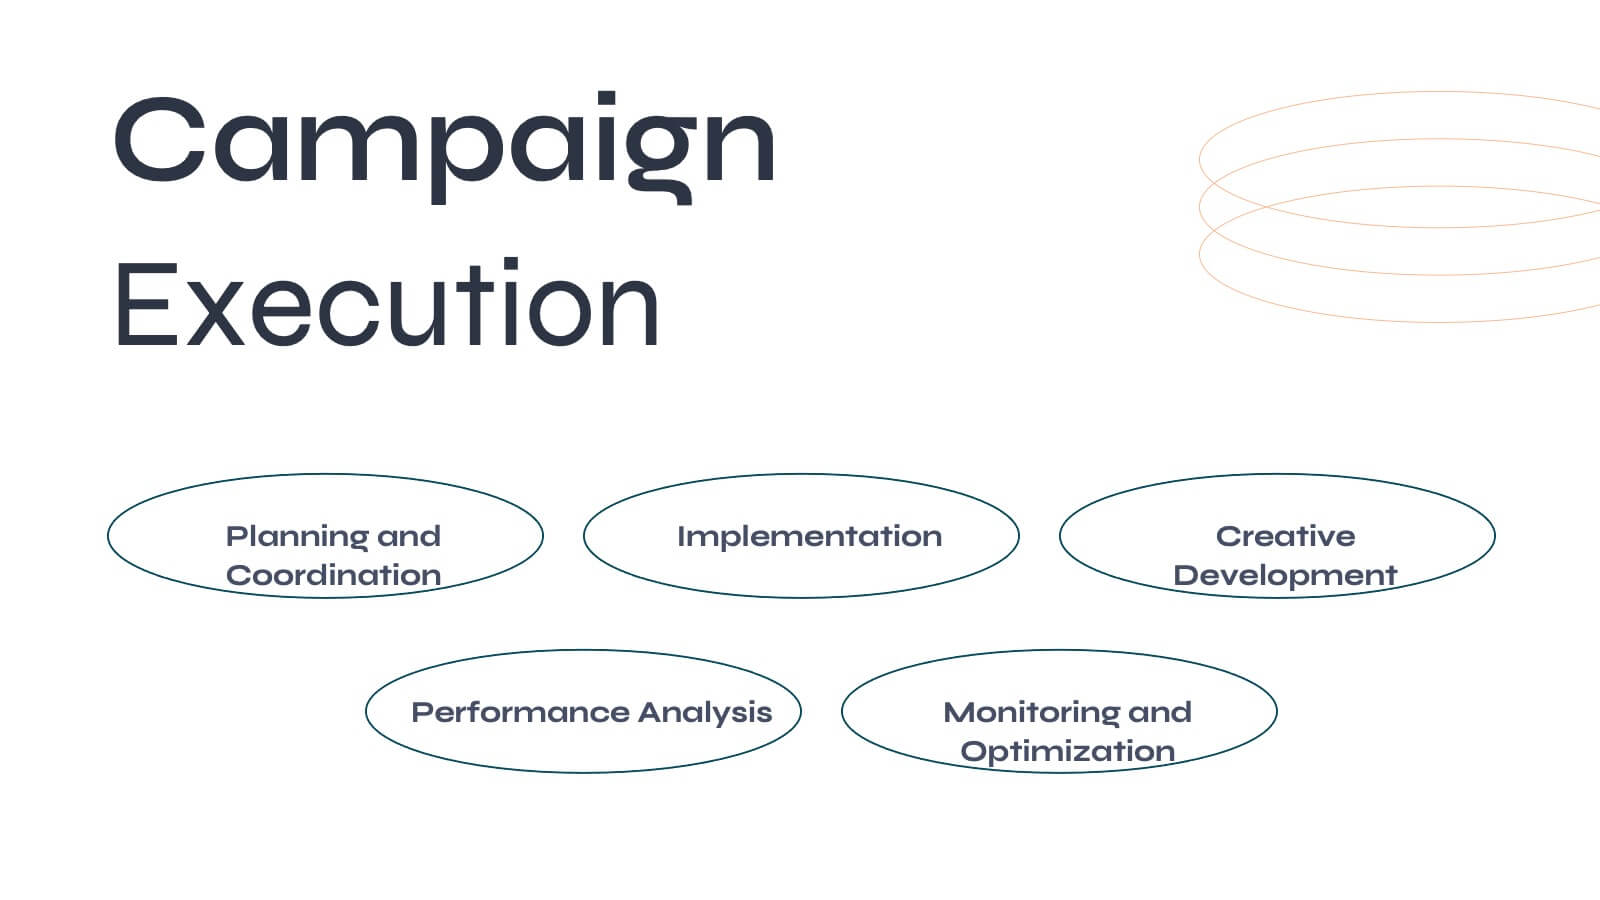
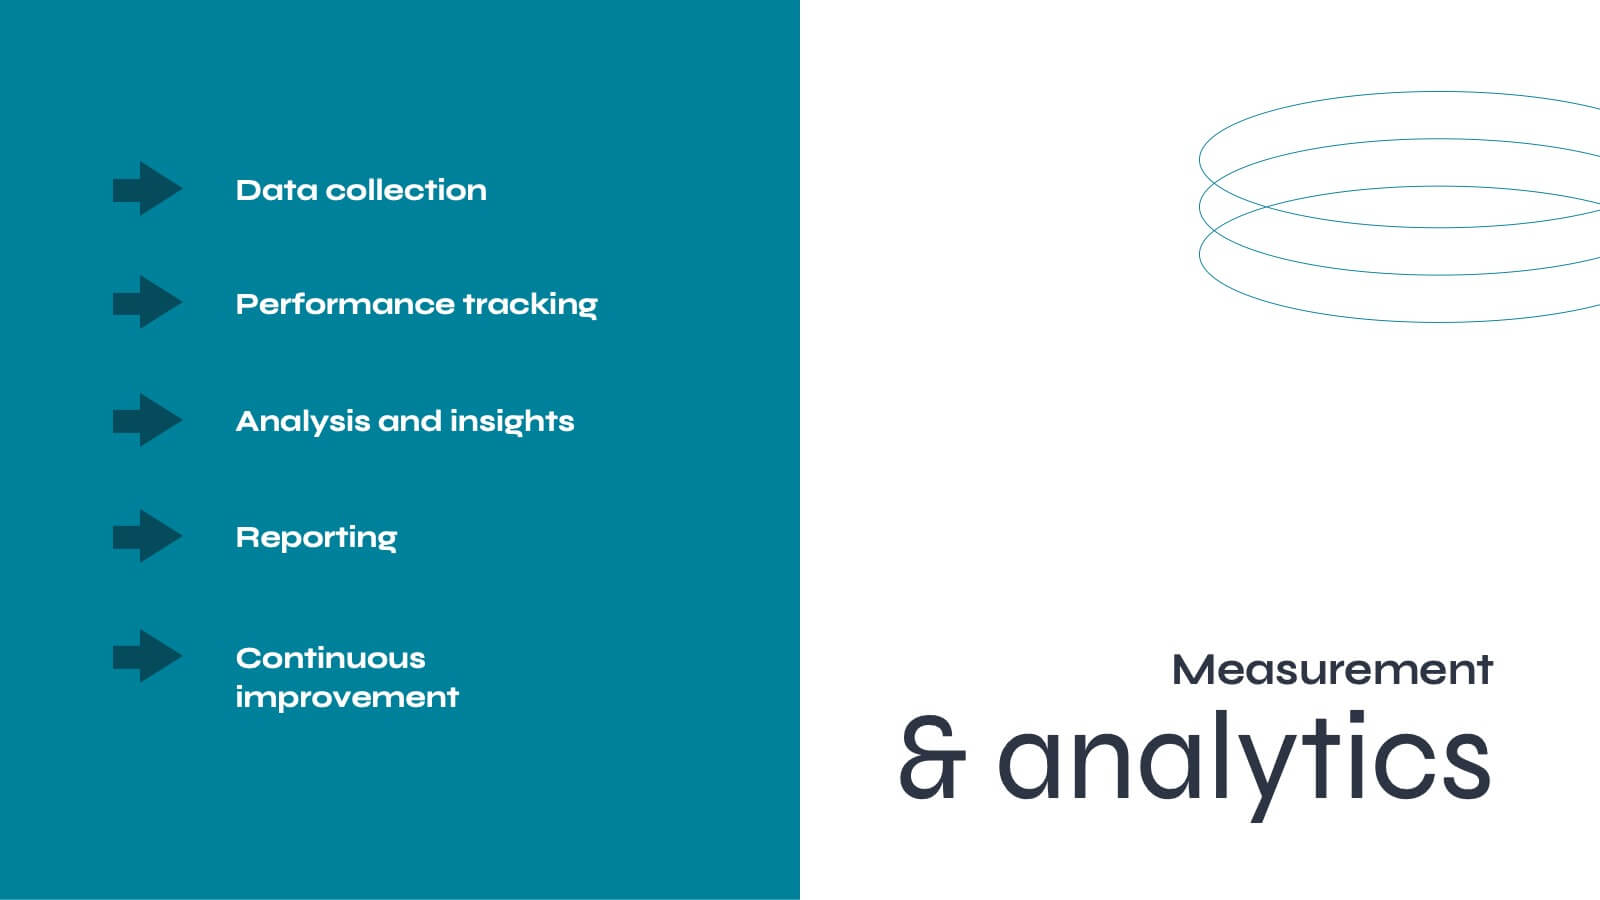
Aurora Agency Portfolio Presentation
Showcase your agency's strengths with this polished, modern presentation template. Perfect for presenting market analysis, client success stories, and creative processes, it features a clean and professional design. Highlight your team's expertise and strategic approach to impress potential clients. Compatible with PowerPoint, Keynote, and Google Slides, it ensures seamless presentations on any platform.


5 diapositivas
Understanding Customer Needs with Empathy Map Presentation
Gain deeper customer insights with the Understanding Customer Needs with Empathy Map Presentation. This template simplifies user research by visually organizing customer thoughts, behaviors, and emotions into a clear layout. Perfect for UX teams, product designers, and marketers aiming to craft user-centric strategies. Fully editable in PowerPoint, Keynote, Canva, and Google Slides.


7 diapositivas
Sports Bases Infographic
Step up your game with our sports bases infographic! Designed to captivate sports enthusiasts, coaches, trainers, and educators, this vibrant infographic illuminates the aspects of various sports disciplines. With a crisp blue backdrop coupled with dynamic shades of blue and an array of sporty colors, it provides a visual sprint through the key bases of multiple sports. Ideal for coaches aiming to provide a overview to their teams, or educators introducing students to the fundamentals of sports. Compatible with PowerPoint, Keynote, and Google Slides, you can seamlessly integrate it into your presentations and captivate your audience with a sporty edge.


8 diapositivas
Meet the Team Presentation
Showcase your team effectively with our "Meet the Team Presentation" template. This sleek design features personalized cards for each team member, displaying their photo, name, and contact details on a visually appealing, color-coded background. Perfect for onboarding, company introductions, or team-building presentations, this template enhances recognition and cohesion. The distinct colors can be used to signify different roles or departments, making it easy to identify team dynamics at a glance. Compatible with PowerPoint, Keynote, and Google Slides, it’s an essential tool for any organization aiming to present their team in a professional and engaging manner.


8 diapositivas
Product Pricing Table Comparison Presentation
Showcase your product pricing options clearly with our 'Product Pricing Table Comparison' presentation template. This straightforward and efficient layout helps you display different price points and features across multiple packages, making it easy for your audience to compare and make informed choices. Ideal for sales presentations and marketing meetings, this template is compatible with PowerPoint, Keynote, and Google Slides.


7 diapositivas
Construction Jobs Infographic
Construction jobs refer to various roles and professions within the construction industry involved in planning, designing, building, and maintaining structures such as buildings, roads, bridges, dams, and other infrastructures. This infographic template sheds light on various career opportunities within the construction industry, offering a roadmap for aspiring professionals. Compatible with Powerpoint, Keynote, and Google Slides. With this infographic you're not just exploring careers; you're navigating a landscape of opportunities, ready to build a successful career in the dynamic world of construction.