
Características


¿Tienes alguna pregunta?
Recomendar


7 diapositivas
Design Process Infographic Presentation
A Process Infographic is a visual representation of a series of steps or stages in a particular process. Get inspired by this hands-on Design Process Infographic. Featuring the process from identifying to management and success. This template is perfect for sharing your story by showing the steps and creating a portfolio. In this template icons and other visual elements are included to help convey your complex information in an easy-to-understand format. Communicate your process clearly and make this your starting point just change the text, colors and fonts to fit your needs in only minutes.


3 diapositivas
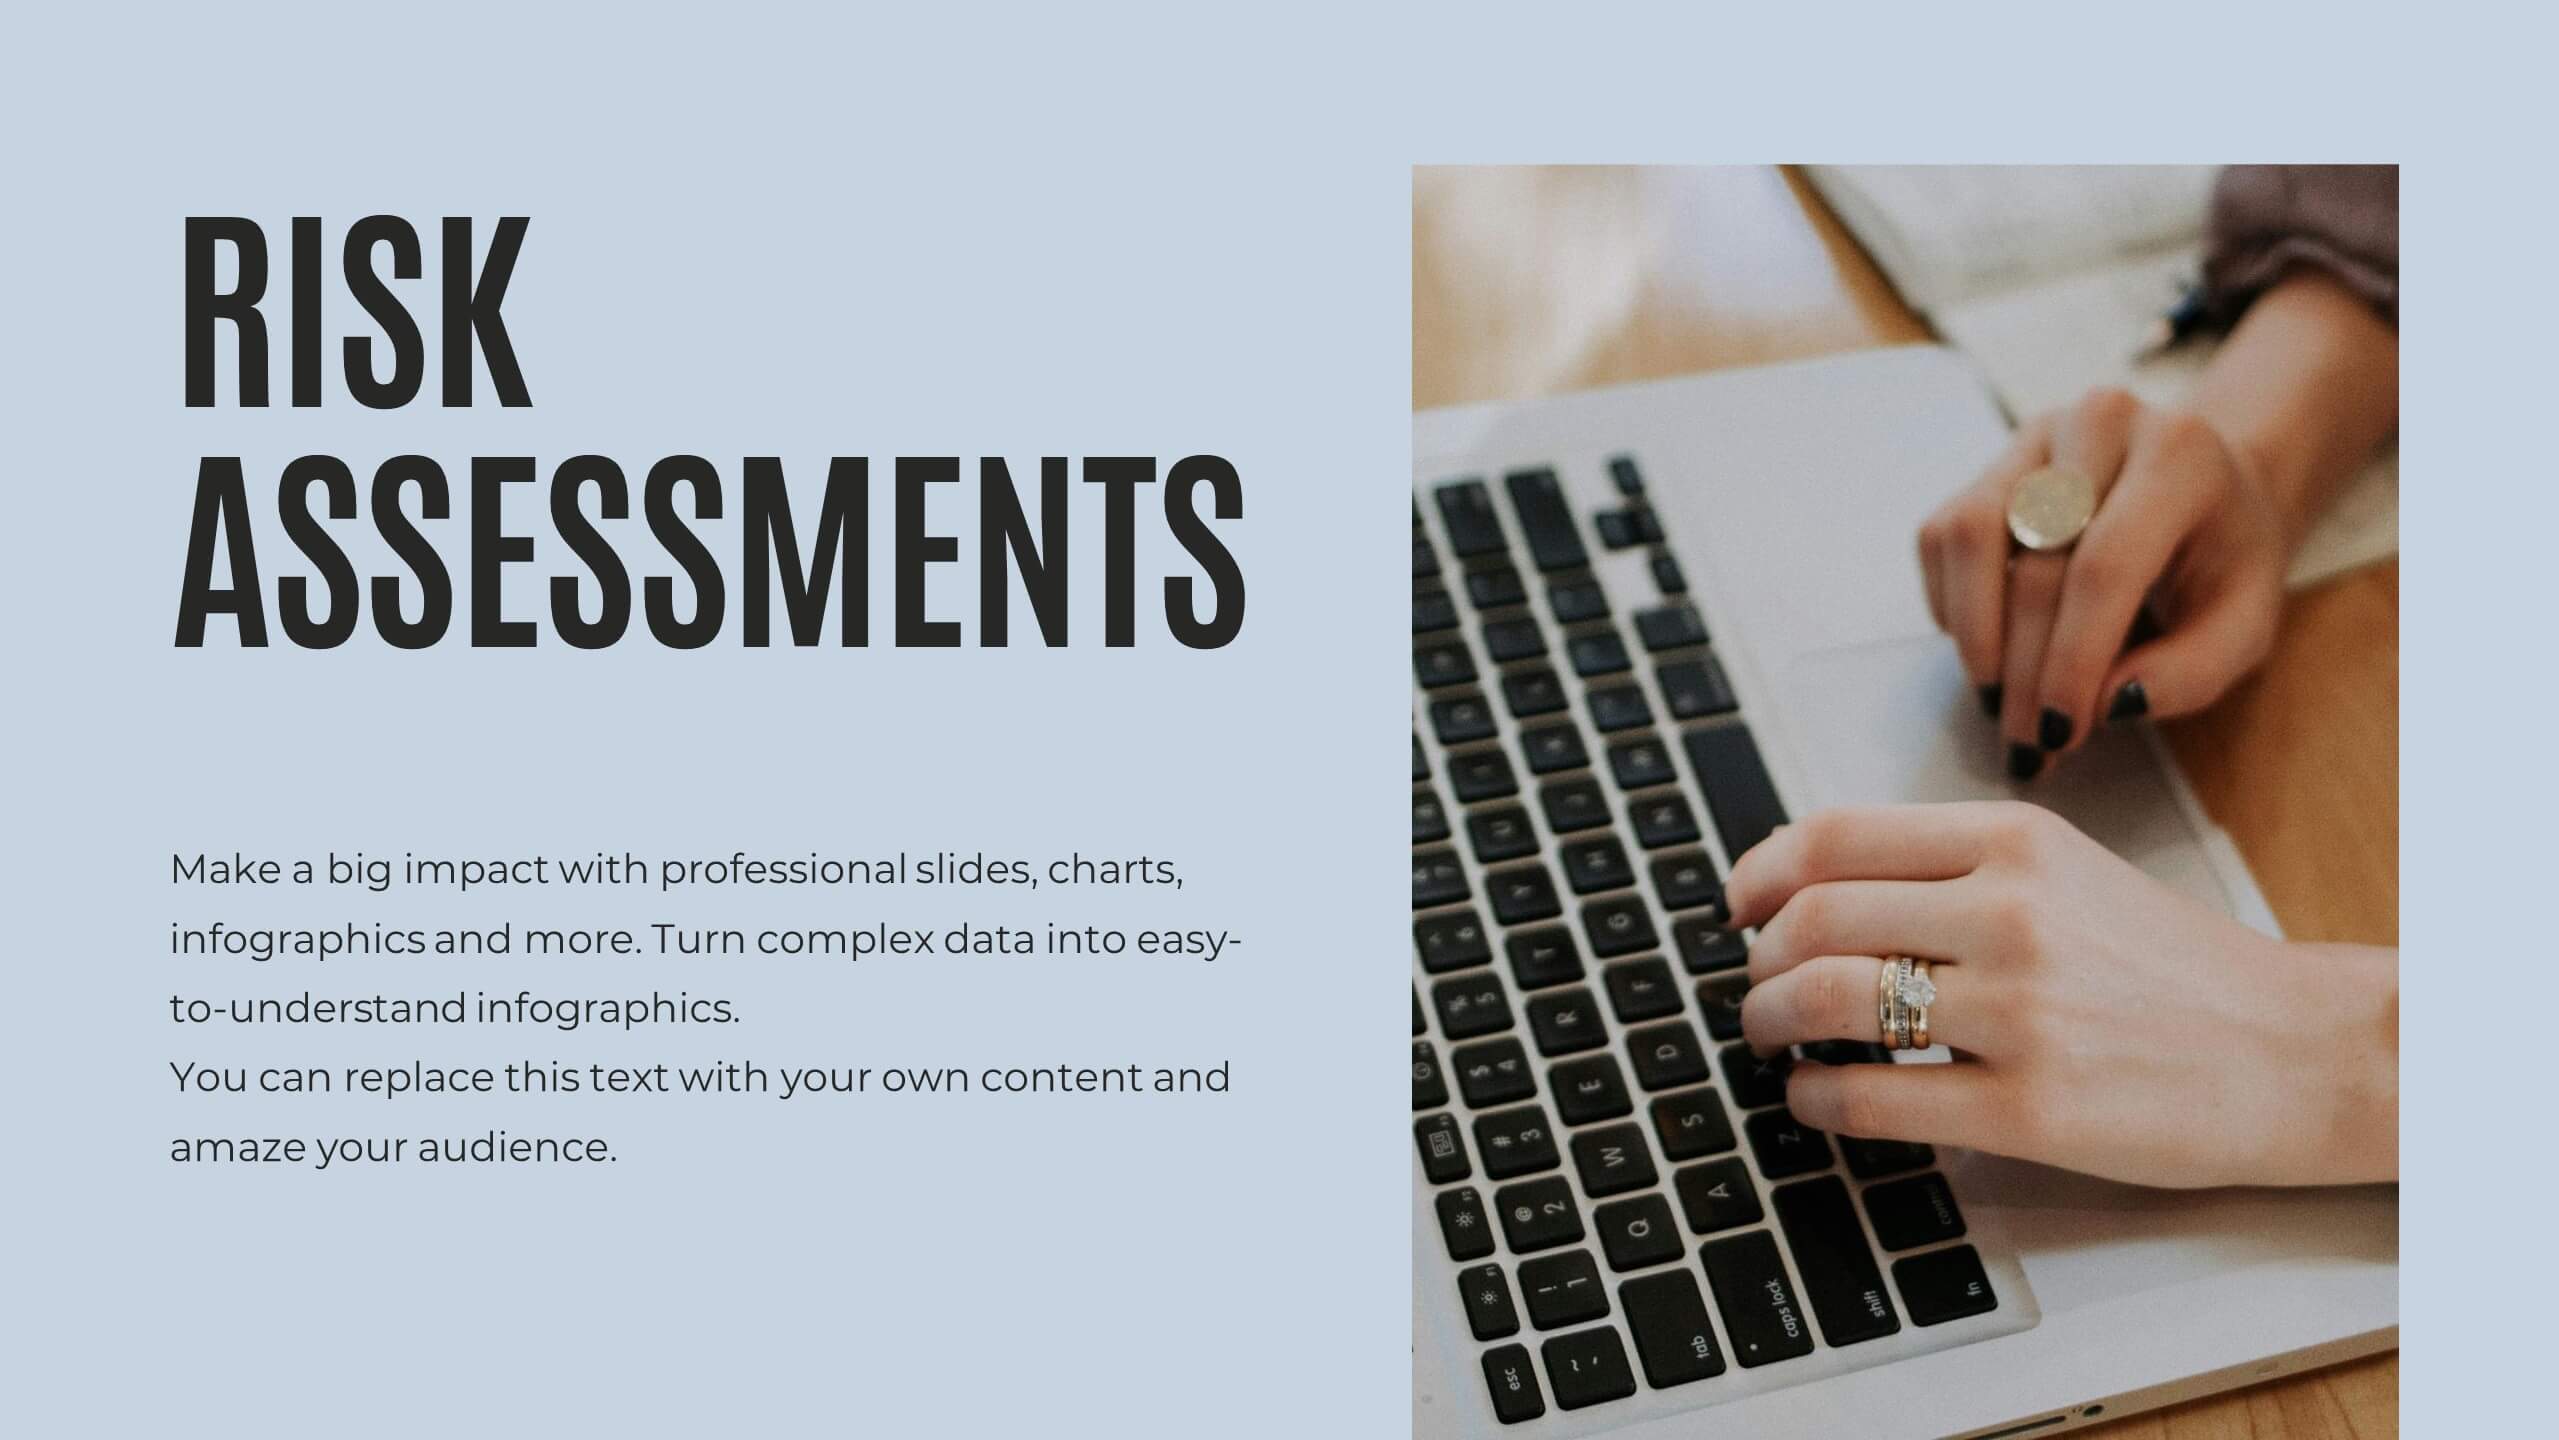
Risk Assessment Spider Chart
Evaluate risks across key criteria with the Risk Assessment Spider Chart Presentation. This template showcases a multi-dimensional radar chart, ideal for comparing variables like probability, impact, and preparedness. Use this to present security assessments, project vulnerabilities, or business exposure insights. Fully editable in PowerPoint, Keynote, and Google Slides.


6 diapositivas
Modern Agriculture Trends Presentation
Bring innovation to the forefront with this visually engaging presentation design. Perfect for highlighting sustainability practices, agri-tech developments, and market evolution, it helps communicate key insights with clarity and style. Fully customizable and compatible with PowerPoint, Keynote, and Google Slides for a polished, professional presentation experience.


6 diapositivas
Problem Solving and Innovation Solution Presentation
Unlock creative thinking with the Problem Solving and Innovation Solution Presentation. This puzzle lightbulb diagram helps visualize key components of innovative strategies—ideal for brainstorming sessions, business development plans, or process improvement meetings. Editable in PowerPoint, Keynote, and Google Slides.


22 diapositivas
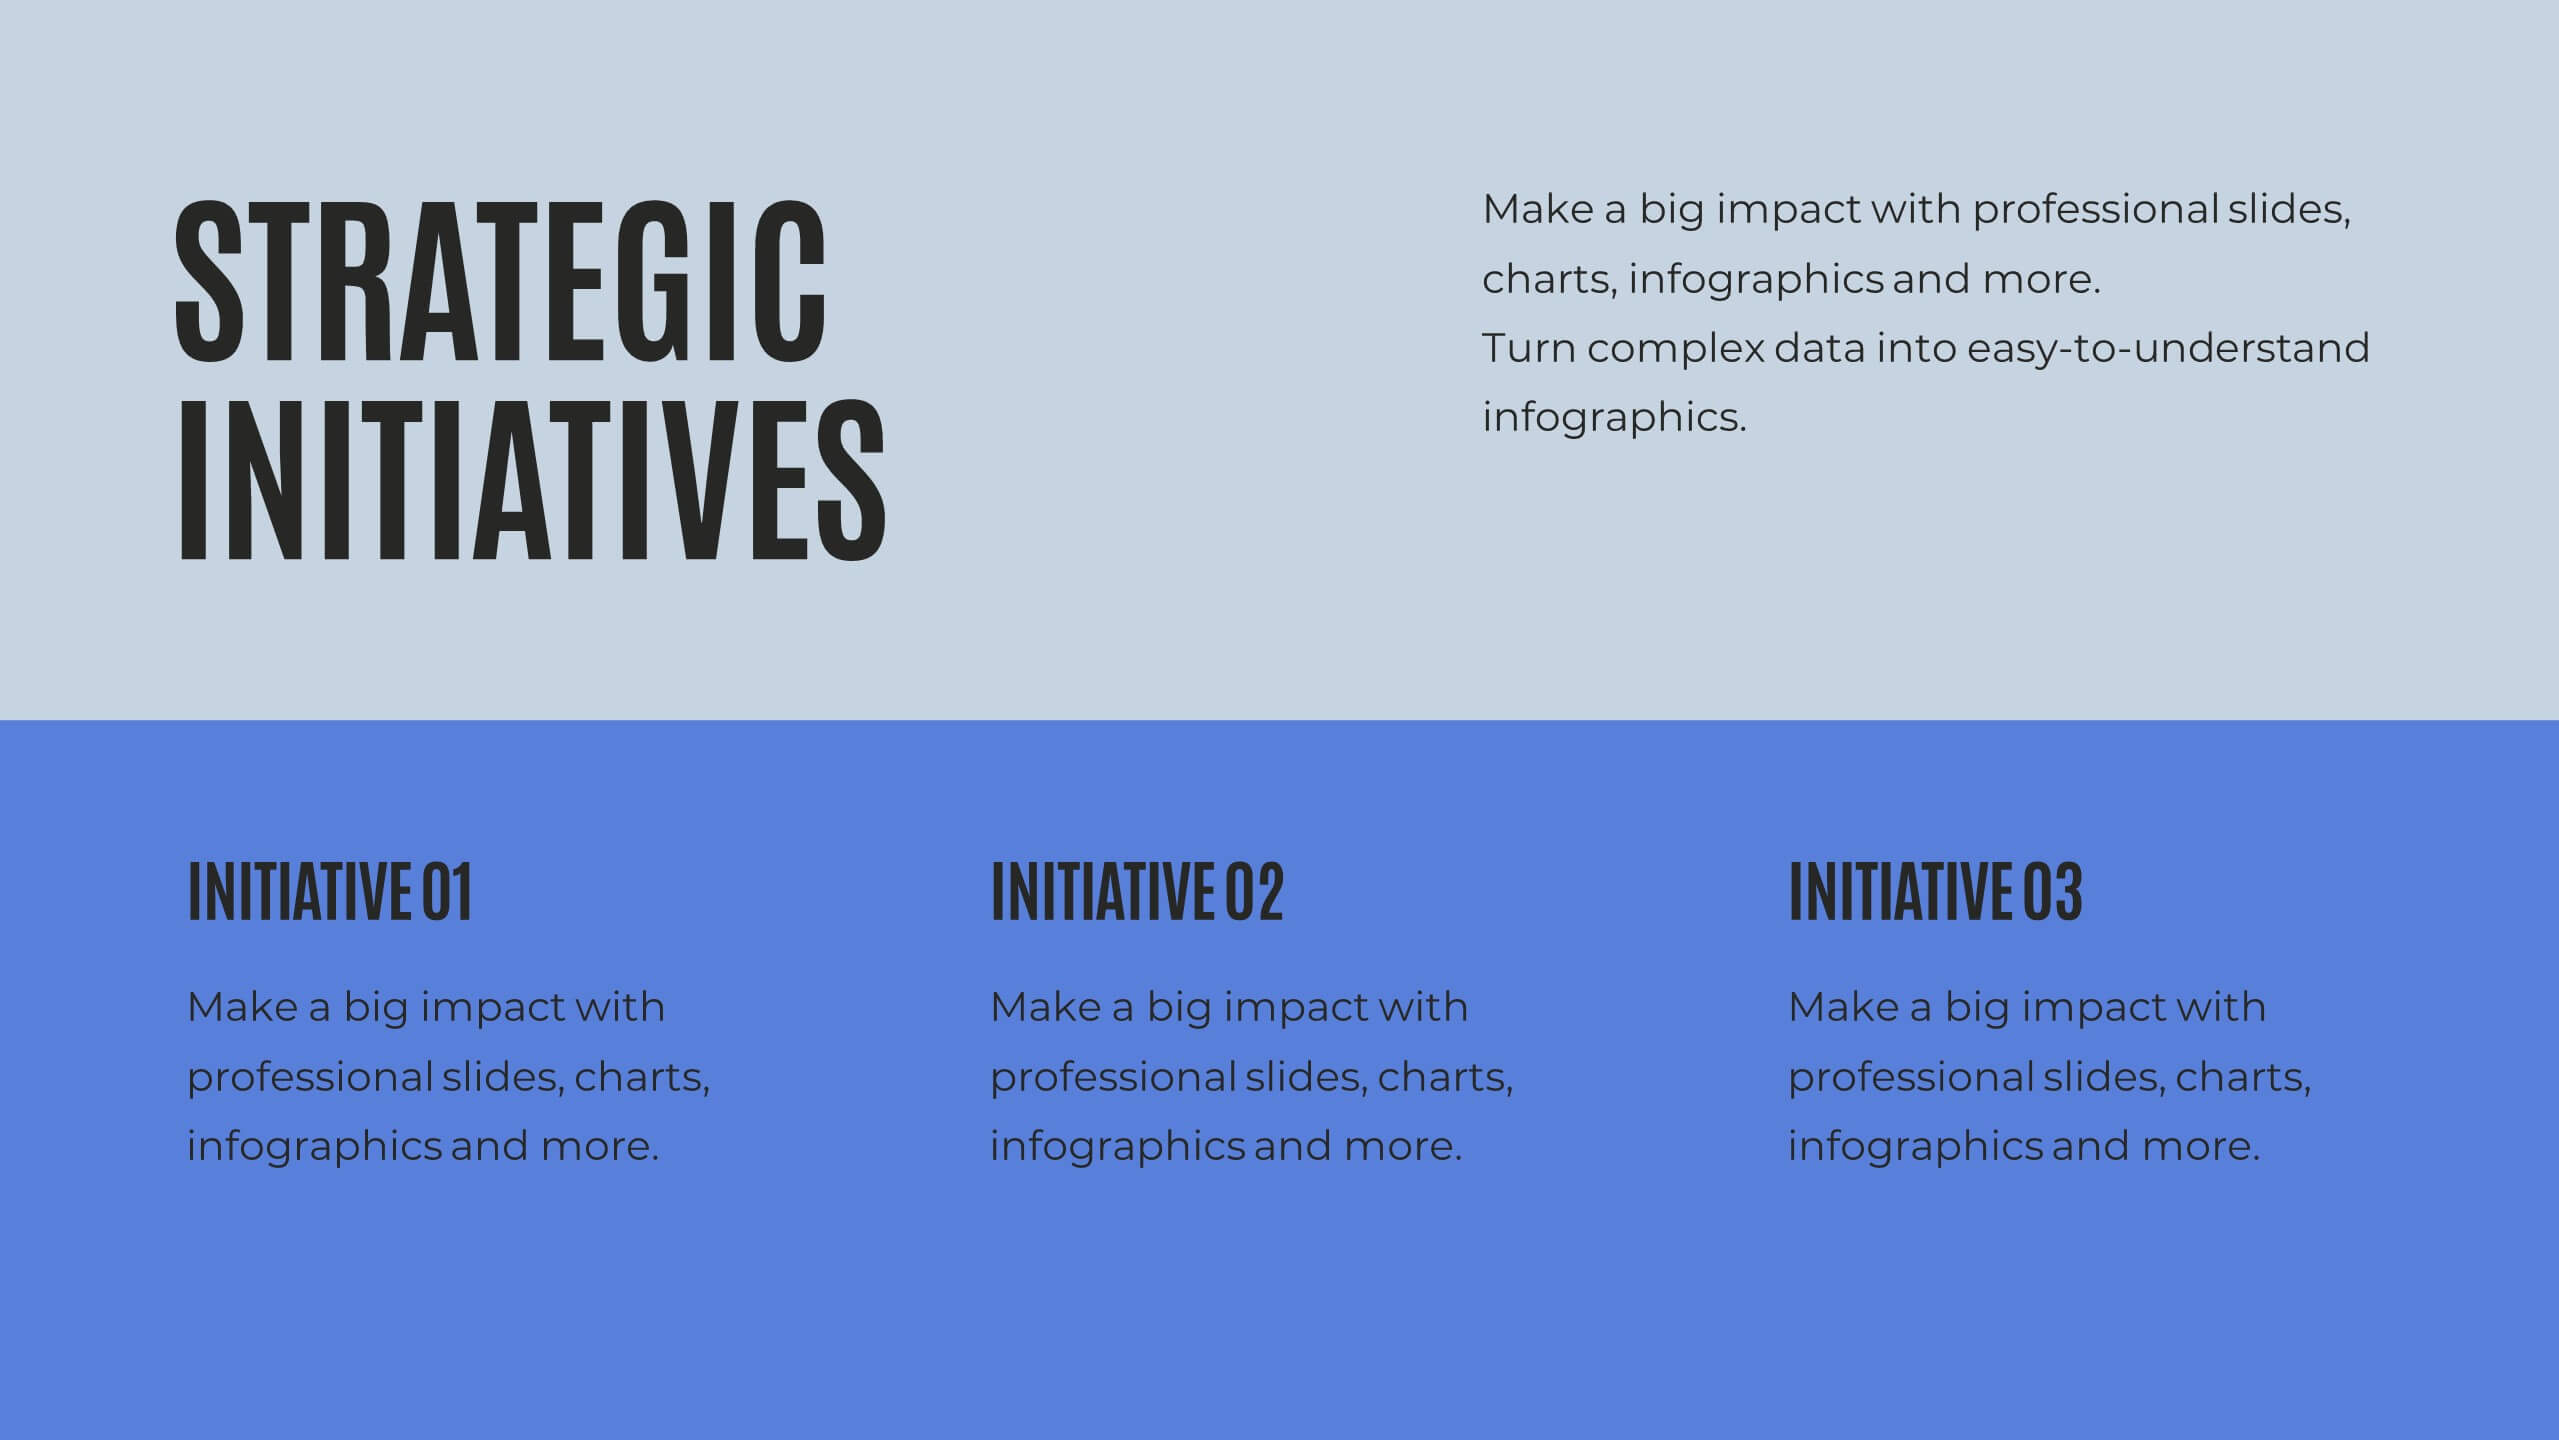
Arachne Digital Marketing Strategy Plan Presentation
Weave a powerful digital marketing strategy with this sleek, Arachne-inspired presentation! Perfect for outlining your digital marketing plans, this template helps you highlight key strategies, analytics, and campaign goals in a structured and visually engaging way. Its modern design keeps your audience focused. Compatible with PowerPoint, Keynote, and Google Slides.


21 diapositivas
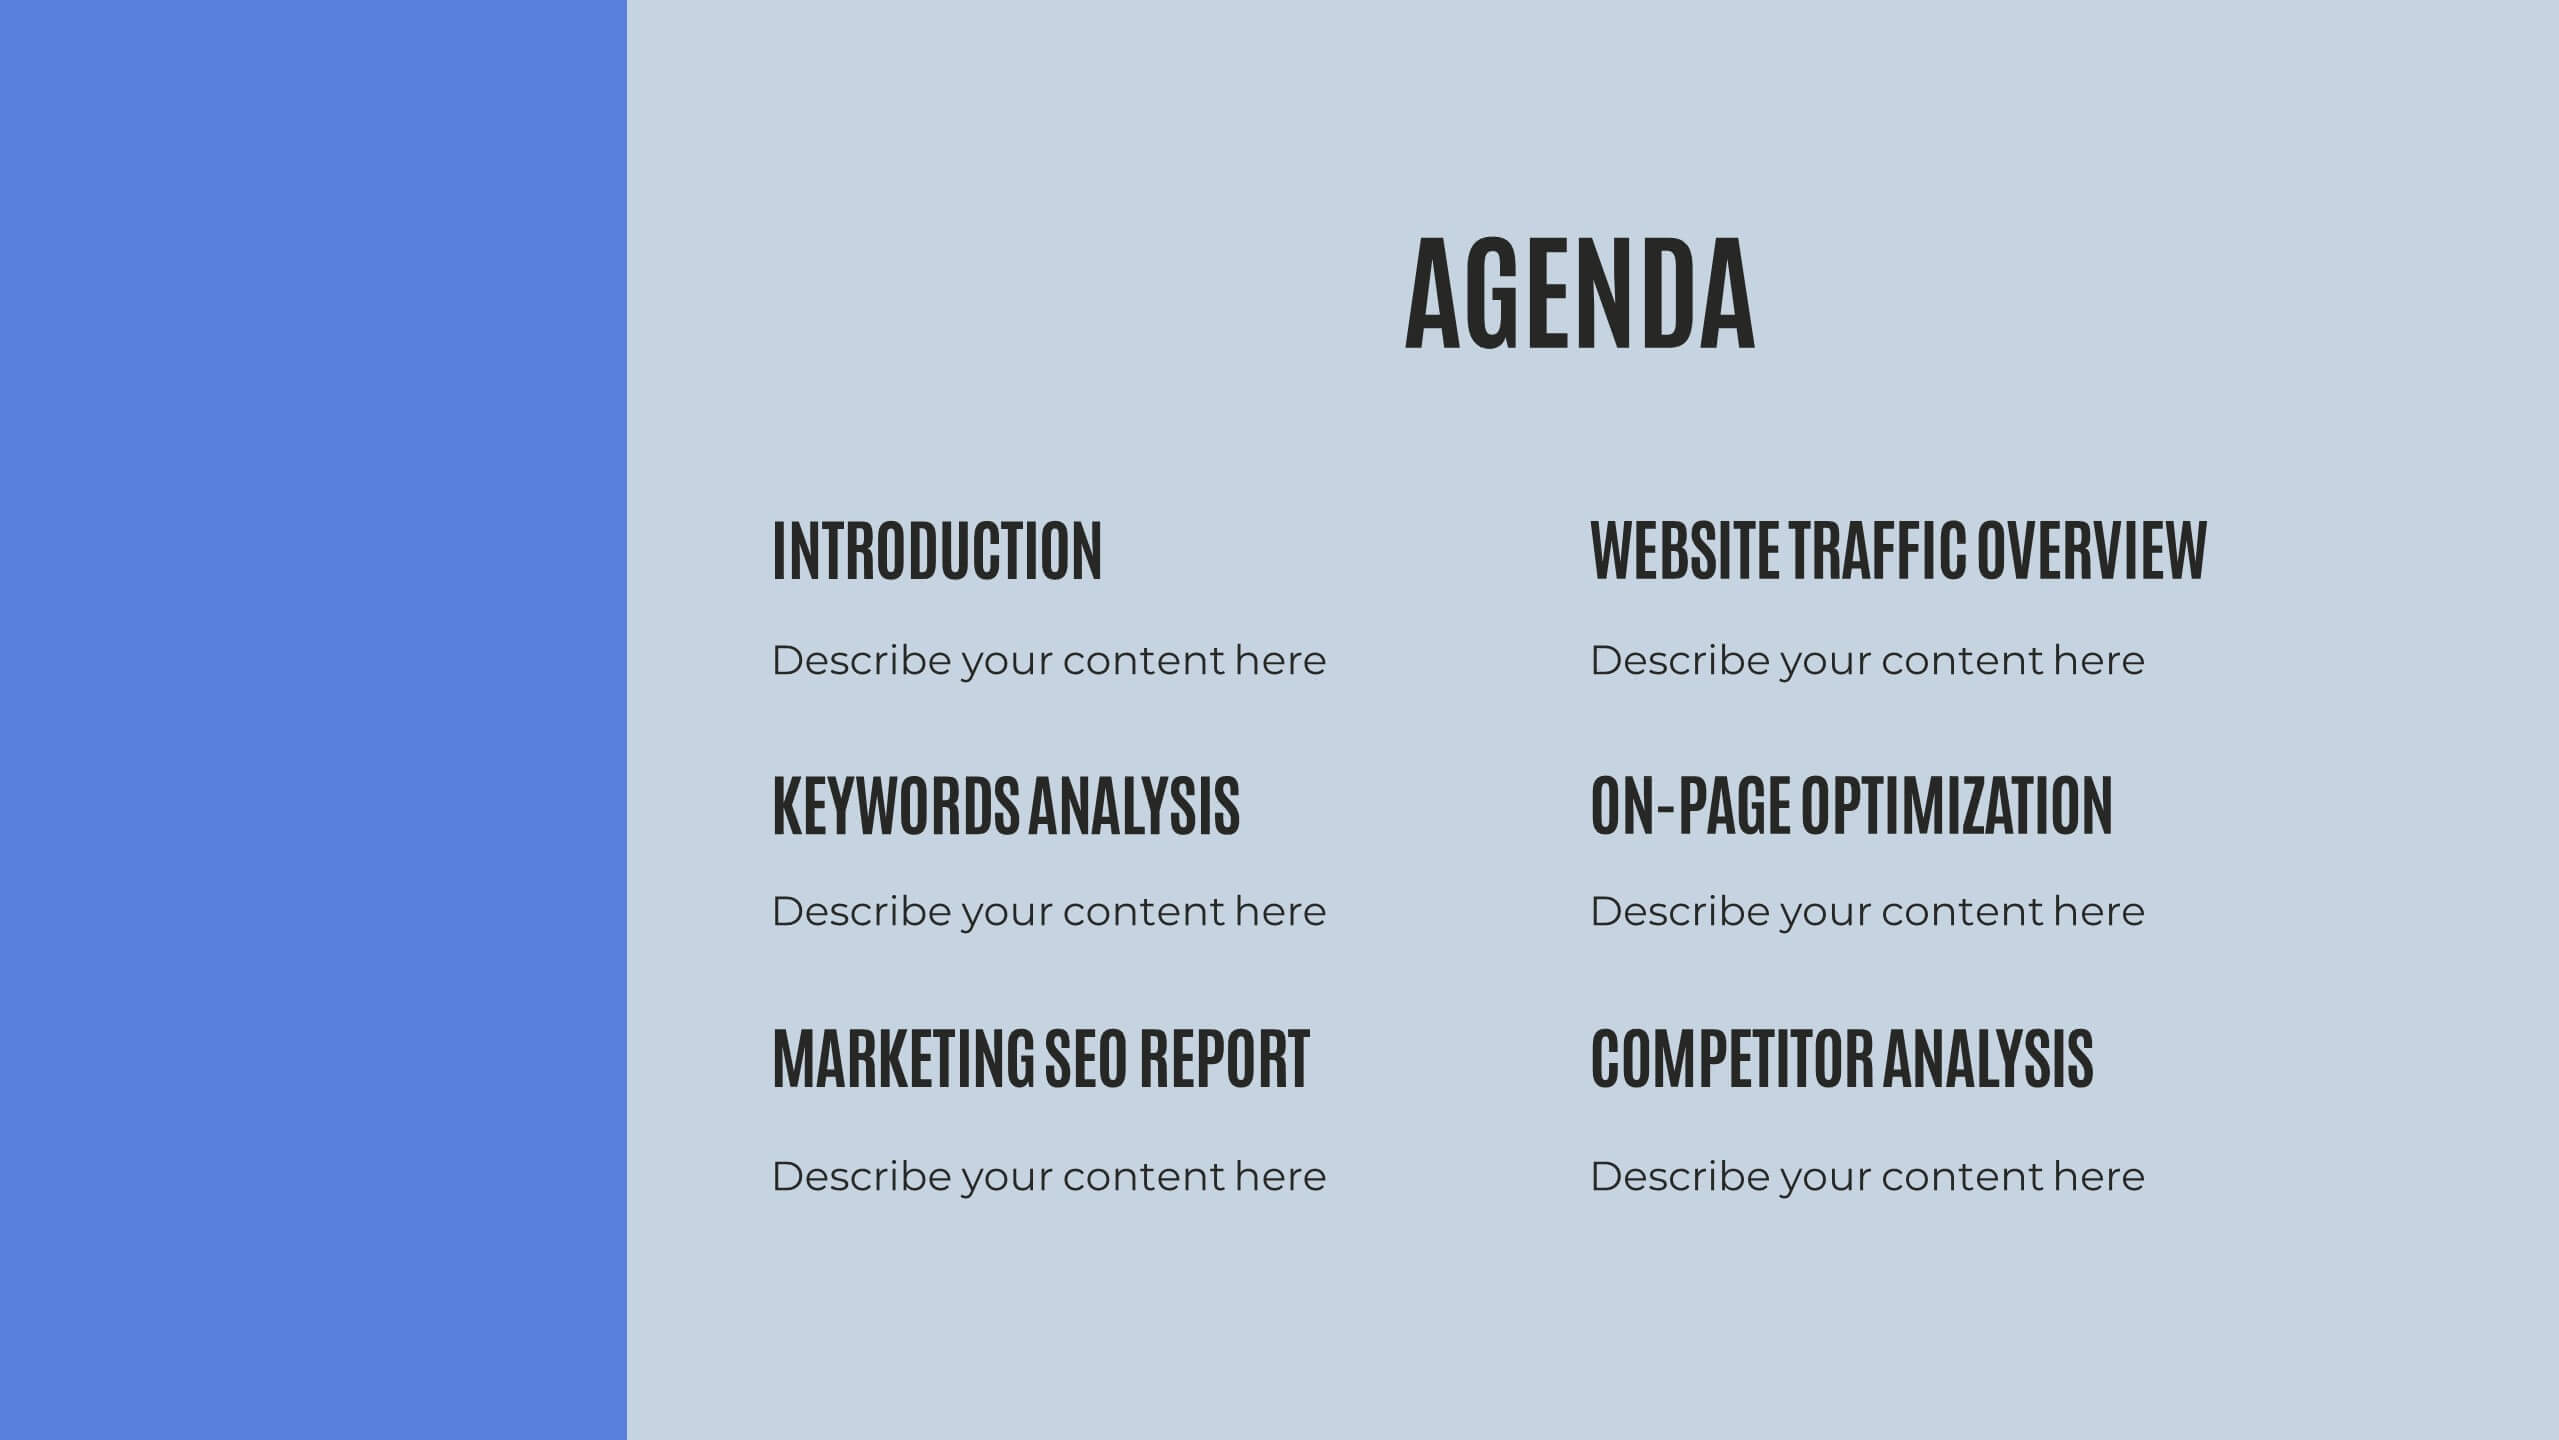
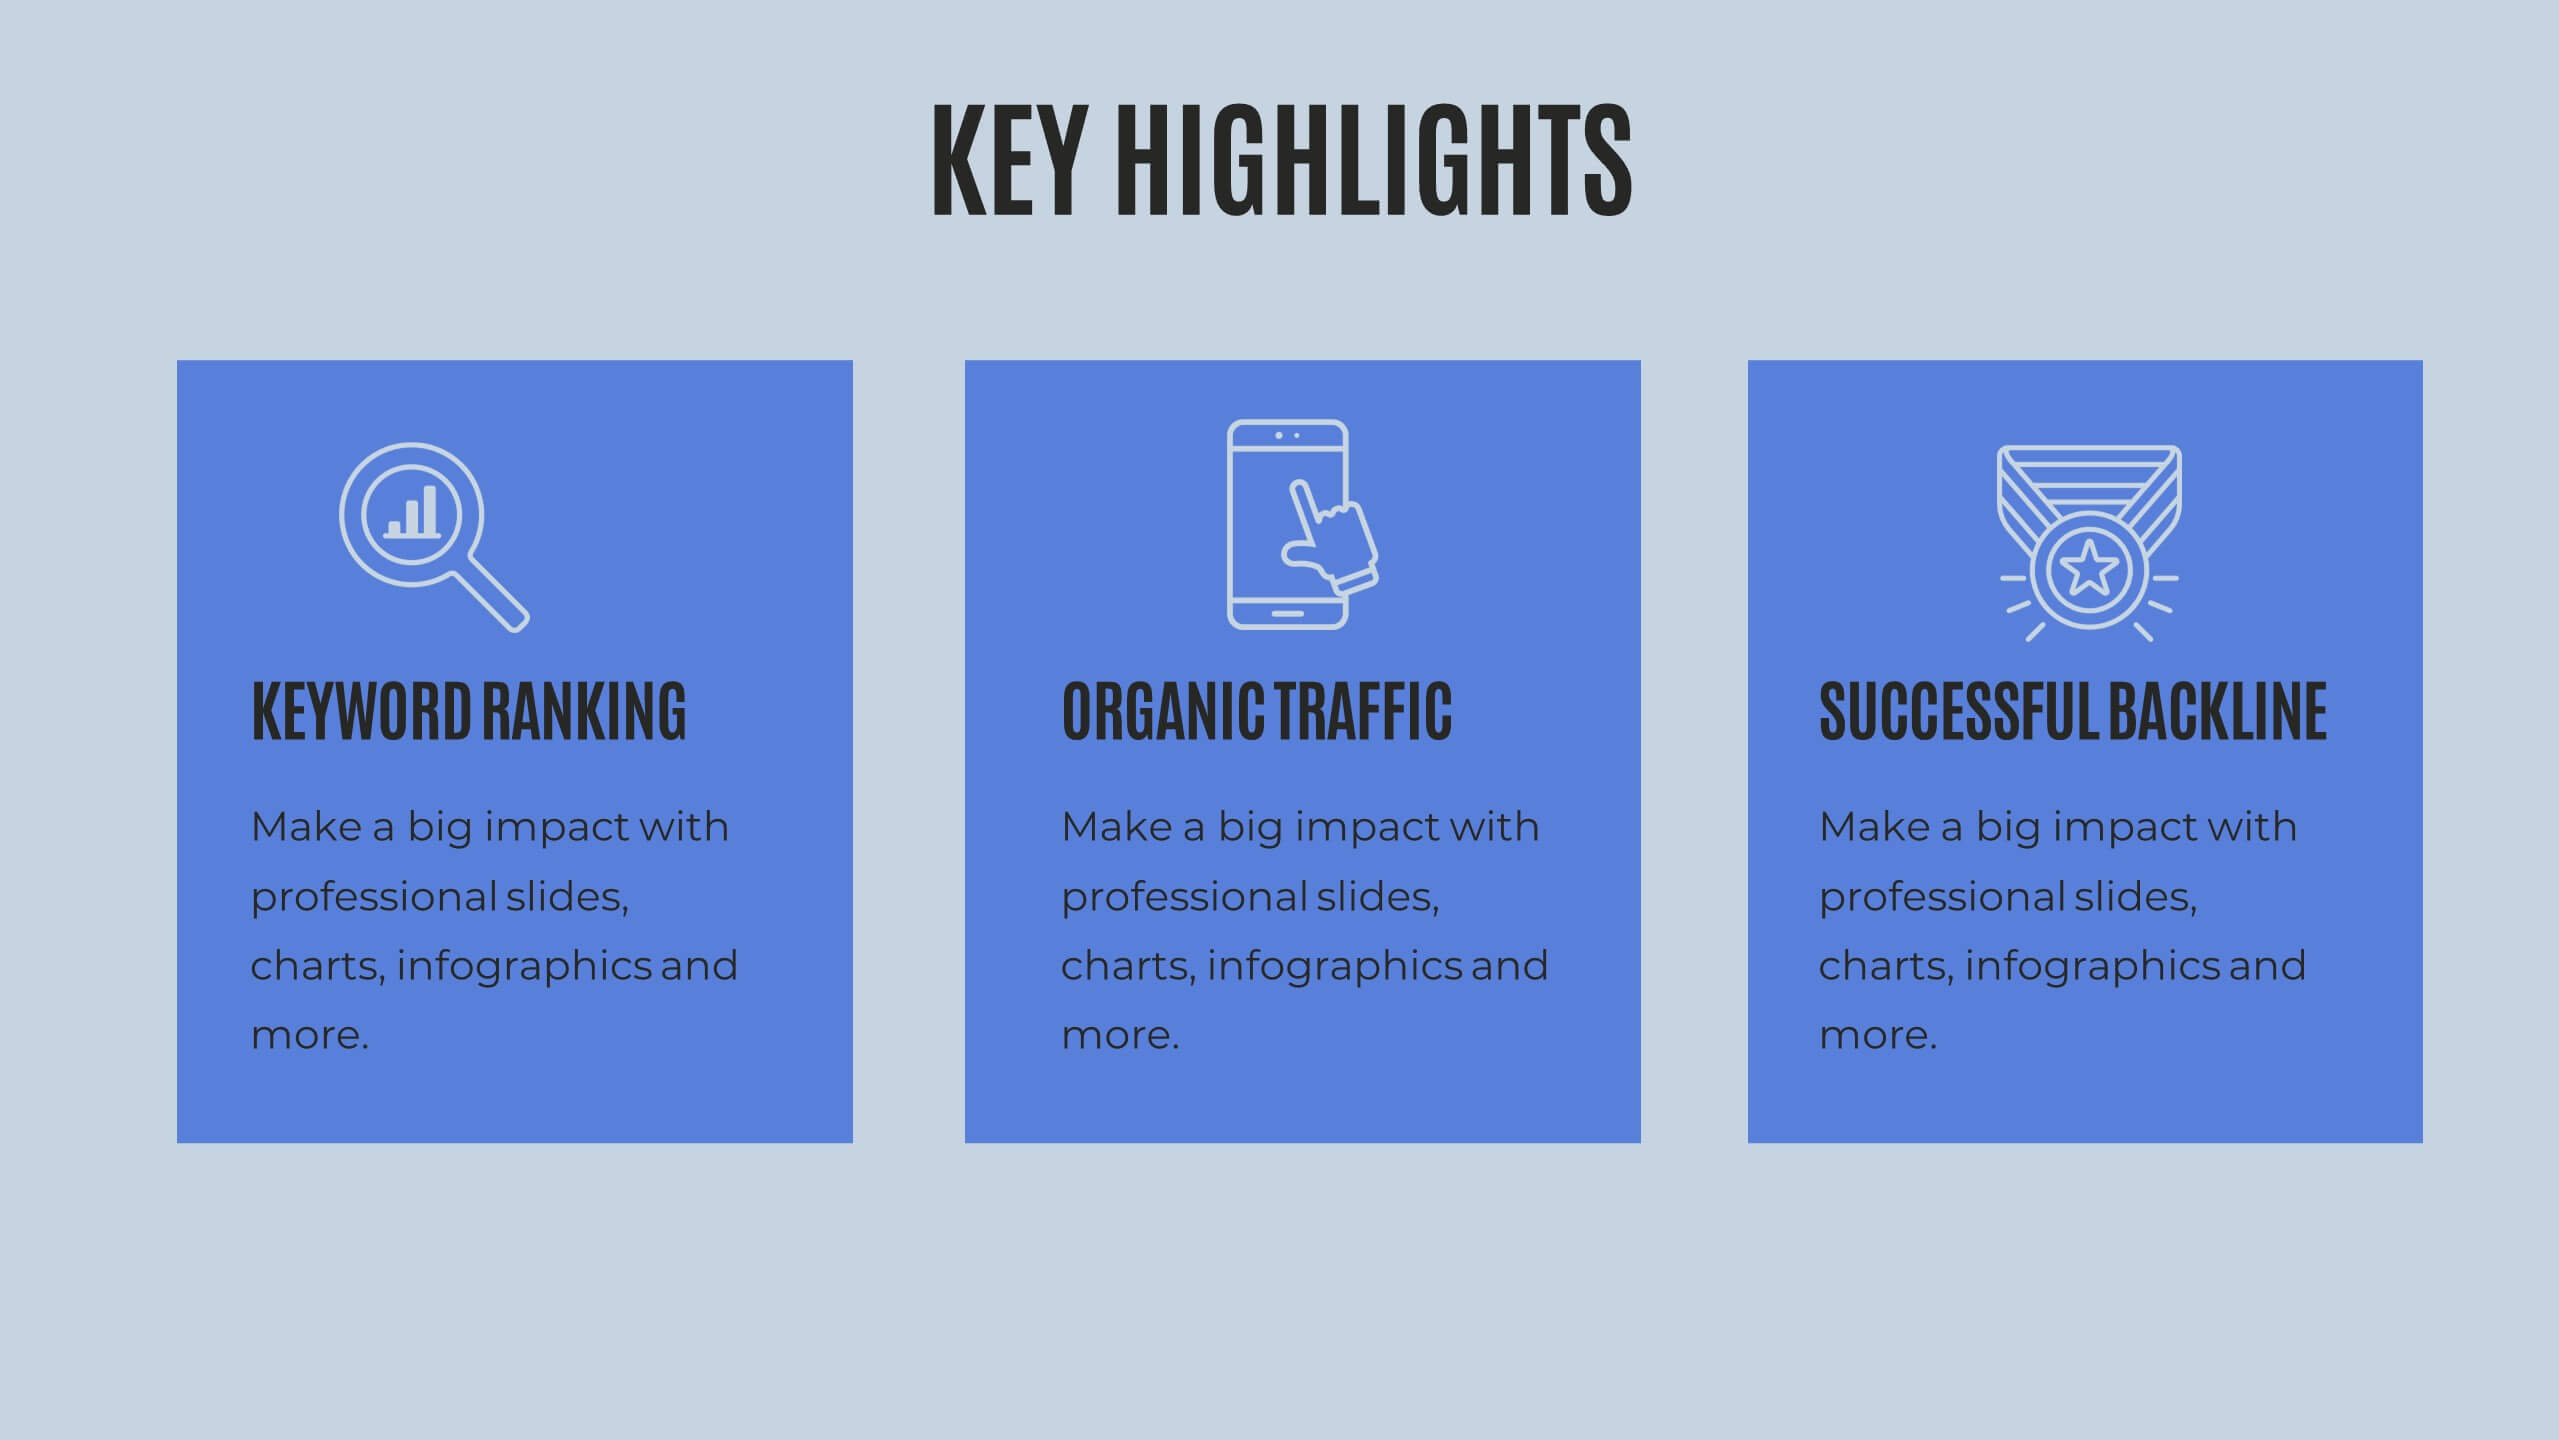
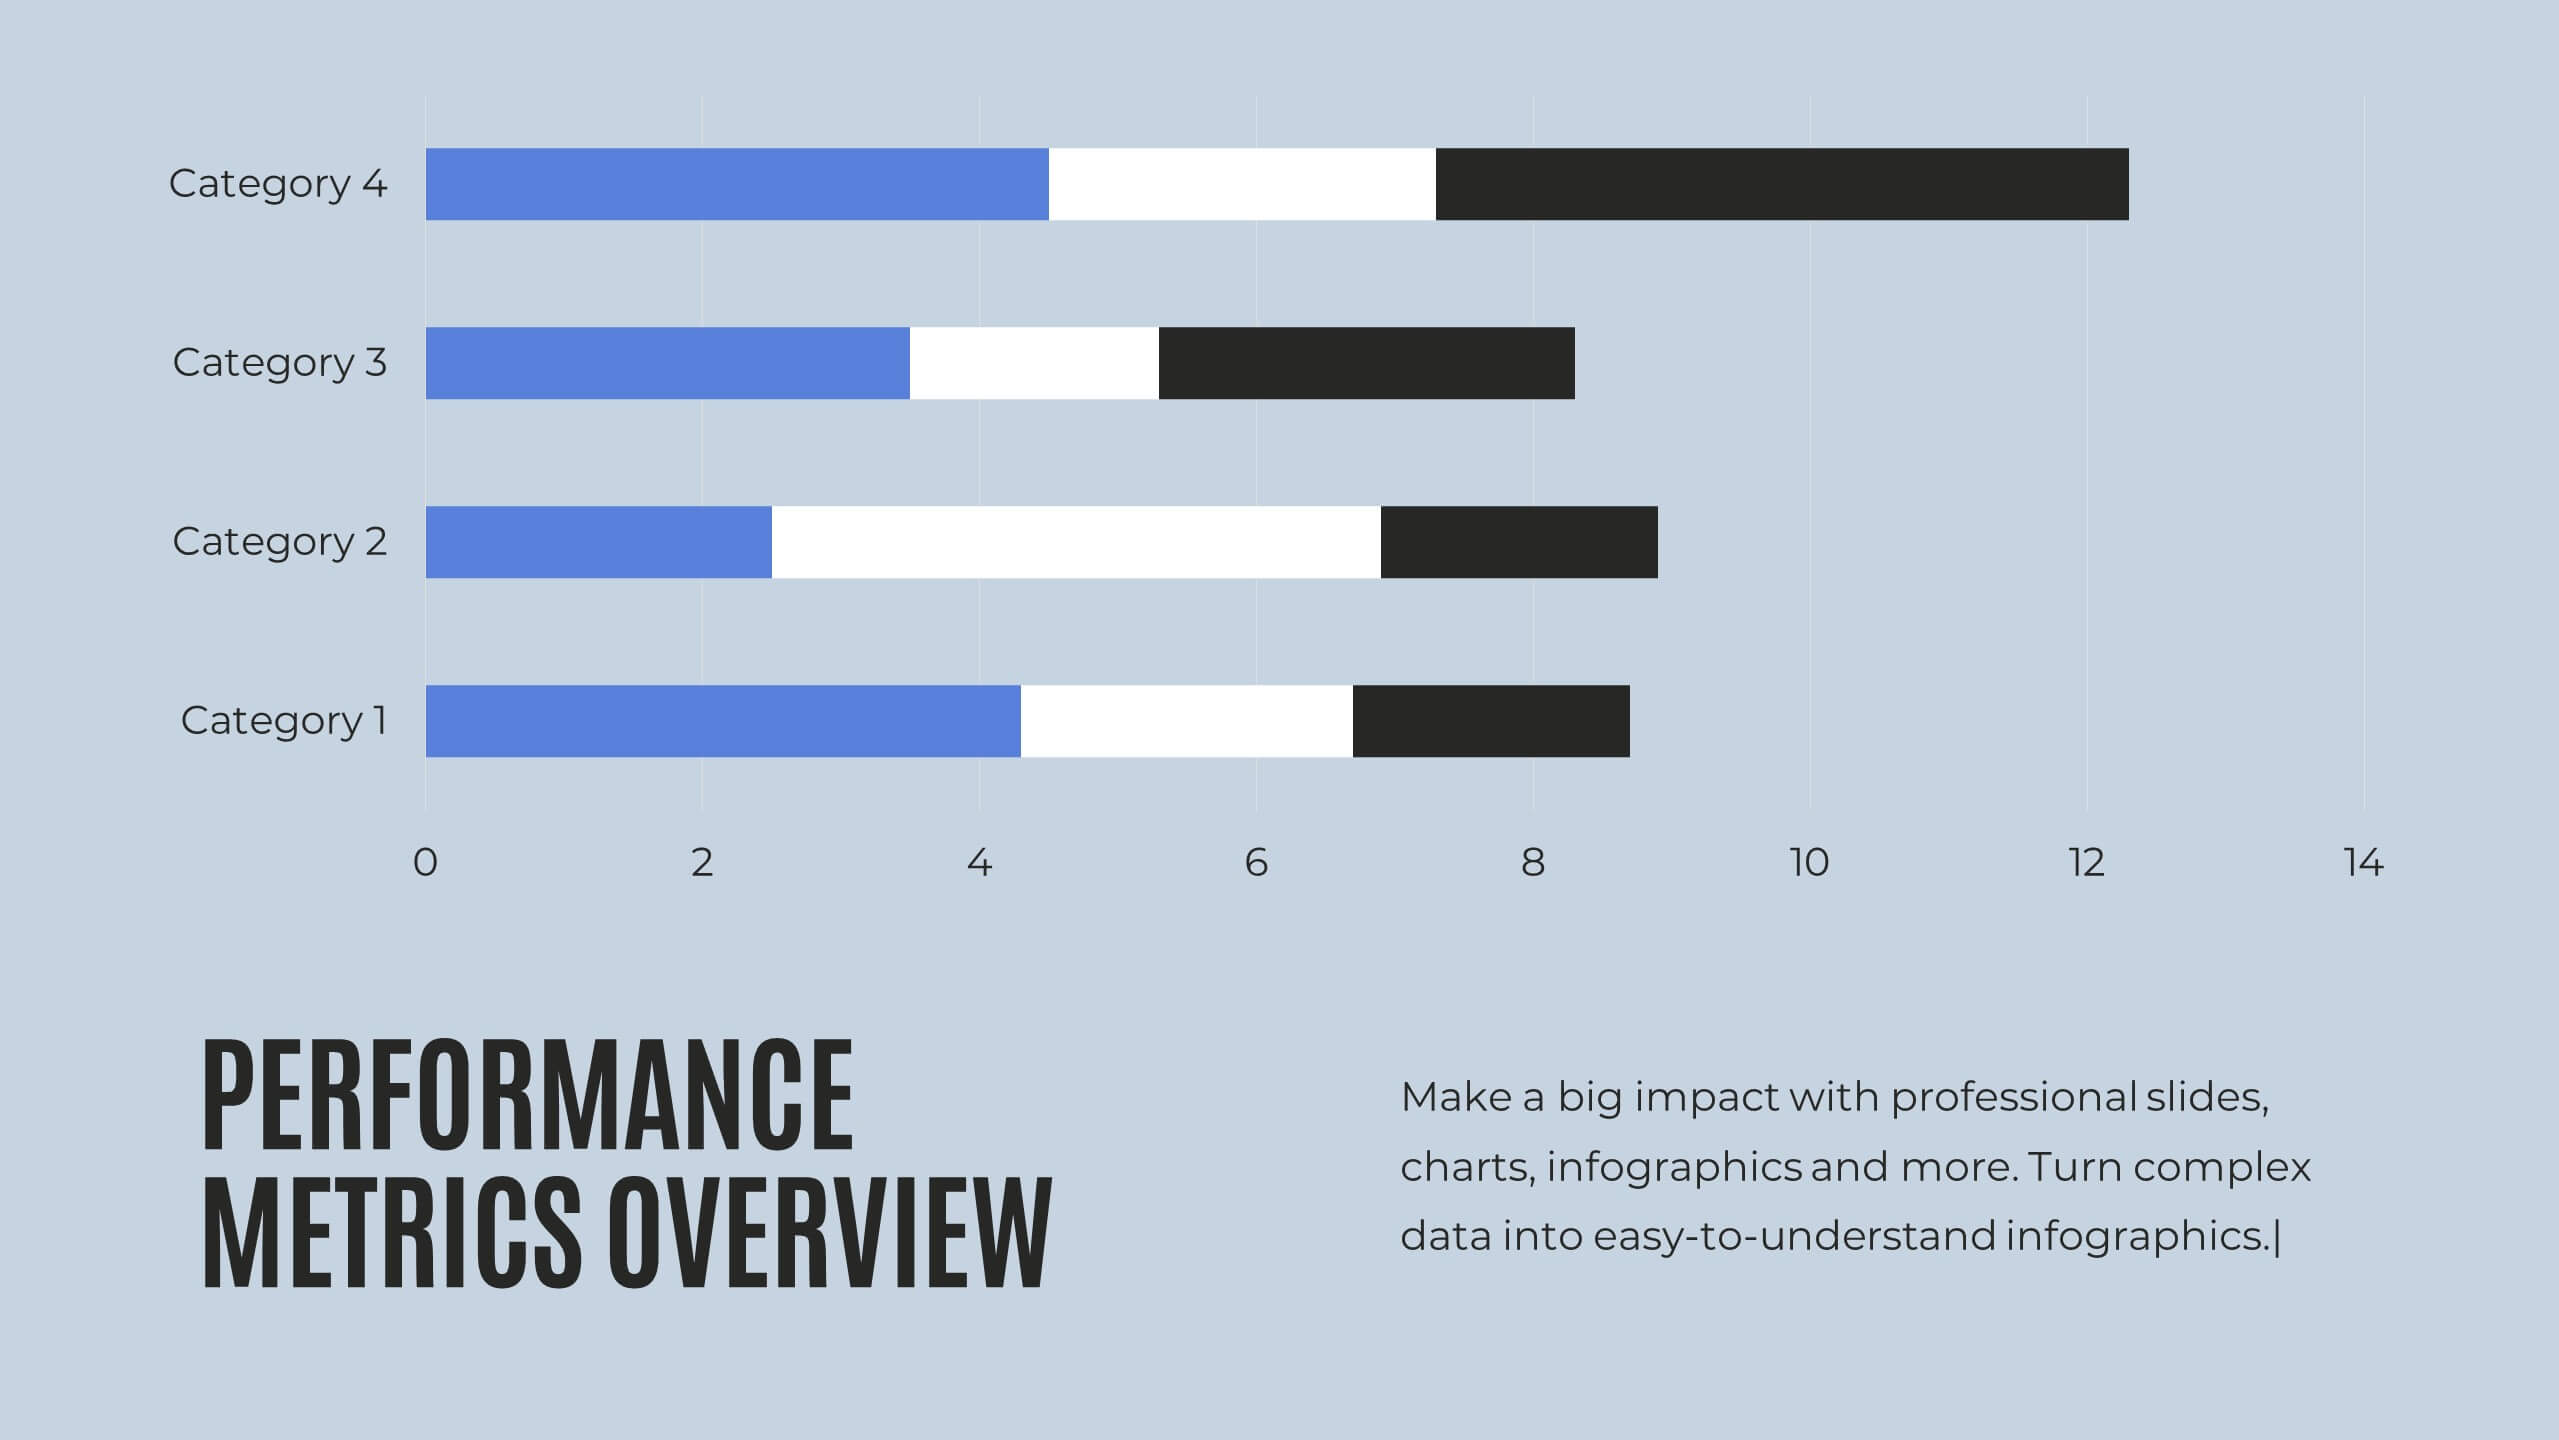
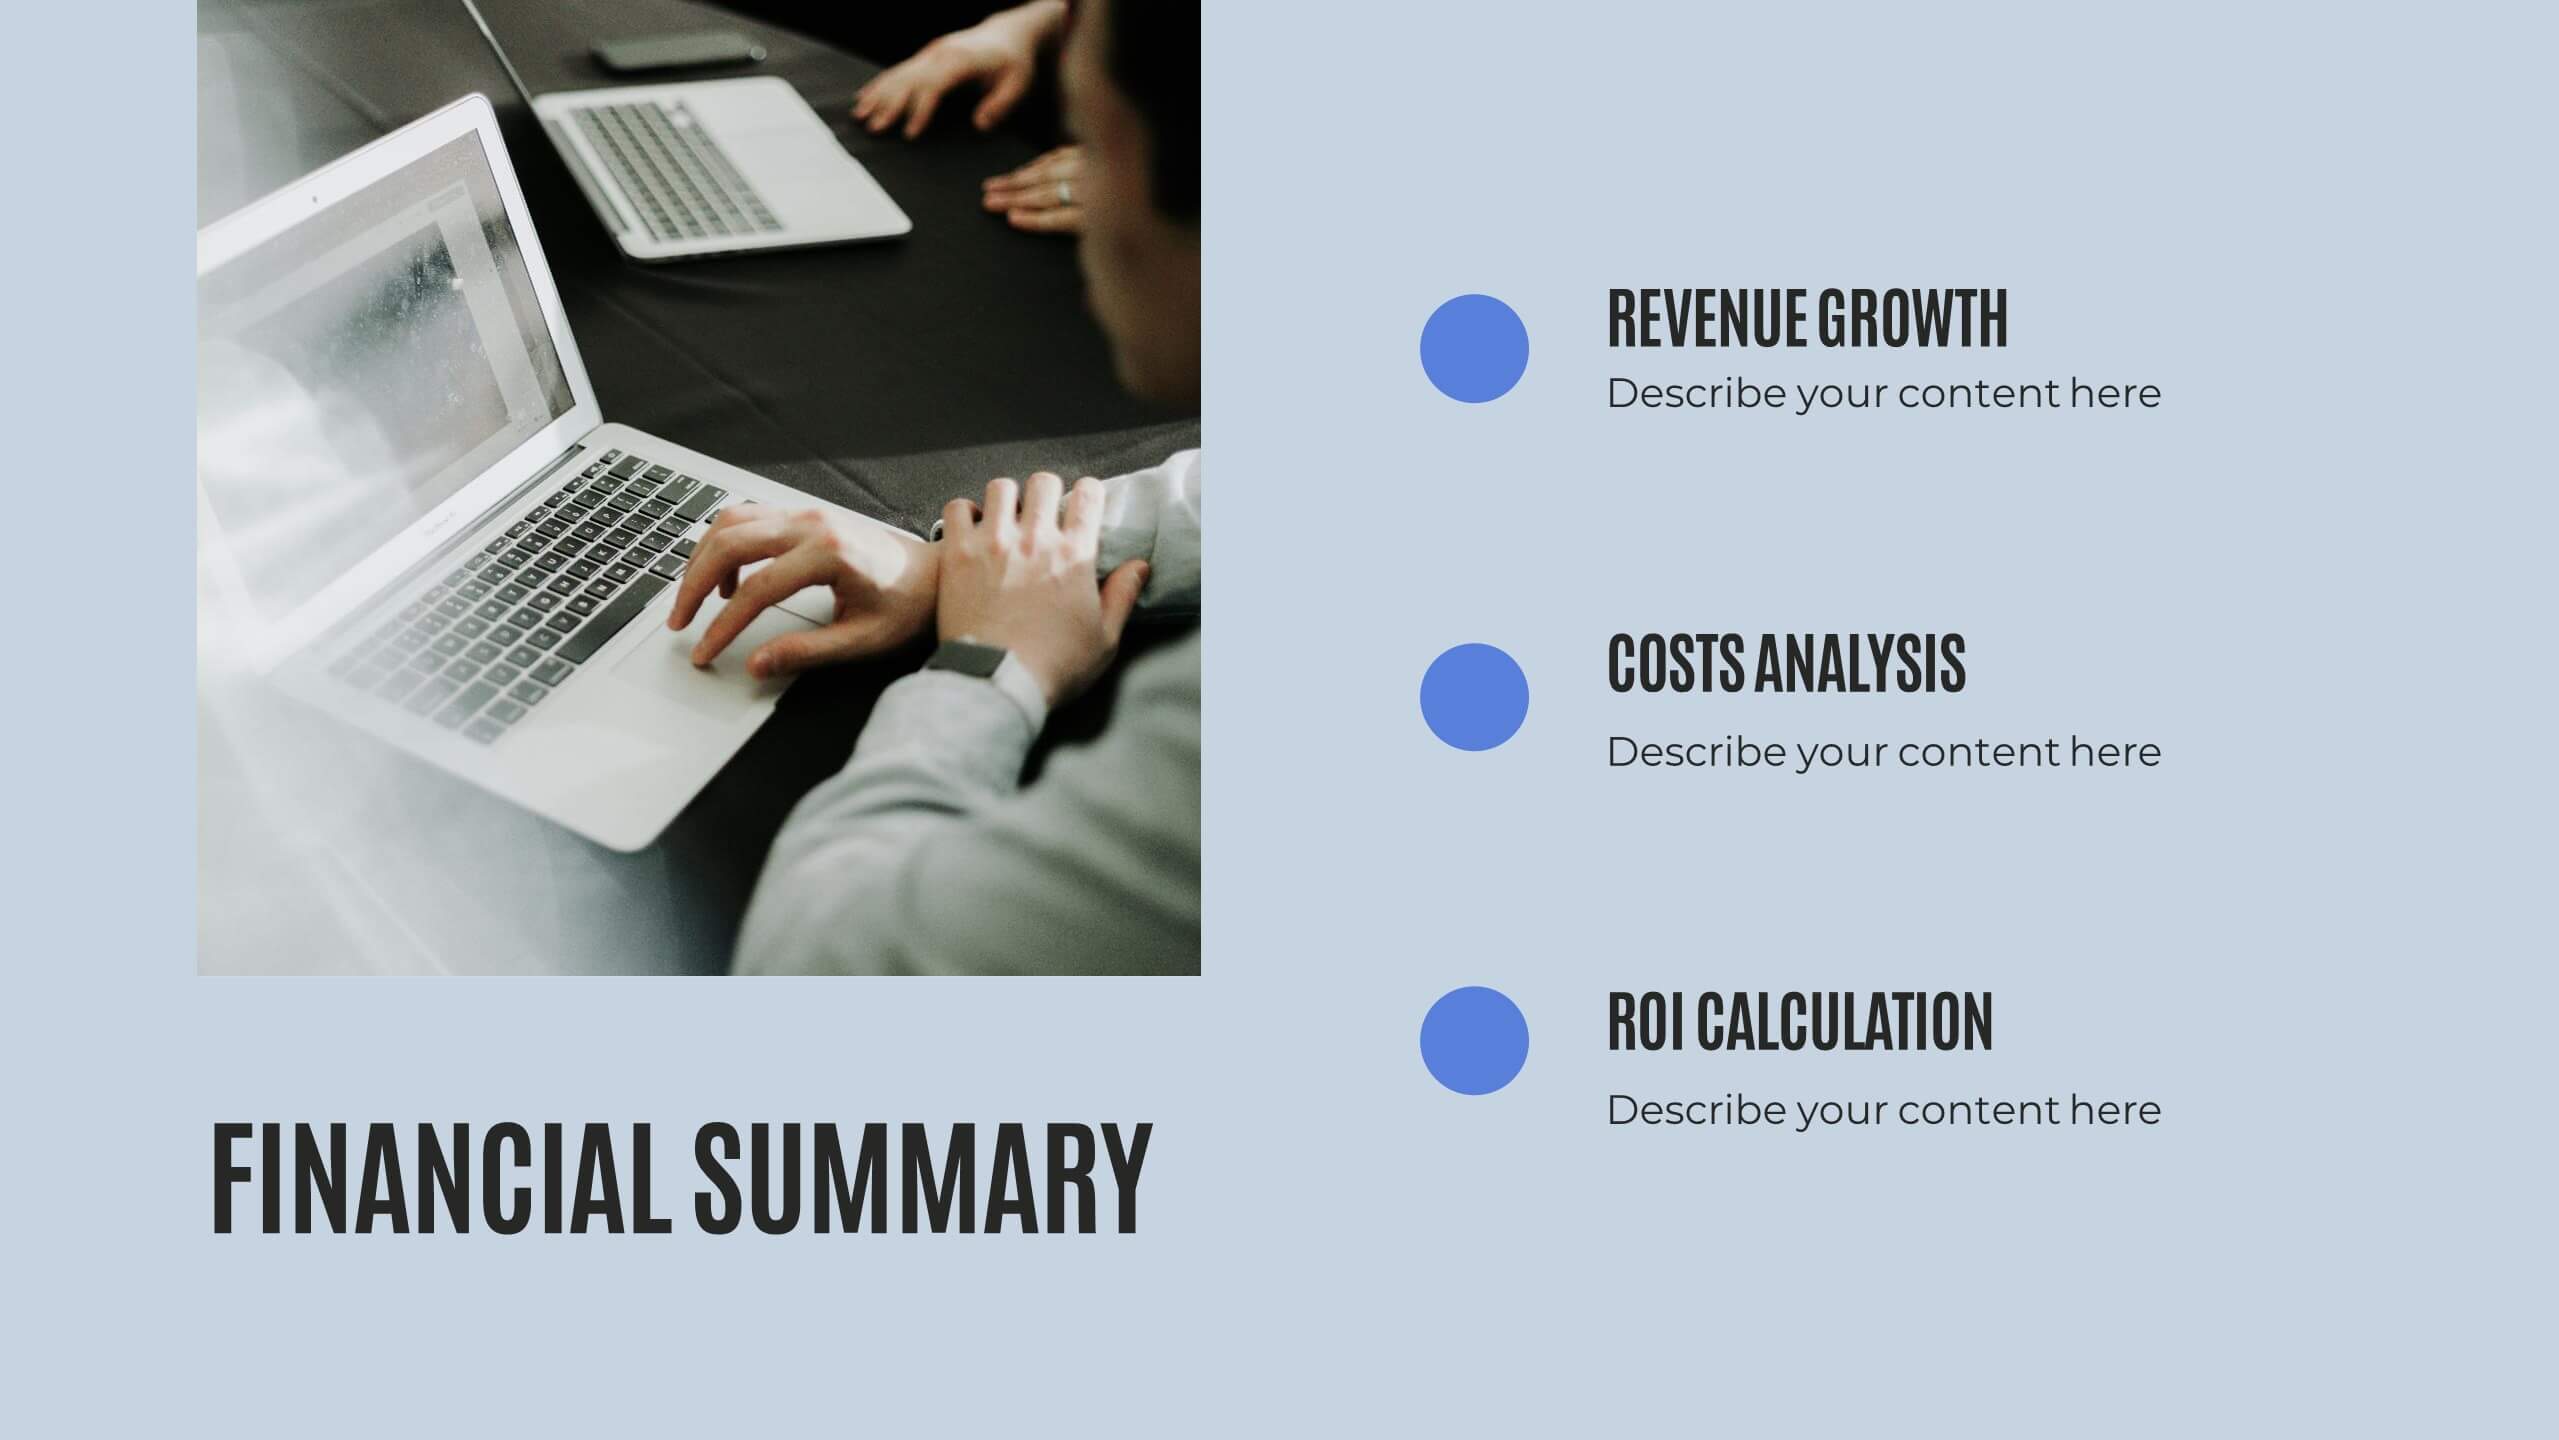
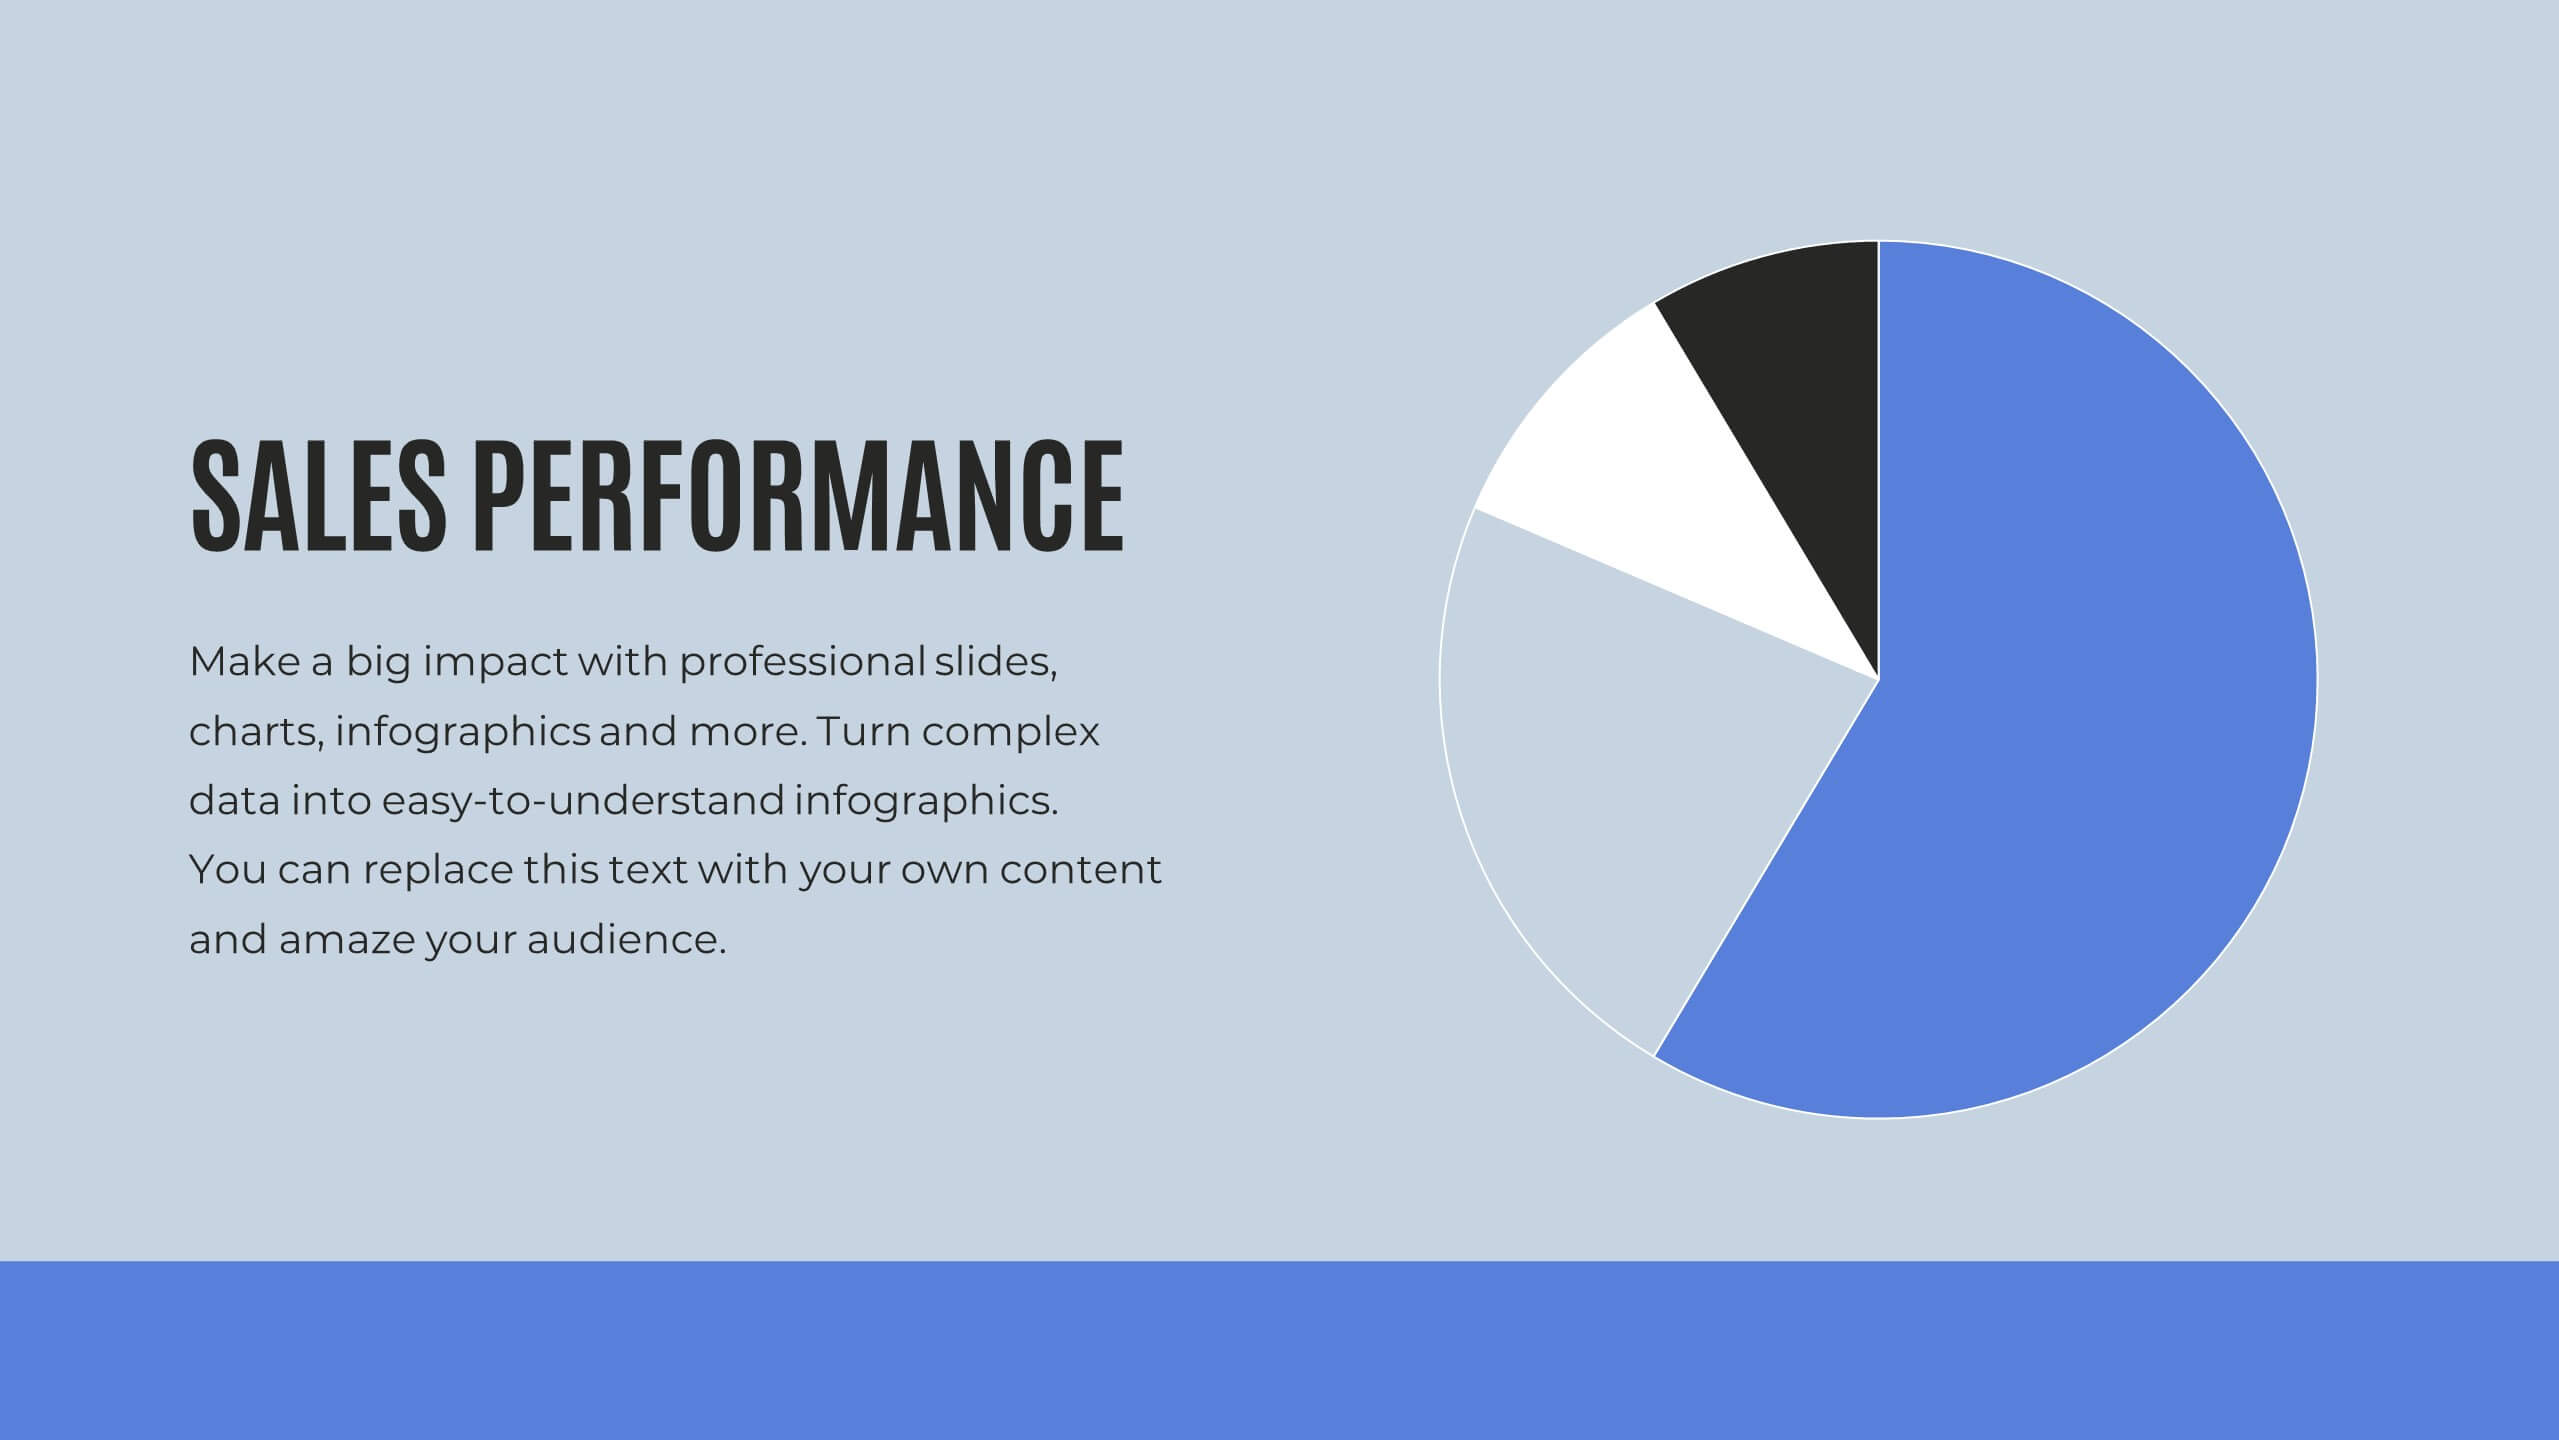
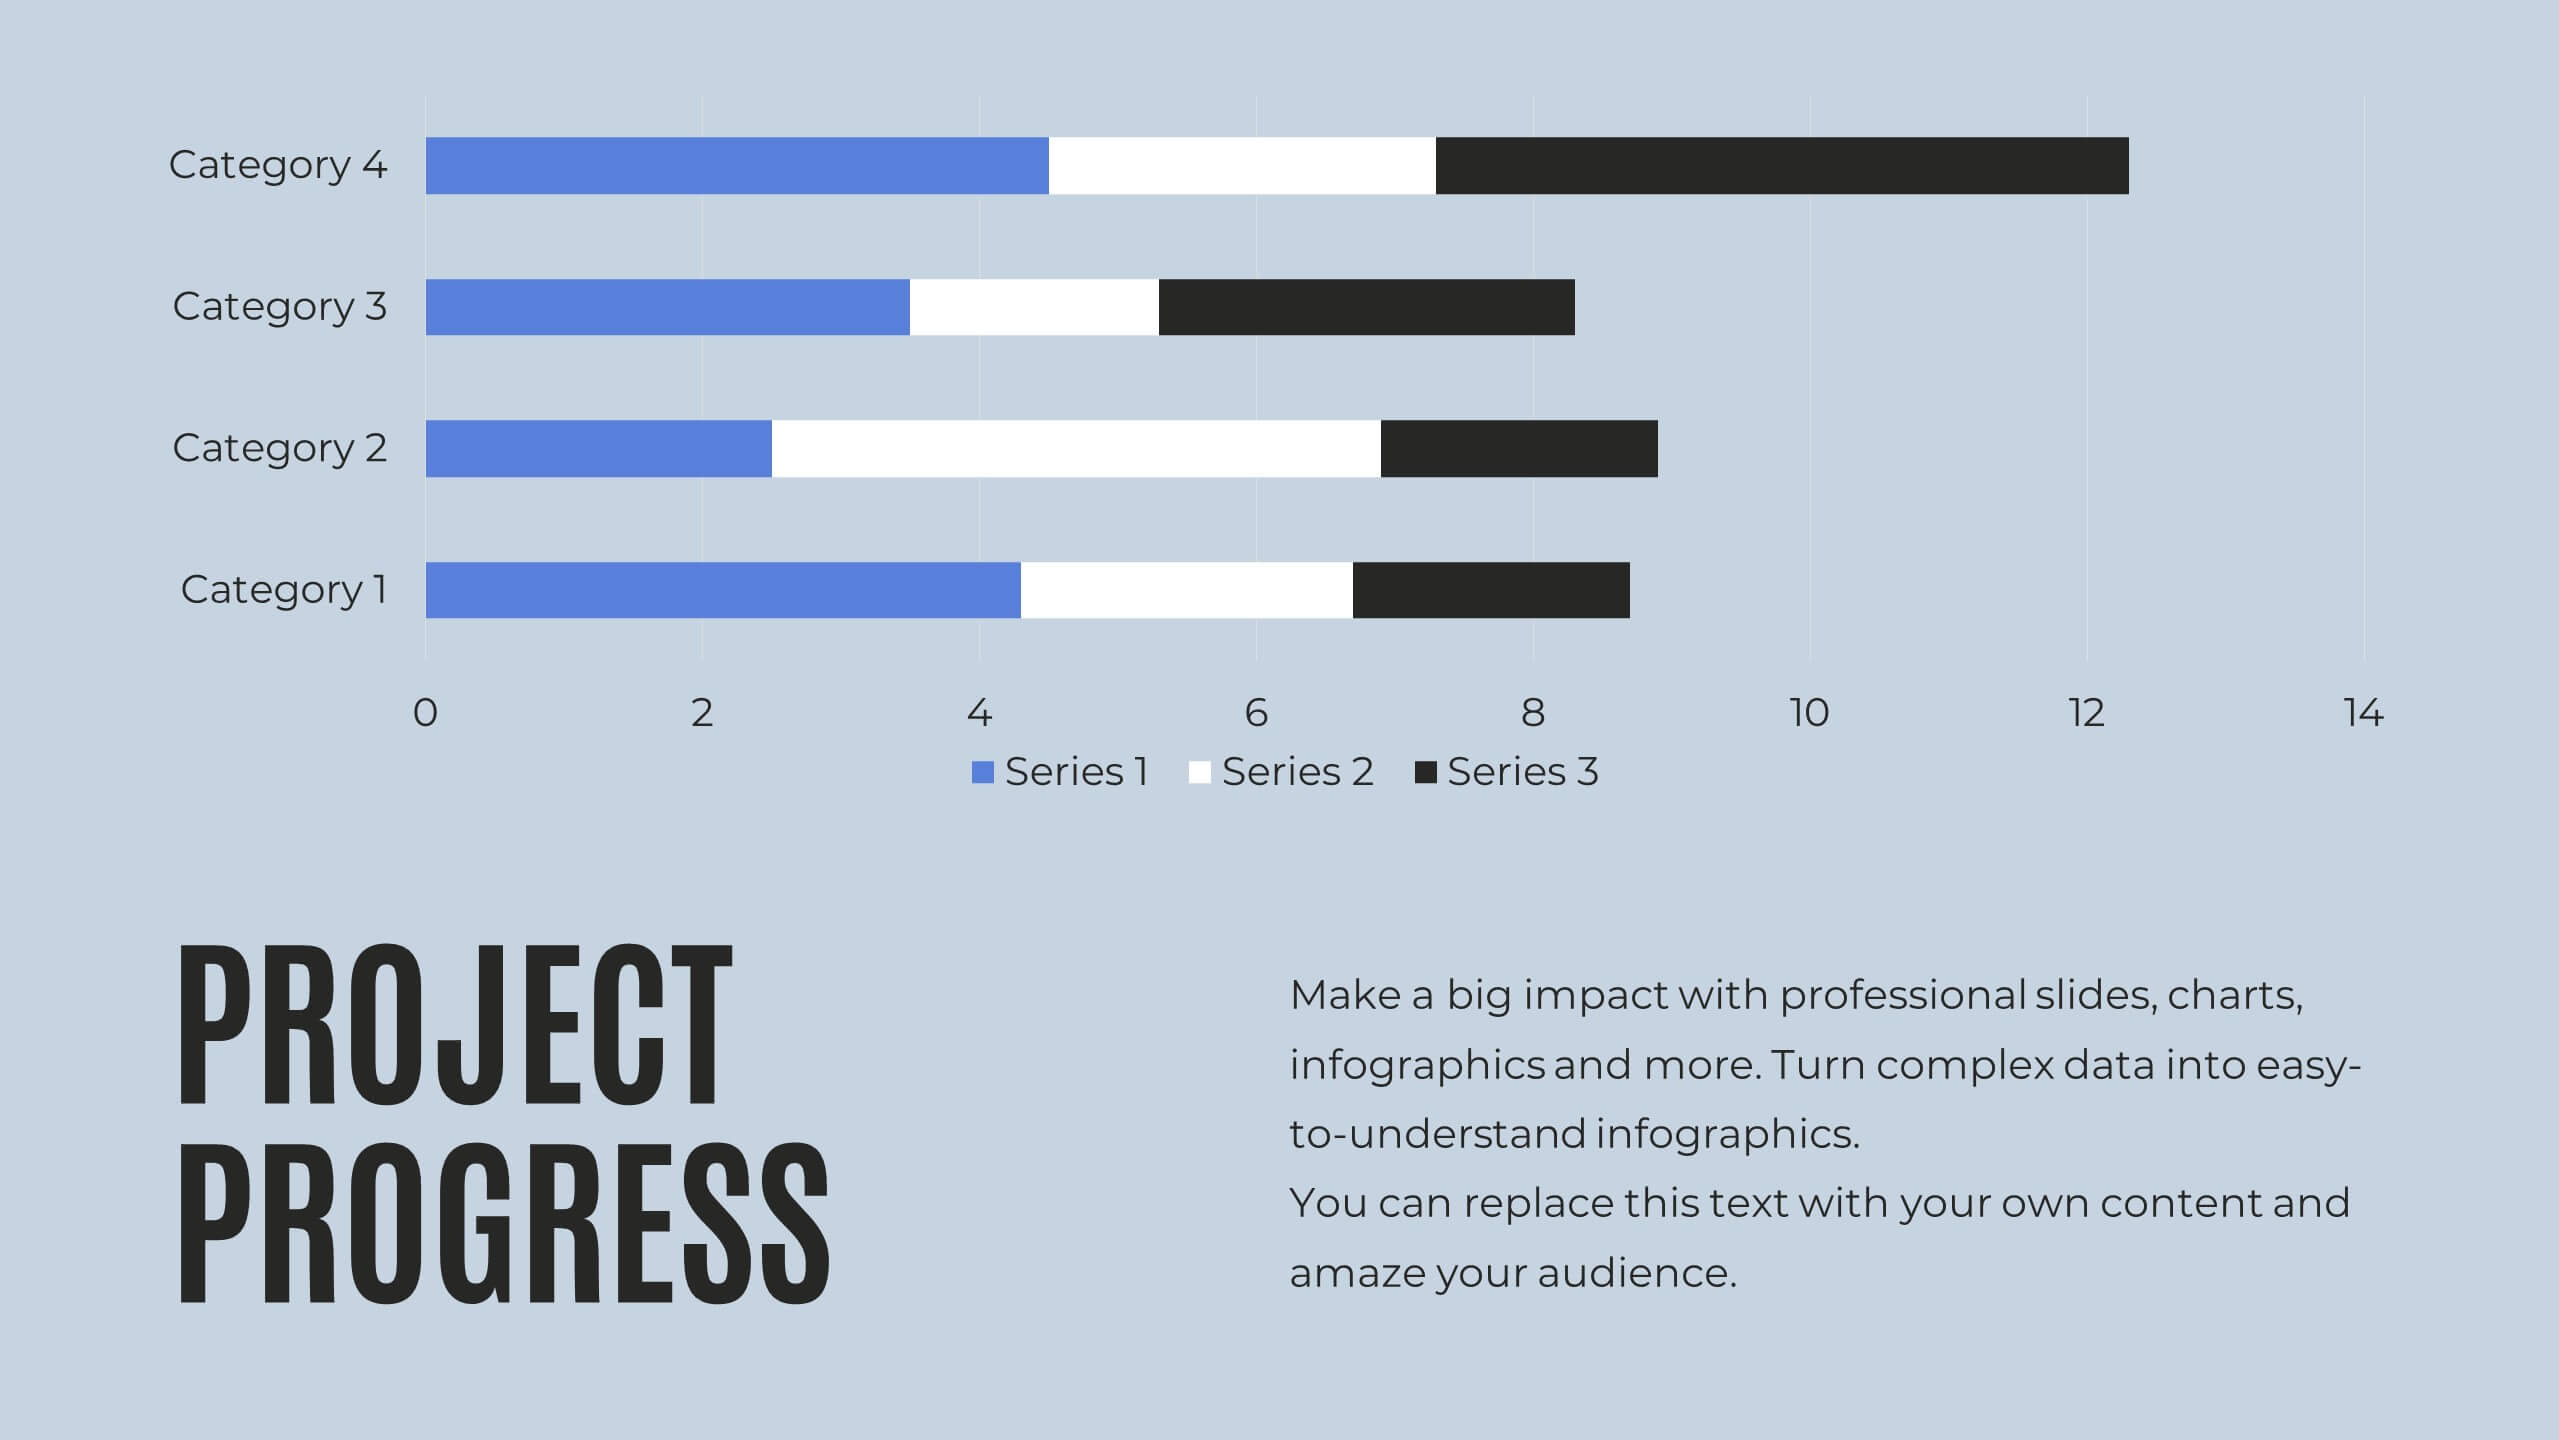
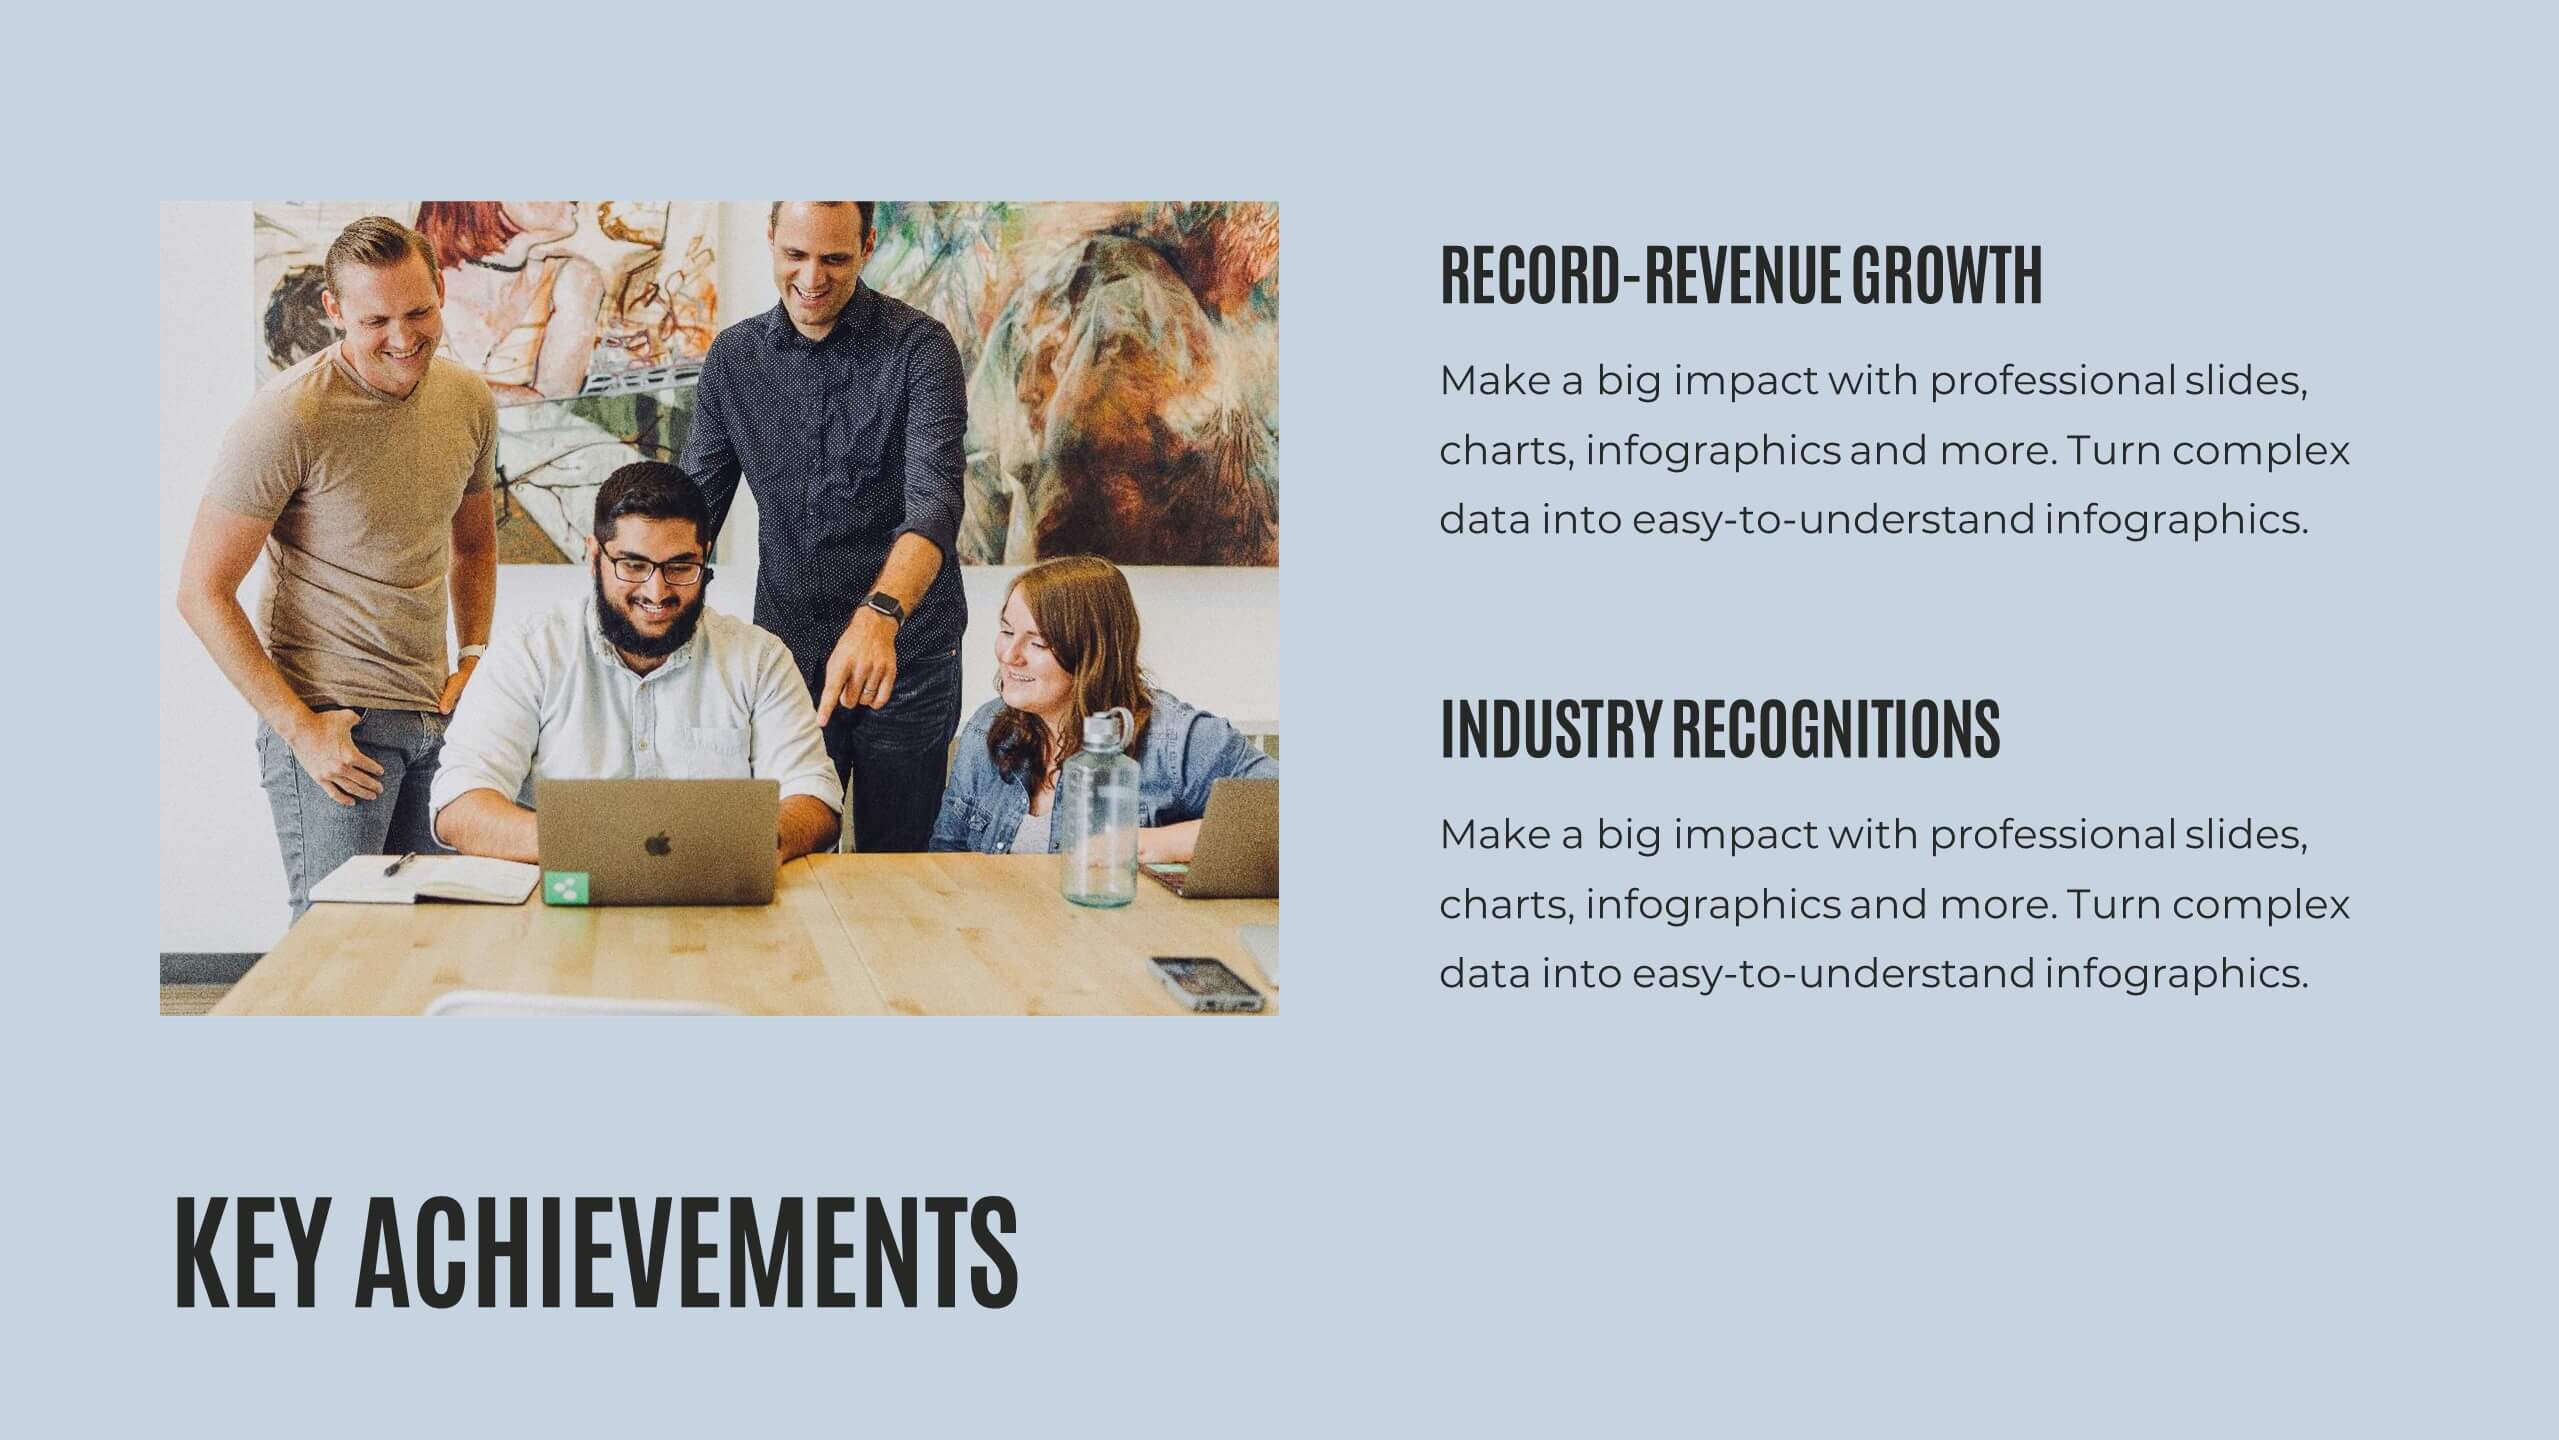
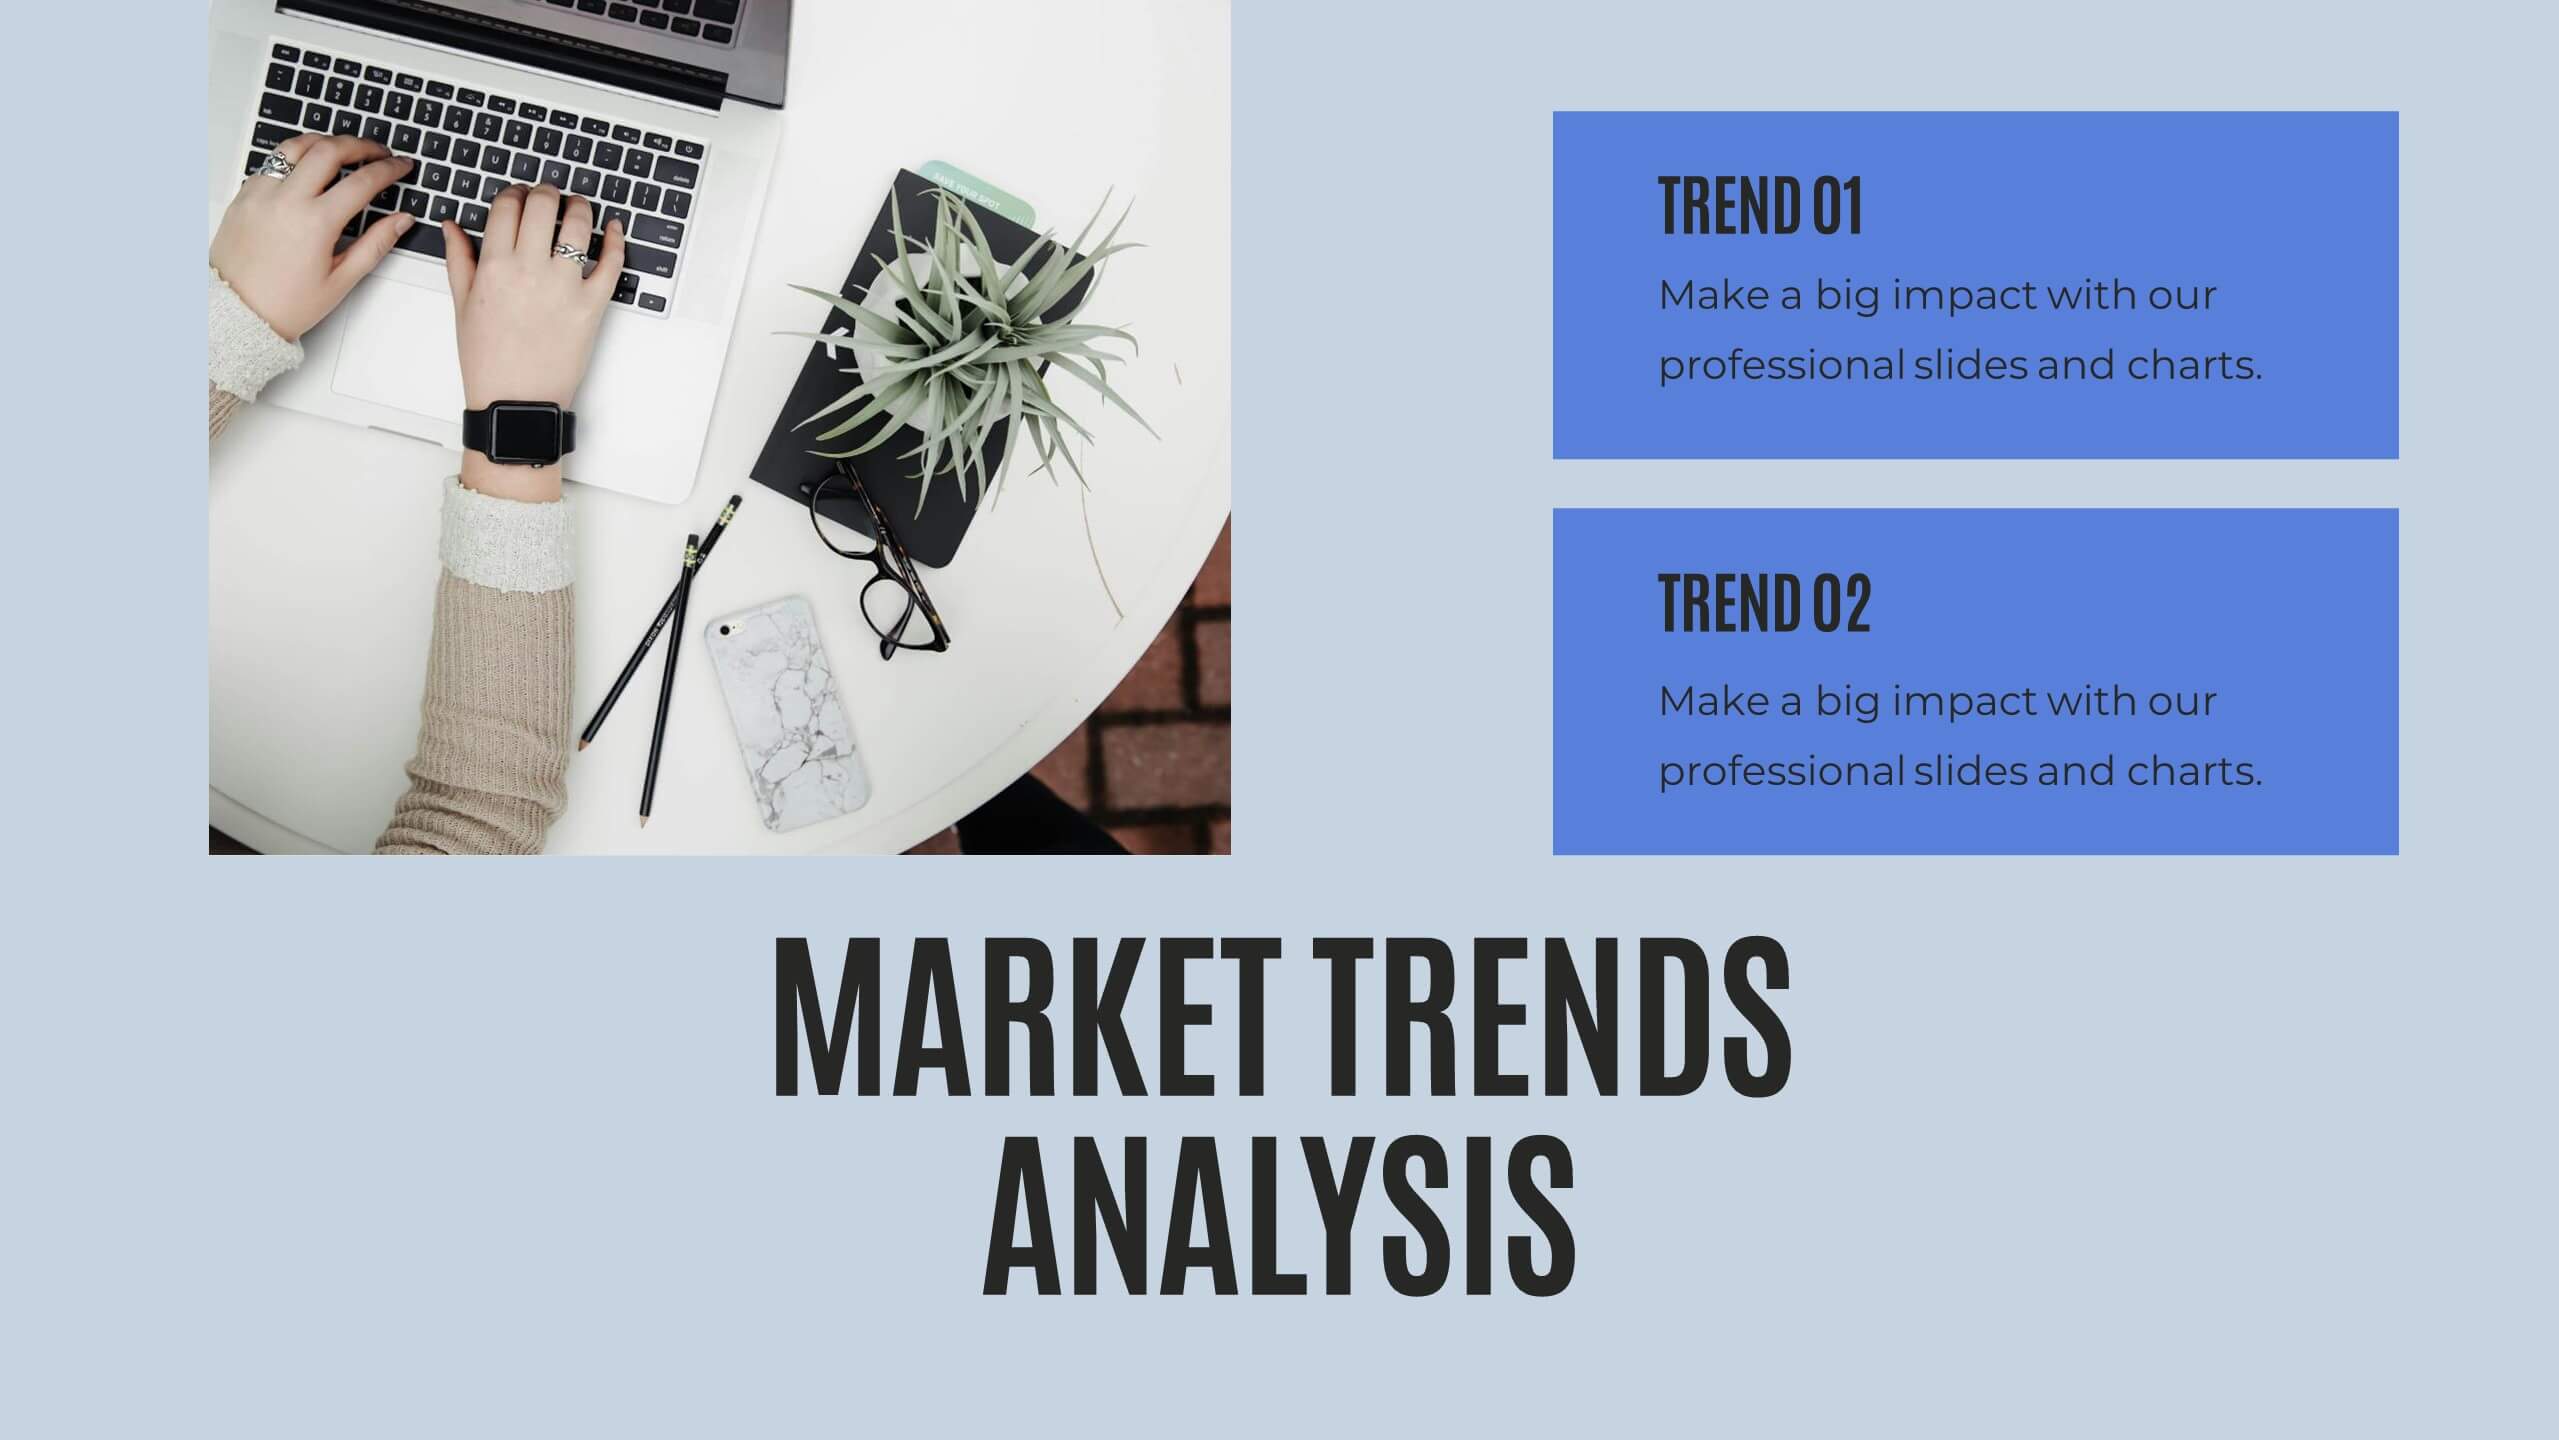
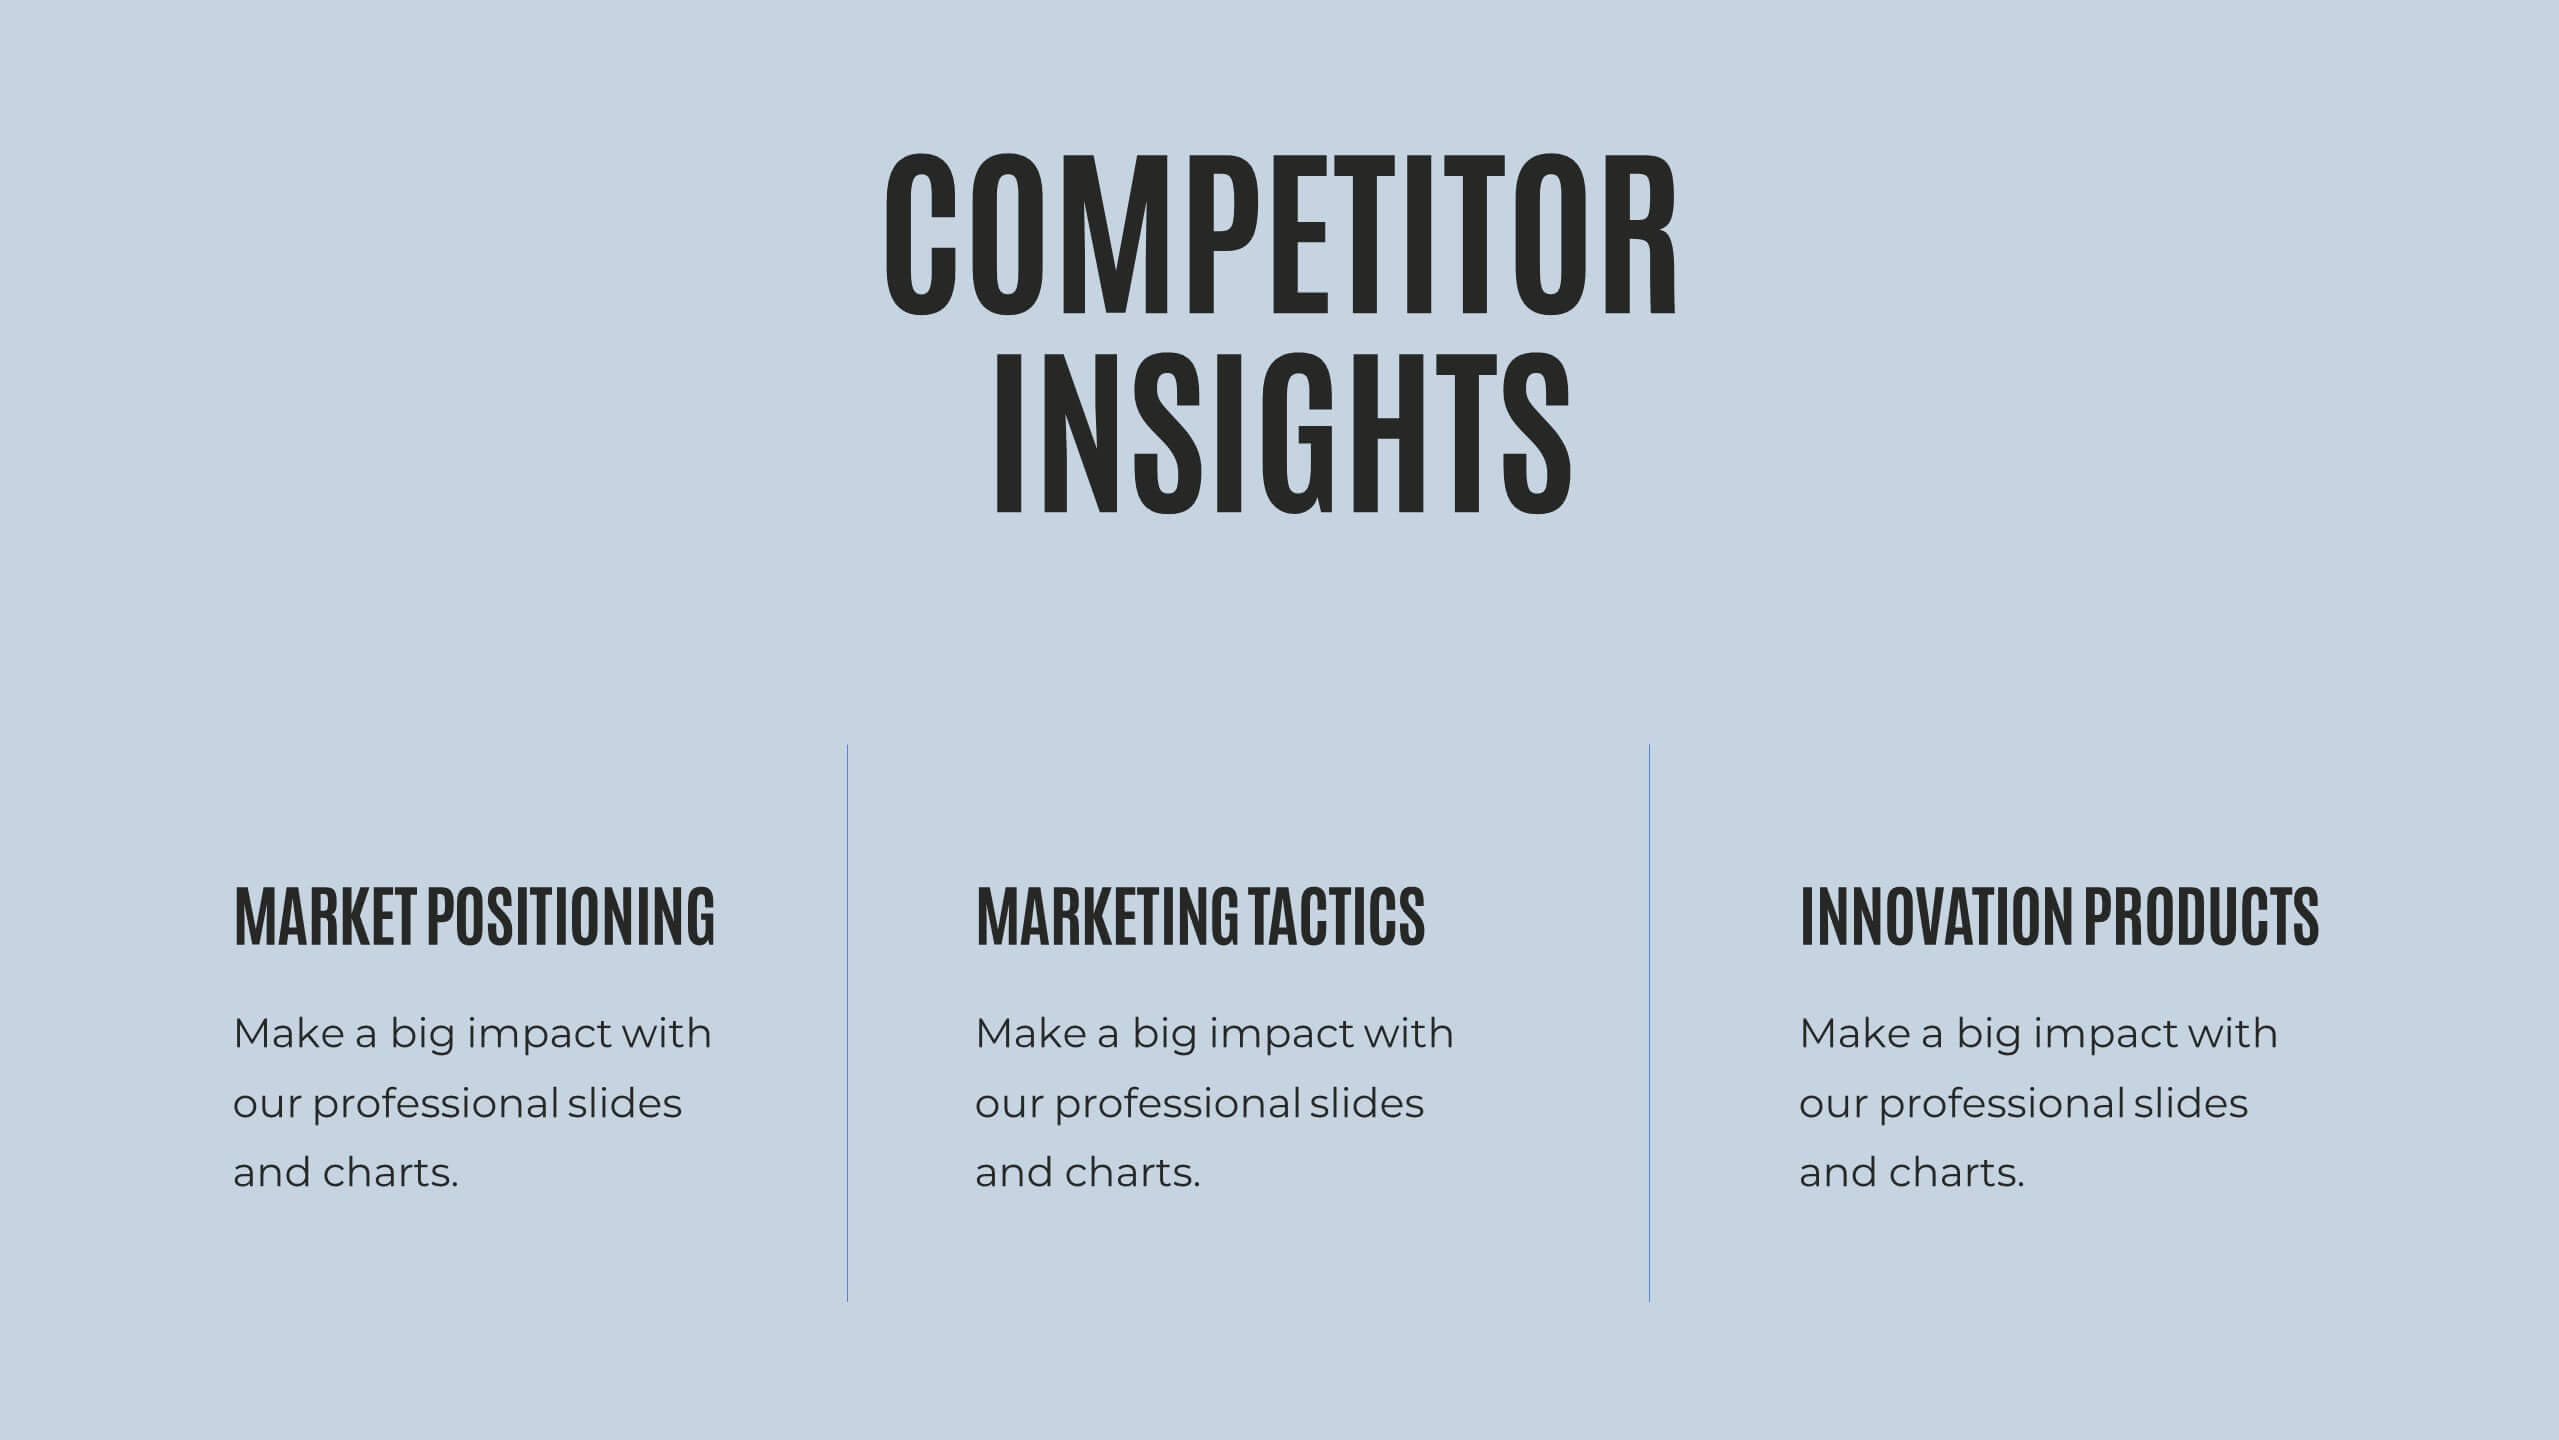
Quill Research Findings Report Presentation
Illuminate your findings with this comprehensive research report template! Perfect for presenting key highlights, performance metrics, and financial summaries, it features professional slides for project progress, risk assessments, and market trends analysis. Engage your audience with clear visuals and detailed content. Compatible with PowerPoint, Keynote, and Google Slides for seamless presentations on any platform.


7 diapositivas
Six Sigma Training Infographic
Six Sigma is a data-driven methodology and approach for eliminating defects and improving processes in any business. This is a bold, transformative tool designed to equip individuals and organizations with the prowess of Six Sigma methodology. This template is the roadmap to excellence, paving the way for achieving remarkable improvements and efficiency. Fully customizable and compatible with Powerpoint, Keynote, and Google Slides. Unleash the power of Six Sigma through our Six Sigma Training Infographic. Let this be your guide to mastering the art of perfection, driving transformative change, and marching boldly towards operational excellence.


6 diapositivas
Hierarchical Pyramid Model Presentation
Break down organizational structures or business strategies effectively with the Hierarchical Pyramid Model Presentation. This slide features a five-tier pyramid design, perfect for representing levels of authority, team structures, or sequential priorities. Each layer includes matching labels and icons for added clarity. Fully editable and compatible with PowerPoint, Keynote, and Google Slides.


5 diapositivas
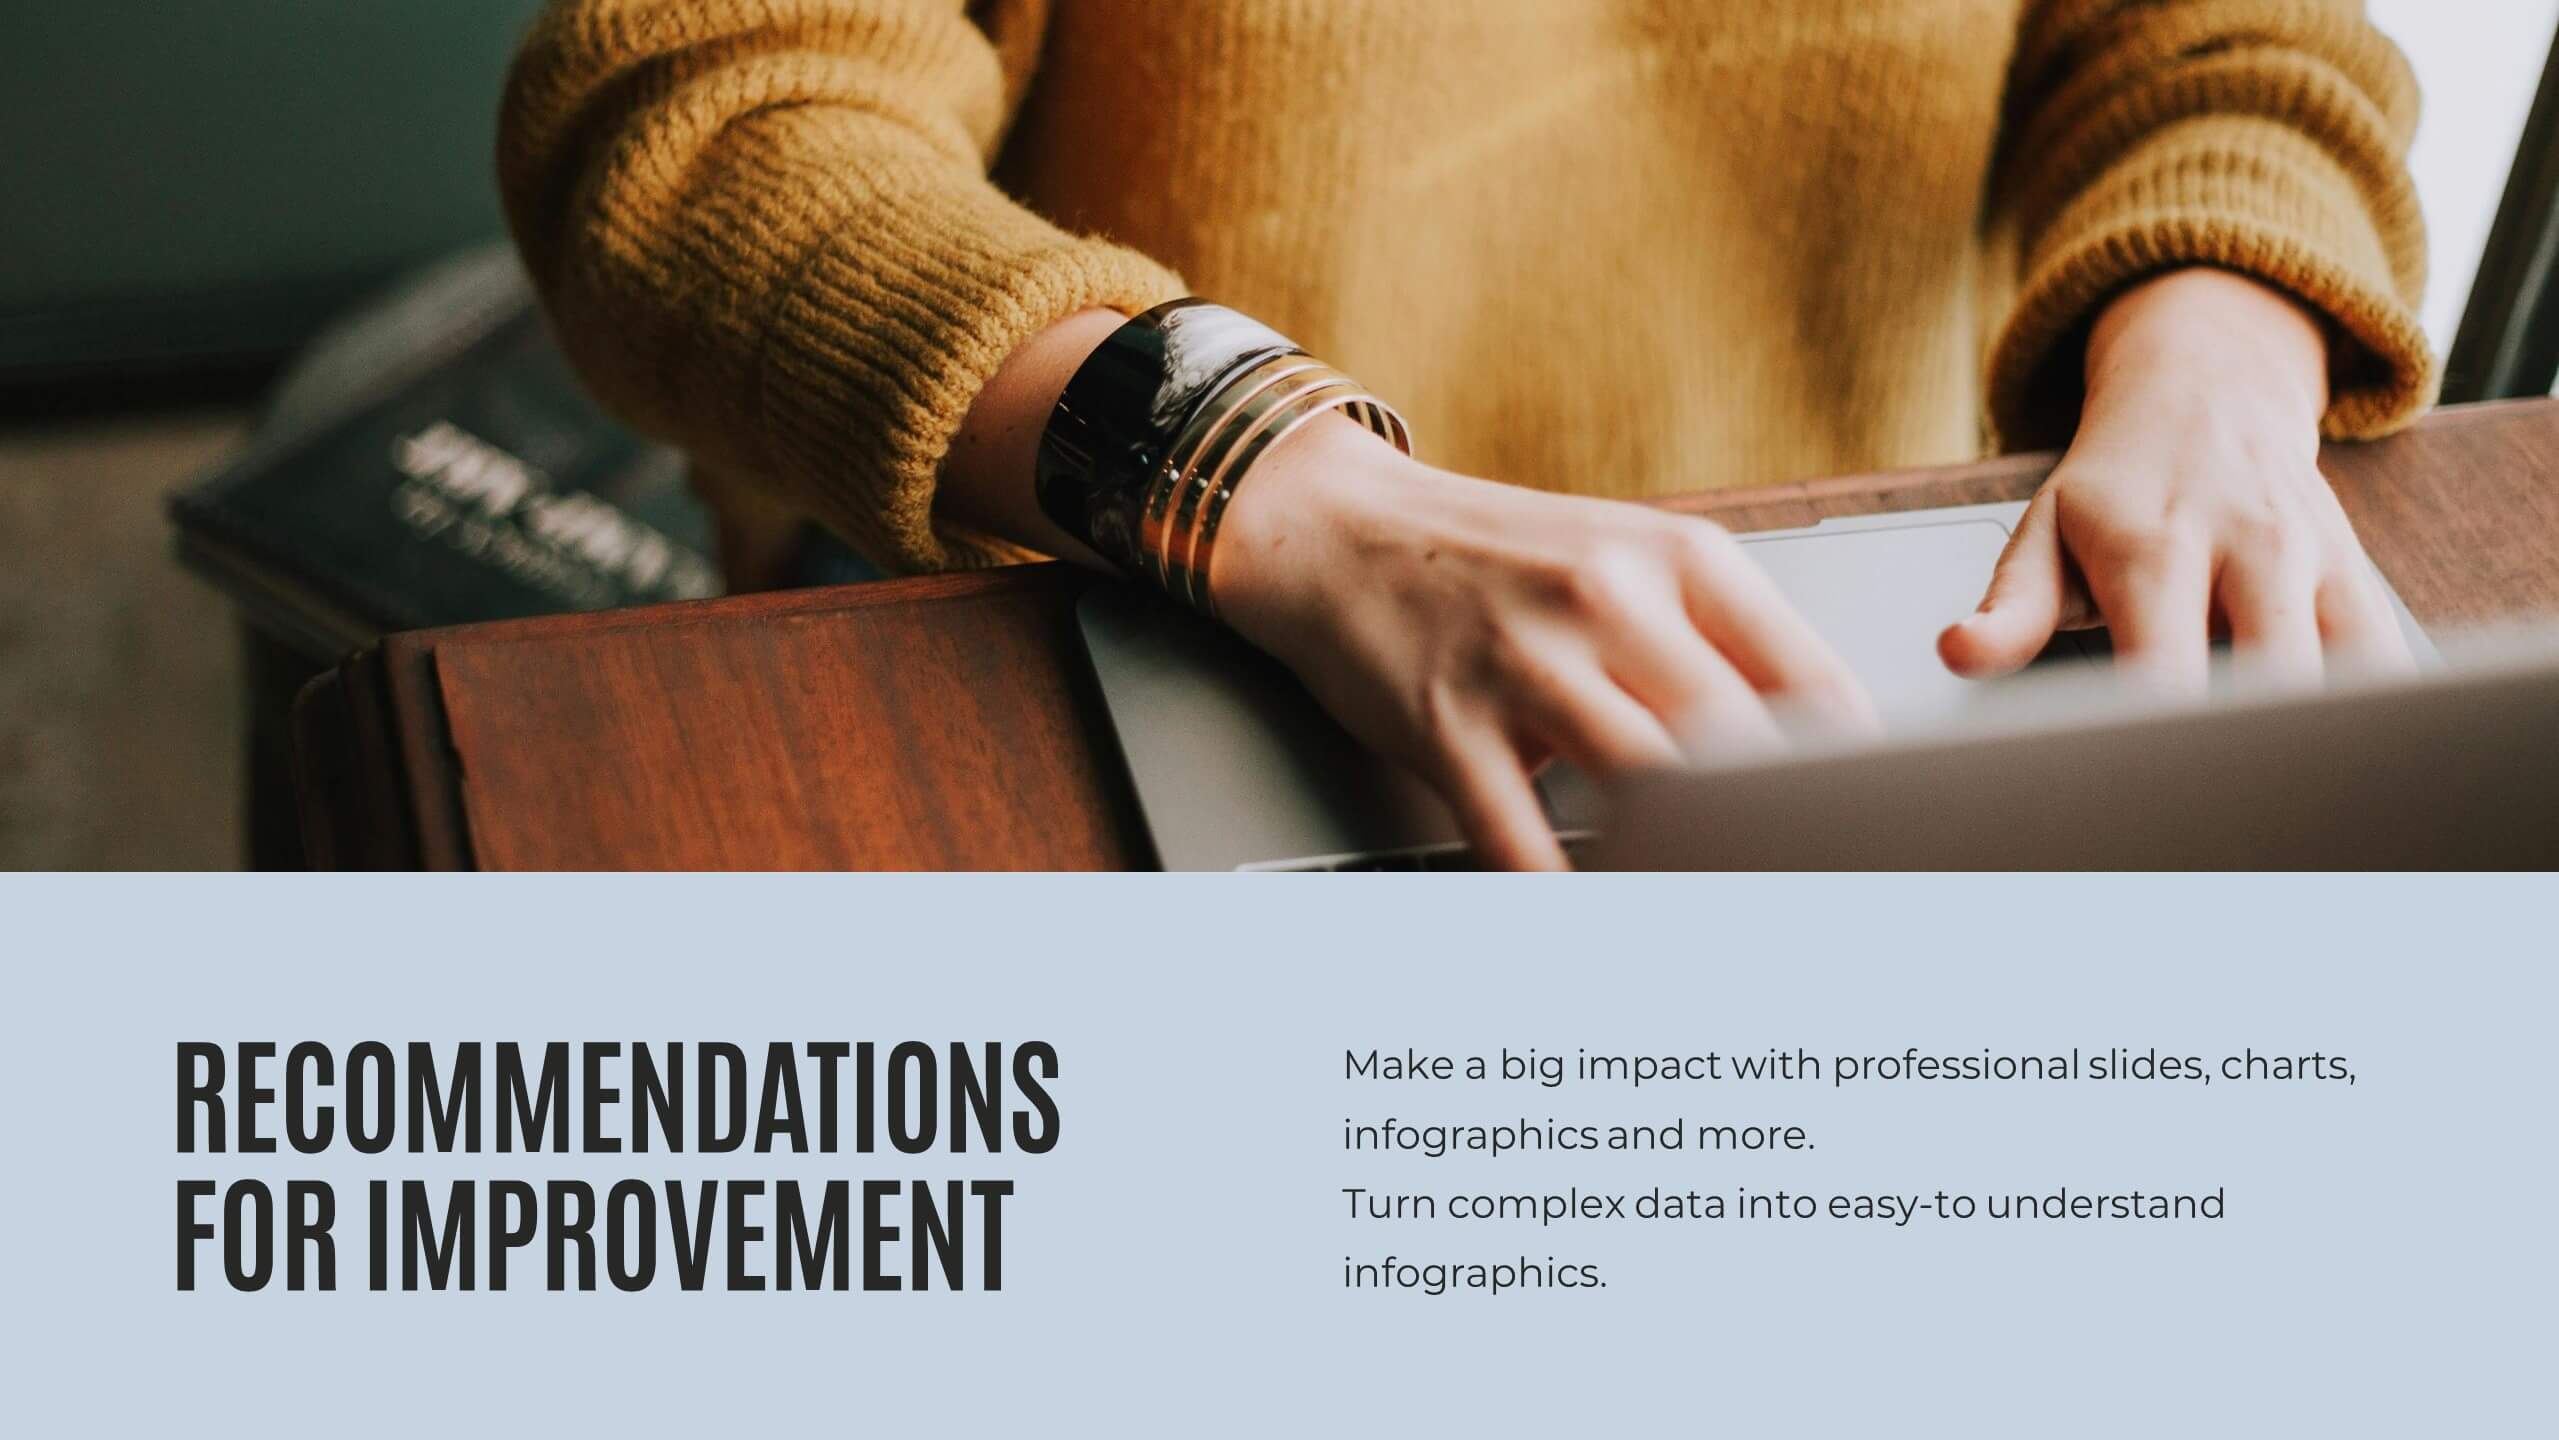
KPI Dashboard Metrics Presentation
Make your performance story stand out with a clean, modern dashboard that turns complex data into easy-to-read visuals. This presentation helps you track progress, highlight key metrics, and showcase insights with clarity and confidence. Fully editable and compatible with PowerPoint, Keynote, and Google Slides.


4 diapositivas
Investment Analysis Finance Presentation
Target your financial insights with this Investment Analysis Finance Presentation. Designed with a bold bullseye diagram and four labeled pointers, this slide helps communicate core focus areas, ROI, risk zones, or asset distribution. Ideal for pitch decks, portfolio reviews, and financial reports. Fully editable in PowerPoint, Keynote, and Google Slides—perfect for analysts, investors, and finance professionals.


20 diapositivas
Lullabyne Design Portfolio Presentation
Showcase your creative work with this modern and professional design portfolio presentation. Covering essential elements like design briefs, mood boards, prototypes, and implementation plans, this template helps you present your work with clarity and style. Fully customizable and available for PowerPoint, Keynote, and Google Slides.


5 diapositivas
Market Segmentation Strategy Presentation
Refine your approach with our "Market Segmentation Strategy" presentation template. Perfect for marketers looking to target specific consumer bases, this layout visually divides your market into manageable segments. It's ideal for presentations on market analysis and targeted marketing strategies, ensuring compatibility with PowerPoint, Keynote, and Google Slides to accommodate any presentation environment.


6 diapositivas
Pathway and Options Framework Analysis Presentation
Navigate your business strategy with clarity using the Pathway and Options Framework Analysis Presentation. This slide features a horizontal hexagon progression that visually maps out five distinct stages or decision points. Ideal for illustrating phased development, strategic alternatives, or milestone-based planning. Each segment includes an icon and customizable title area for key data points. Use this clean, modern layout to engage stakeholders or clarify complex processes. Fully editable in PowerPoint, Keynote, and Google Slides.


6 diapositivas
Public Health and Wellness Strategy Process
Promote holistic well-being with this visually engaging 6-step wellness infographic. Designed around a meditative figure and circular path, it’s ideal for health initiatives, public outreach, and lifestyle improvement strategies. Fully editable in PowerPoint, Keynote, and Google Slides—perfect for wellness coaches, health educators, and public health teams.


4 diapositivas
Company Long-Term Vision Presentation
Craft your company's roadmap with our "Company Long-Term Vision" presentation template. This design lets you vividly showcase your strategic direction and future goals through a modern, image-centric layout. Ideal for board meetings and stakeholder briefings, it supports PowerPoint, Keynote, and Google Slides, ensuring you can reach your audience on any platform. Utilize this template to clearly communicate your vision and drive your organization forward.


2 diapositivas
Modern Business Title Slide Presentation
Step into the future of presentations with the "Modern Business Slide," designed to make your corporate message shine. This template features a sleek, minimalist layout with bold typography and a striking visual of a stylish office setting, perfect for making a professional impact. Ideal for any business presentation, it's compatible with PowerPoint, Keynote, and Google Slides, ensuring versatility across different platforms.


5 diapositivas
Task Management and Scheduling
Stay organized and efficient with this clear task management and scheduling layout. This presentation makes it easy to prioritize assignments, allocate time slots, and track progress using a visual clock-based design. Perfect for business operations, project coordination, workflow planning, and productivity meetings. Fully customizable and compatible with PowerPoint, Keynote, and Google Slides.