


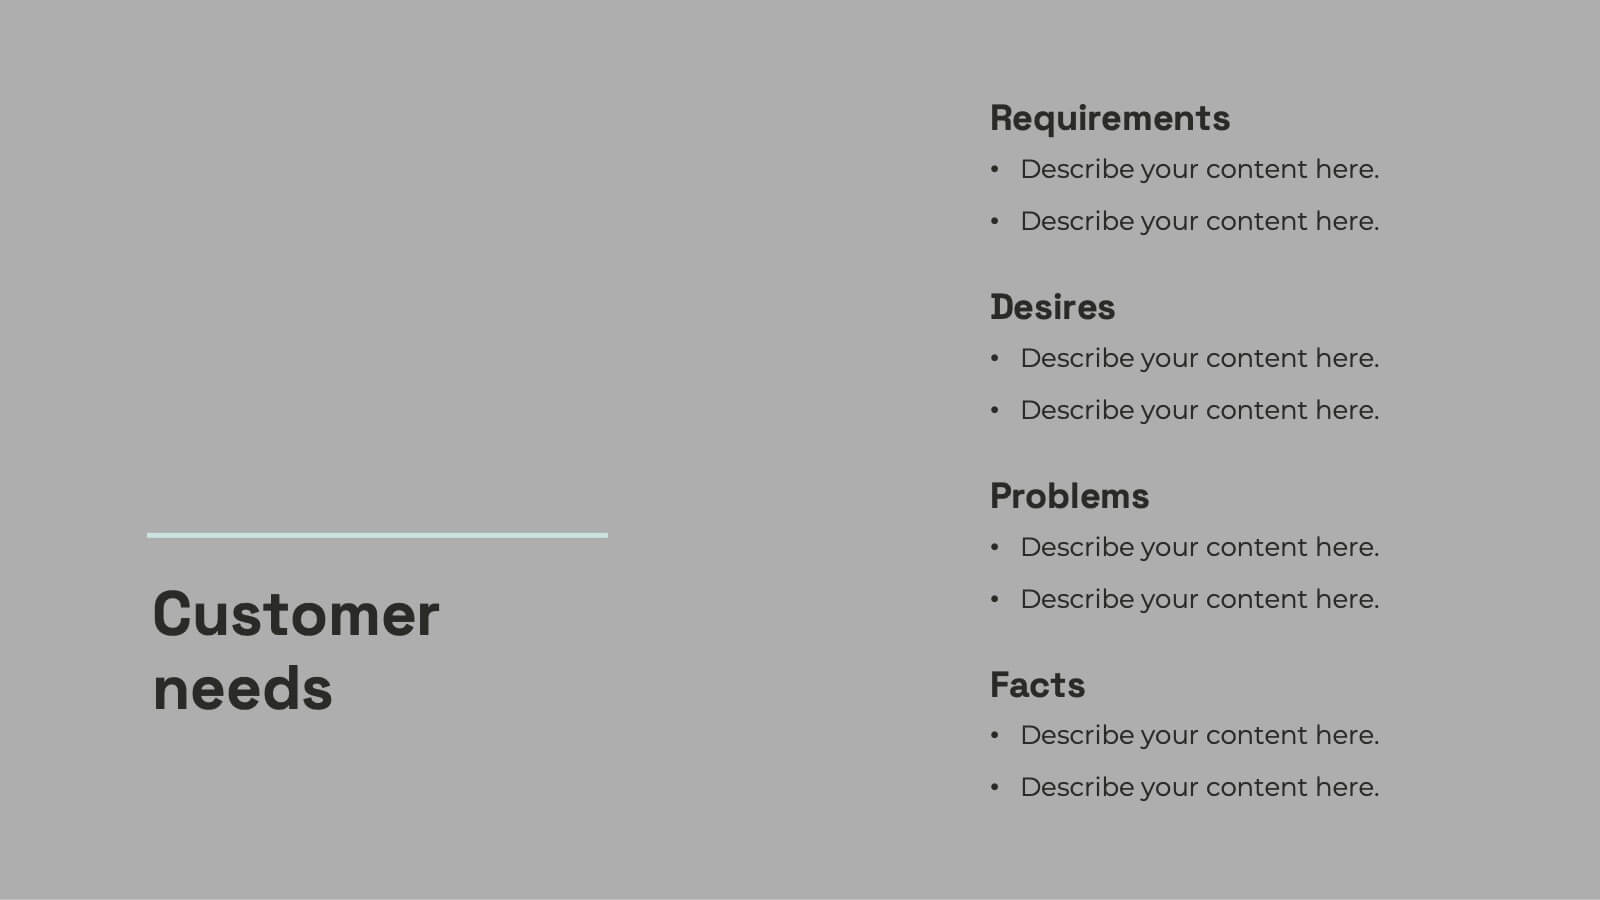
Características


¿Tienes alguna pregunta?
Recomendar


5 diapositivas
Education Jobs Infographics
Education Jobs encompass a wide range of roles and responsibilities focused on providing education, training, and support to learners of all ages. This template is designed to showcase the diverse range of careers available in the education sector. Use this template to inform and inspire individuals interested in pursuing a career in education, whether as teachers, administrators, counselors, researchers, or other specialized roles. With its visually engaging design and comprehensive information, this template will help your audience navigate the world of education jobs and make informed career decisions.


2 diapositivas
Small Business Success Illustrations
Get your business on the right track with our small business success illustrations pack! These illustrations will help you with your next business presentation and make it more engaging and catchy. Fully compatible with Powerpoint, Keynote, and Google Slides. You can use these in your website, blog or social media posts. Turn your vision into a reality—download the small business success illustrations pack today!


7 diapositivas
Tables of Content Infographic Presentation Template
A table of contents infographic can serve as a visual representation of the content outline and help to convey the overall structure and organization of the information. This template displays the headings and subheadings of the document, along with the page numbers or slide numbers, in an easy-to-follow format. The purpose of our table of contents infographic template is to provide an overview of the content and help you navigate the presentation more efficiently. It is often used in academic papers, reports, magazines, and books, and can also be used in digital documents and presentations.


7 diapositivas
Harvey Ball Infographics Presentation Template
Featuring our Harvey Ball Infographic template, this is best used for presenting data from a variety of sources in an interactive way, showing charts and graphs, with the main point highlighted by using a bullet-pointed list at the bottom of the slide. This presentation template was designed to help you put your data into a visual representation that will capture the attention of your audience. This is great for business presentations and data visualizations, it is simple to create a professional looking presentations that will showcase your data in the most effective way possible.


4 diapositivas
Goal-Oriented 30 60 90 Plan Outline Presentation
Make your first impression unforgettable with this bold, easy-to-follow layout that breaks down goals into manageable steps. A 30-60-90 plan helps teams and new hires align on expectations, outcomes, and milestones. Perfect for onboarding or strategic planning. Fully editable in PowerPoint, Keynote, and Google Slides for maximum compatibility.


4 diapositivas
Cost Analysis and Budget Overview Presentation
Break down financial details with clarity using the Cost Analysis and Budget Overview Presentation. This slide helps you present cost structures, budget allocations, and key financial metrics side by side using icons and visual data blocks. Perfect for reports, planning, or investment decks. Fully editable in PowerPoint, Google Slides, Keynote, and Canva.


6 diapositivas
Business Milestone Timeline Presentation
Showcase key achievements and future goals with the Business Milestone Timeline Presentation. This visually engaging template allows you to highlight crucial company events, project phases, or strategic plans in a clear, structured format. Ideal for corporate reporting, business growth tracking, and investor presentations. Fully customizable and compatible with PowerPoint, Keynote, and Google Slides.


4 diapositivas
Risk vs Impact Matrix Layout Presentation
Visualize risk levels clearly with the Risk vs Impact Matrix Layout Presentation. This customizable template helps you assess and categorize potential risks based on their likelihood and impact, using a clear 3x3 color-coded grid. Ideal for project managers, risk analysts, and strategy teams. Compatible with PowerPoint, Keynote, Google Slides, and Canva.


4 diapositivas
Strategic Gap Planning Template Presentation
Visually map the journey from current state to strategic goals with this puzzle-themed gap analysis template. Ideal for identifying key disconnects, setting priorities, and aligning teams. Fully editable and designed for clarity, this presentation works in PowerPoint, Keynote, and Google Slides—perfect for planning sessions, roadmaps, and executive briefings.


4 diapositivas
90-Day Success Plan for New Hires Presentation
Set your team up for success with this 90-Day Success Plan for New Hires Presentation. This template is perfect for onboarding workflows, outlining key milestones at 30, 60, and 90 days. Help managers and HR professionals communicate expectations clearly and track new employee progress. Fully editable in PowerPoint, Keynote, and Google Slides.


22 diapositivas
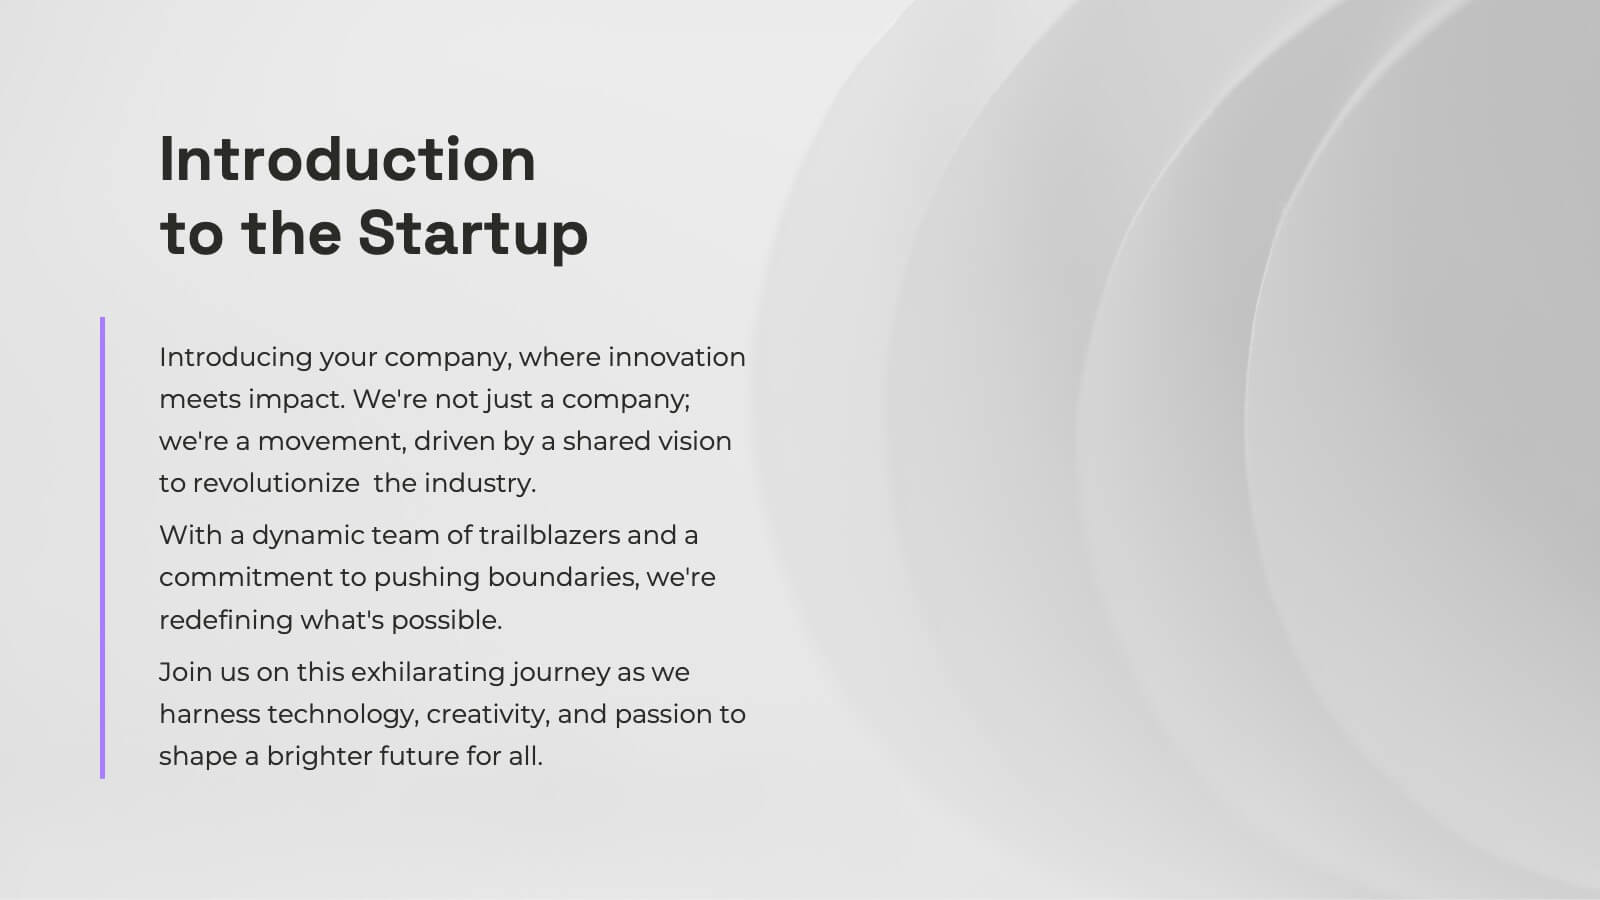
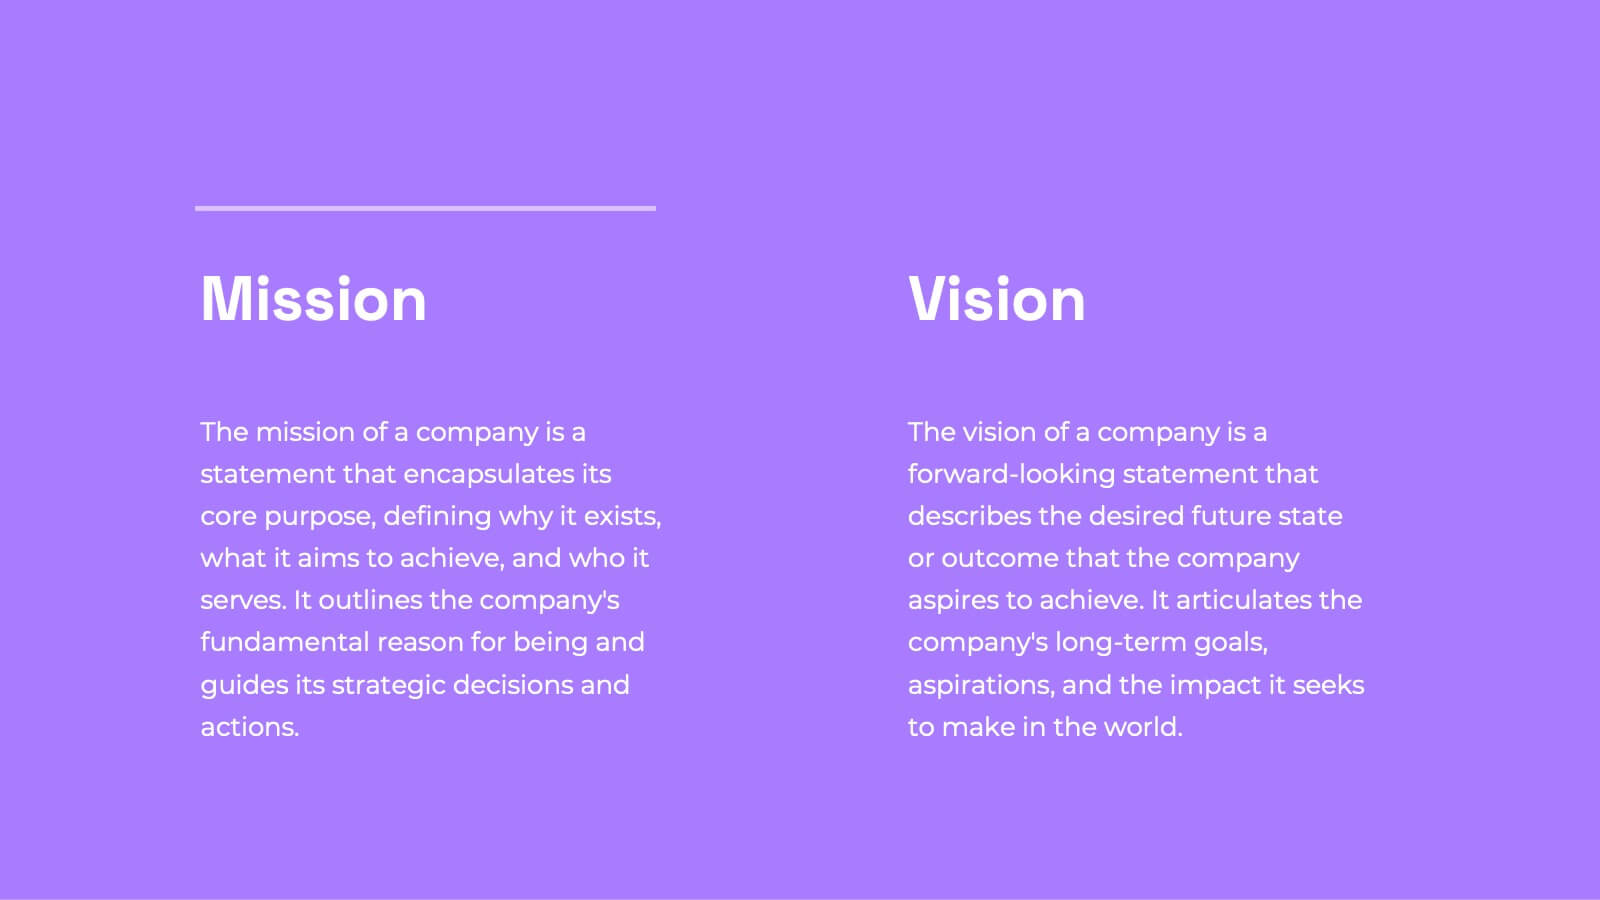
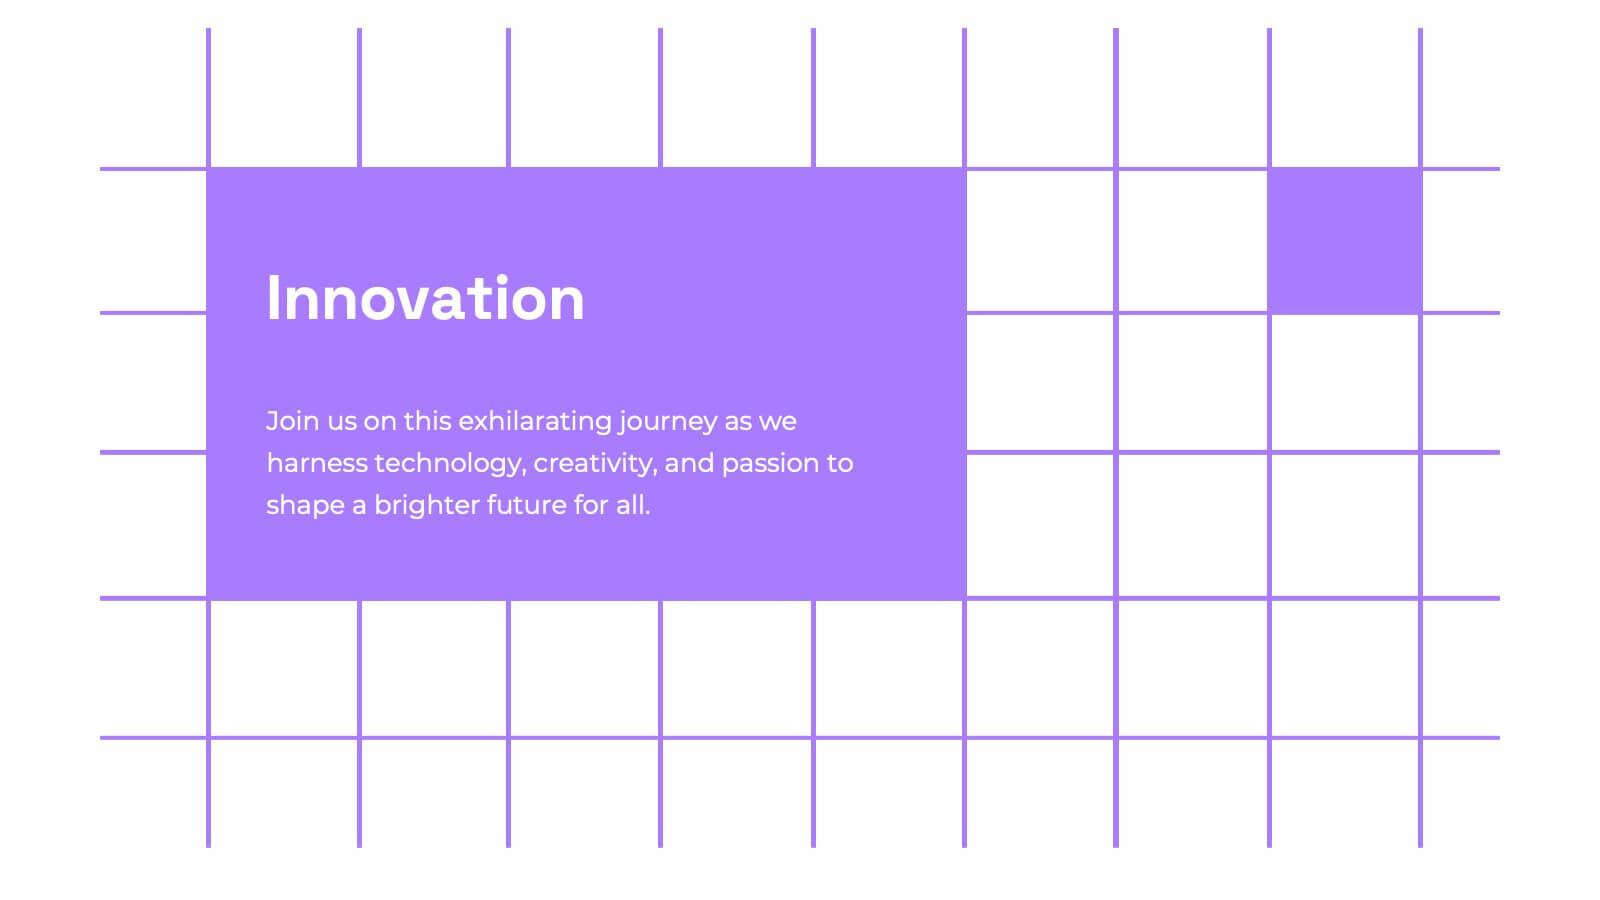
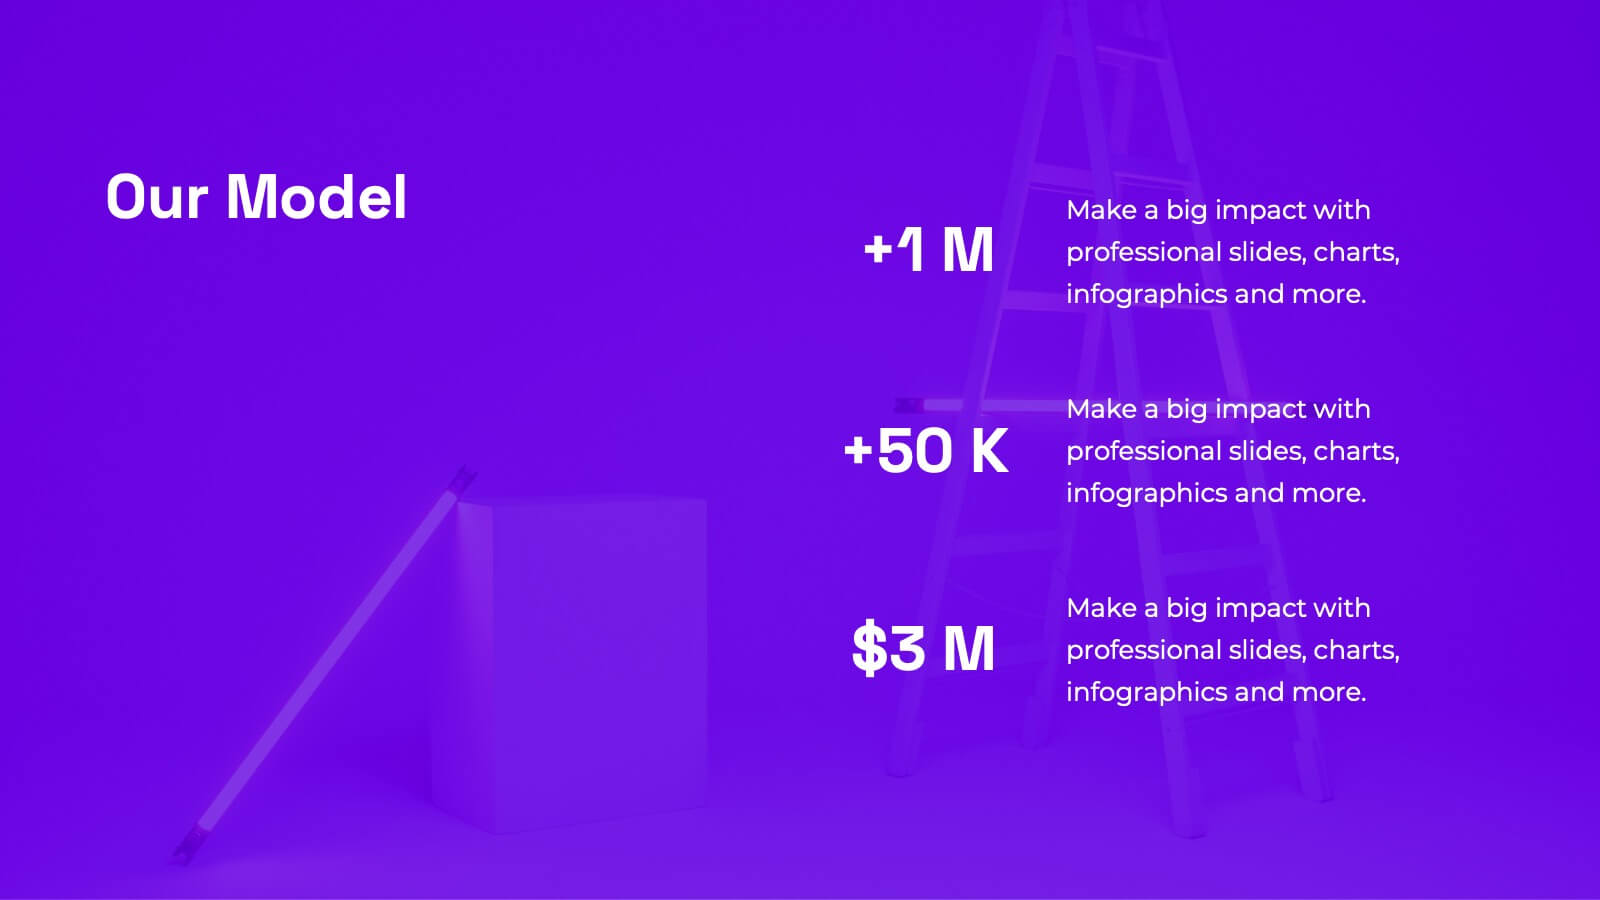
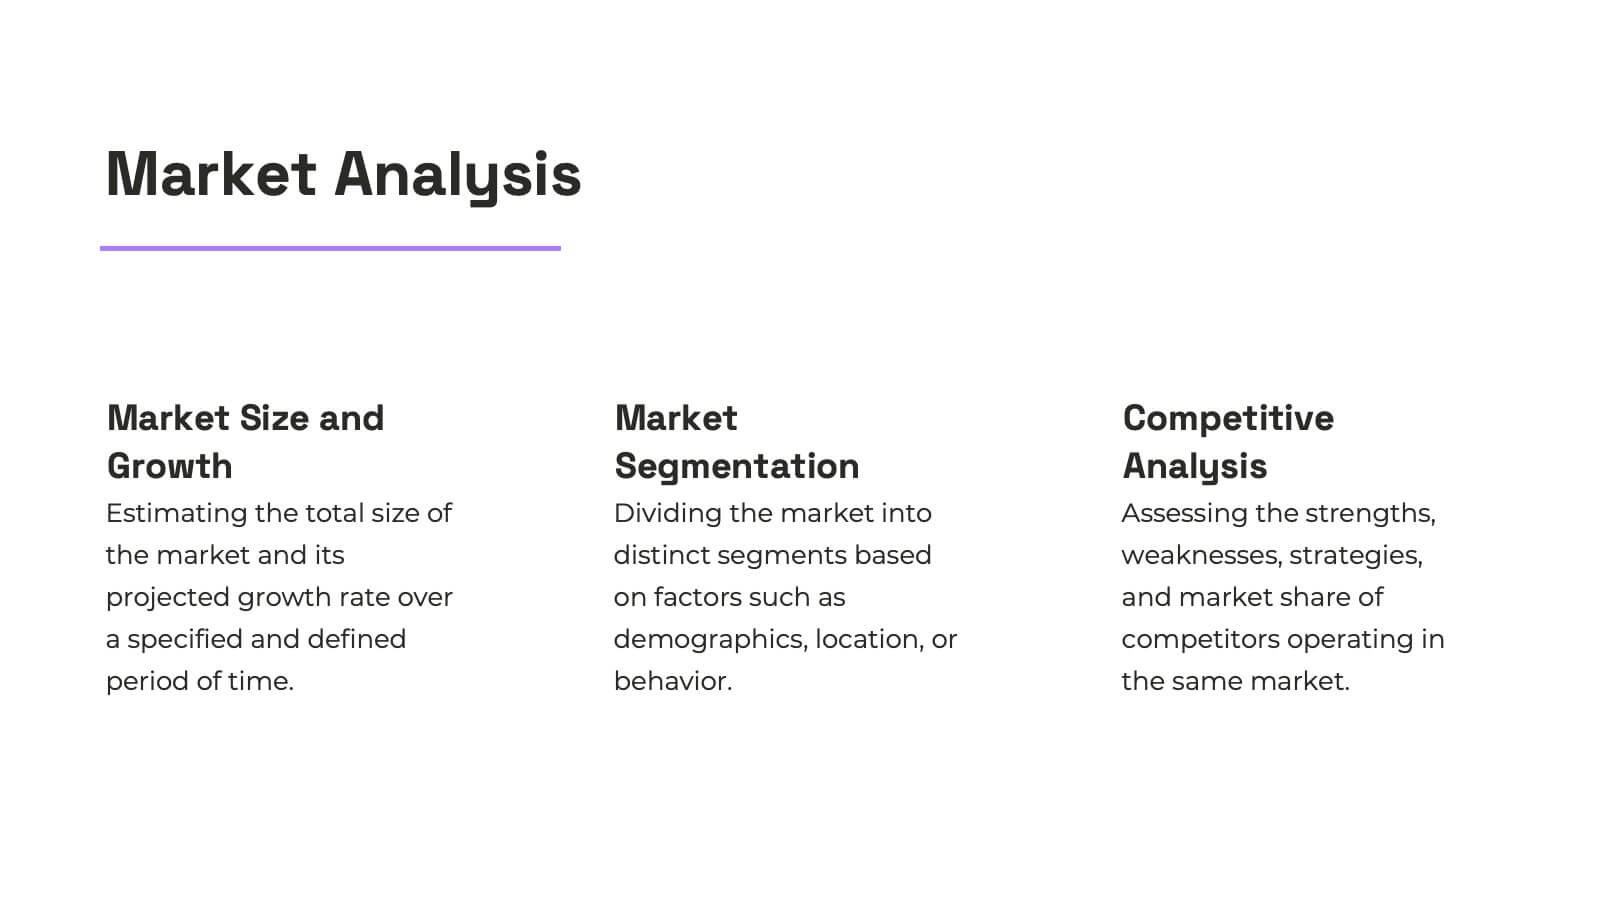
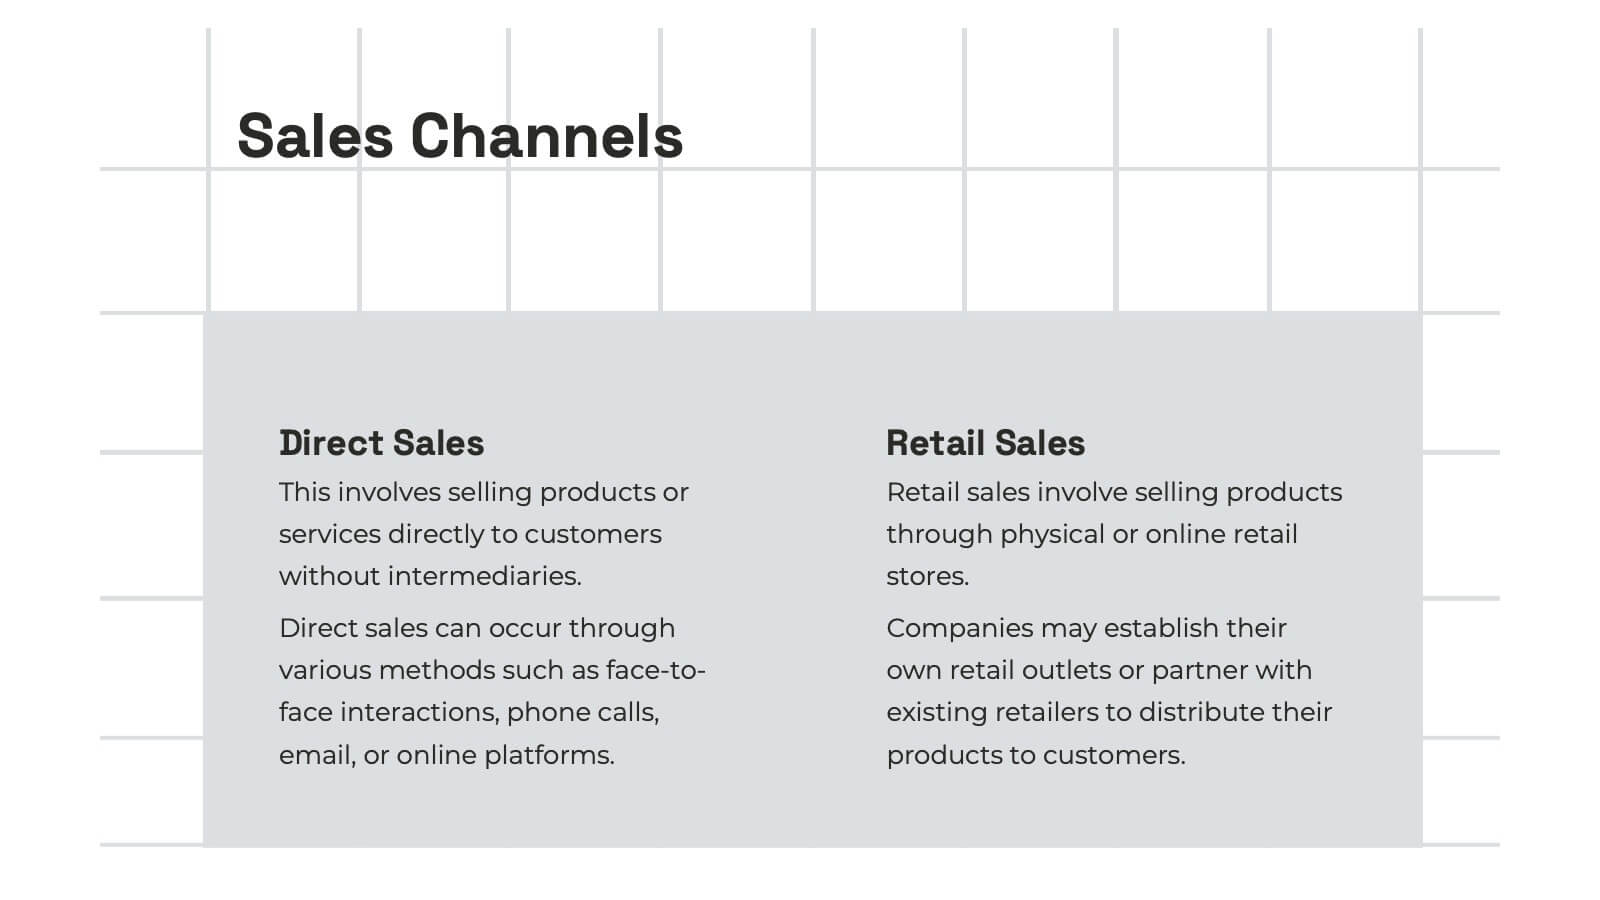
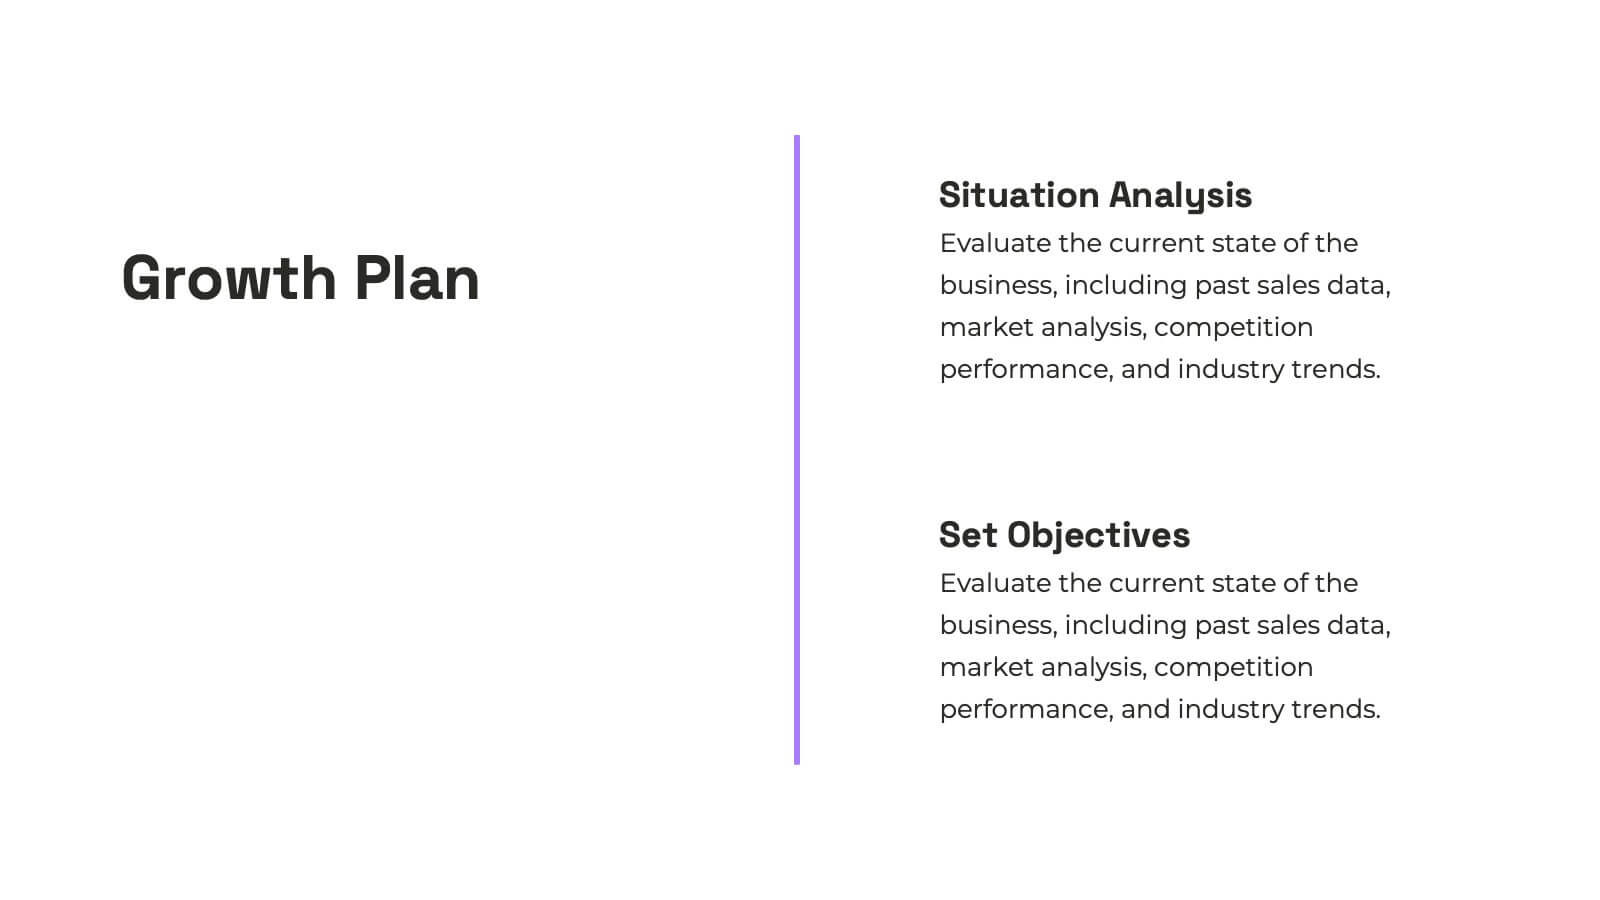
Nexus Startup Growth Plan Presentation
Jumpstart your business journey with this dynamic presentation template! Ideal for outlining your startup growth plan, it covers mission, vision, market analysis, and financial projections with sleek, professional slides. Capture investor interest and articulate your strategy effortlessly. Compatible with PowerPoint, Keynote, and Google Slides, ensuring seamless presentation across all platforms.


7 diapositivas
Sustainability Management Infographics Presentation Template
Sustainability management is a management discipline that enables organizations to understand and integrate the environmental, social and economic aspects of sustainability in all their activities. A community will be more likely to reduce energy, water and waste if they have the management available to set goals for their business. This template is perfect if you are looking for sustainability and elements needed to meet your goals. This template is designed to support an organization's efforts to improve its performance, packed with illustrations you can customize and add your own tips too.


5 diapositivas
Customer Feedback and Review Presentation
Showcase customer feedback trends with the Customer Feedback and Review infographic. Featuring a dynamic timeline with emotion-based ratings, this template helps visualize satisfaction levels, key insights, and areas for improvement. Fully customizable and compatible with PowerPoint, Keynote, and Google Slides.


4 diapositivas
Rewards and Membership Benefits Presentation
Maximize engagement and incentivize loyalty with the "Rewards and Membership Benefits" presentation template. This layout is designed to help businesses effectively communicate the value of their membership programs, highlighting perks and rewards in a visually engaging way. Perfect for marketers aiming to enhance customer retention strategies, it's compatible with PowerPoint, Keynote, and Google Slides.


26 diapositivas
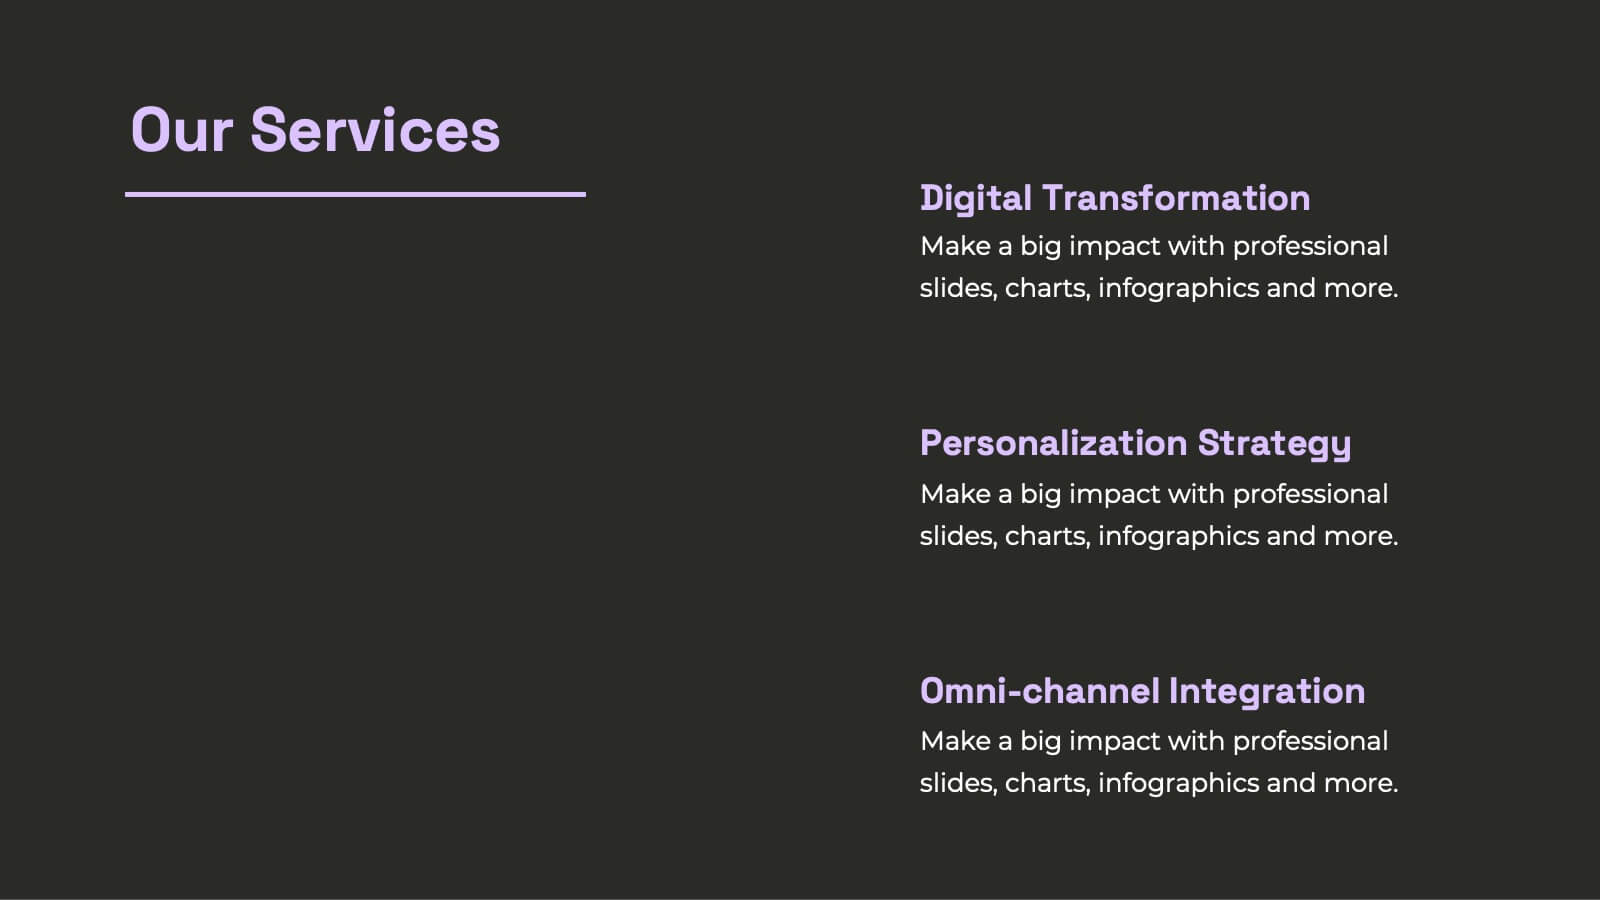
Maki Presentation Template
Japanese cuisine is known all around the world, there is so much to try including all the different types of sushi. Maki is a 26 slide template made to help you market your services and products. The clean, simplistic design makes it easy for you to display your content in any modernized way. Maki is designed to showcase your packages, pricing and more. Help your customers feel comfortable purchasing your service or product using this template. Present your message clearly and effectively with this presentation. You can customize the design, photos, background and fonts to make it your own.


26 diapositivas
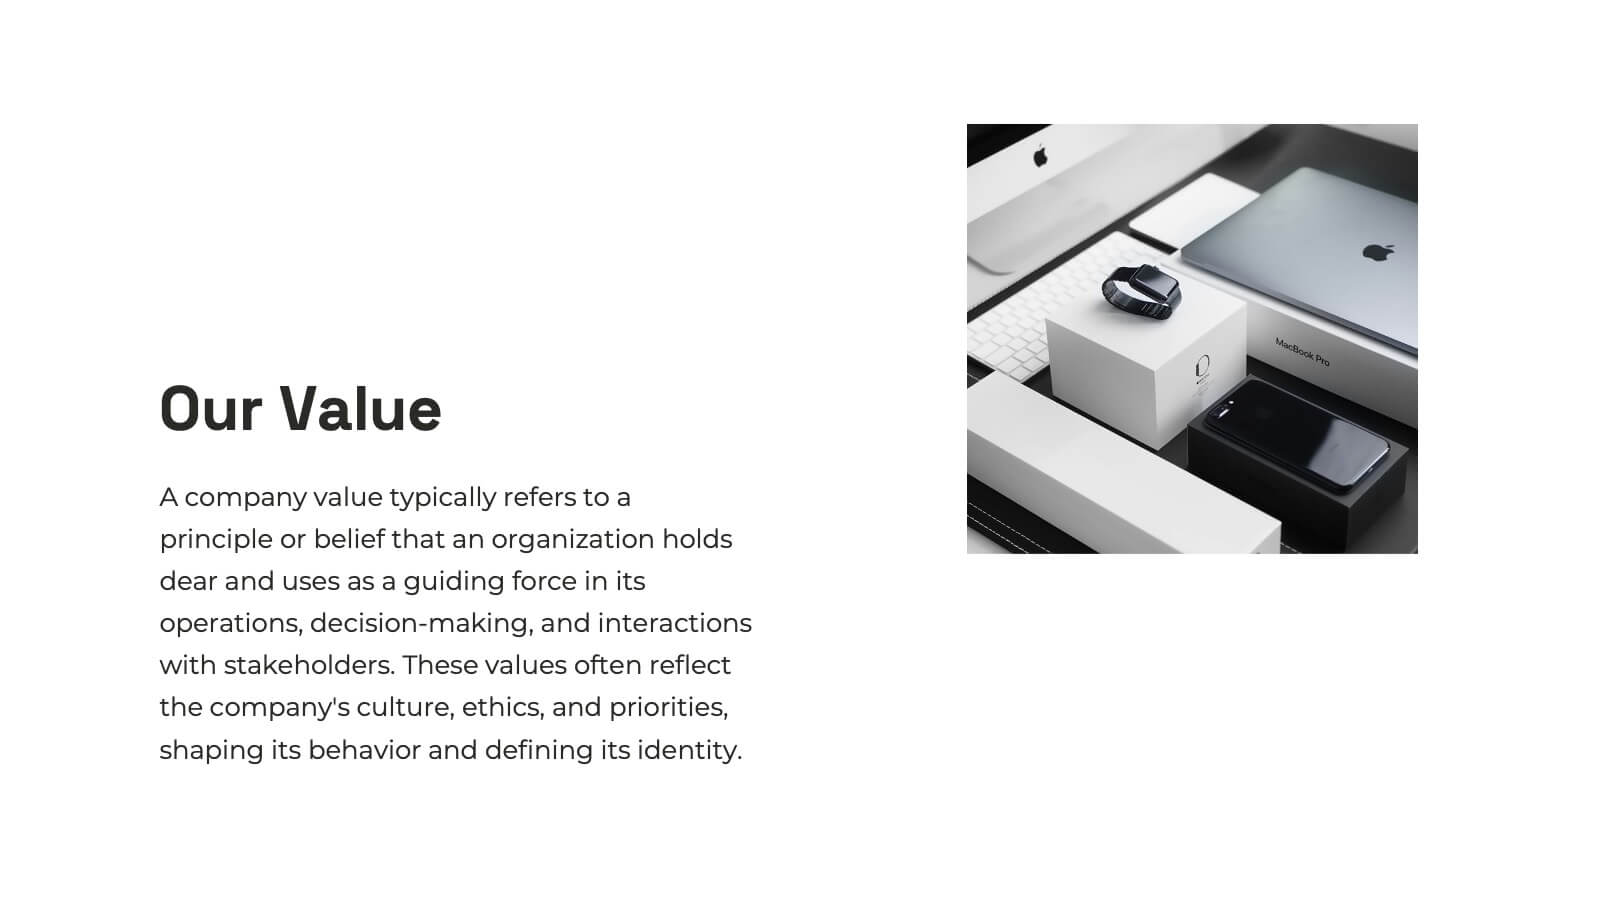
Geometric Technology Presentation
Technology has changed the world we live in, it is a powerful tool when used correctly and with caution. This template offers a sleek way to deliver your message and is designed with geometric shapes that are arranged in a flexible design. It includes a backdrop with a geometric pattern, which can be customized with your own images and colors. This template is a great way to impress your teachers, clients, or students with the newest technologies. With an emphasis on high-quality visuals, this template is perfect for illustrating your ideas and giving people confidence in your business plan.


4 diapositivas
Patient Management in Medical Practice Presentation
Present medical processes with clarity using this lung-inspired diagram. Ideal for outlining patient care stages, treatment protocols, or clinical workflows. With four editable points, this design supports healthcare presentations in pulmonology, internal medicine, or hospital administration. Fully compatible with PowerPoint, Keynote, and Google Slides for easy customization.