


Características


¿Tienes alguna pregunta?
Recomendar


4 diapositivas
Sports Metrics and Training Goals Presentation
Track, analyze, and present athletic performance with the Sports Metrics and Training Goals template. Featuring bar charts and a sports court graphic, this design is ideal for visualizing statistics, strategies, and progress. Fully customizable in Canva, PowerPoint, and Google Slides to align with your team’s branding and performance objectives.


7 diapositivas
App Mockup Infographic
Elevate your app demonstrations with this vibrant collection of app mockup templates, specifically designed to showcase the functionality and design of mobile applications across various devices. Each template emphasizes the user experience, presenting your app in a clear and engaging manner that highlights its most compelling features. The templates are crafted with a clean, modern aesthetic, incorporating bright colors and clear typography to draw attention to key functionalities and user interfaces. Perfect for developers and designers looking to present their apps to clients, stakeholders, or potential users, these mockups provide a professional framework for displaying apps in context. Customizable to fit your specific needs, this collection allows you to seamlessly integrate your own app designs and screenshots, making it easier than ever to convey the look and feel of your app in a realistic setting. Whether for pitches, presentations, or promotional materials, these mockups are an invaluable tool for communicating the value and operation of your application.


5 diapositivas
Climate Change Impacts Infographics
Climate Change refers to long-term shifts in temperature, precipitation patterns, wind patterns, and other aspects of the Earth's climate system. These infographic templates are perfect to educate and raise awareness about the impacts of climate change on our planet. These templates are suitable for environmental organizations, educators, or anyone seeking to convey the urgency and significance of addressing climate change. The compelling visuals, data-driven content, and clear messaging, in these templates aims to educate and inspire individuals to contribute to global efforts to address climate change and protect our planet's future.


6 diapositivas
Task Management Checklist
Stay on top of your workflow with this visually engaging task management checklist slide. Designed to help teams track progress across multiple tasks or project stages, this layout includes six editable sections with icon markers and color-coded completion states. Fully compatible with PowerPoint, Keynote, and Google Slides.


4 diapositivas
Fishbone Diagram for Root Cause Analysis
Dive into the source of any problem—literally. This fishbone diagram template offers a smart and visual way to map out causes leading to a business issue, helping teams brainstorm solutions effectively. Ideal for workshops, meetings, and audits. Easily editable in PowerPoint, Keynote, and Google Slides.


7 diapositivas
Decision Tree Diagram Infographics
A Decision Tree Diagram is a visual representation of a decision-making process that uses a tree-like structure to map out various possible outcomes and their associated probabilities. This template can be used in fields such as business, economics, and data science to model complex decision-making scenarios. This infographic starts with a single node, representing the initial decision that needs to be taken. From this node, paths extend to other nodes representing possible outcomes that could occur as a result of the initial decision. The final nodes of the diagram represent the end results.


5 diapositivas
Marijuana Consumption Infographics
Marijuana, also known as cannabis or weed, is a psychoactive drug that comes from the Cannabis plant. This template offers a visually appealing and informative way to present facts, data, and insights related to marijuana consumption. Its customizable features, visually engaging elements, and modern design make it an effective tool for educational presentations, healthcare seminars, policy discussions, or any presentation related to marijuana use and its impact. This template includes a variety of slide layouts specifically designed to present different aspects of marijuana consumption. It is compatible with PowerPoint, Keynote, and Google Slides.


20 diapositivas
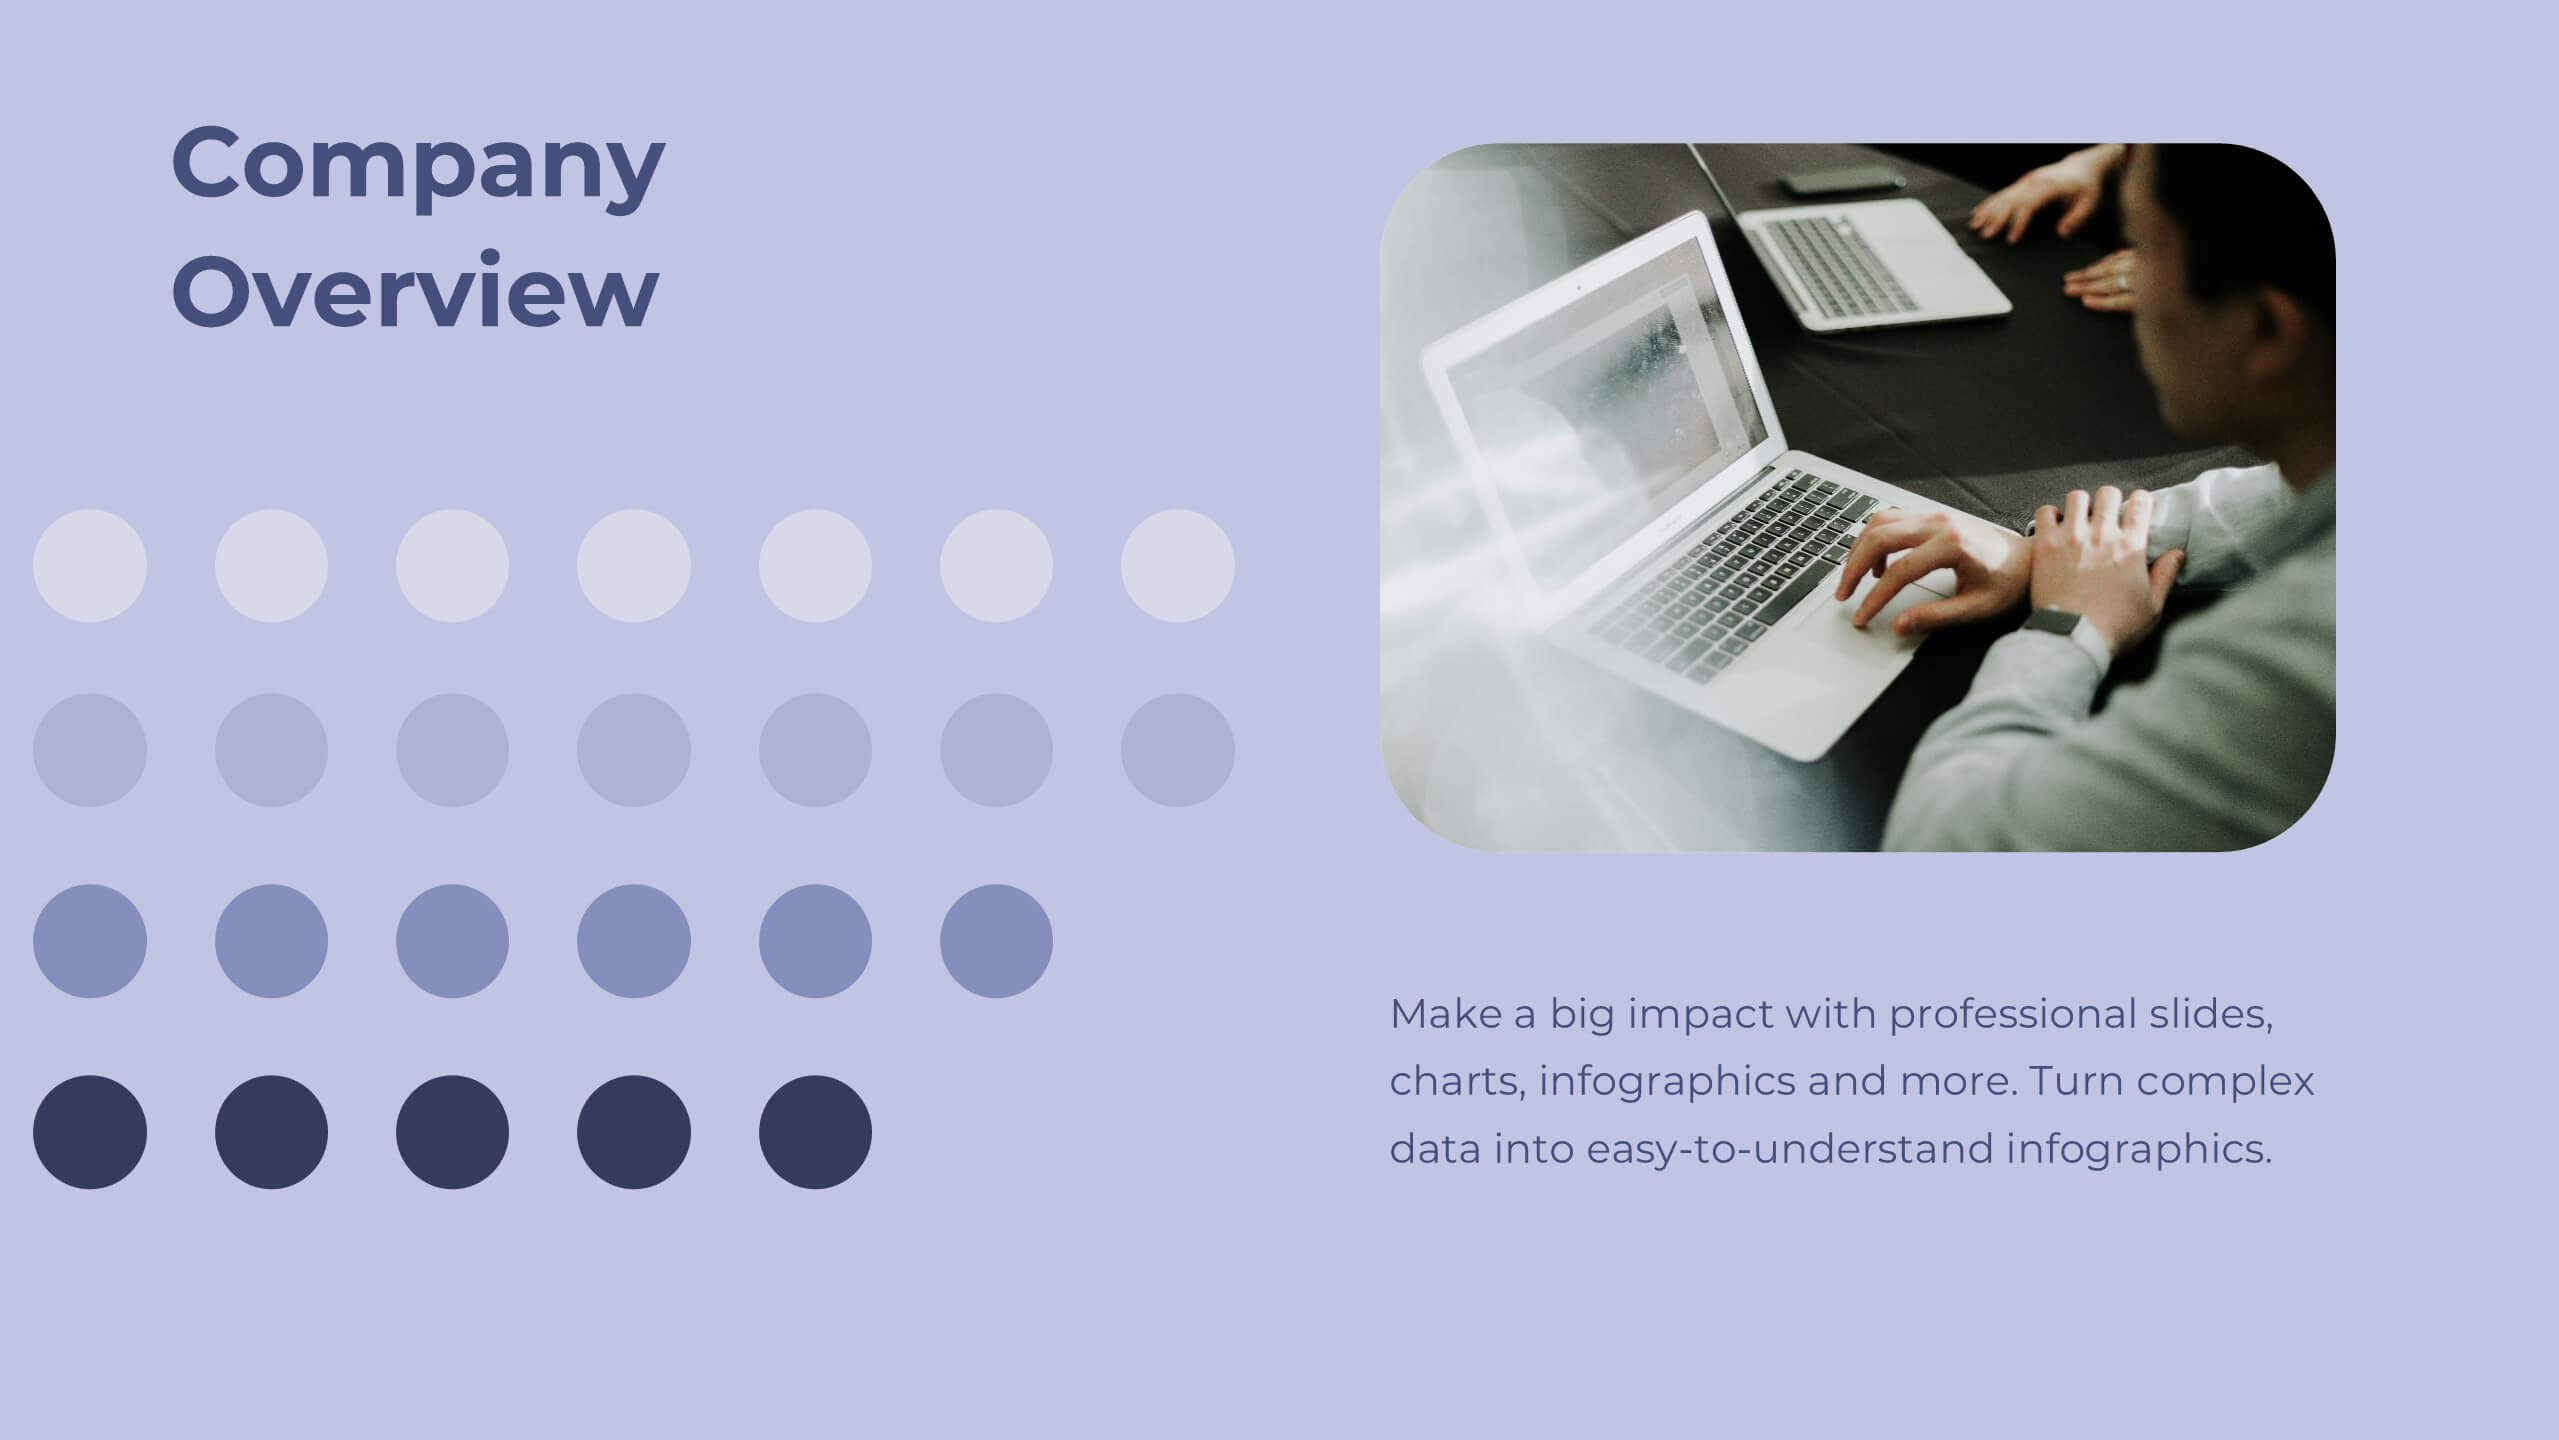
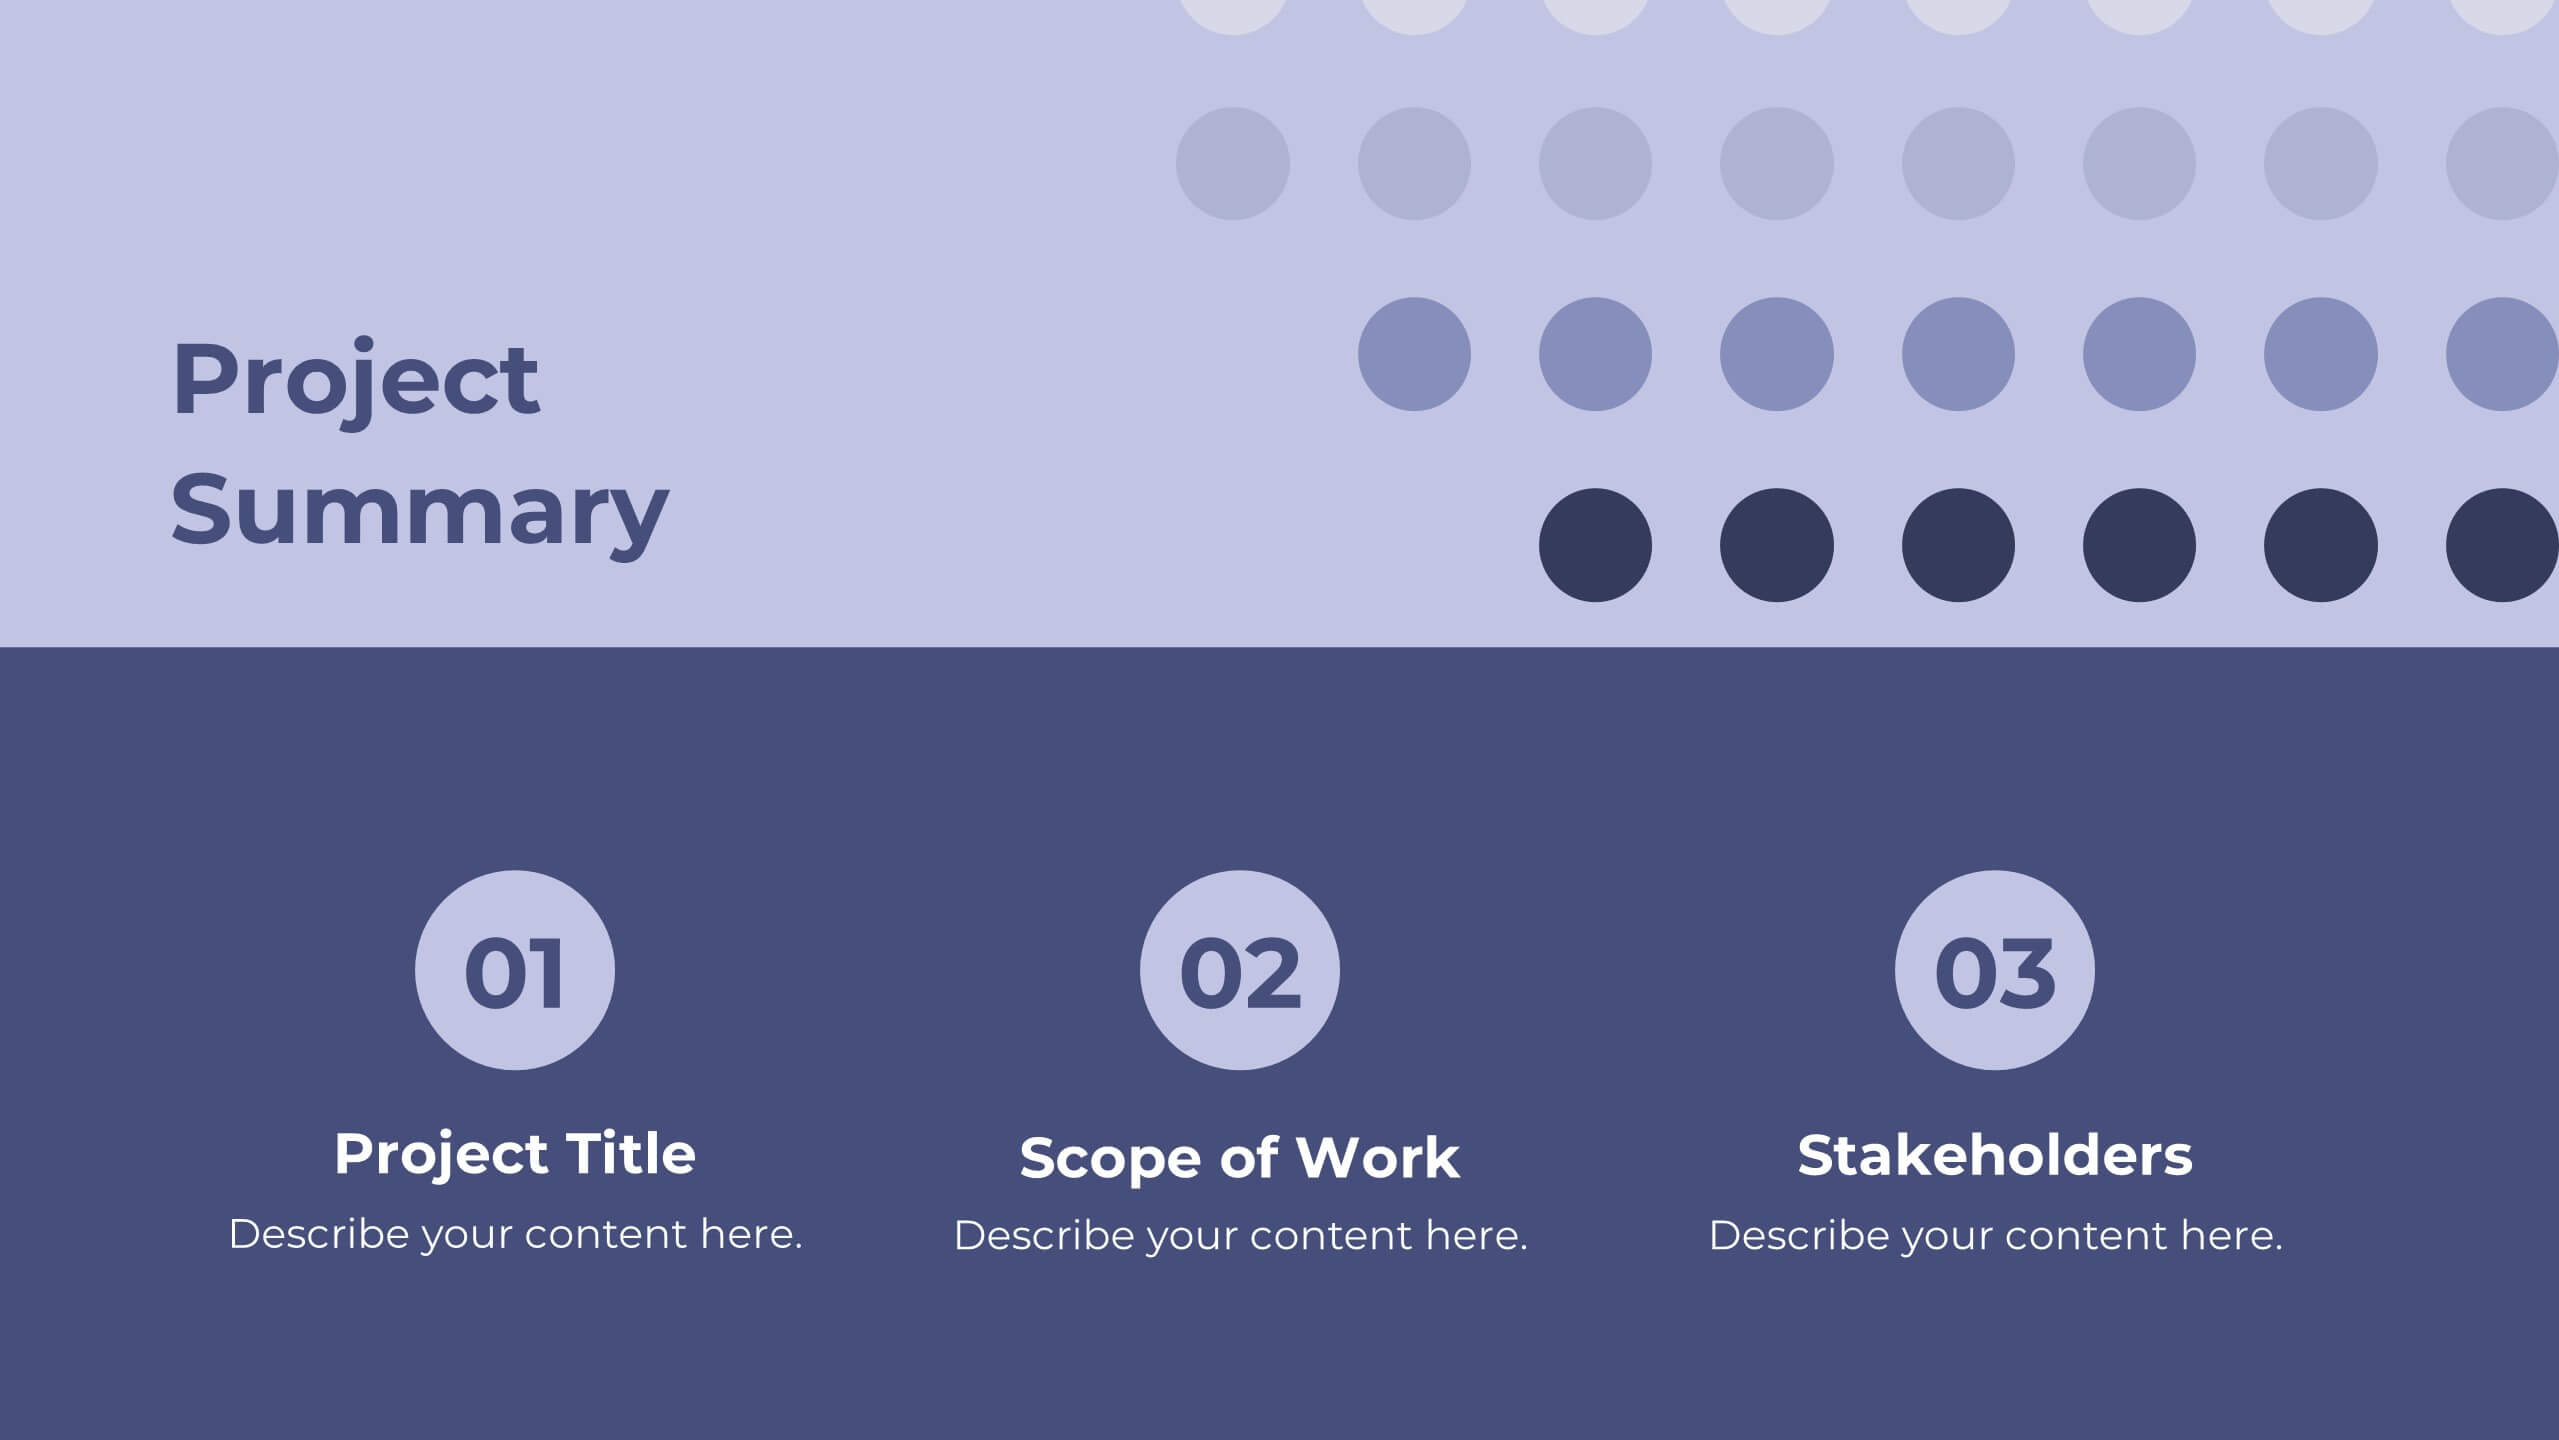
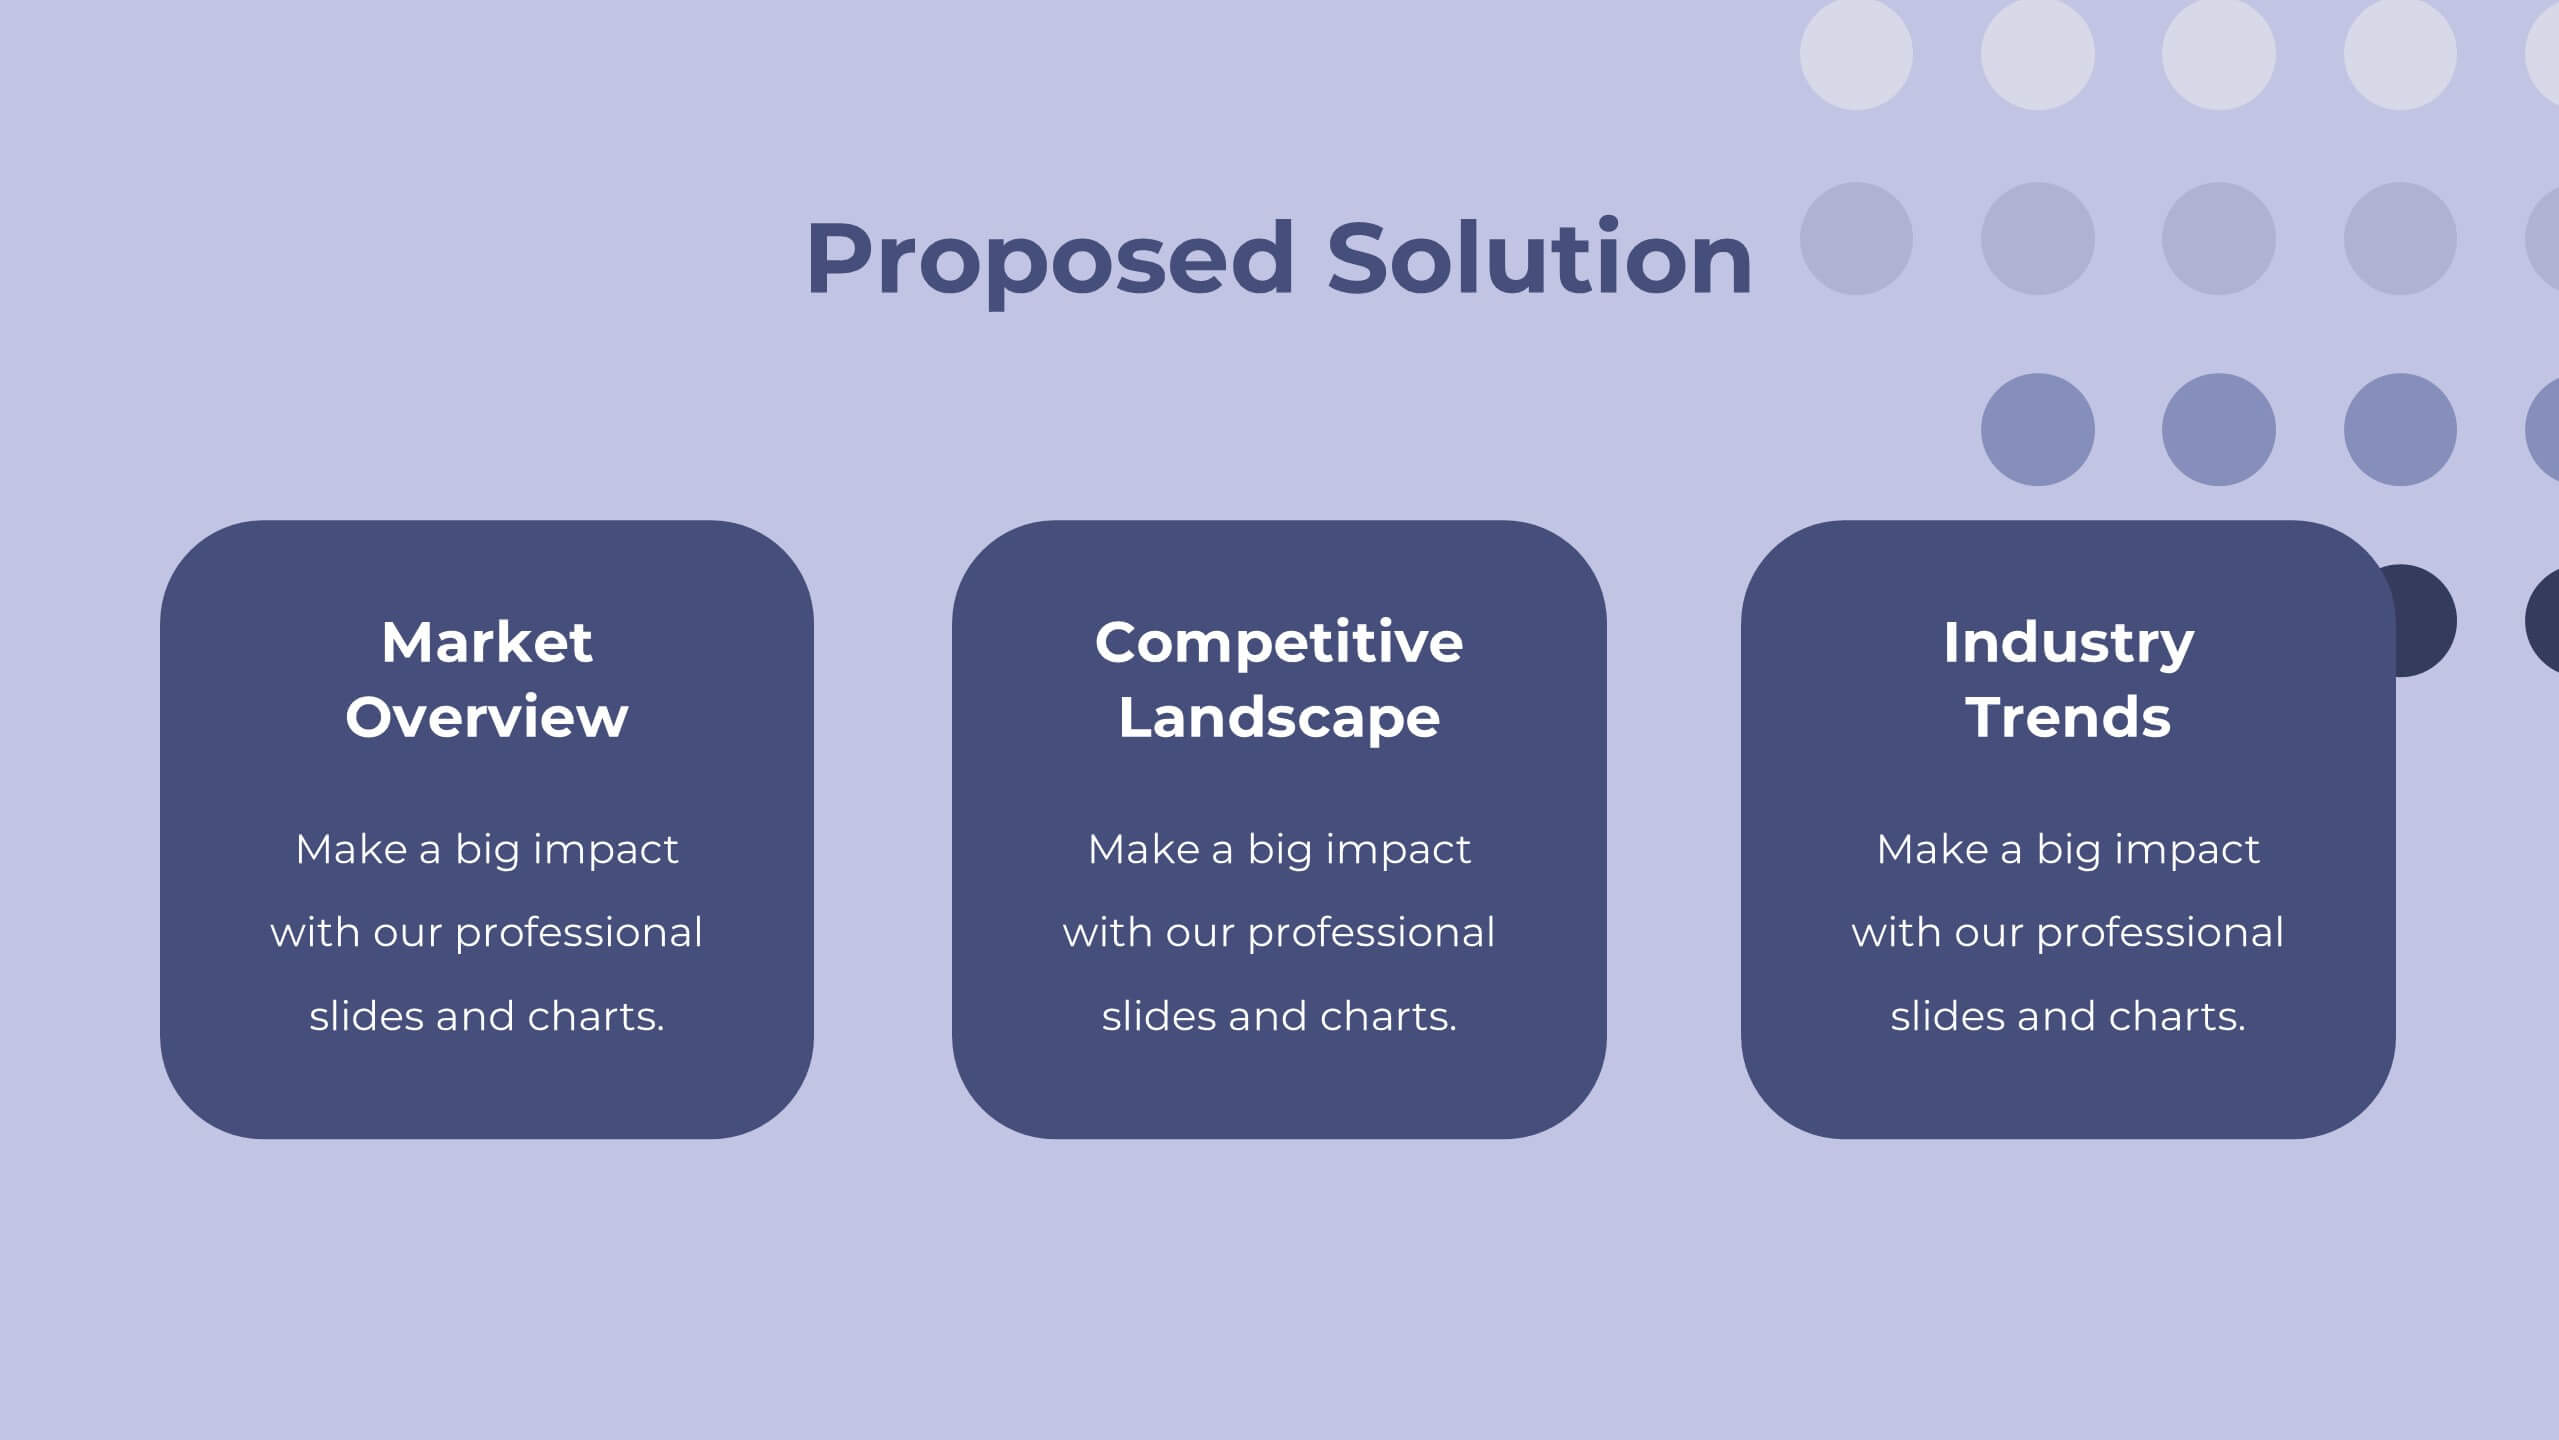
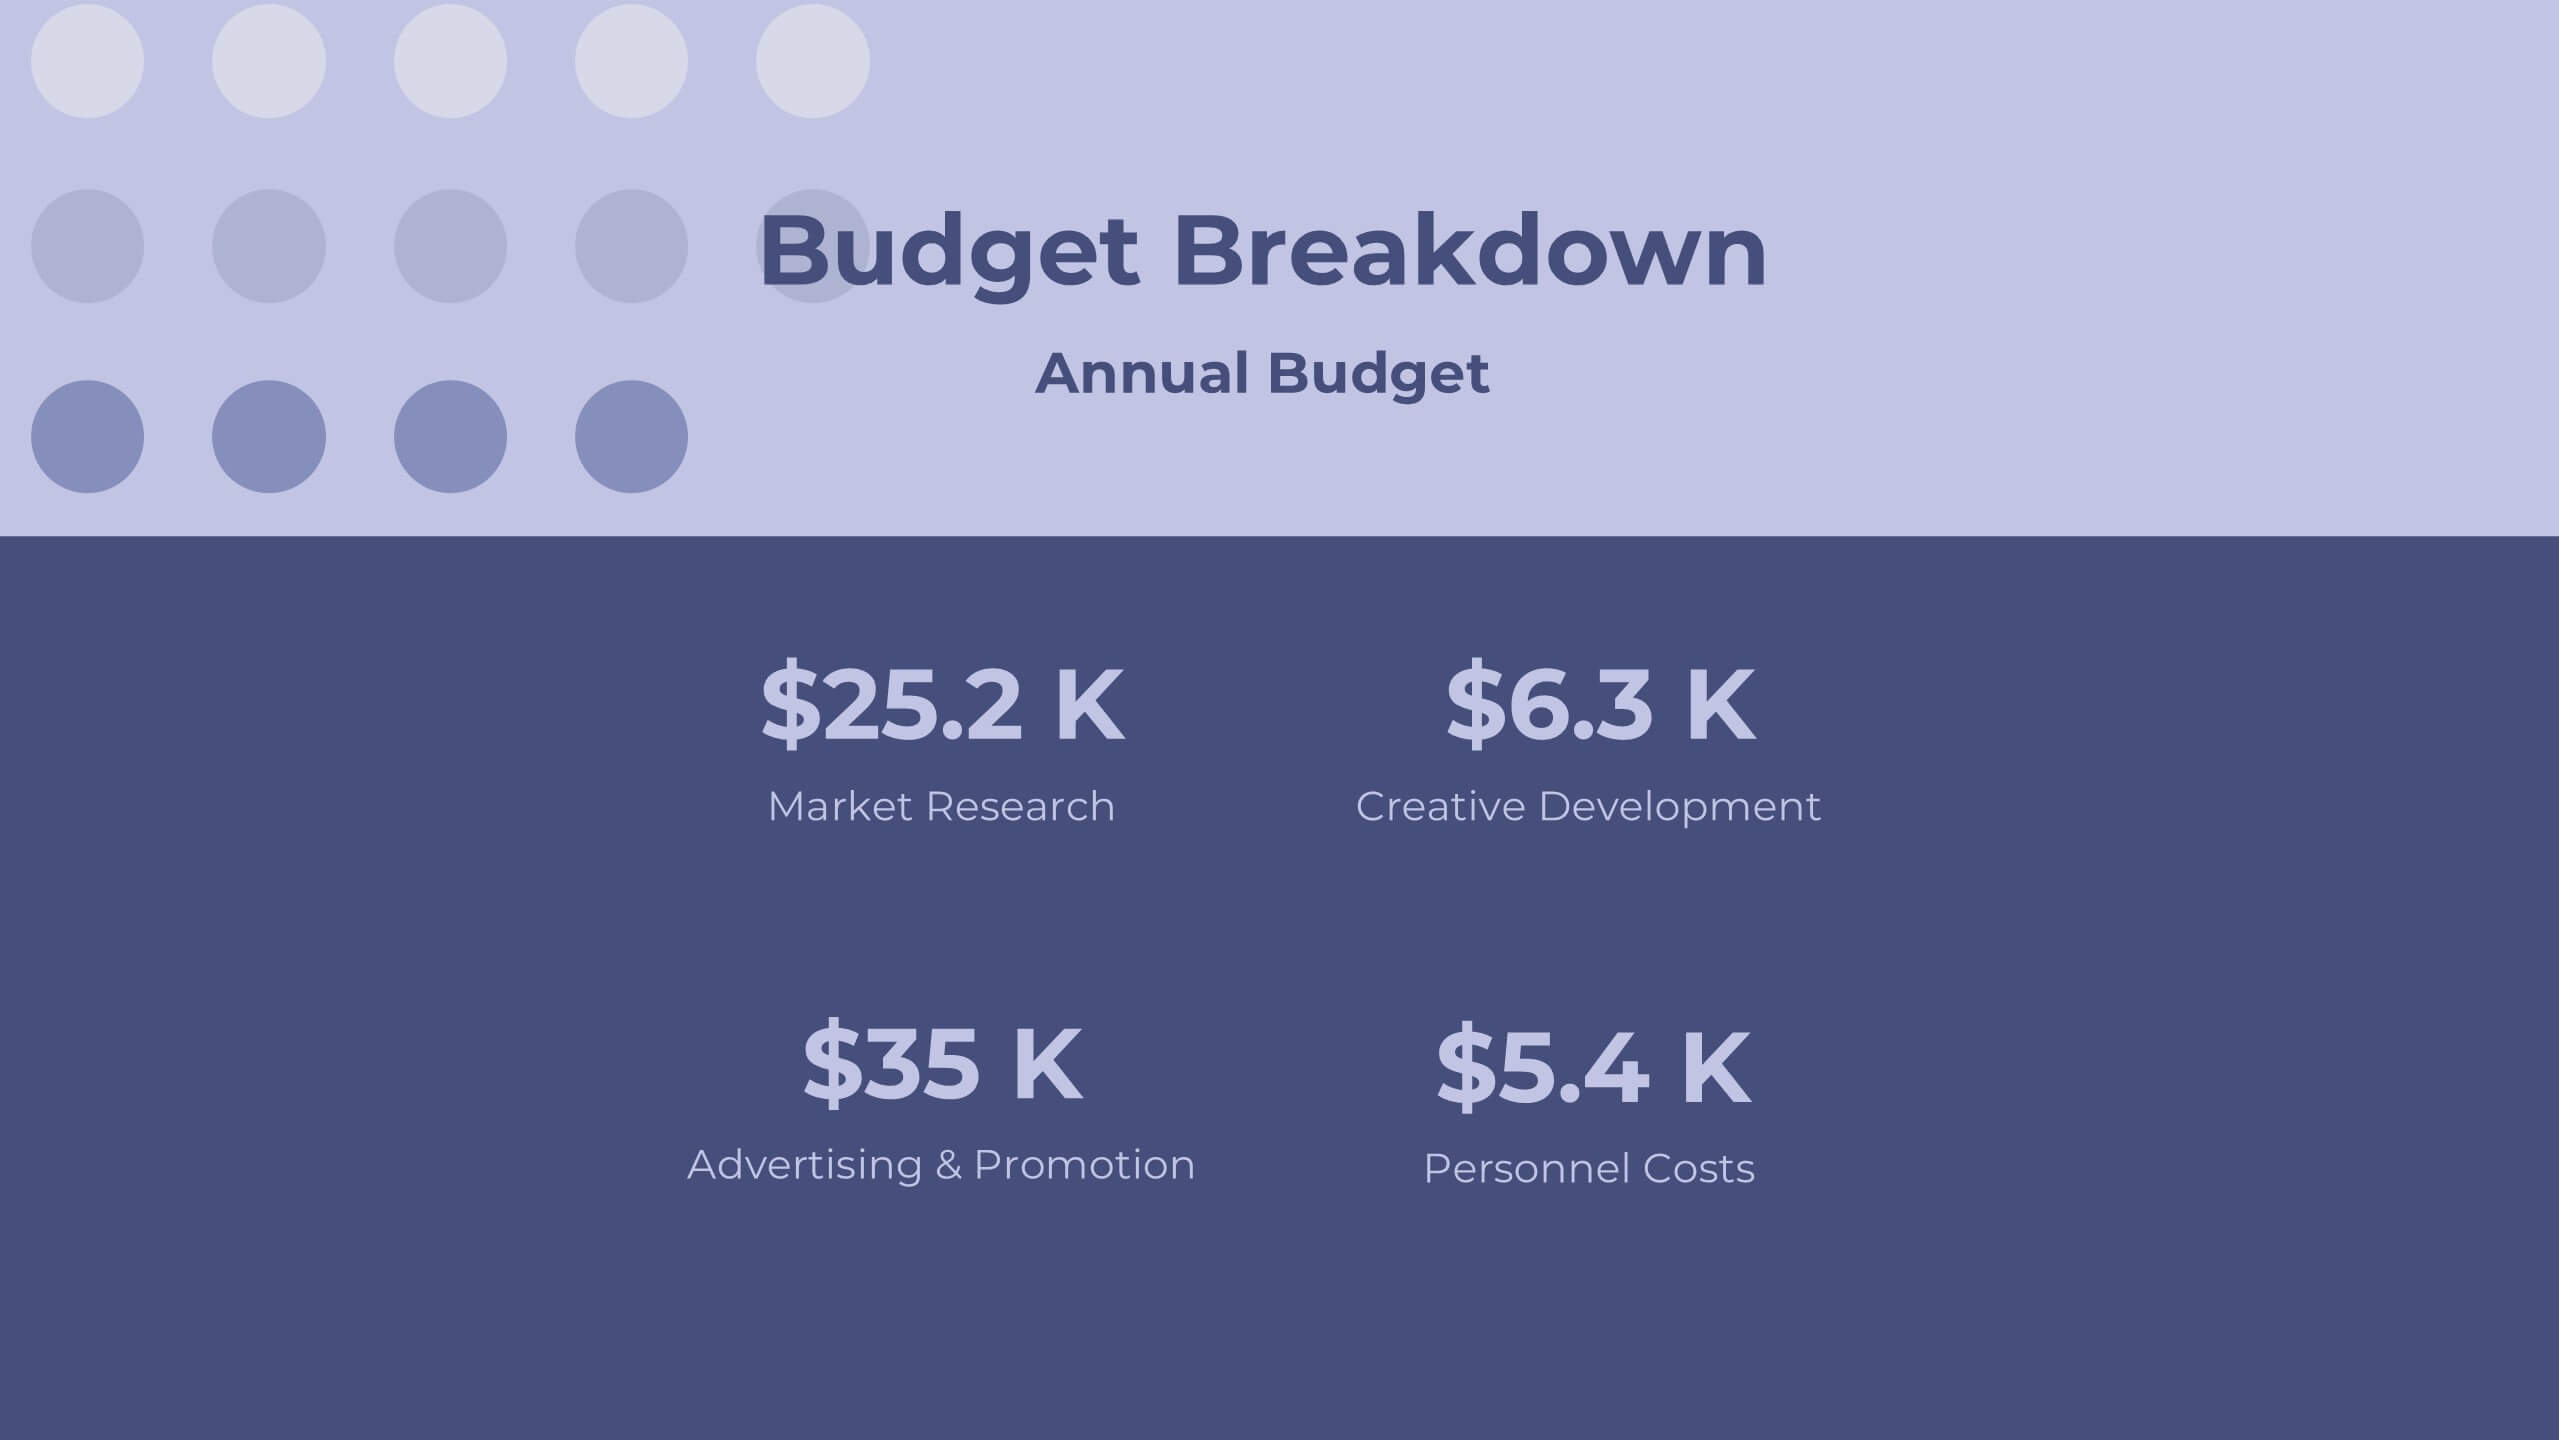
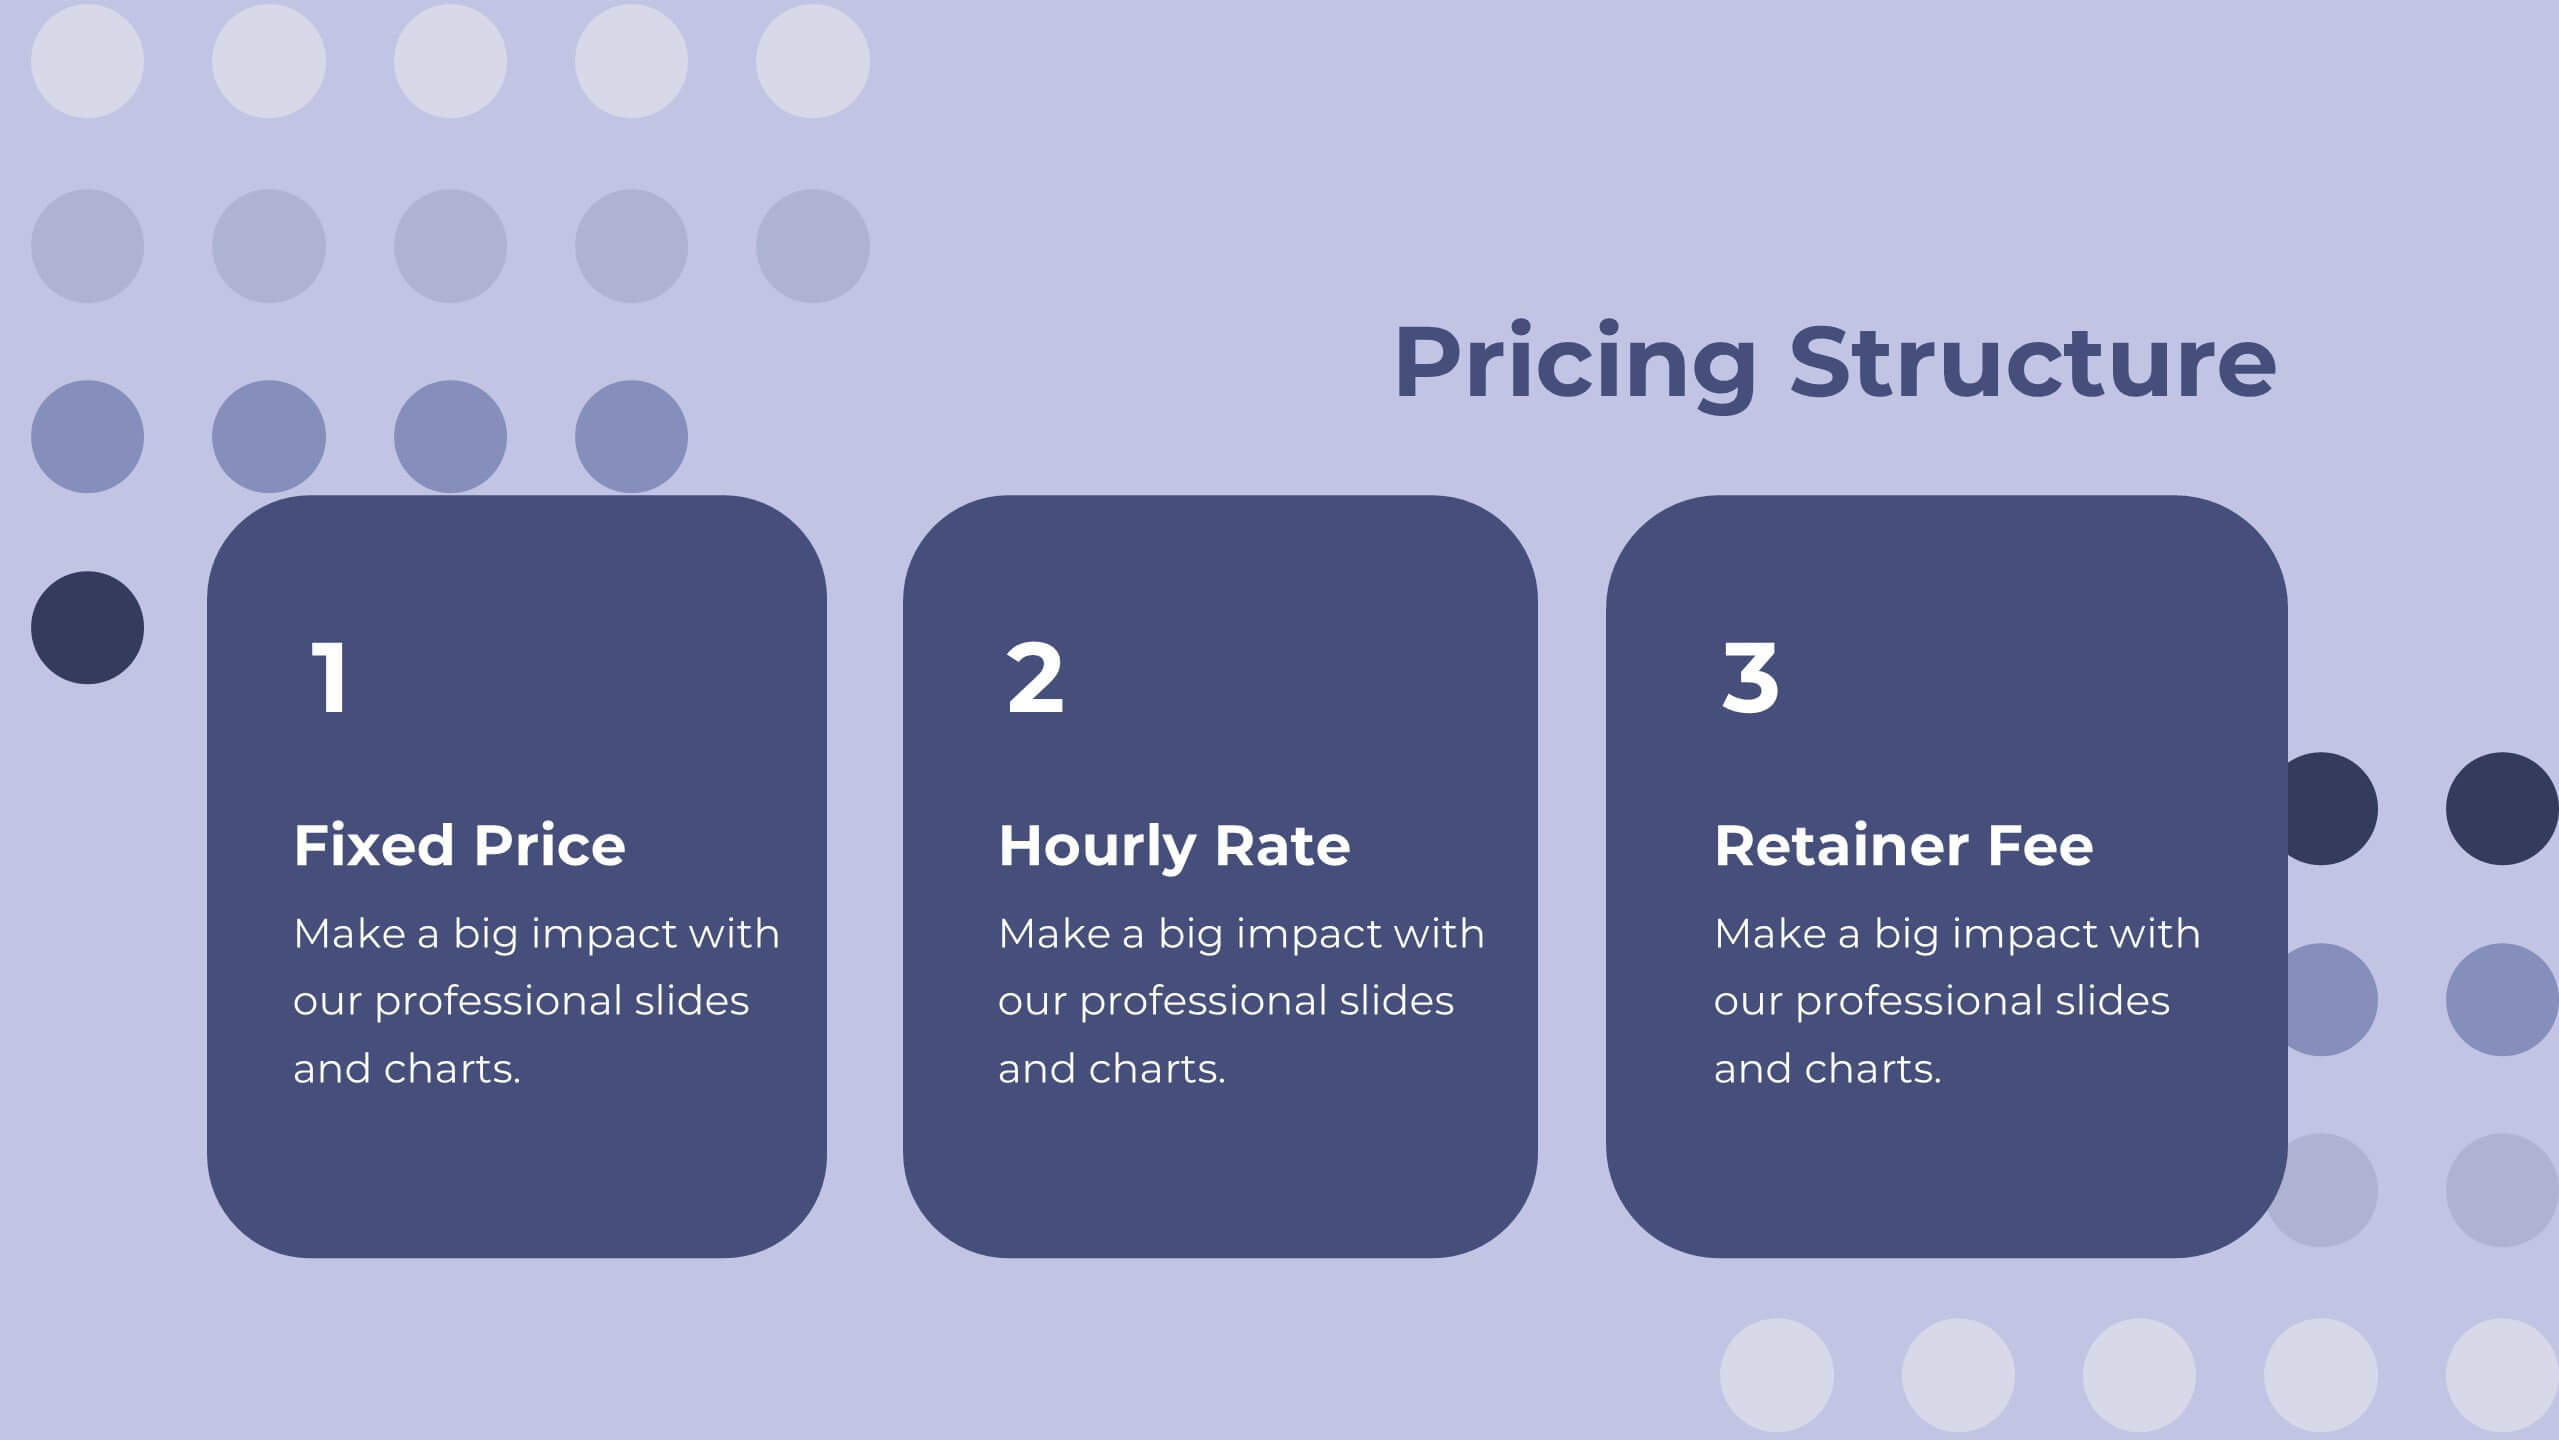
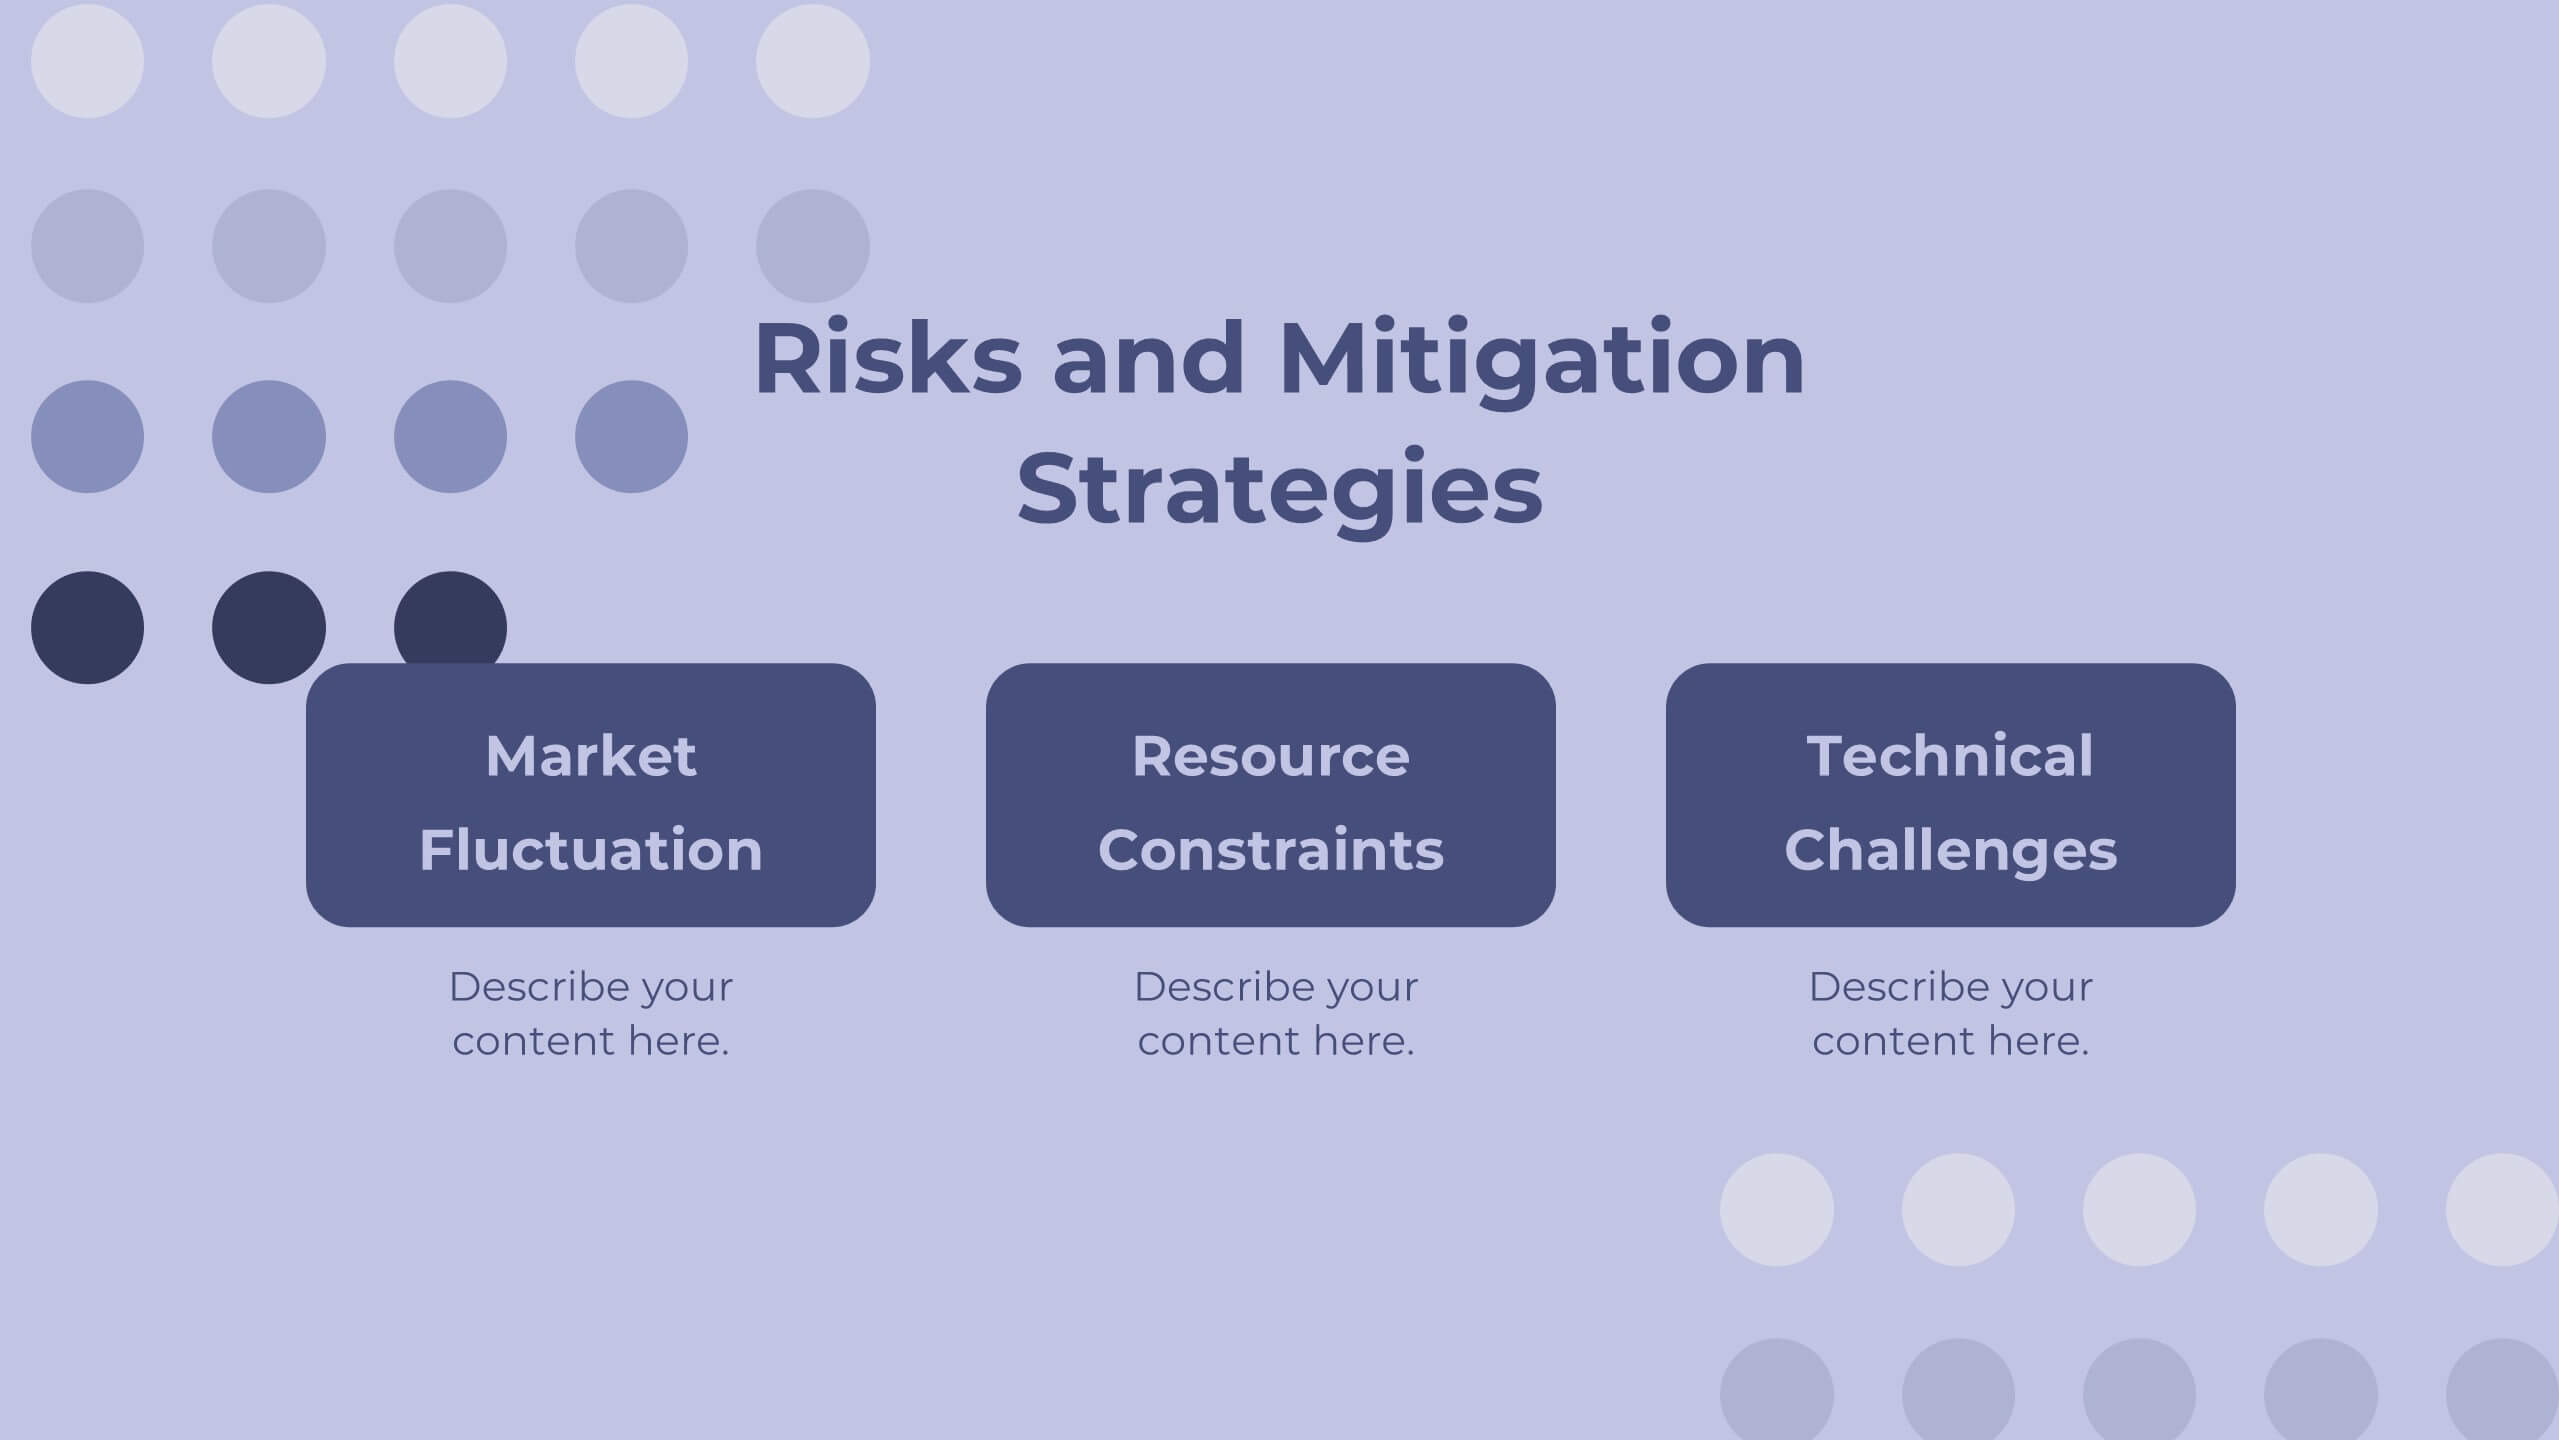
Labyrinth Project Proposal Presentation
Present your project proposal with this clean and professional template! Covering sections such as objectives, scope of work, timeline, and budget breakdown, it helps you convey your plan clearly and effectively. Fully customizable and compatible with PowerPoint, Keynote, and Google Slides, it’s perfect for delivering impactful proposals to clients.


7 diapositivas
Mind Map Infographic Presentation Template
A mind map is a diagram that allows you to visualize how related ideas and concepts are connected to one another. It is especially good for brainstorming, planning and organizing. A mind map allows you to organize information in a way that shows your thinking process and gives you the opportunity for deeper understanding. This template will help others understand how you think about a particular subject or topic. Use this template to "brainstorm" a topic, and create an interesting mind map. You can also use it to share your ideas with others, or to visually organize your thoughts.


7 diapositivas
Modern Education Infographic
Immerse yourself in the evolving world of learning with our Modern Education Infographic. With a crisp white canvas, the design incorporates an energizing mix of orange, the trust-building hue of blue, and a dash of passionate red. This template boasts modern infographics, bespoke icons, and versatile image placeholders, offering a visual guide to contemporary educational methods, tools, and trends. Precision-made for Powerpoint, Keynote, or Google Slides. Ideal for educators, curriculum developers, edtech startups, or any professional keen on showcasing the transformation in learning techniques.


7 diapositivas
IT Architecture Solution Infographic
Enhance your presentations with our IT Architecture Solution infographic, tailored for optimal clarity in Powerpoint, Keynote, and Google Slides. This infographic offers a comprehensive visual tool to simplify complex IT structures, ideal for professionals aiming to articulate intricate systems with ease. Its design facilitates a clear understanding of hierarchical IT frameworks, making it perfect for educational environments, business meetings, and tech conferences. Our IT Architecture Solution infographic is crafted to aid in the seamless conveyance of IT strategies and structures. The intuitive layout provides a straightforward narrative to IT infrastructure, ensuring your audience grasps technical details without feeling overwhelmed. This infographic is a must-have for anyone presenting IT concepts, delivering a balanced combination of simplicity and detail that caters to both novice and expert levels. With compatibility across various presentation platforms, this infographic integrates smoothly into your existing slides, enhancing your ability to communicate effectively in the digital age. Elevate your IT presentations with this essential visual aid.


10 diapositivas
Market Trends and Expansion in Oceania Map Presentation
Unlock new opportunities with the Market Trends and Expansion in Oceania Map template, which visualizes economic growth across the region while highlighting key market trends and expansion potentials.This essential business tool is designed for clarity and impact, compatible with PowerPoint, Keynote, and Google Slides, making it versatile for diverse presentation needs.


6 diapositivas
Simple TOC Layout for Deck Navigation Presentation
Guide your audience effortlessly with this Simple TOC Layout for Deck Navigation template. Featuring a clean, vertical flow with numbered icons and clear section markers, it’s ideal for organizing multi-part presentations. Fully customizable in Canva, PowerPoint, and Google Slides to match your brand colors and ensure professional, seamless navigation.


5 diapositivas
4-Phase Product Lifecycle Diagram Presentation
Visualize your product’s evolution with the 4-Phase Product Lifecycle Diagram Presentation. Perfect for marketing, strategy, and product teams, this template maps out introduction, growth, maturity, and decline stages. Fully editable in PowerPoint, Keynote, and Google Slides—ideal for product managers, analysts, and educators presenting strategic roadmaps or lifecycle planning.


5 diapositivas
Market Segmentation Strategy Presentation
Refine your approach with our "Market Segmentation Strategy" presentation template. Perfect for marketers looking to target specific consumer bases, this layout visually divides your market into manageable segments. It's ideal for presentations on market analysis and targeted marketing strategies, ensuring compatibility with PowerPoint, Keynote, and Google Slides to accommodate any presentation environment.


5 diapositivas
Sports Legends Infographics
Sport Legends play a significant role in inspiring and motivating aspiring athletes to achieve their goals. These Infographics can provide an educational and visually appealing way to showcase the accomplishments and achievements of some of the greatest athletes in history. These infographics can highlight specific individuals, teams, or eras, and can include statistics, records, awards, and other notable accomplishments. All the design elements are customizable and can include illustrations of the athletes, logos or team colors, and text boxes to highlight statistics and provide additional information.


2 diapositivas
Stylish Title Cover Presentation for Reports Presentation
Set the tone with a title slide that means business—without being boring. This stylish cover layout gives your report presentations a polished, modern look while keeping the focus clear and professional. Ideal for executive updates or client-facing decks, it’s fully editable and works perfectly in PowerPoint, Keynote, and Google Slides.