


Características


¿Tienes alguna pregunta?
Recomendar


5 diapositivas
Agile and Waterfall PM Models Presentation
Compare two popular project methodologies with ease using the Agile and Waterfall PM Models Presentation. This side-by-side layout highlights key differences in structure, flexibility, and delivery approach—perfect for client briefings, team onboarding, or stakeholder reviews. Fully editable in PowerPoint, Google Slides, Keynote, and Canva for seamless customization.


10 diapositivas
Leadership and Organizational Vision Presentation
Showcase your company’s path to growth and alignment with this sleek Leadership and Organizational Vision slide. The diamond-shaped infographic flow is perfect for outlining mission pillars, executive strategies, or value-driven goals across five stages. Each section includes icons and editable descriptions for clarity and engagement. Ideal for strategic planning sessions, team briefings, or executive reports. Fully customizable in PowerPoint, Keynote, and Google Slides for seamless integration into your presentation.


21 diapositivas
Sapphire Graphic Design Project Plan Presentation
Make your next project plan sparkle with this sleek, sapphire-inspired presentation design! This template is perfect for showcasing your graphic design project, helping you organize key milestones, timelines, and objectives. With its modern layout and clean aesthetics, your ideas will stand out beautifully. Compatible with PowerPoint, Keynote, and Google Slides.


10 diapositivas
5G Technology and Network Advancements Presentation
Showcase key milestones and trends in modern telecom evolution with this dynamic 5G network infographic. The slide features a clean, wave-like flow connecting five signal tower icons, perfect for outlining technological phases, speed upgrades, or infrastructure rollouts. Suitable for IT professionals, telecom analysts, and future-tech strategists. Fully customizable in PowerPoint, Keynote, and Google Slides.


34 diapositivas
Incubator Pitch Deck
An Incubator Pitch Deck is used by startups or entrepreneurs to pitch their business idea to an incubator or accelerator program, which are organizations that provide support, resources, and mentorship to early-stage startups to help them grow and succeed. This incubator pitch deck template is specifically tailored to the needs and requirements of the incubator or accelerator program. This template is designed with a professional and striking blue color palette, that adds a sense of sophistication and professionalism to your presentation. It also features a range of customizable slides that are specifically tailored for pitch presentations.


5 diapositivas
Comprehensive Sex Education Infographics
Navigate the sensitive landscape of human sexuality education with our comprehensive sex education infographics. Cast on a canvas of bold colors like black, yellow, and red, these infographics delicately handle the topics inherent to sex education. This tool is invaluable for educators, health professionals, advocacy groups, and policymakers who champion for informed, safe, and healthy choices. Compatible with Powerpoint, Keynote, and Google Slides. Ensuring the content resonates with audiences of diverse ages and backgrounds. The inclusion of compelling graphics and intuitive icons, fosters an environment of learning and openness, essential for impactful discussions.


6 diapositivas
Breast Cancer Effects Infographic
Breast Cancer Awareness Month, is an annual international health campaign organized by various organizations to raise awareness about breast cancer, highlight the importance of early detection and treatment, and provide support for those affected by the disease. This infographic template is a visual representation that provides information about the various effects and impacts of breast cancer on individuals' health, well-being, and daily lives. This infographic can be used to raise awareness, educate, and support individuals who are affected by breast cancer, as well as their families and communities.


12 diapositivas
Digital Marketing Strategy Presentations
Turn complex campaigns into captivating visuals with this modern, data-driven layout designed for marketing professionals. Perfect for outlining strategies, performance metrics, and digital funnels, it keeps information clear and visually engaging. Easily customizable and fully compatible with PowerPoint, Keynote, and Google Slides for seamless editing across your favorite platforms.


26 diapositivas
Melo Presentation Template
Are you looking for a presentation to make your product stand out? Melo is a beautifully elegant presentation with modern elements and light neutral color palette. Perfect for furniture brands, or any one looking for a modern presentation. These slides include world maps, company slides, mockups and charts perfect for businesses, this template has everything you'll need. It's simple yet chic design makes it stand out and at the same time keep your audience engaged. This is the perfect choice for businesses, brands or anyone who needs to make a great looking template on their next presentation


7 diapositivas
Circle Planning Infographic
Embark on holistic planning with our circle planning infographic. Encased within a pure white canvas and punctuated with harmonious green, insightful purple, and strategic blue, our template encapsulates the cyclical nature of meticulous planning. Endowed with concise infographics, indicative icons, and adaptable image placeholders, it elucidates the continuity and stages of planning processes. Flawlessly designed for Powerpoint, Keynote, or Google Slides. An irreplaceable tool for project managers, business strategists, educators, or any professional aiming for a rounded approach to planning.


4 diapositivas
Comparison Table Slide Presentation
Quickly highlight the differences between options with the Comparison Table Slide Presentation. This layout features a clean, structured table with checkmarks and Xs to visually compare features, services, or product tiers. Ideal for pricing plans, feature breakdowns, or side-by-side evaluations. Each column is color-coded for clarity and impact. Fully customizable in PowerPoint, Keynote, and Google Slides.


6 diapositivas
Time Management Skills Infographic
Time Management refers to the process of planning and organizing your time effectively to accomplish tasks, achieve goals, and maximize productivity. This infographic template aims to help individuals improve their time management abilities. It provides practical tips, techniques, and strategies to effectively manage time and increase productivity. This template provides practical guidance on setting goals, prioritizing tasks, managing distractions, and optimizing productivity. This infographic will help your audience develop effective time management skills and make the most of their valuable time.


4 diapositivas
Team and Department Setup Structure Presentation
Organize your team with clarity using the Team and Department Setup Structure Presentation. This template is perfect for showcasing internal team hierarchies, departmental layouts, or functional groupings in a clean and professional layout. Each slide is fully customizable, allowing you to edit icons, titles, and structure to suit your organization. Compatible with Canva, PowerPoint, Keynote, and Google Slides.


6 diapositivas
12-Month Calendar Overview Presentation
Kick off your planning with a clean, colorful layout that makes every month easy to visualize at a glance. This presentation helps you map timelines, milestones, and deadlines in a structured format ideal for yearly planning. Fully editable and compatible with PowerPoint, Keynote, and Google Slides.


22 diapositivas
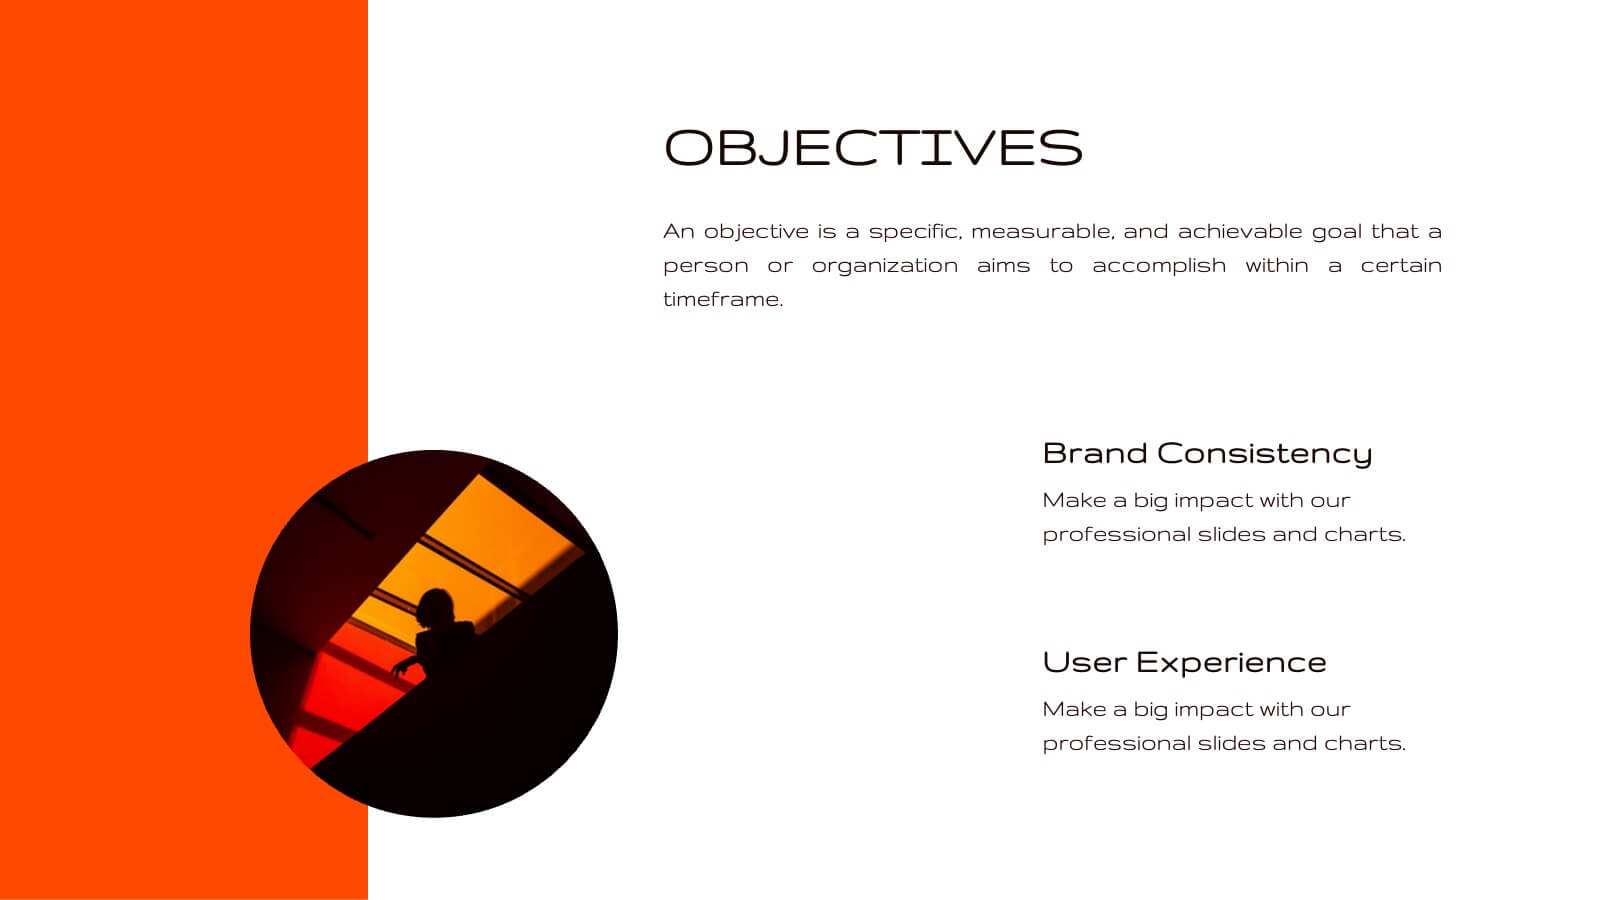
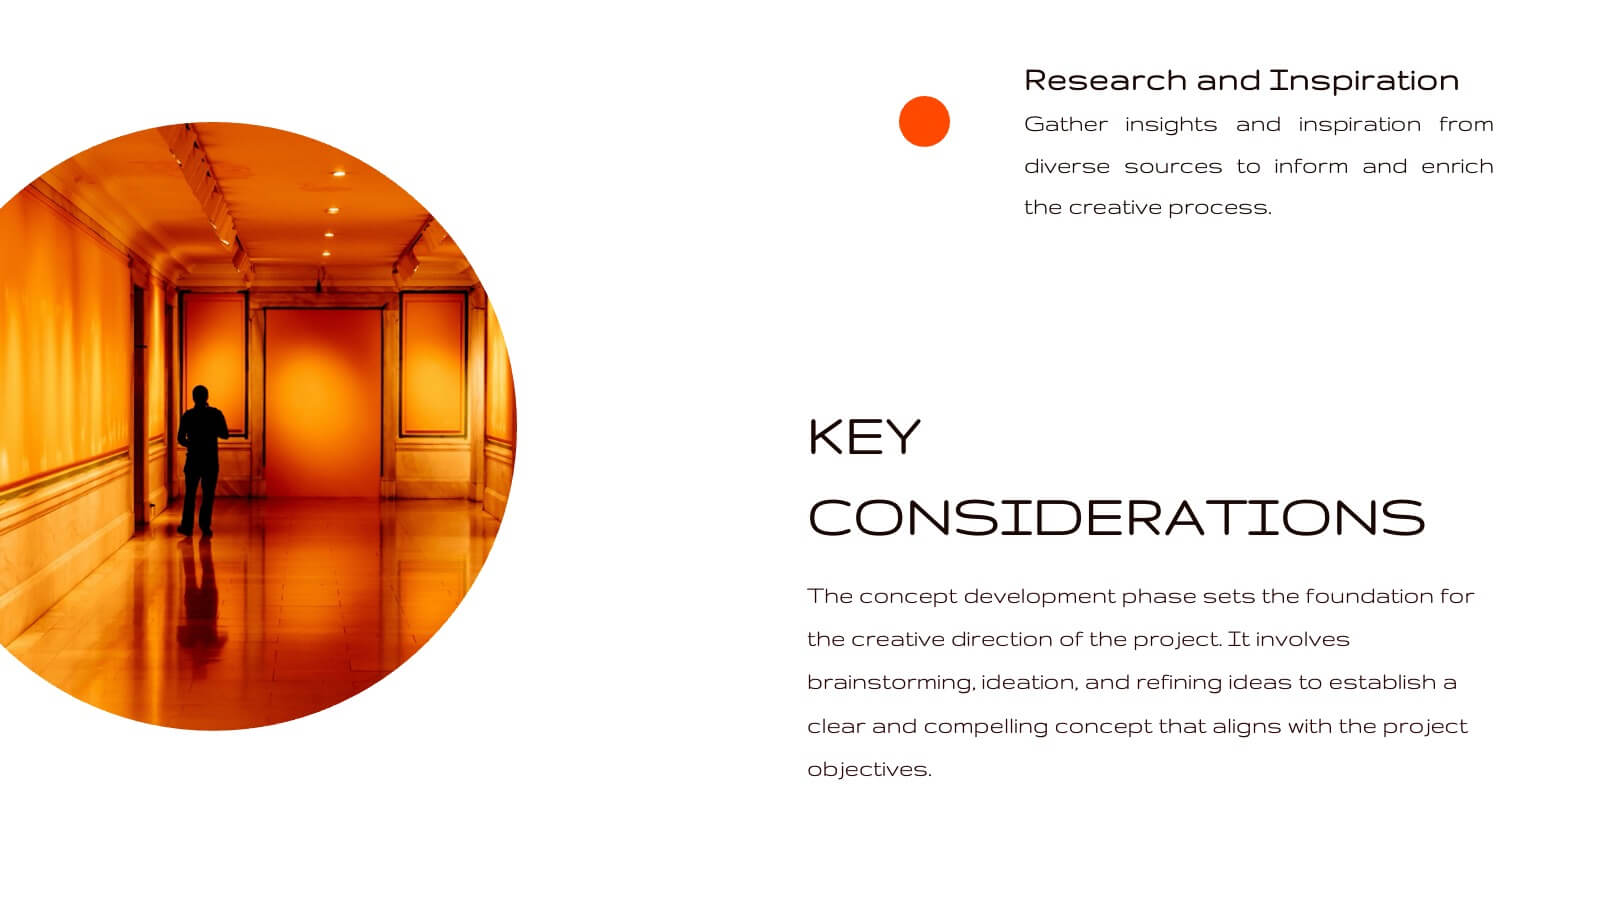
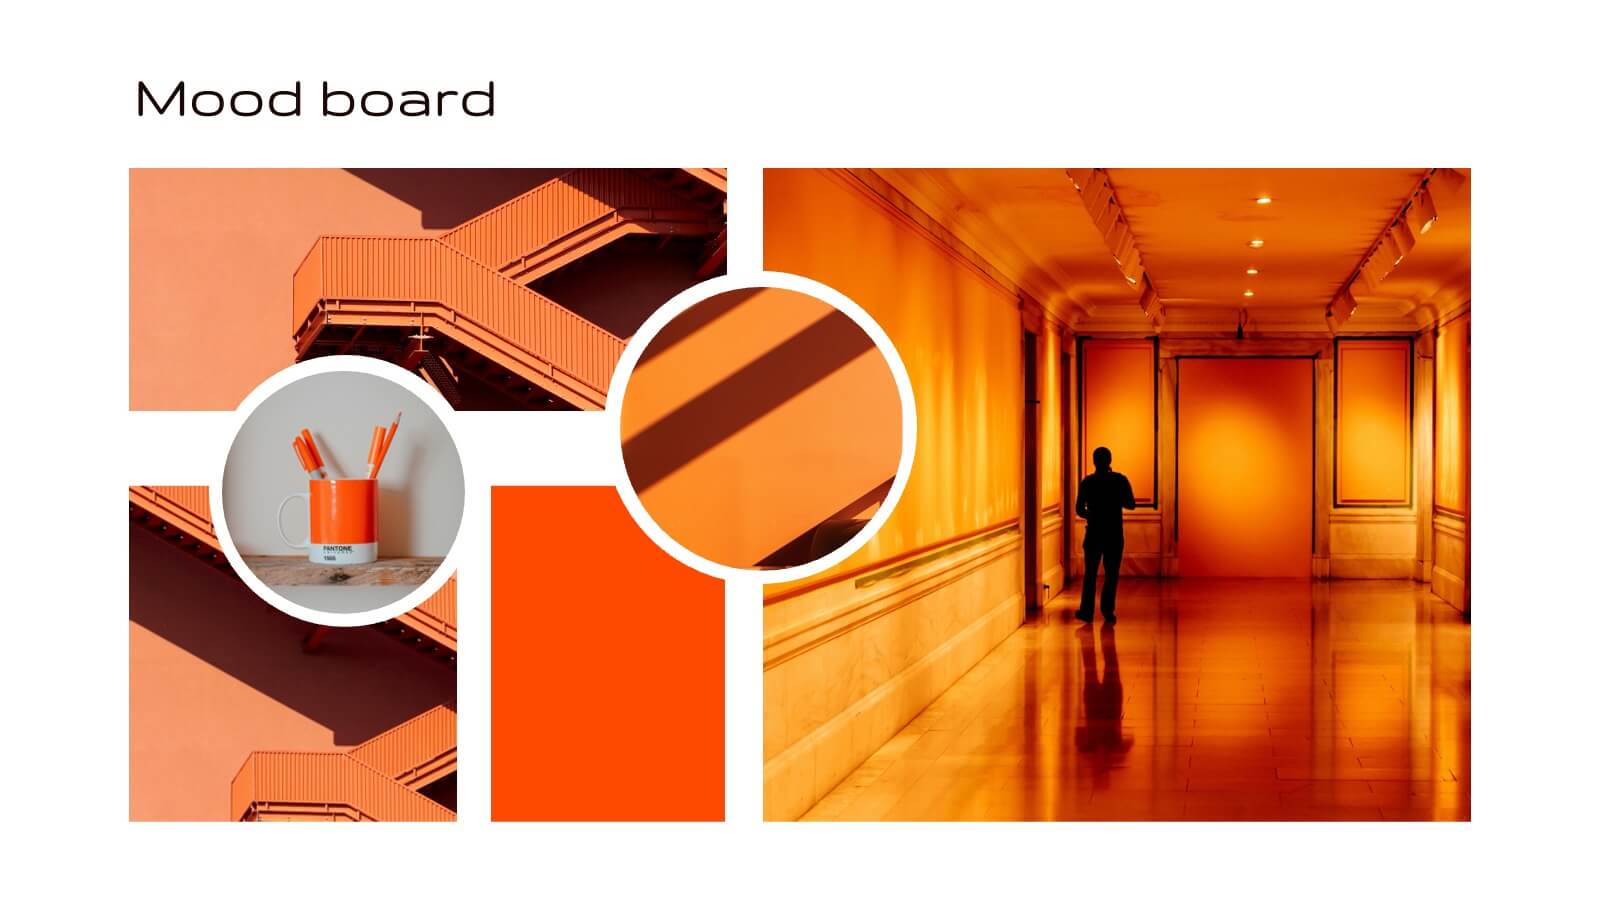
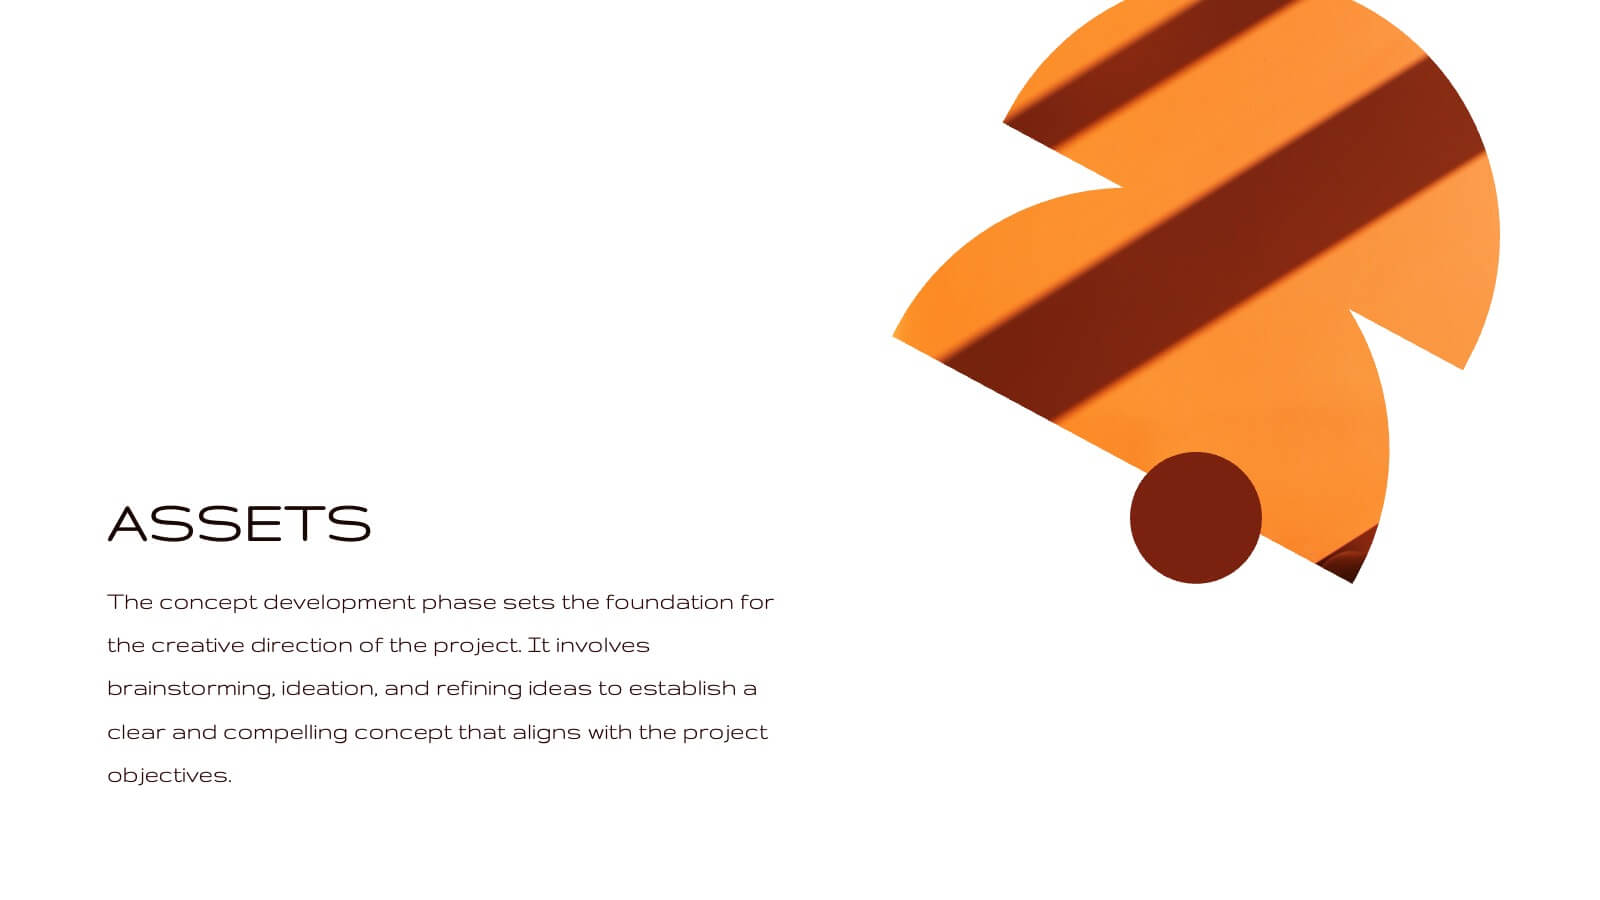
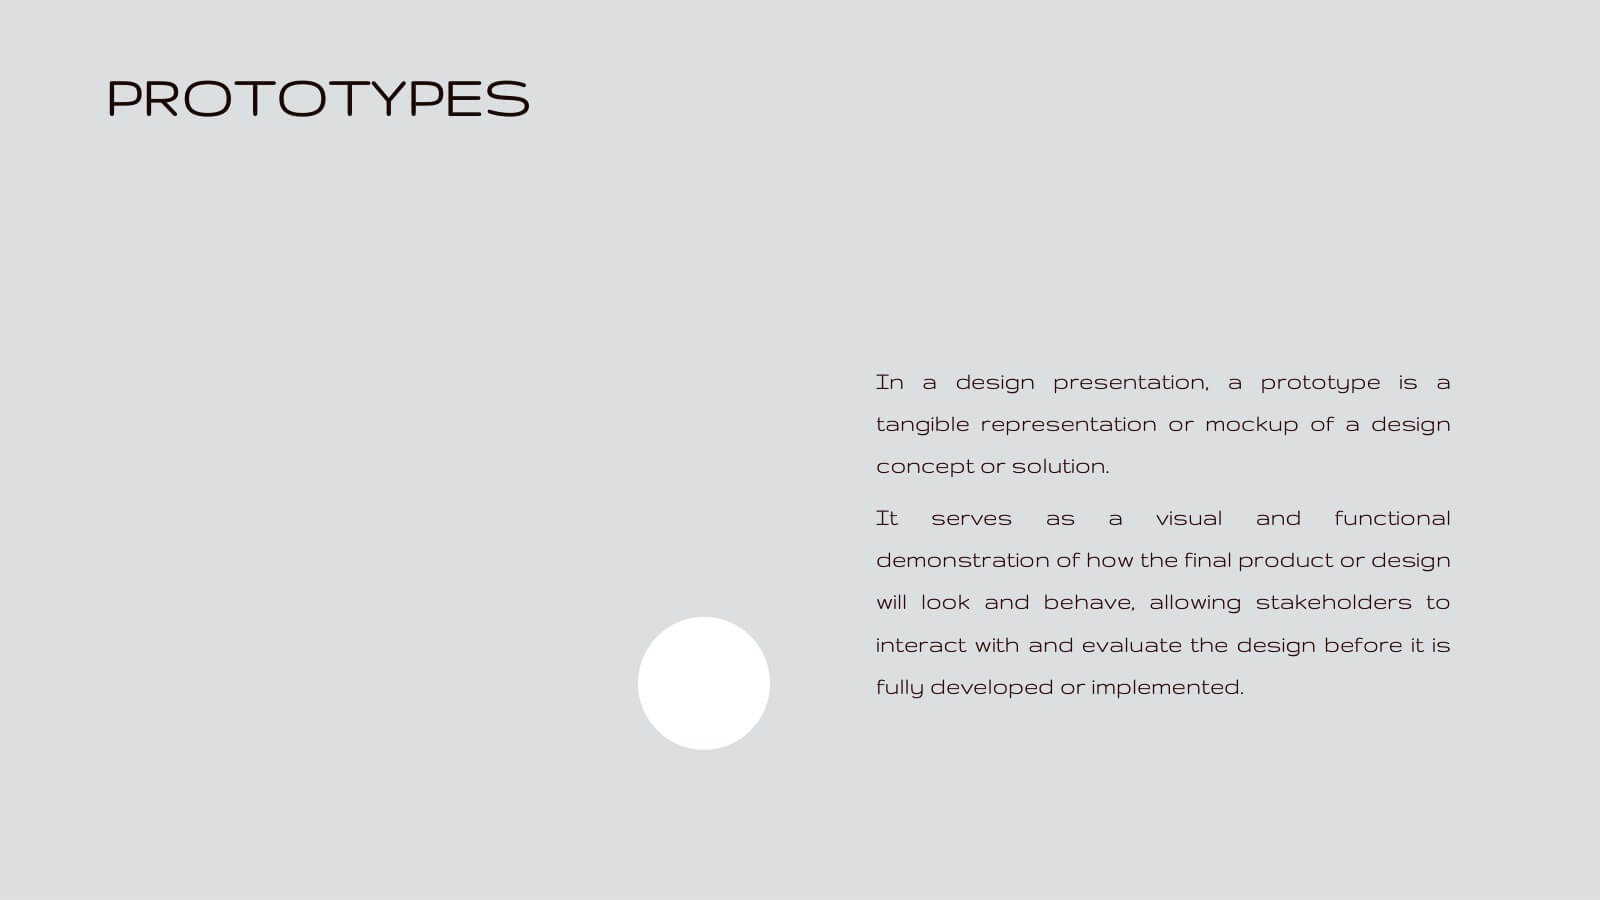
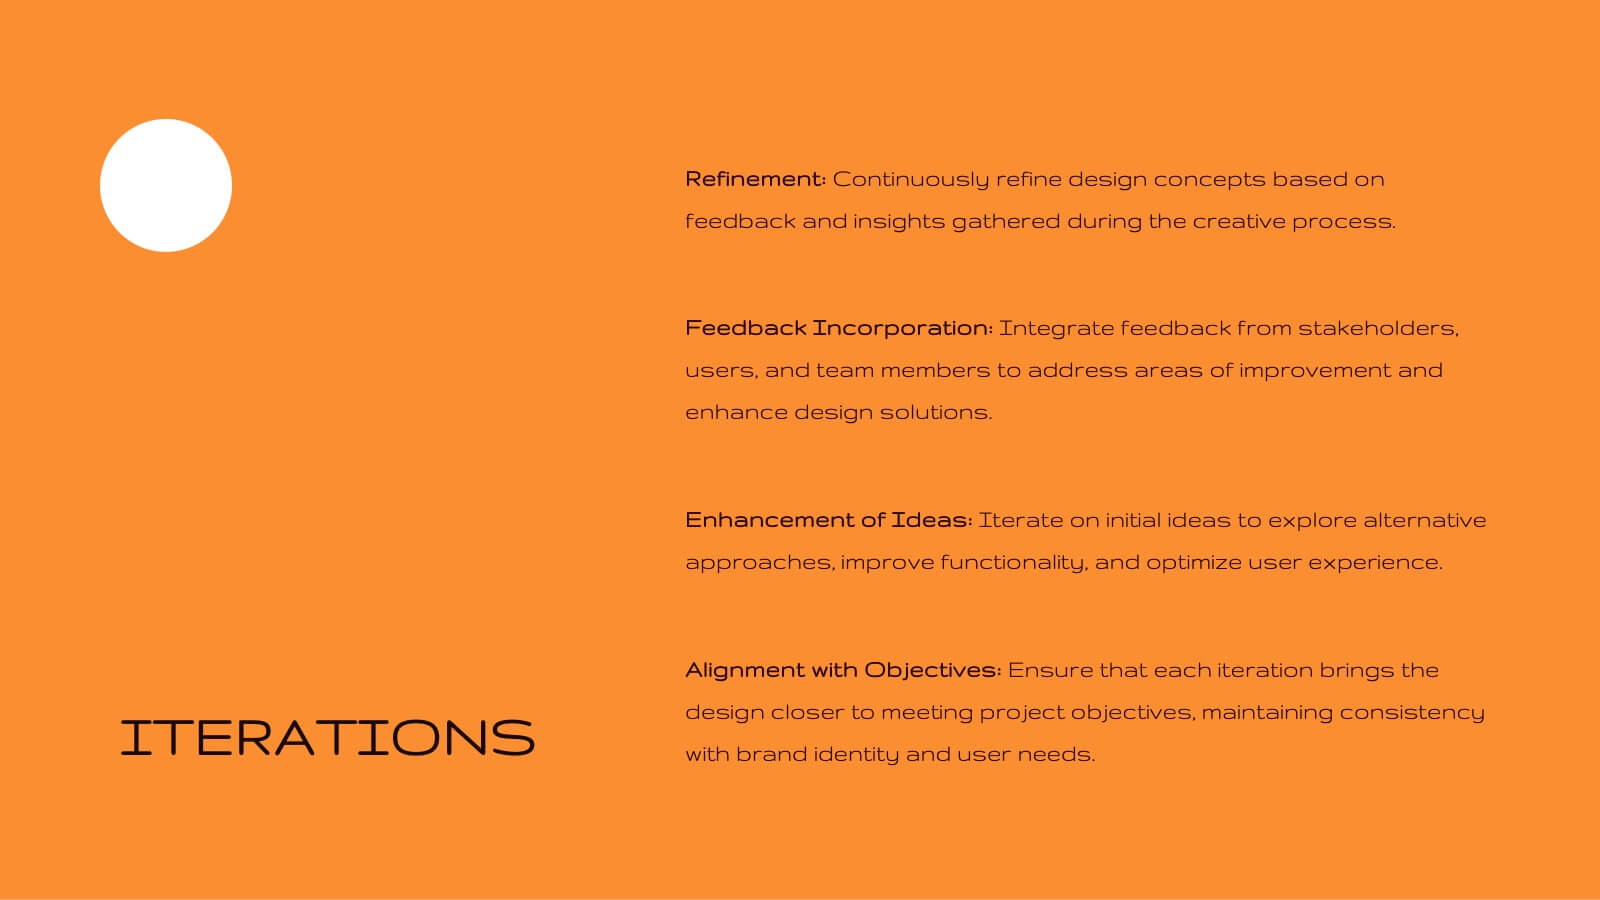
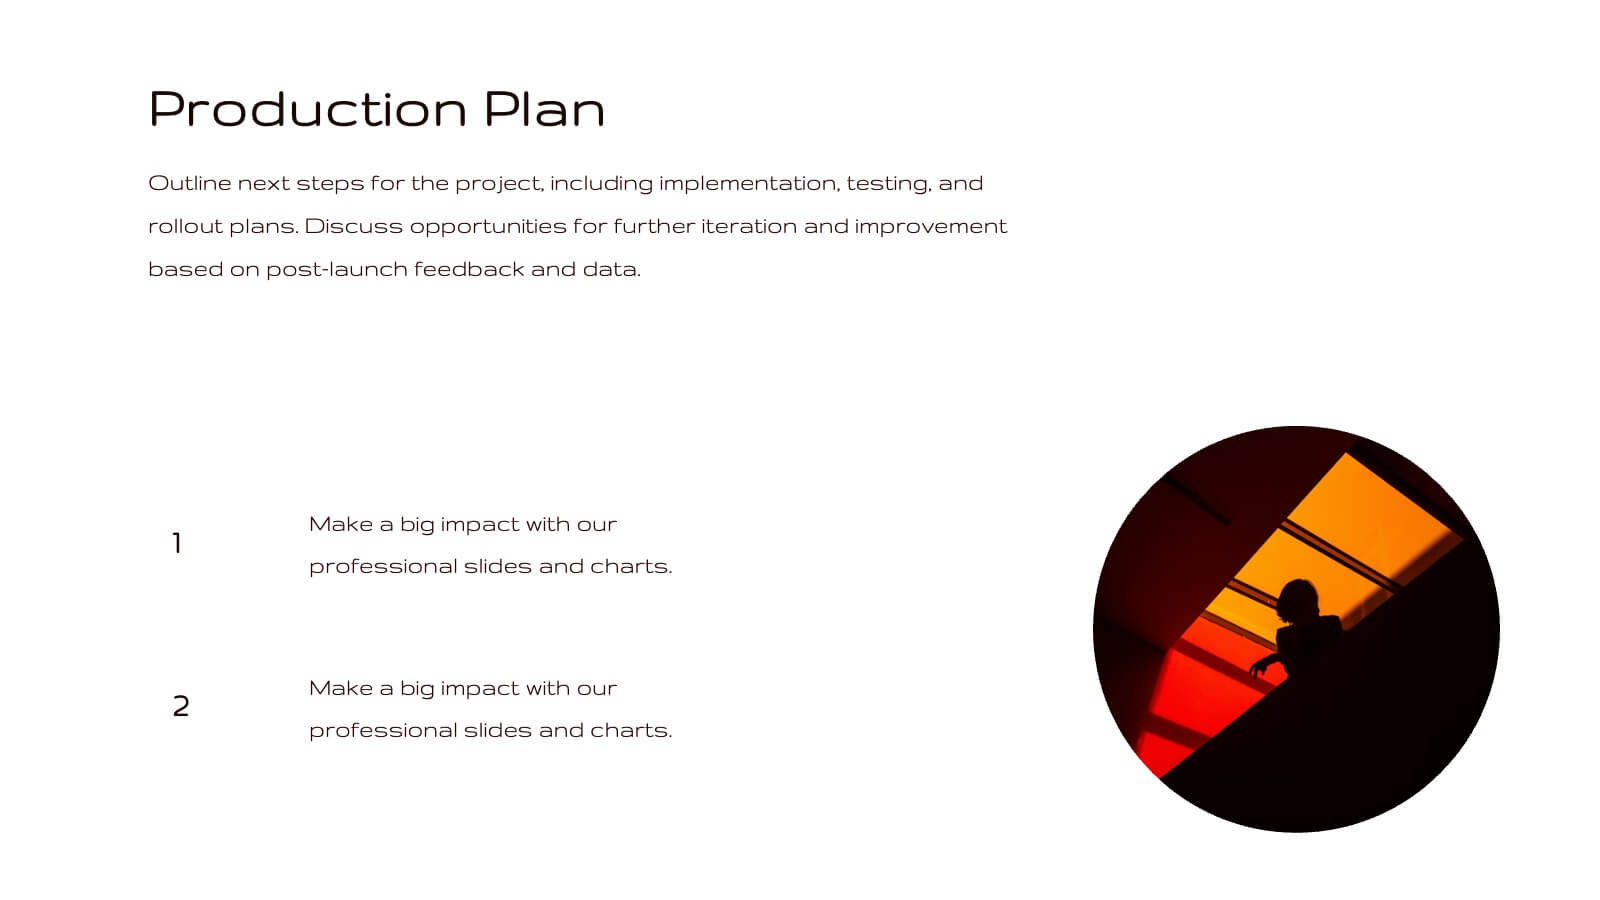
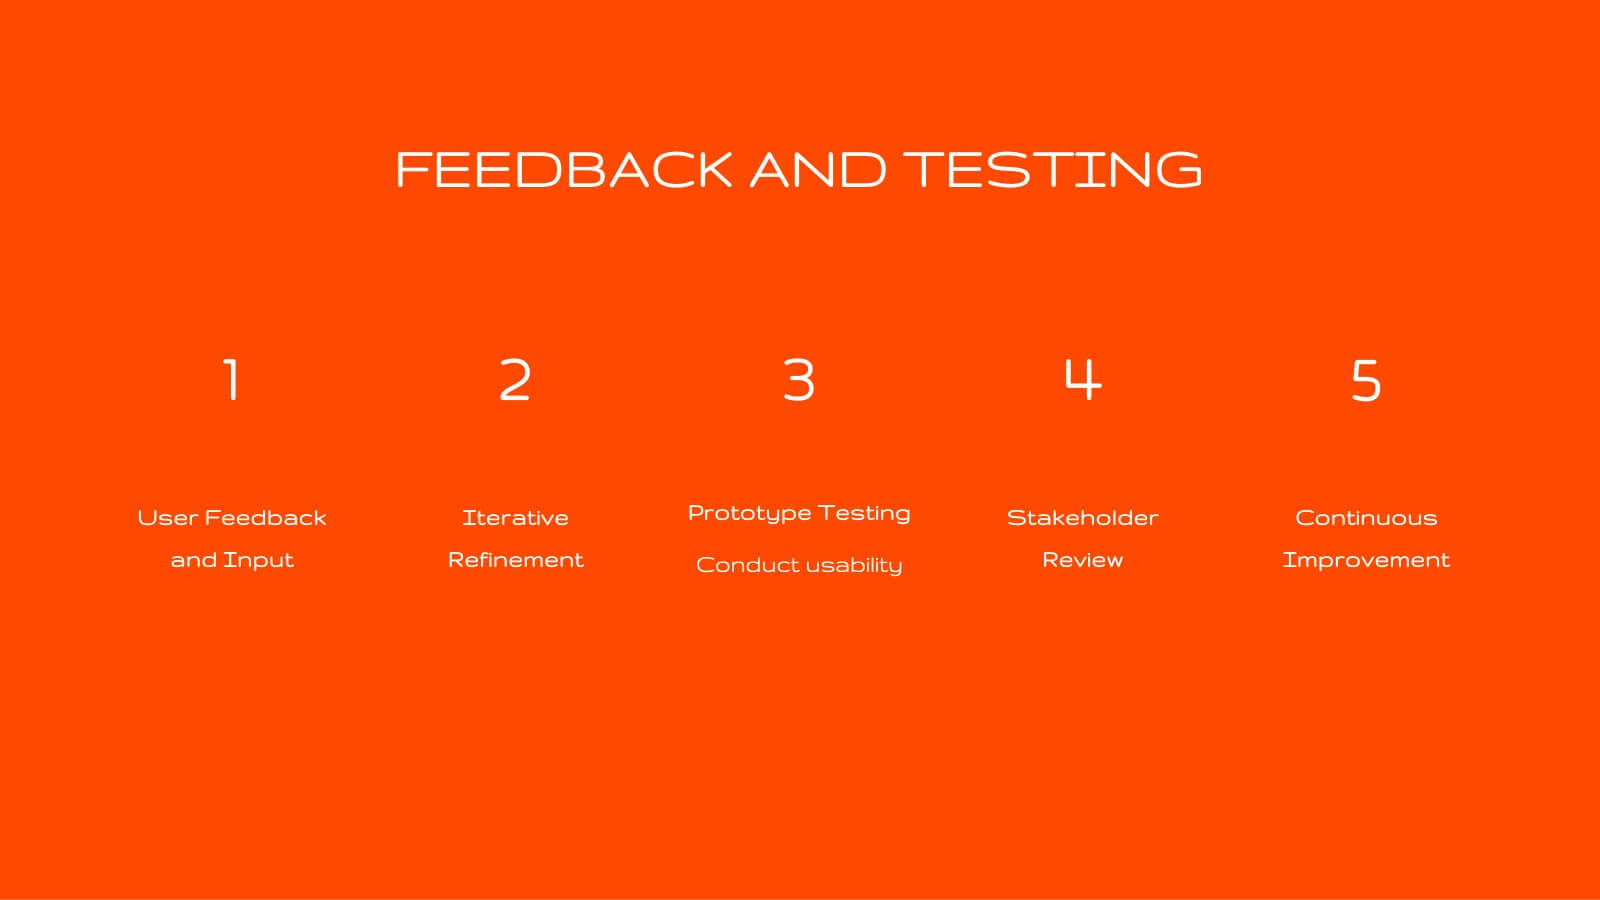
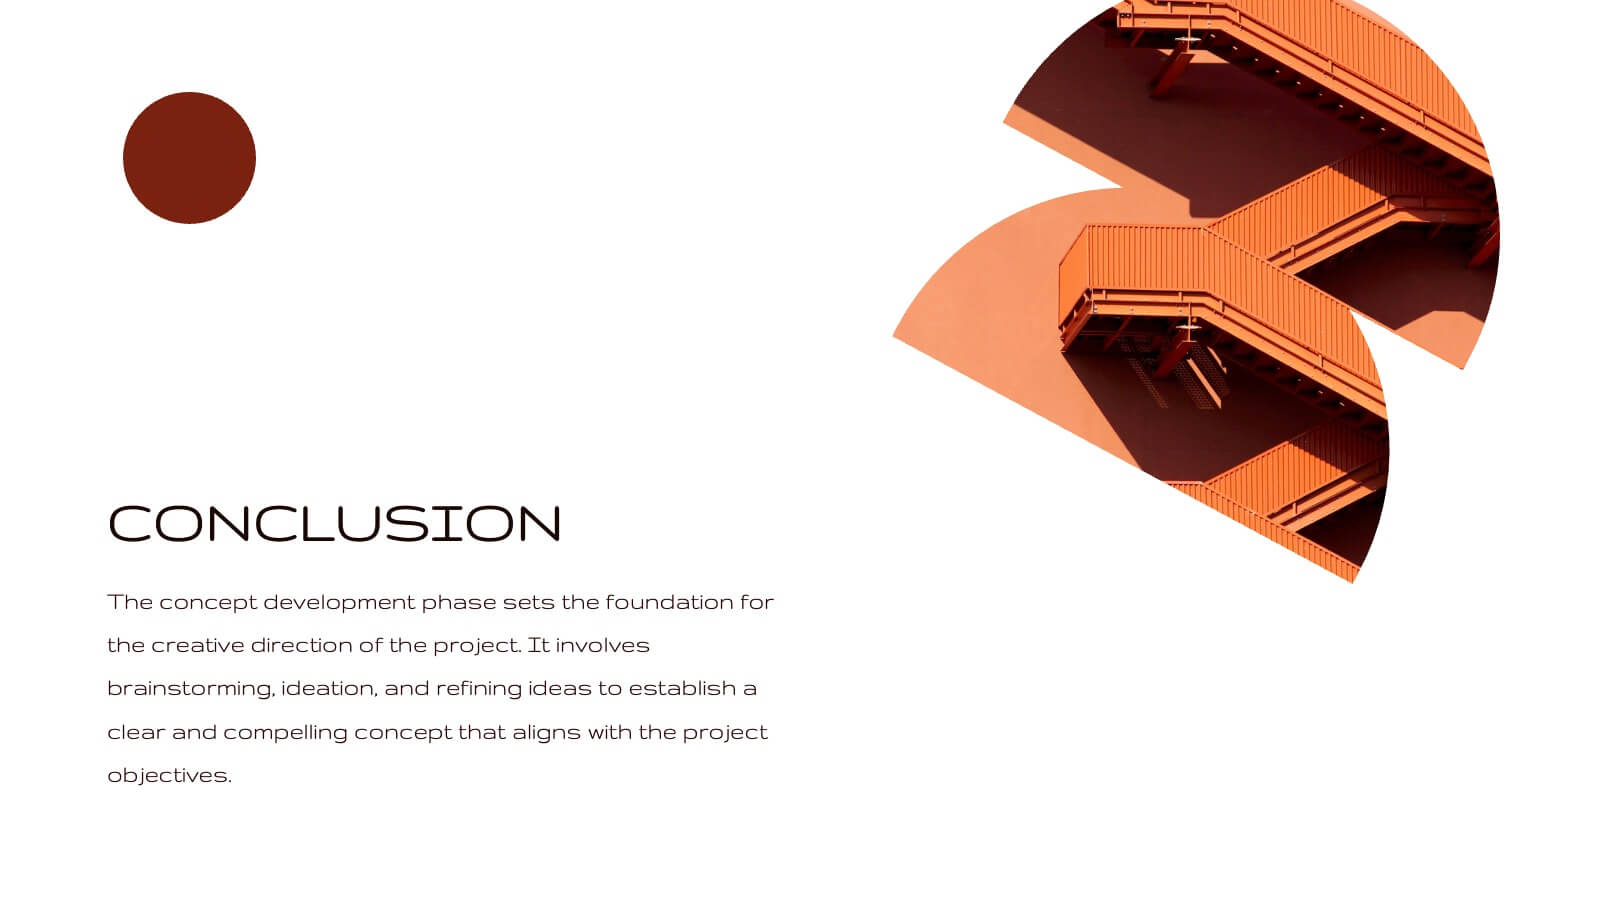
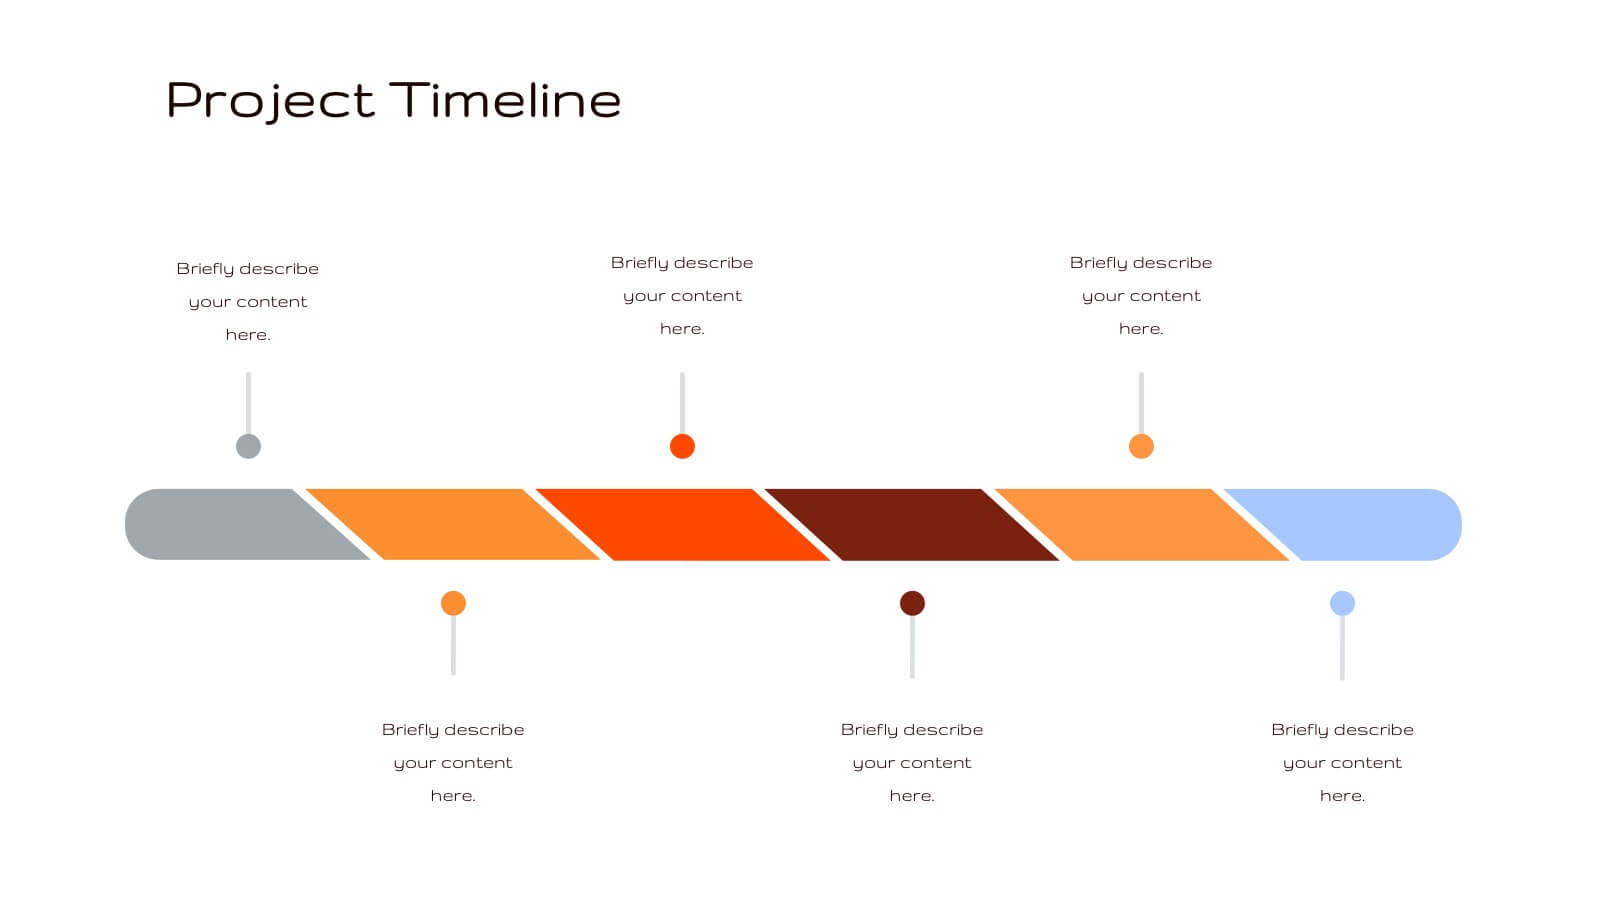
Radiance Creative Design Report Presentation
Bring your design ideas to life with this vibrant, engaging presentation template. Ideal for showcasing creative processes, concept development, and project timelines, it features a striking color palette and clean layout. This template is designed to captivate your audience and clearly communicate your design vision. Compatible with PowerPoint, Keynote, and Google Slides, it’s perfect for any platform.


26 diapositivas
Efficient Time Management Presentation
Optimize your time management skills with a presentation designed to streamline your productivity. The template offers a professional and calming color palette, encouraging focus and clarity. It's structured to address the key principles of time management, from prioritizing tasks to strategic planning. Within the slides, you’ll find tools to introduce time management concepts, team profiles to assign roles efficiently, and charts to monitor progress. Engaging graphics and infographics are used to outline processes and time allocation, making it easier to visualize effective time management strategies. This template is a perfect match for workshops, personal organization sessions, or corporate training programs, compatible with popular platforms like PowerPoint, Keynote, and Google Slides. It’s designed to aid professionals and teams in harnessing their time effectively, ensuring every second counts towards achieving their goals.


8 diapositivas
Large-Scale Data Processing Tools Presentation
Simplify the complexity of data processing with this sleek and modern template for mapping large-scale tools and systems. Ideal for tech teams, data analysts, and IT professionals, this slide helps you explain how data flows through cloud-based infrastructures. Fully customizable and compatible with PowerPoint, Keynote, and Google Slides.