


Características


¿Tienes alguna pregunta?
Recomendar


5 diapositivas
Monthly Sales Report Infographics
A monthly sales report is a document that provides an overview of a company's sales performance during a specific month. These infographic templates are perfect for sales managers, business owners, or analysts who want to present monthly sales performance and trends to stakeholders, team members, or clients. This is an effective tool for presenting sales data in a visually engaging and comprehensive way. With these templates, you can create professional and impactful sales reports that effectively convey the story behind the numbers. Compatible with Powerpoint, Keynote, and Google Slides.


6 diapositivas
Internal Communication Strategy Presentation
Bring your message to life with a dynamic slide that turns communication goals into a simple, engaging visual story. This presentation highlights key steps, channels, and team roles to help audiences understand how information flows across an organization. Clean icons and structured layouts make every point clear and memorable. Fully compatible with PowerPoint, Keynote, and Google Slides.


5 diapositivas
AIDA Marketing Funnel Presentation
The "AIDA Marketing Funnel Presentation" template is expertly designed to streamline the visualization of the AIDA model, which stands for Attention, Interest, Desire, and Action. This template aids marketers in presenting and analyzing the effectiveness of marketing strategies to capture the consumer's journey from awareness to the final action of purchasing. Each stage of the funnel is clearly defined and color-coded, making it simple to insert specific strategies or results that relate to each step of the consumer engagement process. Ideal for marketing presentations, this template helps in explaining complex concepts in a digestible format, ensuring that the audience can easily follow along and understand key marketing tactics and outcomes.


6 diapositivas
Machine Learning Systems Overview
Get ready to light up your next tech talk with a bold, clean layout that simplifies even the most complex systems. This infographic presentation template is designed to break down how intelligent algorithms function, analyze data, and learn patterns—perfect for explaining how machine learning fits into real-world applications. Each slide uses smart visuals and icons to guide viewers through each system stage with clarity. Ideal for educators, developers, or startups pitching AI-powered solutions, it’s a creative and professional way to keep your audience engaged. Fully compatible with PowerPoint, Keynote, and Google Slides.


8 diapositivas
Airline Business Strategy Presentation
Leverage key insights into the aviation sector with the "Aviation Industry Market Analysis" presentation template. This design allows professionals in the aviation industry to effectively communicate market trends and forecasts. Its compatibility with PowerPoint, Keynote, and Google Slides ensures a versatile use across different platforms, making it ideal for industry analyses, investor meetings, or internal strategy discussions.


7 diapositivas
South America Countries Map Infographic
This South America Countries Map infographic template is designed for detailed presentations on the geographical and statistical information of South American countries. Compatible with PowerPoint, Google Slides, and Keynote, the template set includes maps with data points indicating various statistics such as population percentages, and demographic information. Visual aids like pie charts, bar graphs, and icon representations help to depict data in an easily understandable manner. The color-coding and labels are clear, making it easy to differentiate between countries and regions. This template is ideal for educators, analysts, and business professionals needing to present country-specific data across South America.


8 diapositivas
Project Timeline and Schedule Presentation
Keep your projects on track with this clear and professional timeline layout. This presentation is designed to help you outline tasks, milestones, and deadlines week by week. Easily visualize the flow of work, allocate resources efficiently, and ensure everyone stays aligned on the project schedule. Perfect for business meetings, project proposals, team updates, and academic planning. Fully editable and compatible with PowerPoint, Keynote, and Google Slides.


5 diapositivas
DMAIC Six Sigma Framework
Visualize process improvement with this clear and structured DMAIC Six Sigma slide. Perfect for business analysts, quality teams, and project managers, it highlights each phase—Define, Measure, Analyze, Improve, and Control—in a streamlined format. Fully editable in PowerPoint, Keynote, and Google Slides.


5 diapositivas
USA Economy Infographics
The U.S. economy has a significant impact on the global economy and serves as a benchmark for economic performance. These vertical infographics are the perfect tool to present your key facts, statistics, and trends to help the audience understand the economic landscape of the country. The visually appealing design included, coupled with concise and relevant information, helps to effectively communicate the complexities of the economy. Whether used for educational purposes or as a reference tool, these templates provides a comprehensive overview of the USA economy and its key components. Fully compatible with Powerpoint, Keynote, and Google Slides.


10 diapositivas
Body System Educational Overview Presentation
Dive into anatomy with a slide that makes learning the human body visual, clear, and interactive. This educational overview breaks down key body systems into simple, labeled sections—perfect for classroom teaching, medical training, or health awareness campaigns. Fully editable and compatible with PowerPoint, Keynote, and Google Slides for seamless customization.


22 diapositivas
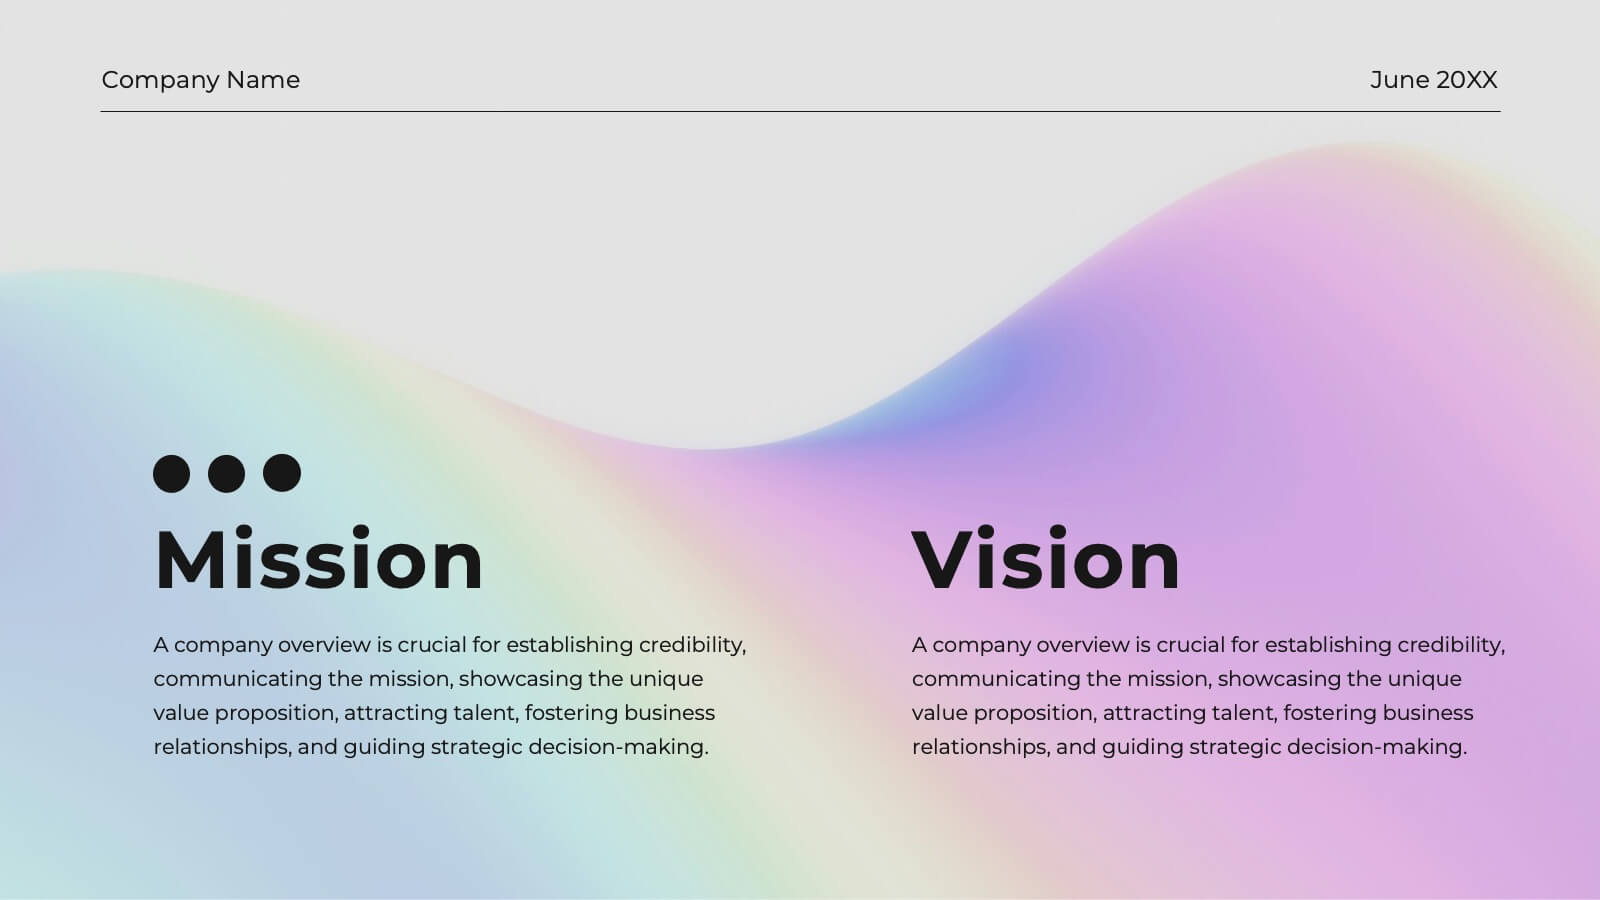
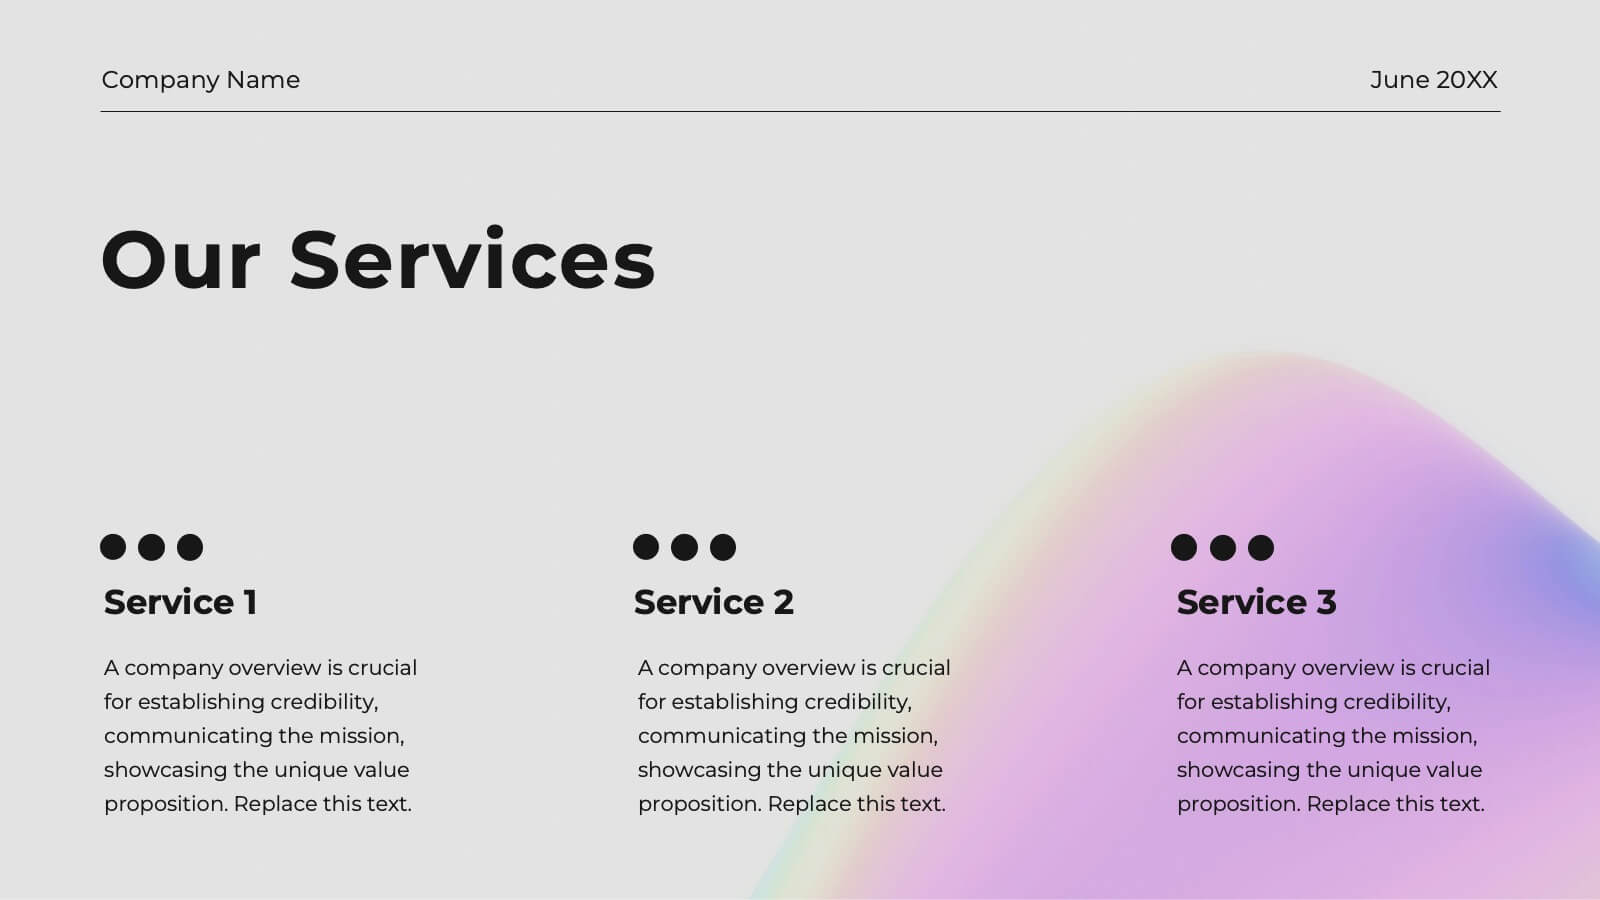
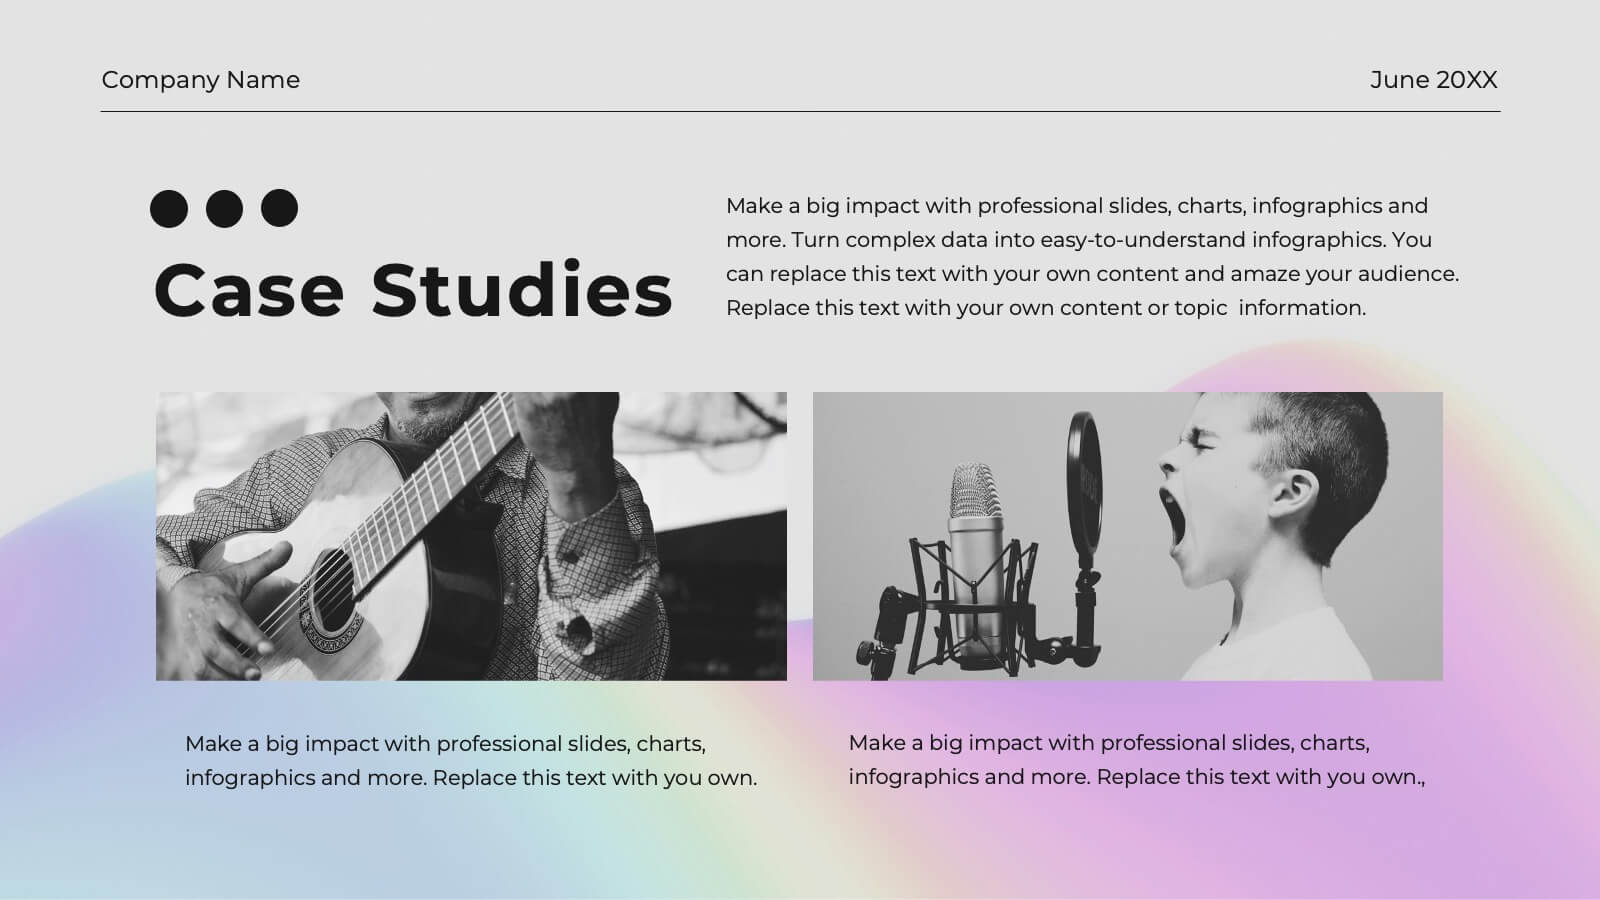
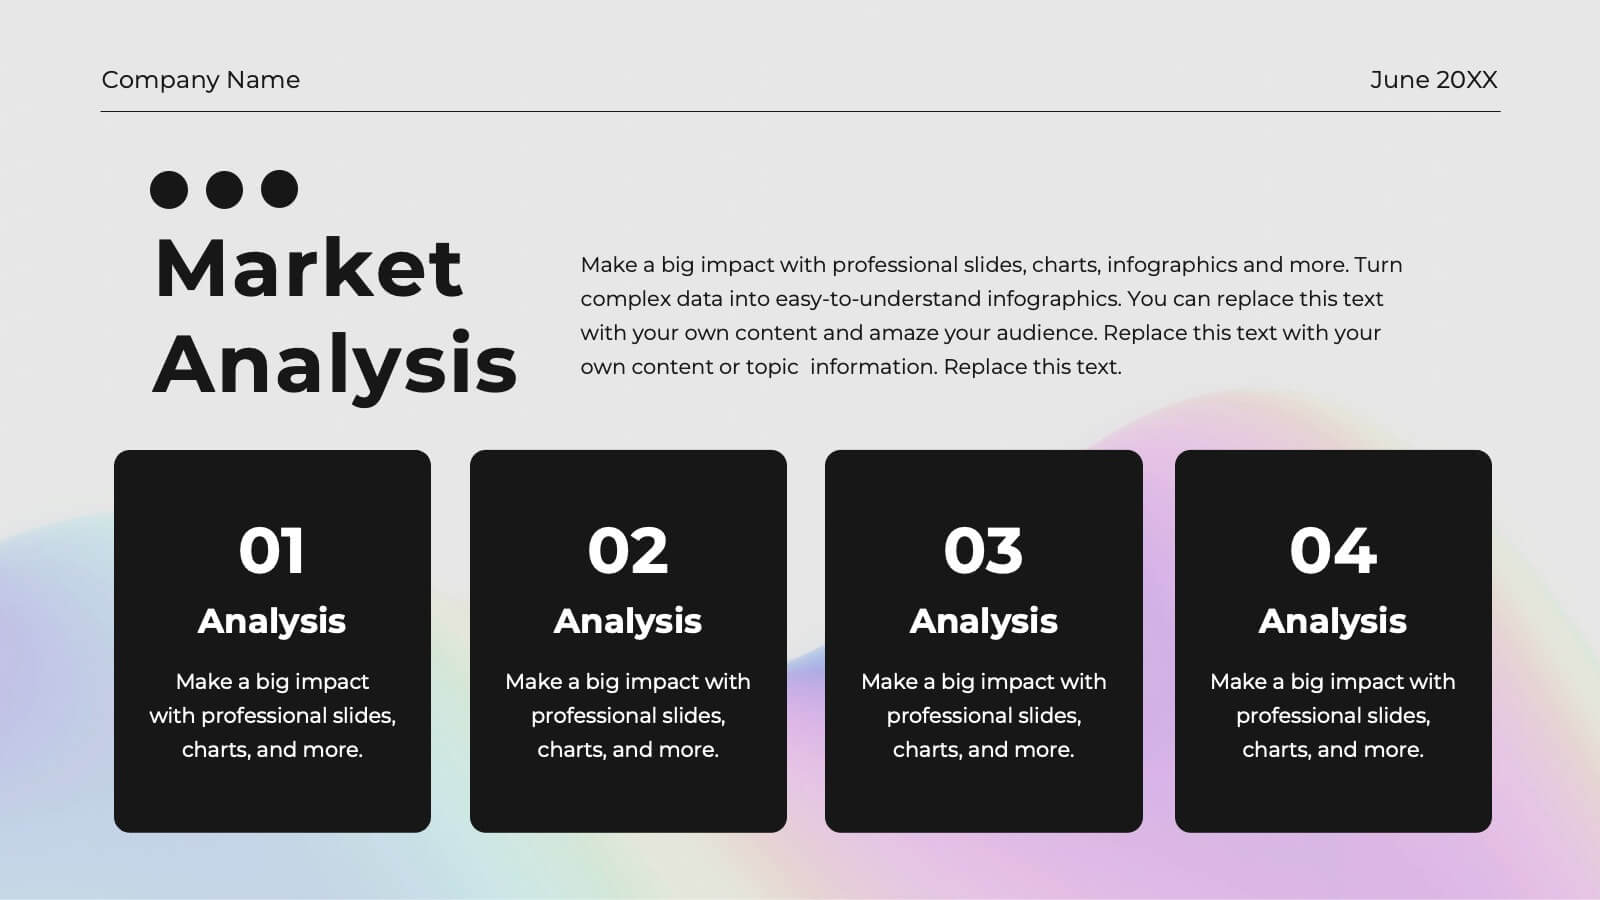
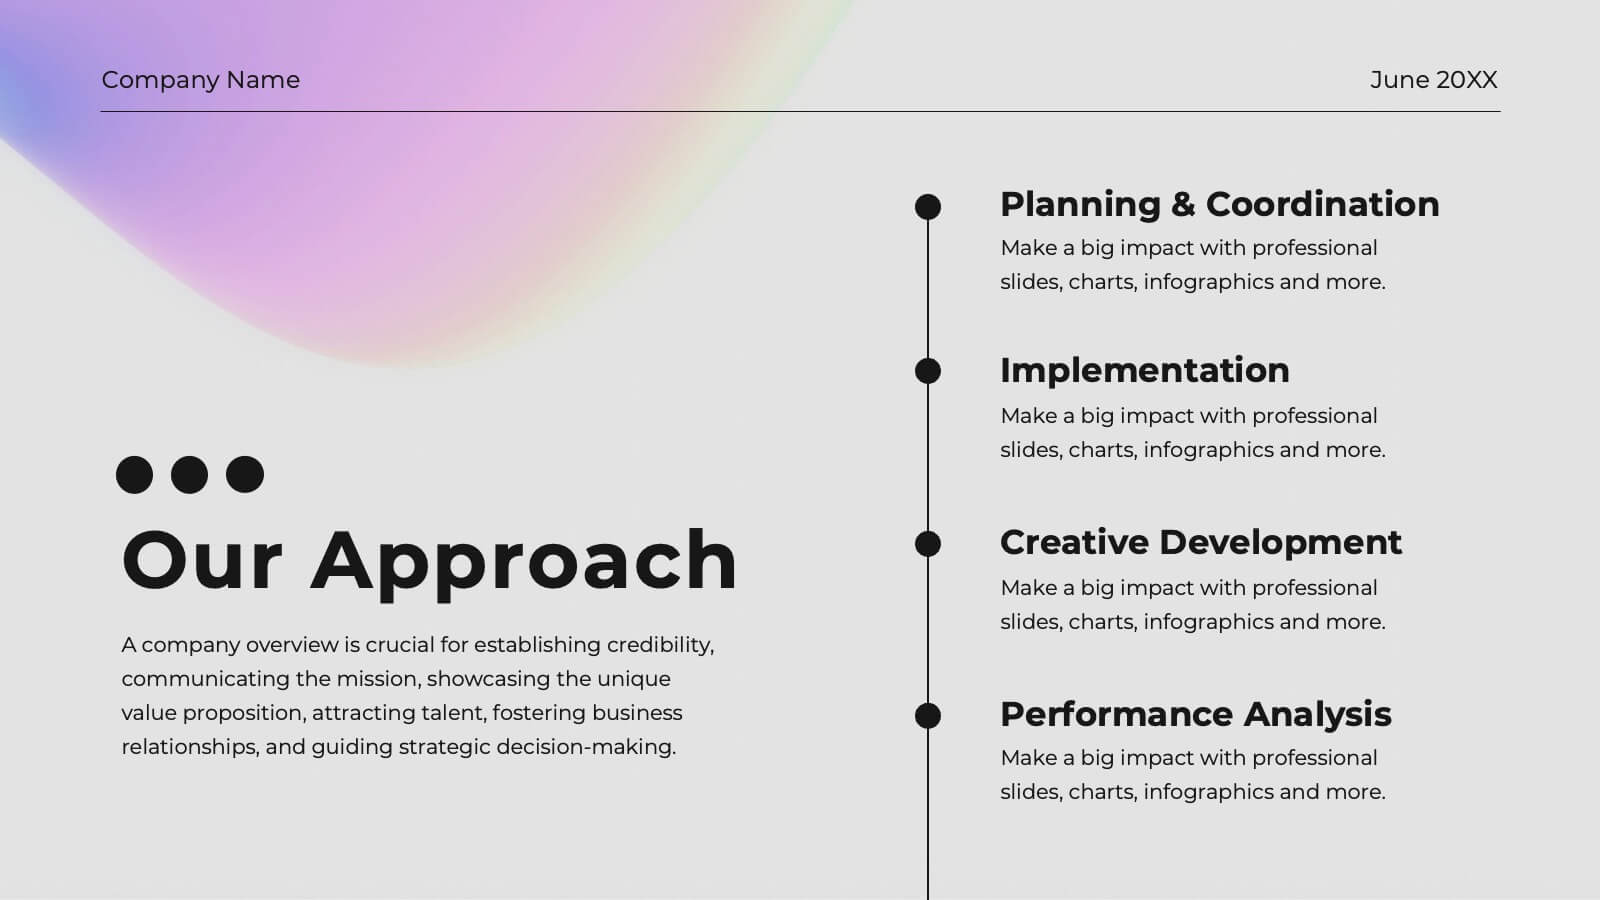
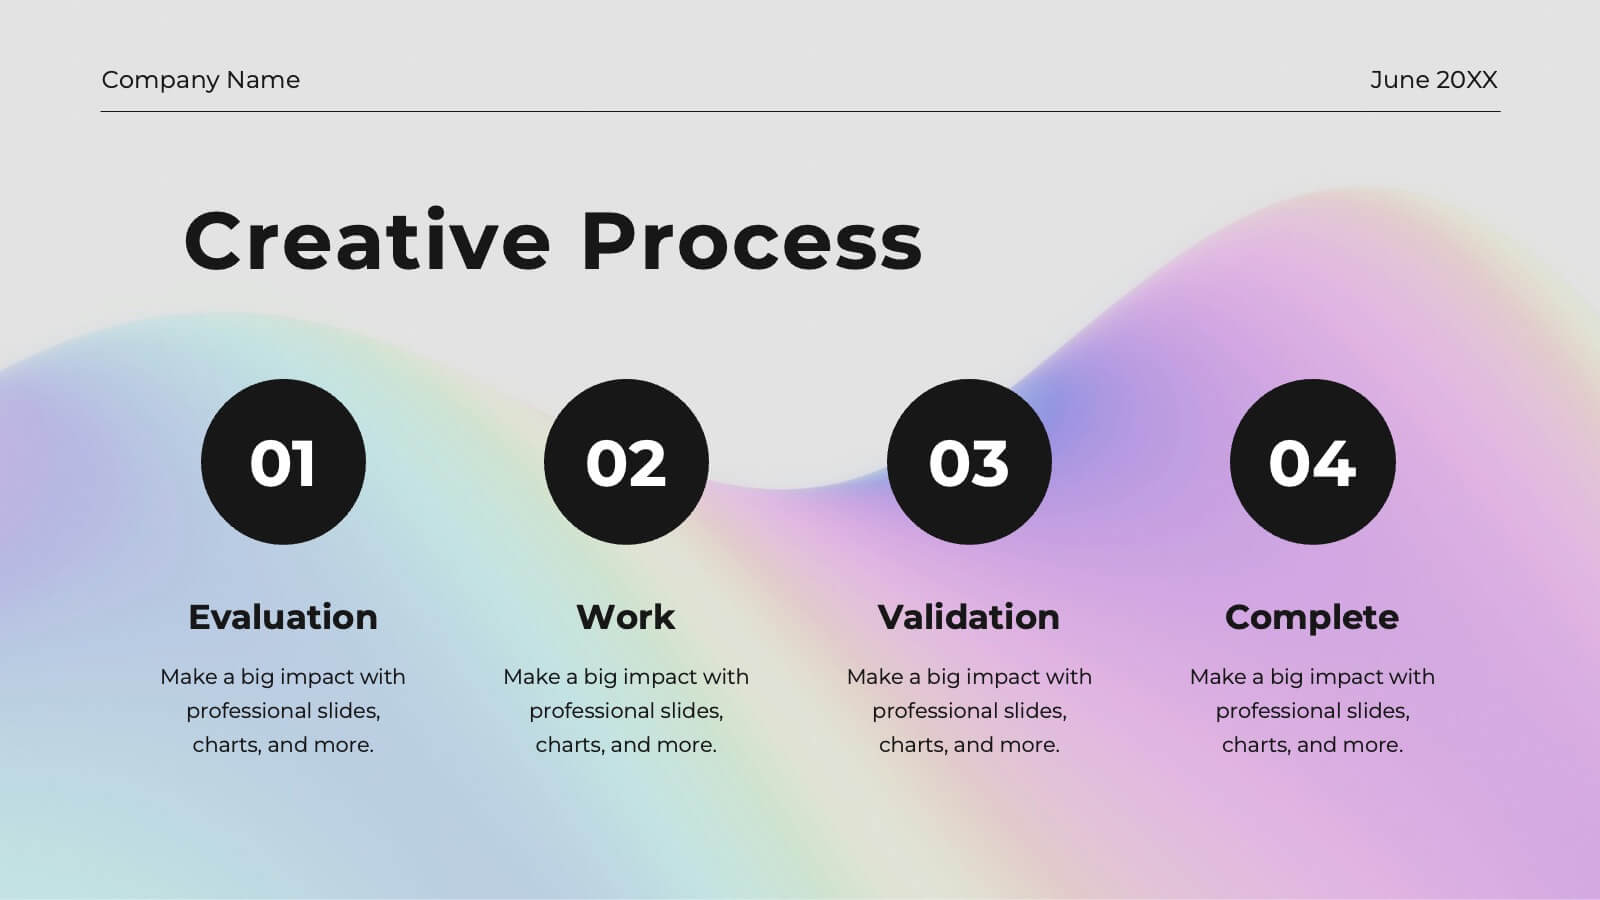
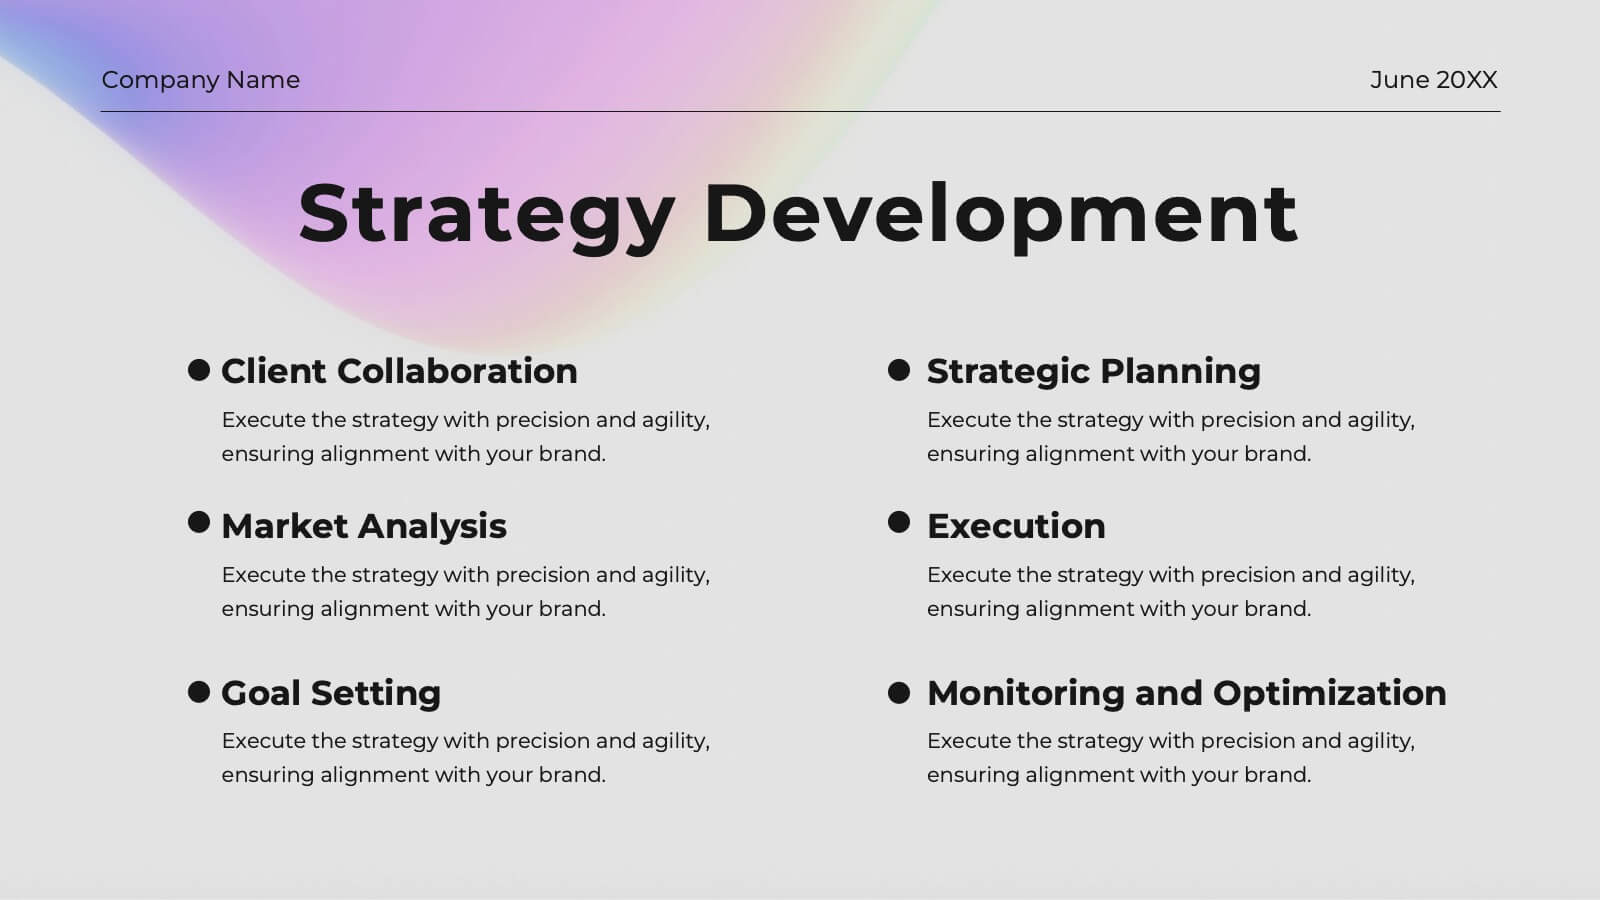
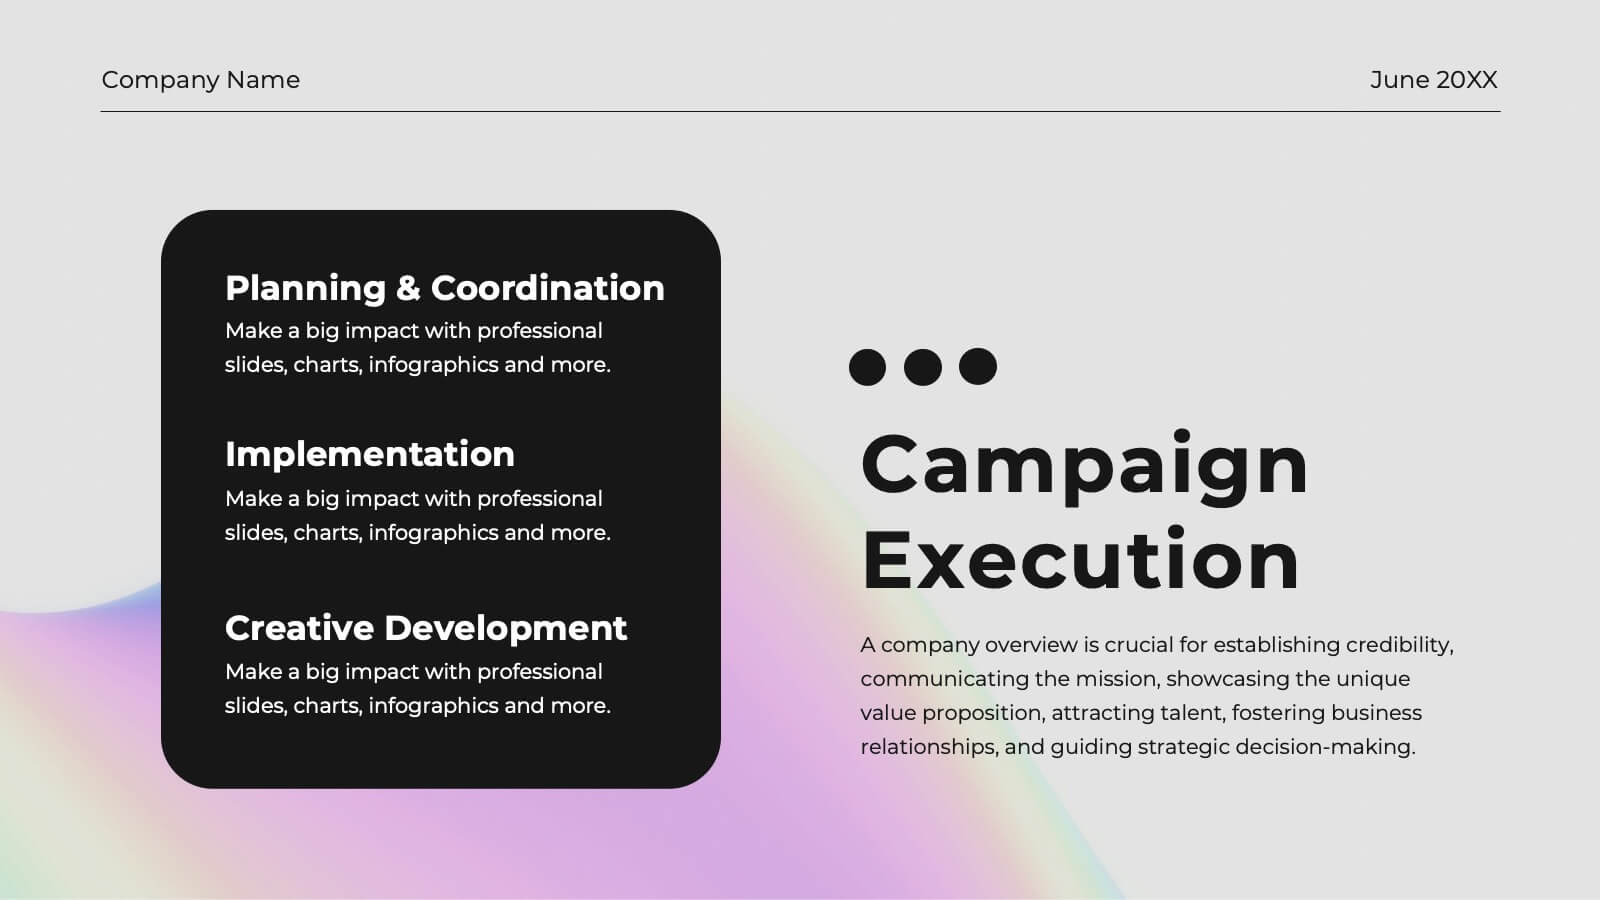
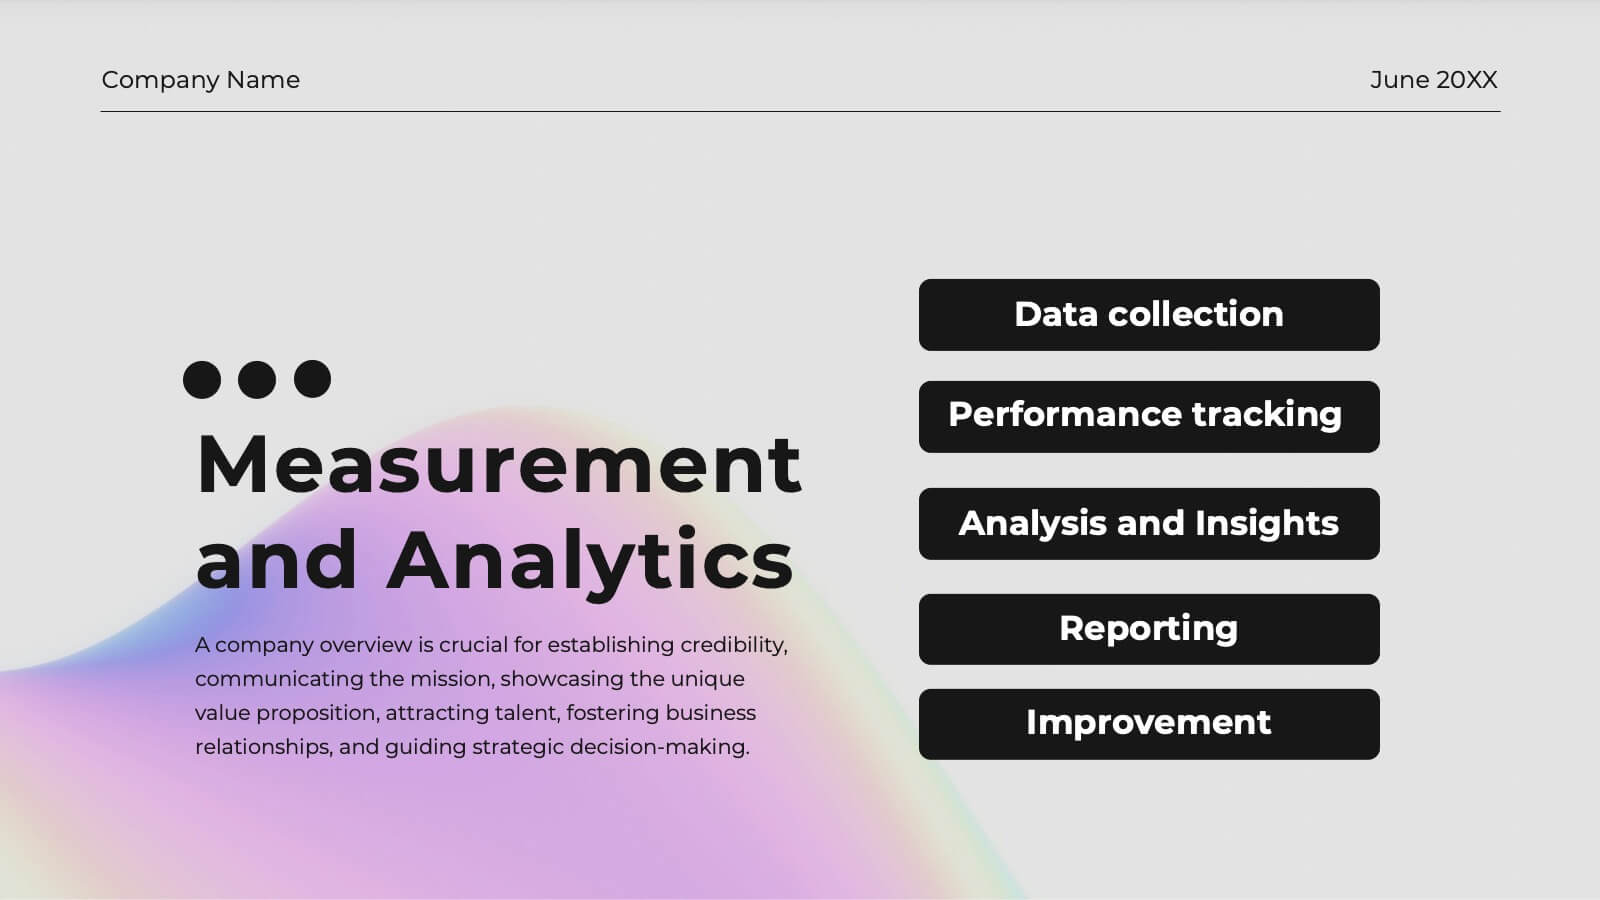
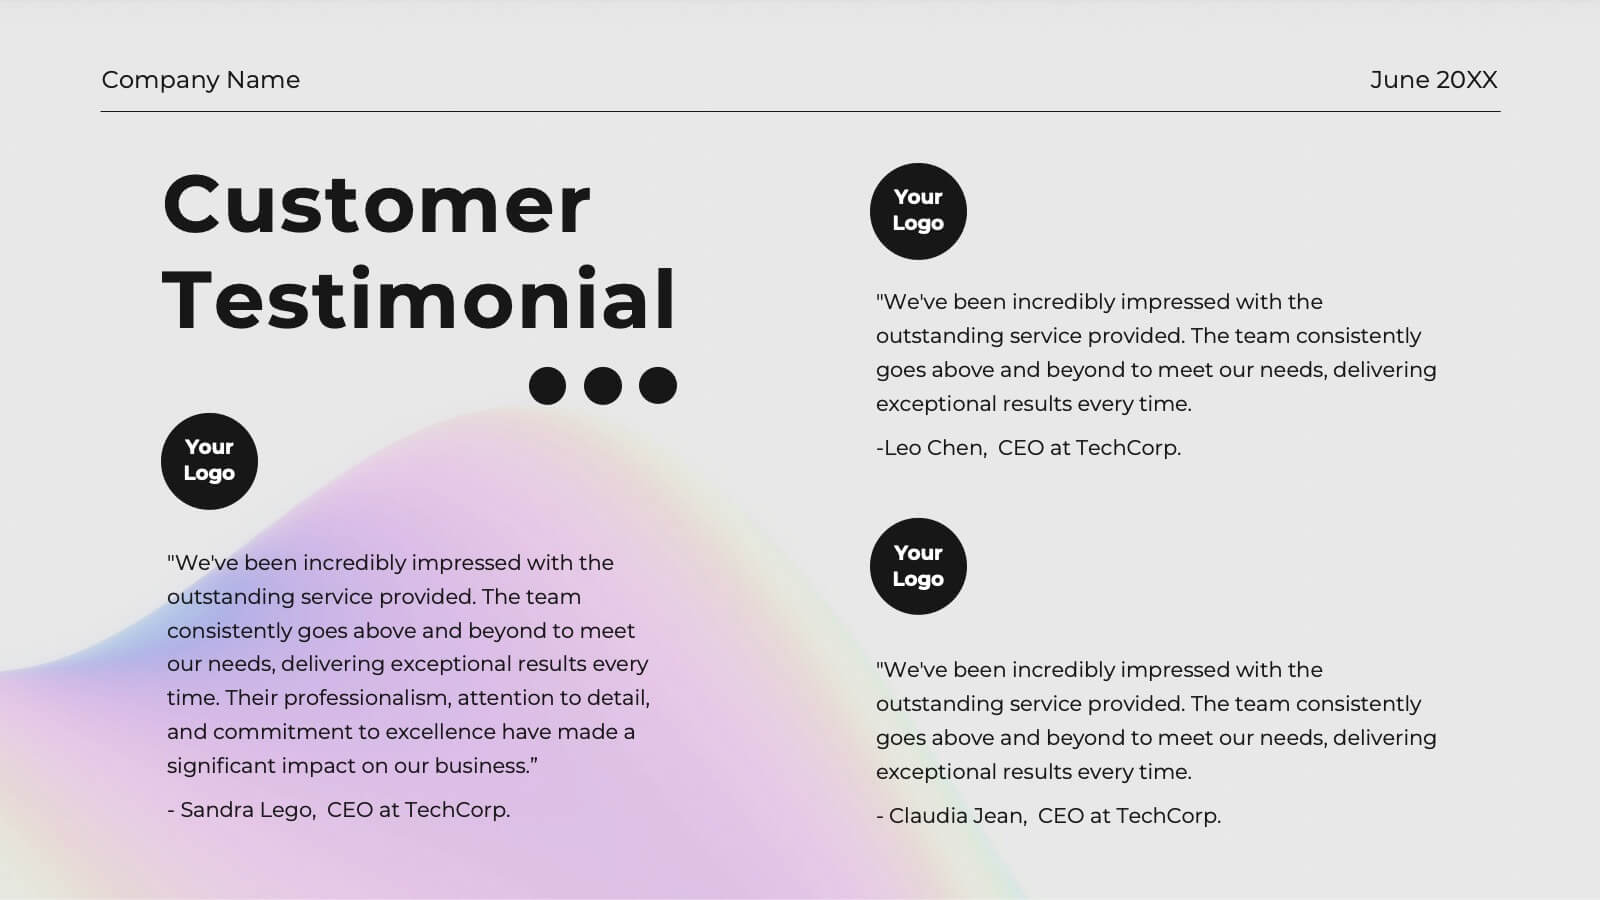
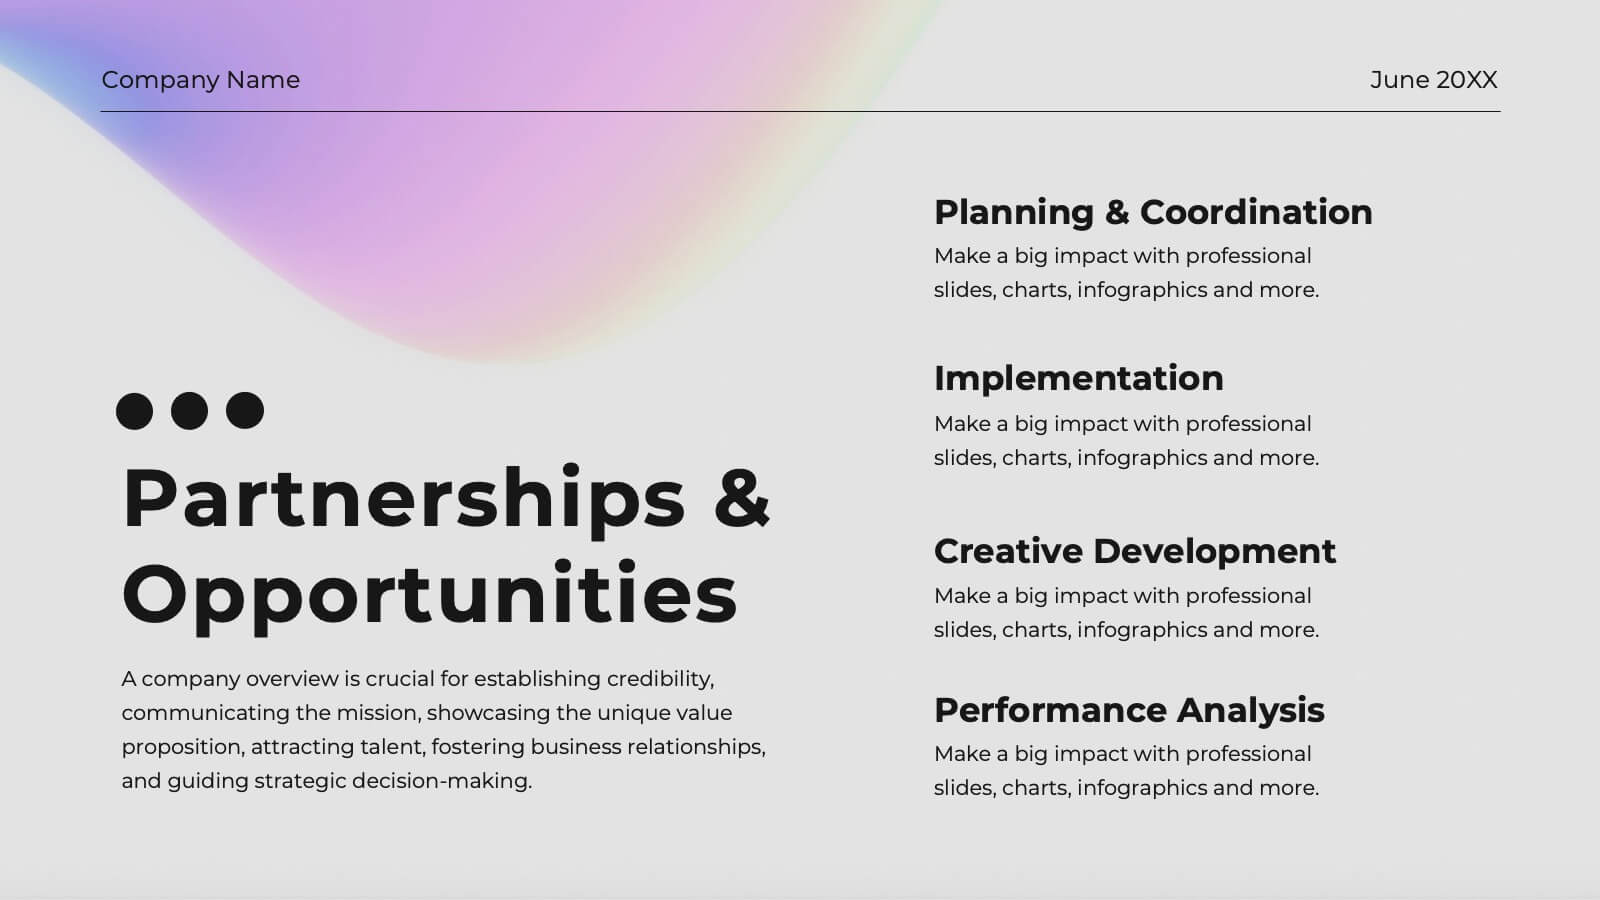
Frost Advertising Agency Proposal Presentation
Dazzle your clients with this radiant agency proposal template! Perfect for presenting your mission, services, and market analysis, it includes slides for case studies, strategy development, and campaign execution. Impress stakeholders with vibrant visuals and detailed content. Compatible with PowerPoint, Keynote, and Google Slides for seamless presentations on any platform.


7 diapositivas
Credit Card Infographic Presentation Template
A Credit card Infographic is a stacked chart showing data visualization of credit card types and associated information, including the number of cards owned by different age groups and gender, as well as overall debt. This infographic allows you to cover the ins and outs of credit cards, from rewards to fees and interest rates. This template will help you understand how credit cards work, while comparing cards based on price and other important factors. This Infographic is the perfect way to visualize data, trends and facts in an engaging way that grabs attention and keeps people reading.


7 diapositivas
Customer Empathy Map Infographic Presentation
An Empathy Map infographic is a visual tool used to help understand the needs, wants, and behaviors of a particular customer. This template is a perfect way to gather and organize information about a person's experience and perspective, in order to better understand their motivations and desires. This empathy map infographic consists of a diagram that is divided into four quadrants: what the user thinks and feels, what they hear, what they see, and what they do. In each quadrant, information is gathered about the user's thoughts, feelings, and actions related to a particular product or service.


5 diapositivas
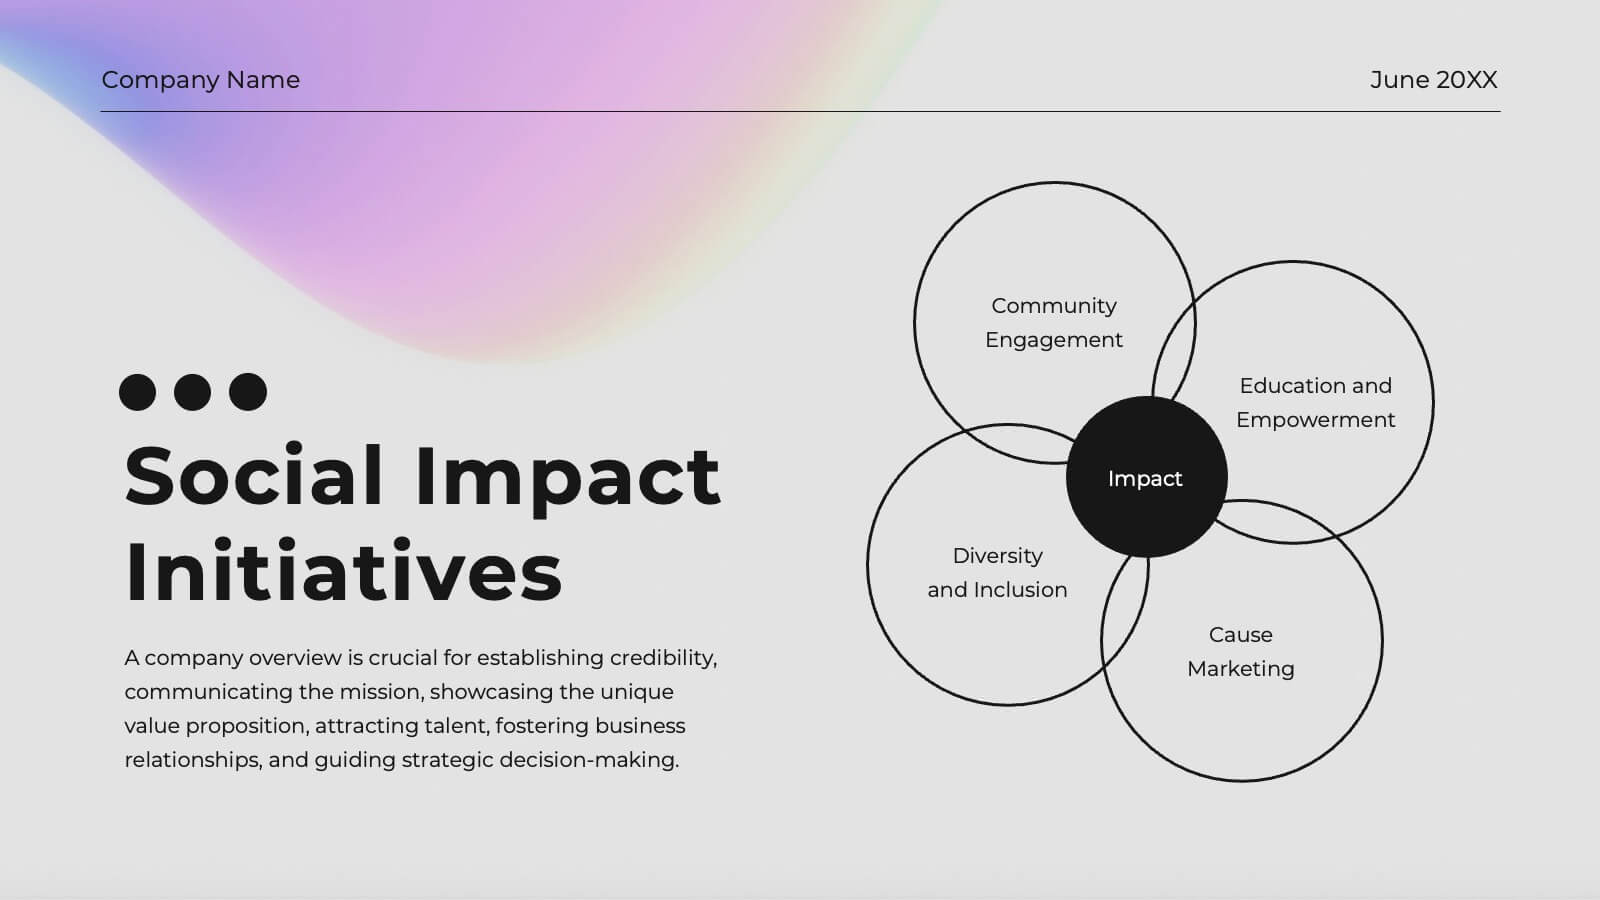
Concept Overlap with Venn Diagram Presentation
Visually map overlapping concepts and relationships with this four-circle Venn diagram slide. Perfect for presenting interdependencies, cross-functional insights, or product comparisons. Each section includes editable labels and icons to personalize your content. Compatible with PowerPoint, Keynote, and Google Slides—ideal for business strategies, brainstorming sessions, and collaborative team presentations.


7 diapositivas
Feedback Management Infographic
Boost your presentation's impact with our Feedback Management infographic, optimized for Powerpoint, Keynote, and Google Slides. This infographic is an essential asset for professionals looking to present feedback data compellingly and concisely. Designed to convey customer satisfaction metrics and responses effectively, it's perfect for market researchers, customer service managers, and business analysts. The Feedback Management infographic is constructed to visually communicate the importance of customer insights and how they drive business improvements. It transforms complex data into an easy-to-understand format, which is crucial for making informed decisions based on customer feedback. The infographic's structured design assists audiences in comprehending the collected feedback at a glance, highlighting key figures and trends. Whether you're reporting on survey results or showcasing customer reviews, this infographic ensures your data is presented clearly. Compatible with leading presentation software, it allows for smooth integration into your slides, ensuring your feedback analysis stands out. Incorporate this infographic into your presentations to effectively display feedback management data and make a lasting impression.


7 diapositivas
Mind Map Project Infographic
A mind map is a visual representation of information, ideas, or concepts arranged around a central topic or theme. This template is a powerful brainstorming and organizational tool that helps individuals or teams visually connect related ideas, explore new connections, and see the bigger picture. This diagram organizes information around a central theme or idea, with branches extending outwards to represent related concepts or tasks. This infographic is perfect for for capturing ideas, and presenting complex information in a structured and easily manner. This template is customizable and compatible with Powerpoint, Keynote, and Google Slides.


7 diapositivas
Buyer Journey Infographic
Embark on a visual adventure with our Buyer Journey Infographic Template, designed to map out the critical stages of the consumer experience with flair and precision. This template captures each phase of the buyer's journey, from initial awareness to the final purchase decision, using a combination of bold graphics and streamlined information. Ideal for marketing professionals and business strategists, this template breaks down complex consumer behavior into clear, actionable insights. Utilize this engaging tool to showcase how customers interact with your brand at every touchpoint, highlighting opportunities for engagement and conversion enhancement. Fully customizable, this template allows you to adjust the visuals and text to align with your company’s branding and the specific nuances of your customer base. It’s an essential tool for presentations, training, and marketing materials, providing a foundation for strategies that resonate deeply with audiences and drive successful outcomes.