


Características


¿Tienes alguna pregunta?
Recomendar


7 diapositivas
Investment Bank Infographic Presentation
An investment infographic helps investors understand complex investment concepts by presenting information in a clear and concise manner. This is a professional Investment template with all the elements you need to make a great impact. Use this presentation to help you explain a new investment opportunity, or show the benefits of your product or service. Designed for use in PowerPoint, Keynote and Google Slides, it is easy to customize and fully editable, making it a perfect starting point for any investor or financial pitch. You can change the texts, image and shapes as you wish!


7 diapositivas
Agile Project Management Approach Presentation
Illustrate iterative planning and delivery cycles with this Agile Project Management Approach Presentation. The dynamic circular graphic paired with a horizontal flow arrow highlights six core steps in agile workflows. Ideal for scrum teams, product owners, or project leads, each phase is clearly labeled with editable titles and content placeholders. Fully customizable and compatible with PowerPoint, Keynote, and Google Slides.


7 diapositivas
Risk Management Processes Infographic
A Risk Management infographic is a visual representation of the process of identifying, assessing, and mitigating risks in a particular context or organization. This template can be used to convey important information about potential risks and how they can be managed to minimize negative consequences and maximize positive outcomes. You can use this infographic for various purposes, such as to inform stakeholders, to guide decision-making, or to promote risk awareness and best practices. Compatible with Powerpoint, Keynote and Google Slides, this can be designed in different styles and formats.


6 diapositivas
Mental Health Infographics
The "Mental Health" infographic template, suitable for PowerPoint, Keynote, and Google Slides, is an essential resource for healthcare professionals, educators, and mental health advocates. This sensitive and informative template is designed to communicate important aspects of mental health in a compassionate and accessible manner. This template covers critical topics such as mental health awareness, coping strategies, and support resources. It is structured to facilitate discussions on mental well-being, making it an invaluable tool for educational presentations, awareness campaigns, and support group discussions. Featuring a calming and empathetic design, the template uses a soothing color scheme with pastel shades of light blue, green, and lavender. This creates a serene and understanding atmosphere that is supportive of mental health topics. Whether used in a clinical setting, classroom, or community workshop, this template ensures that information about mental health is presented in a sensitive, informative, and visually appealing way.


6 diapositivas
Modern Science Report Presentation
Bring your findings to life with a clean, dynamic layout designed to make scientific insights easy to follow. This presentation highlights key data, research points, and lab observations in a structured, visually engaging format that supports clarity and accuracy. Fully compatible with PowerPoint, Keynote, and Google Slides.


7 diapositivas
Business Model Canvas Segments Infographic Presentation
The Business Model Canvas is a strategic management and entrepreneurial tool that helps businesses to visualize, analyze, and develop their business models. This template gives you the ability to create a visually attractive infographic while presenting your business model in a professional format. This eye-catching template is made to help your audience visualize the business model you are presenting and easily follow it with the instructive text slides. Customize this template in just a couple of minutes. Simple and easy to use, ready to be edited with colors and graphics of your choice.


11 diapositivas
Company Team Meeting Presentation
Bring your team together with our dynamic Company Team Meeting presentation template. Designed for clarity and engagement, this template sets the stage for productive discussions, from weekly roundups to strategic planning sessions. It begins with a vibrant cover slide that sets an upbeat tone for the meeting, followed by a clear agenda to keep your discussion on track. With slides tailored for talking points, updates, upcoming events, and deadlines, it helps you streamline the flow of information. The template includes sections for announcements and feedback, encouraging open dialogue. Ground rules are laid out to foster a respectful and collaborative environment, while the progress and challenges slides are perfect for a transparent review of the company's status and addressing any hurdles head-on with practical solutions. This template, adaptable to PowerPoint, Keynote, and Google Slides, not only captures attention with its colorful design but also reinforces team cohesion and focus on common goals. Use it to energize your team meetings and ensure everyone leaves aligned and motivated.


6 diapositivas
WFH Tools and Productivity Tips
Level up your work-from-home game with this modern visual wheel that breaks down essential tools and actionable tips to boost productivity. Perfect for remote teams, solo entrepreneurs, or virtual training sessions, this layout keeps key info easy to digest and visually engaging. Fully compatible with PowerPoint, Keynote, and Google Slides.


4 diapositivas
4-Quadrant SWOT Matrix Presentation
Spark strategic clarity with a bold, visual layout designed to organize strengths, weaknesses, opportunities, and threats in a clean, engaging way. This presentation helps teams analyze key factors, compare insights, and plan smarter with structured guidance. Ideal for business strategy and decision-making. Fully compatible with PowerPoint, Keynote, and Google Slides.


6 diapositivas
North America Market Map Infographic
North America is the third largest continent in the world and home to over 50 countries, with a population of over 400 million. This infographic template is designed to show you where each country is located within North America, as well as its population, annual GDP per capita, and other important data points that make it unique. This template is the perfect tool for navigating the international market. This infographic map allows you to get a bird's eye view of how your business is performing across the region, and what areas need more attention. Fully customizable and compatible with Powerpoint, Keynote, and Google Slides.


6 diapositivas
Identifying Market Challenges Presentation
Stay ahead of the competition by breaking down market challenges with this dynamic presentation template! Designed for business strategists, marketers, and analysts, this layout helps you visually structure key obstacles and opportunities. Perfect for market research and competitive analysis. Fully customizable and compatible with PowerPoint, Keynote, and Google Slides.


7 diapositivas
SEO Optimization Infographic Presentation
Search engine optimization (SEO) is the practice of optimizing websites and digital content to rank higher in search engine result pages. Use this template to lay out the basics of optimization, including best practices and examples, as well as a checklist for everything you need to know. This template is perfect to show your audience a step by step process of SEO. It includes a great space to enter data, knowledge and helpful tips with a simple design and bright colors. This can be used in an article, presentation or even a blog post to give your audience all the information needed about SEO.


5 diapositivas
Editable RACI Chart Presentation
Streamline your team’s responsibilities with this clean and easy-to-use RACI chart template! Perfect for project managers, this presentation helps define who is Responsible, Accountable, Consulted, and Informed for each task. Simplify workflows, boost collaboration, and keep everyone aligned. Fully editable and compatible with PowerPoint, Keynote, and Google Slides for seamless customization.


6 diapositivas
Problem Analysis Infographic
These slides provide a structured and aesthetically pleasing approach for detailing problem analysis within a project or organizational context. Each slide incorporates various design elements that guide the viewer through the steps or layers of the problem, allowing for a comprehensive understanding and discussion. The use of soft color palettes and clear text placement ensures that the information is easily digestible. The diverse layouts cater to different aspects of problem analysis, from bullet points to diagrammatic representations, making these templates versatile for various presentation needs. These are ideal for presenting complex information in a straightforward manner to ensure clear communication of issues and strategies within team meetings or presentations to stakeholders. The flexibility of the design also allows for easy customization to suit specific project requirements or branding needs.


23 diapositivas
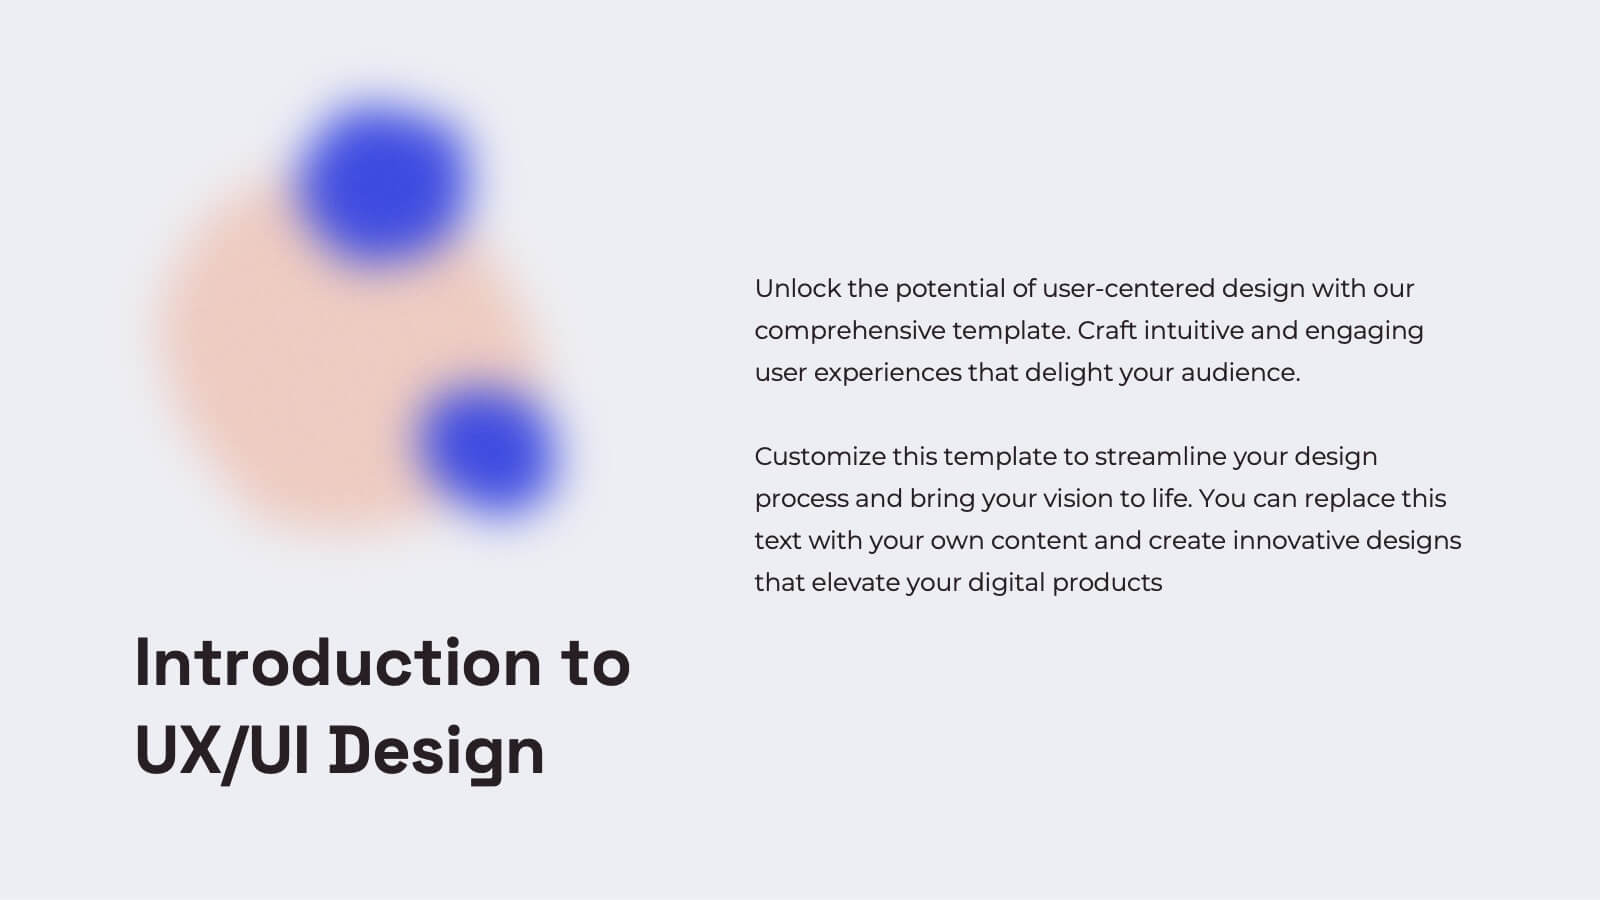
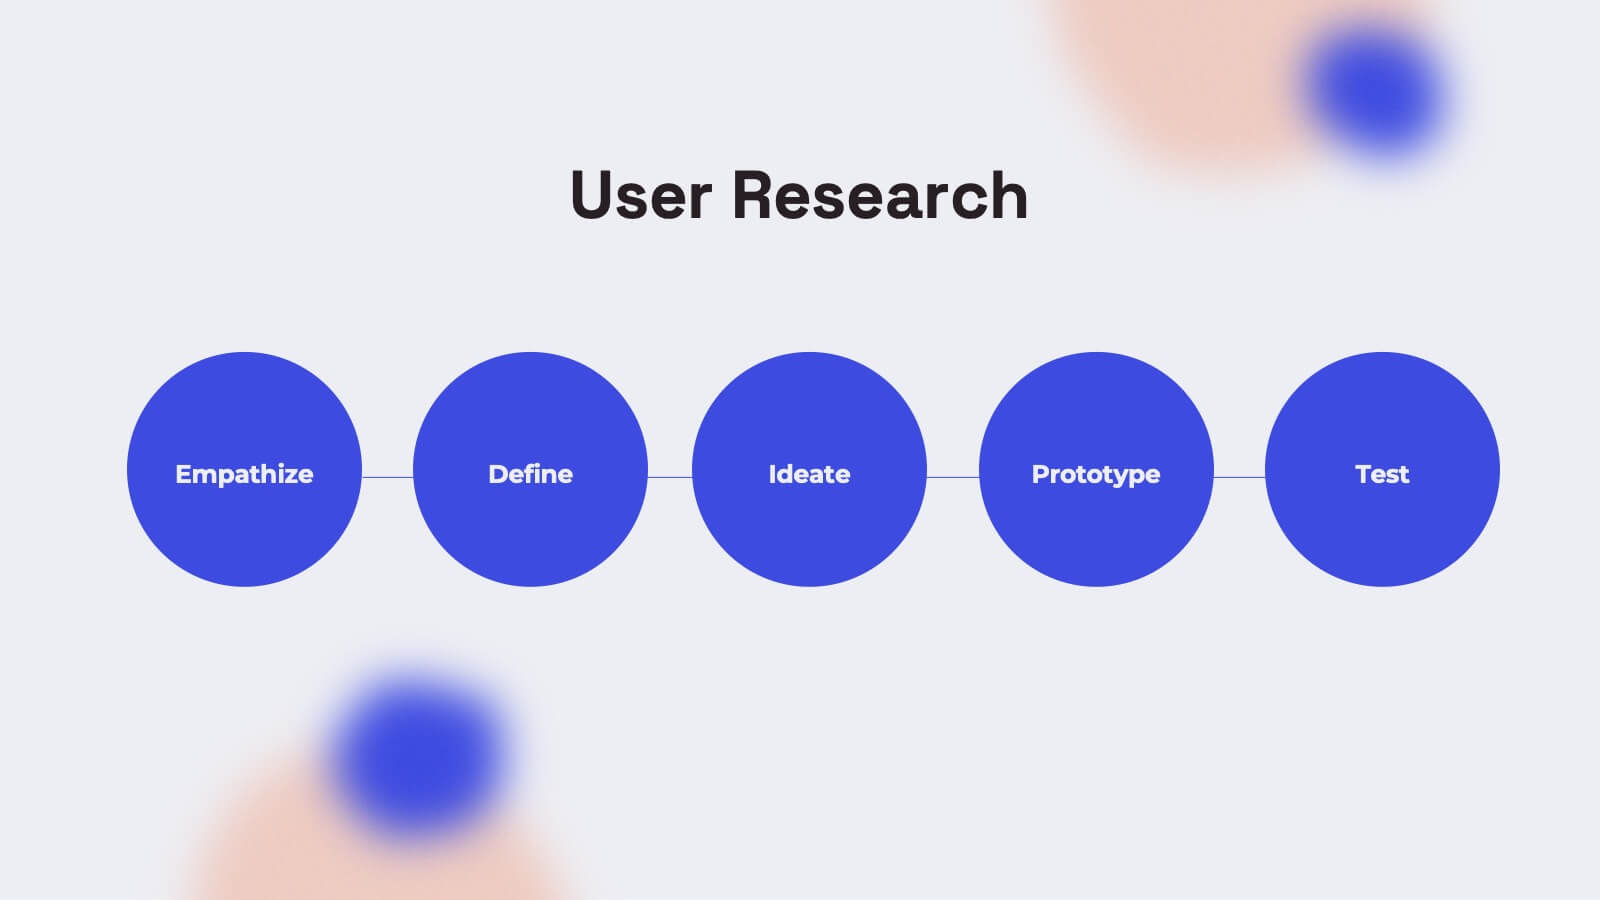
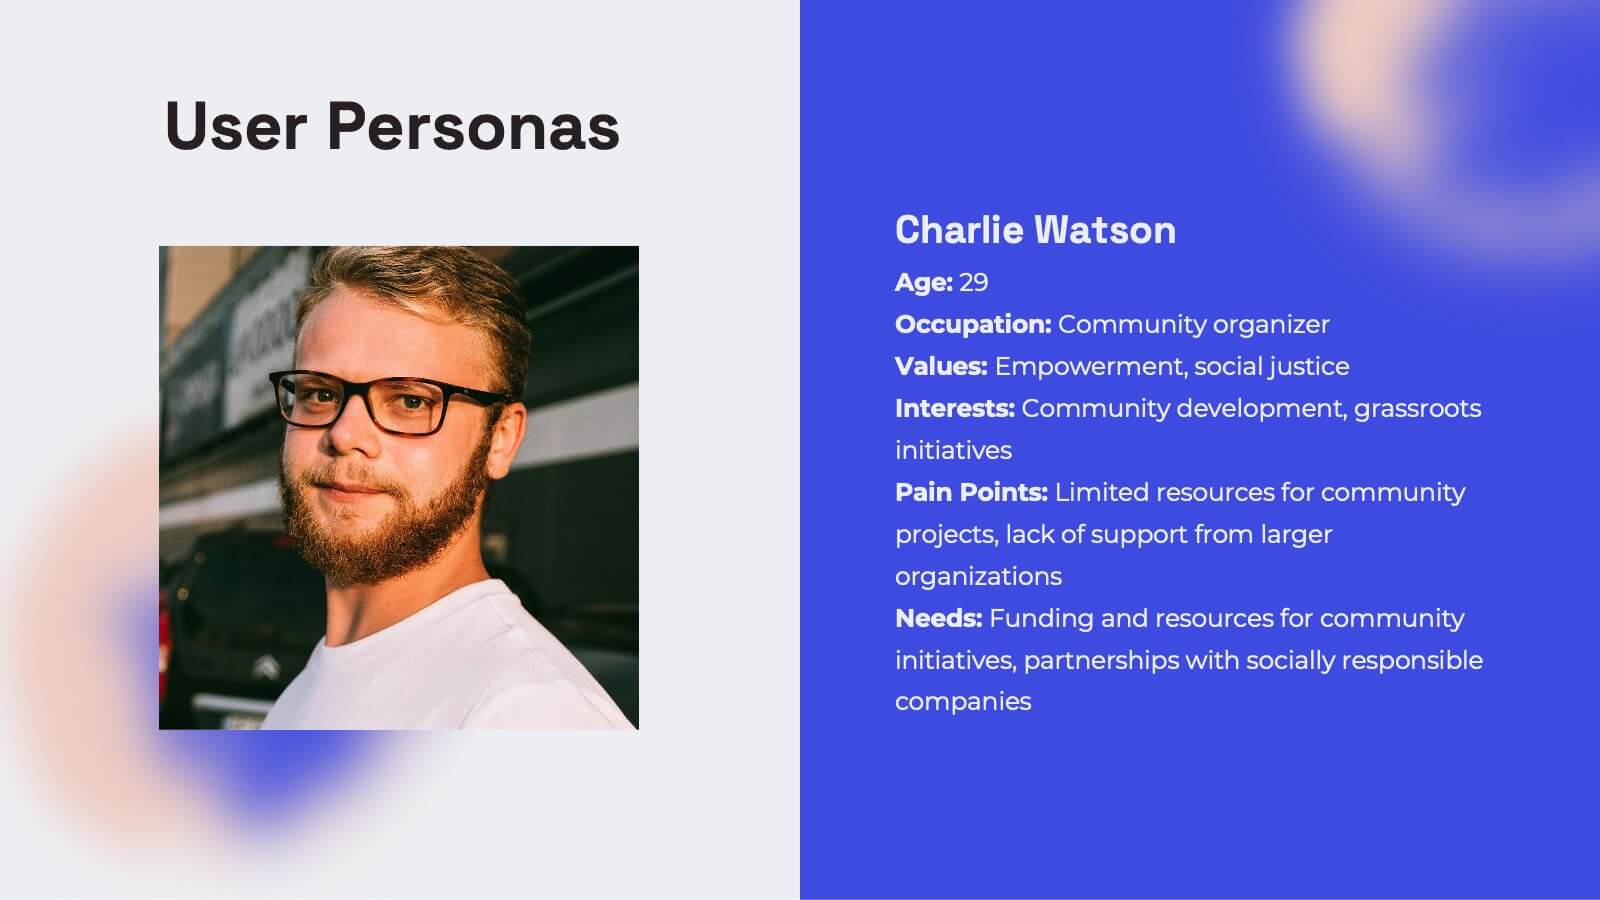
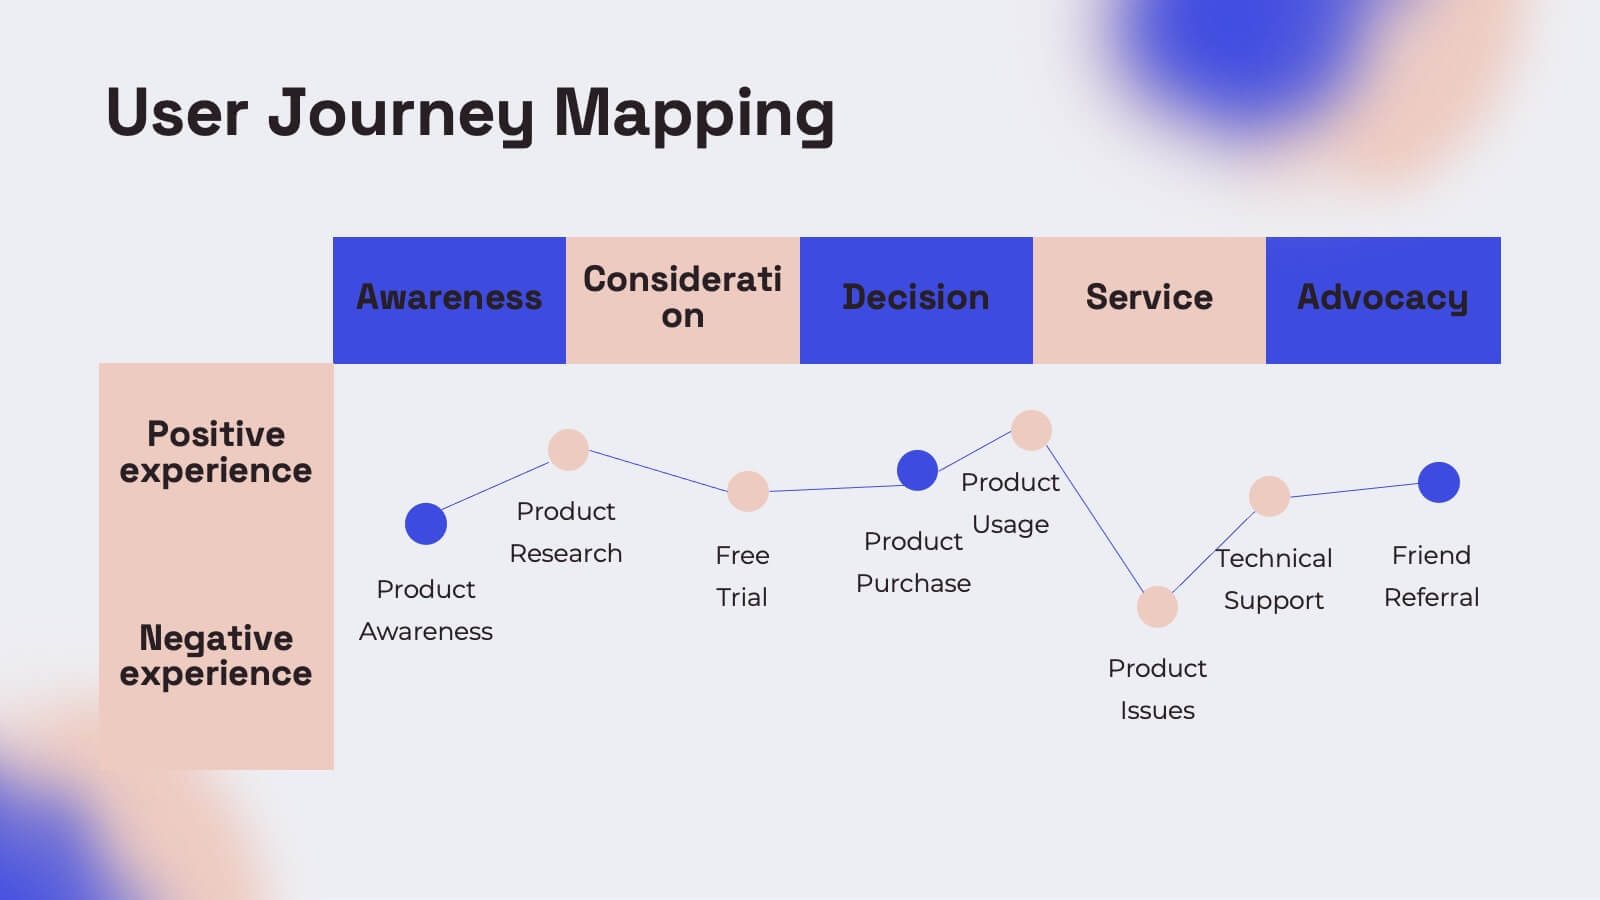
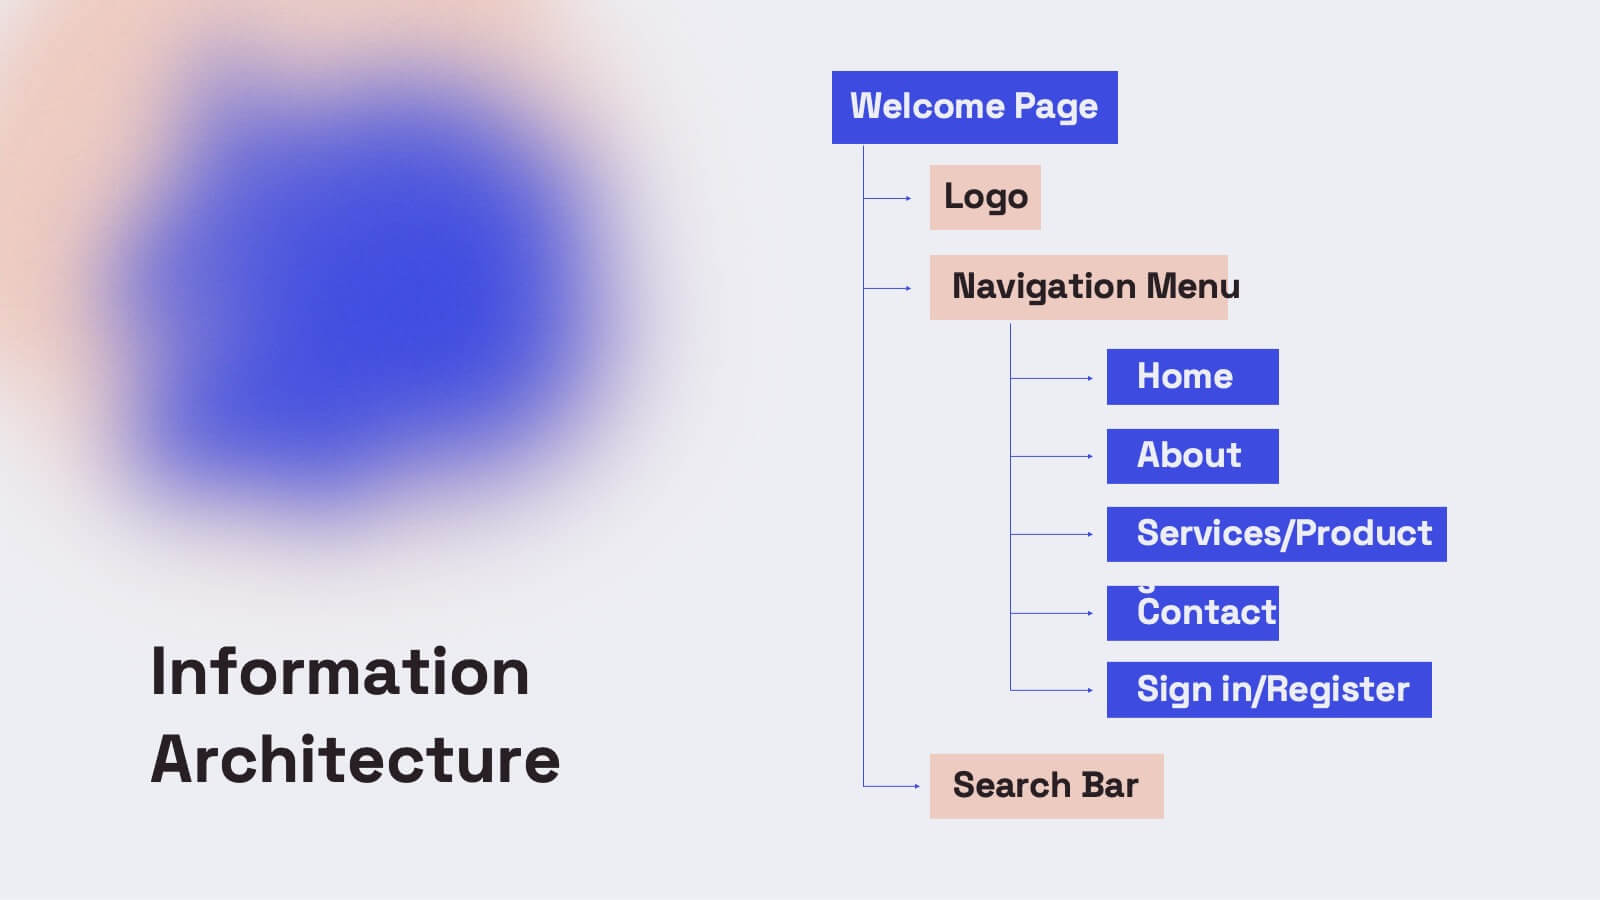
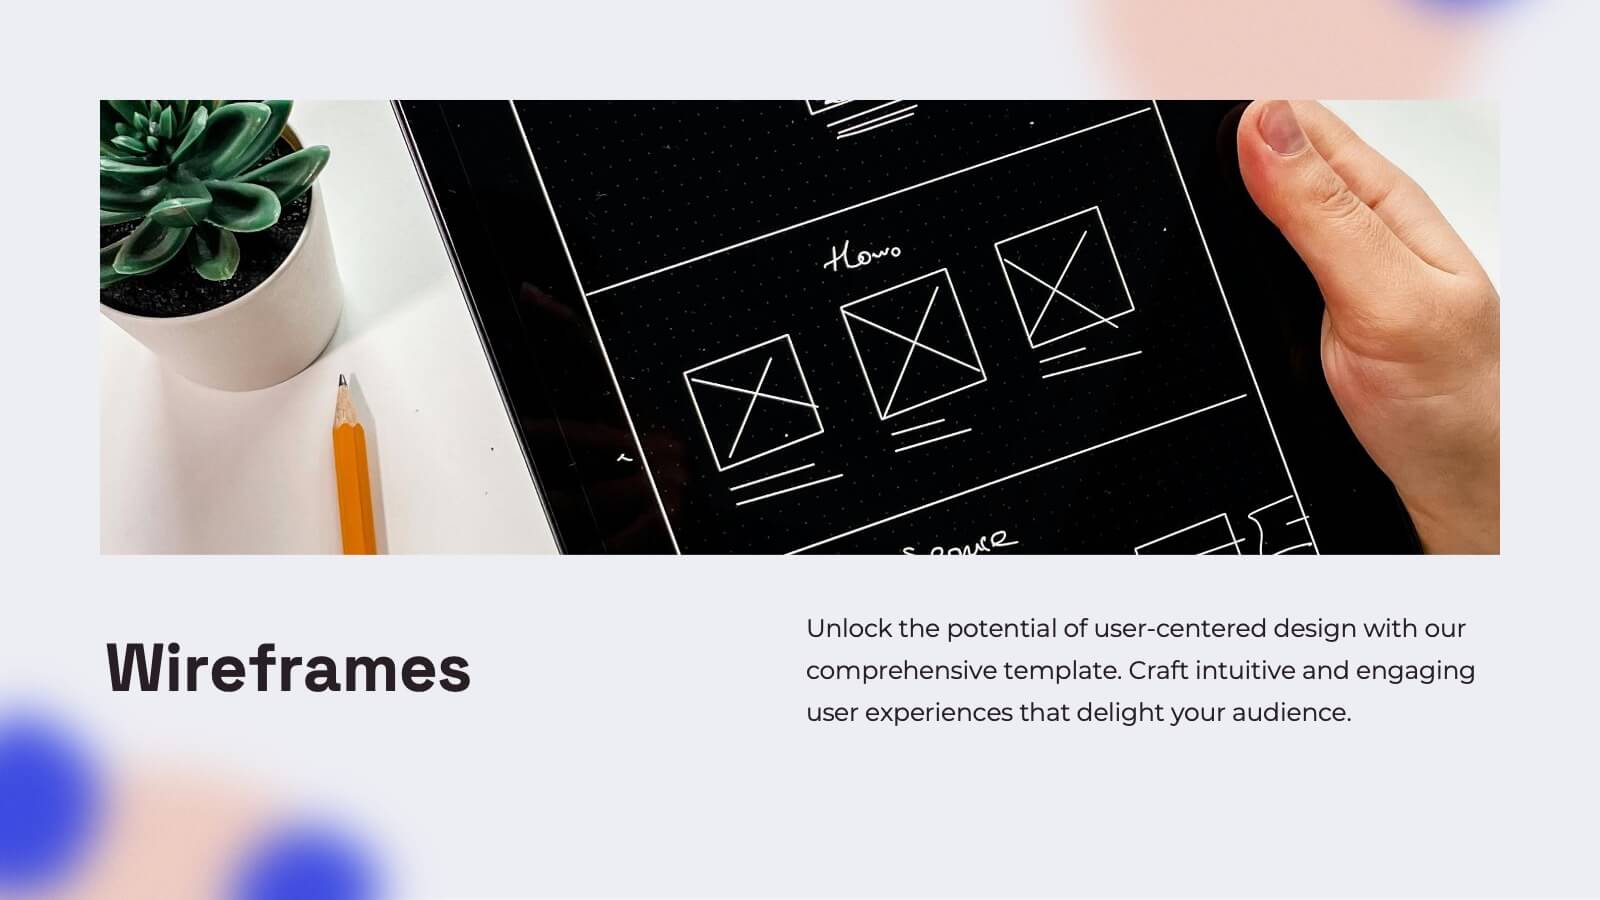
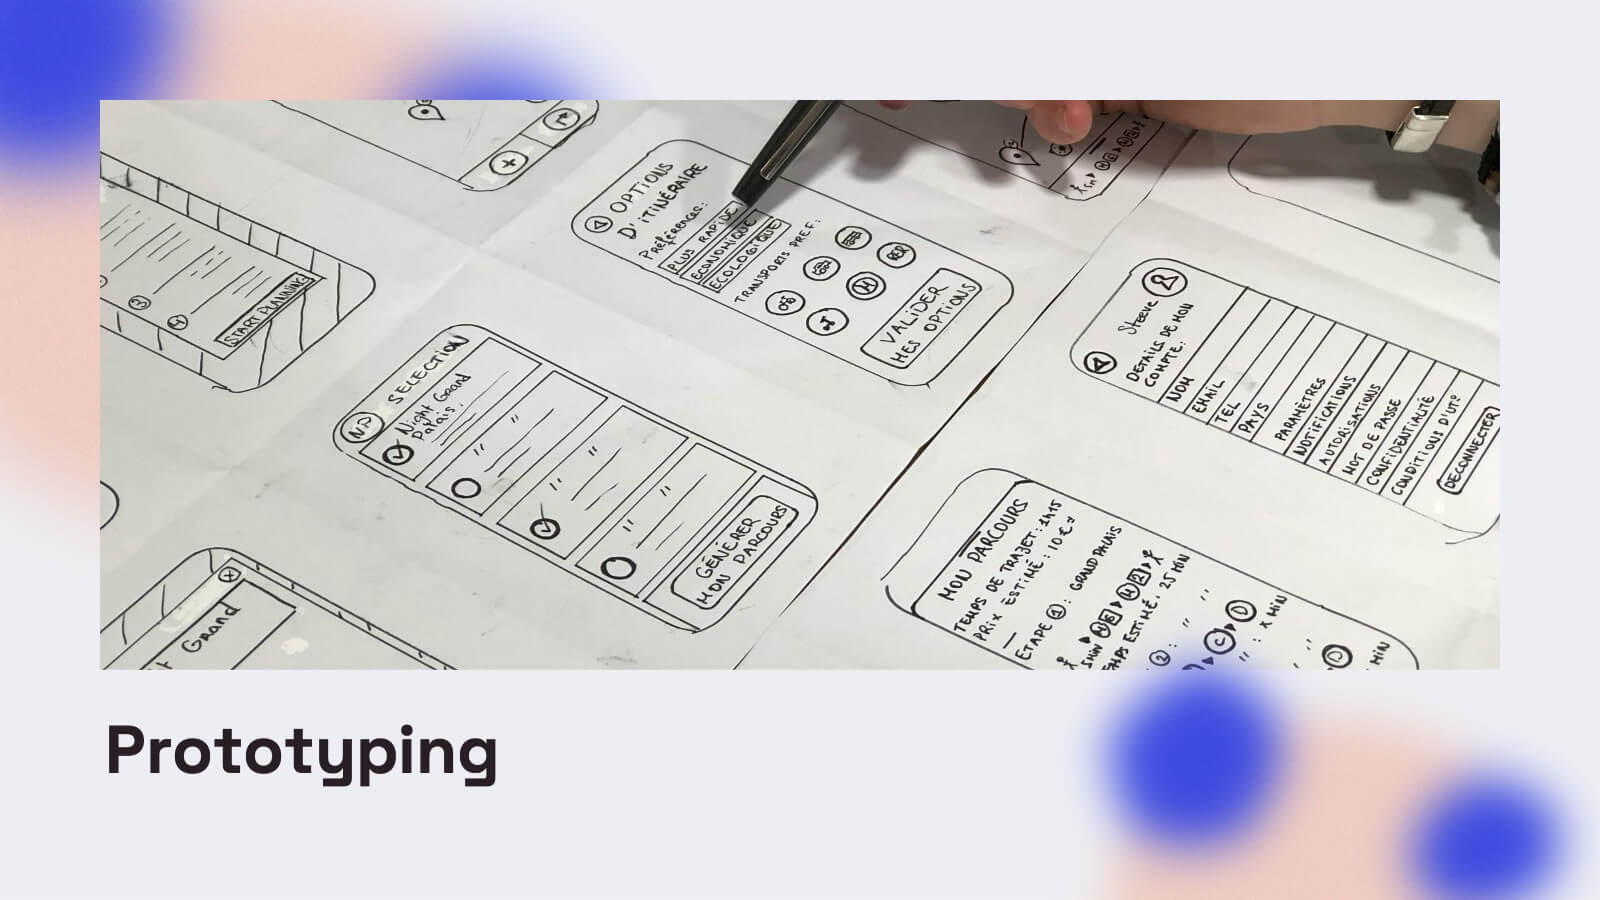
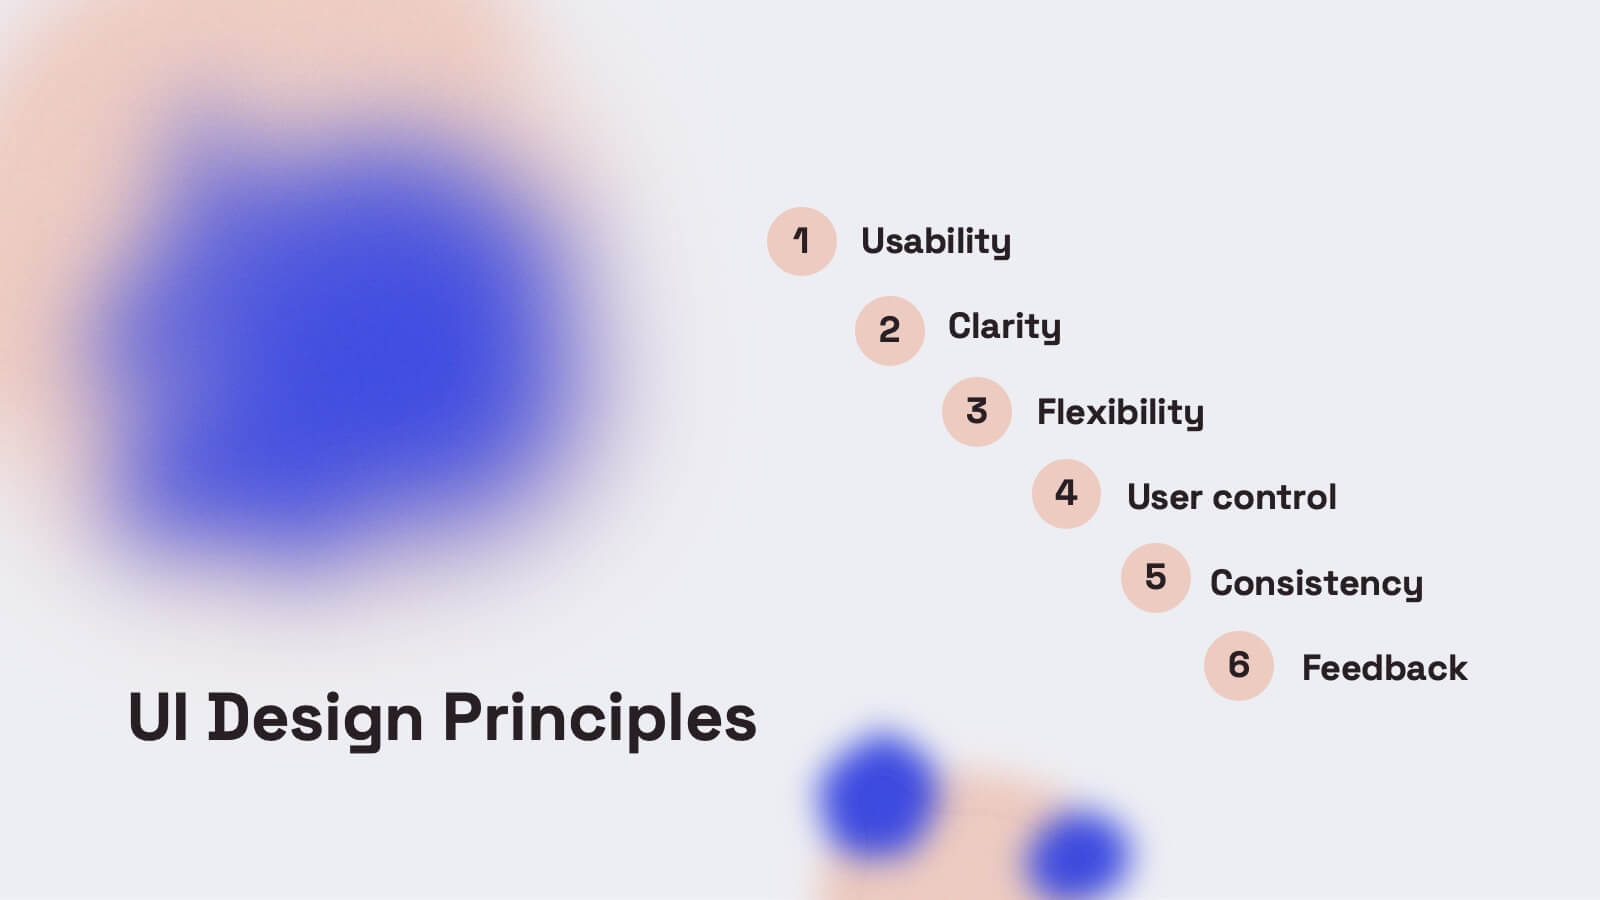
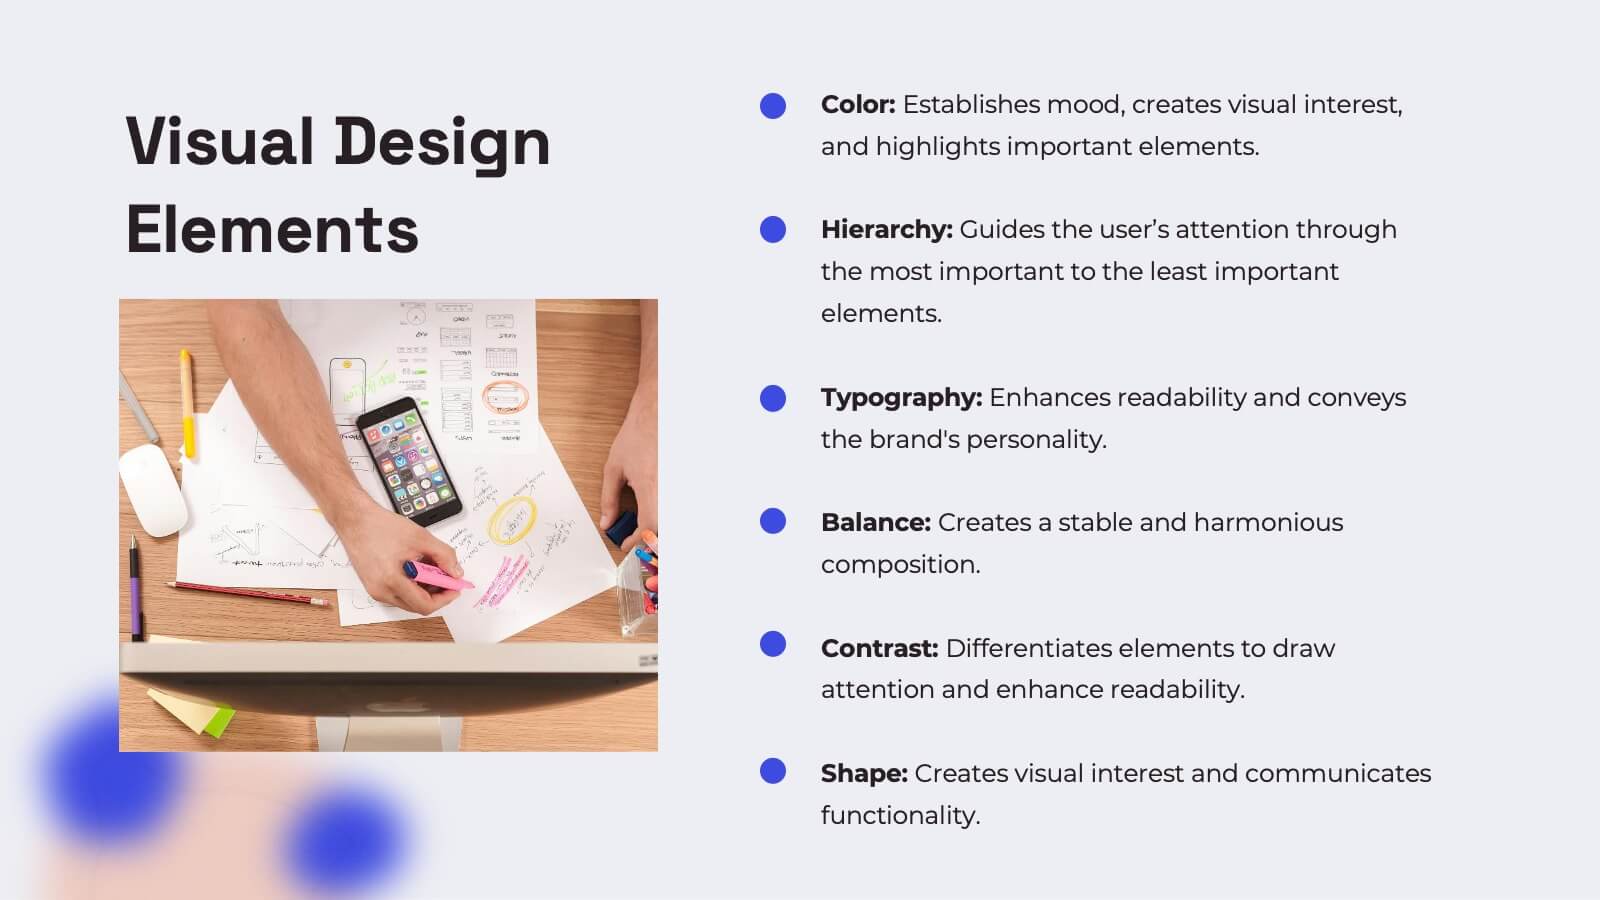
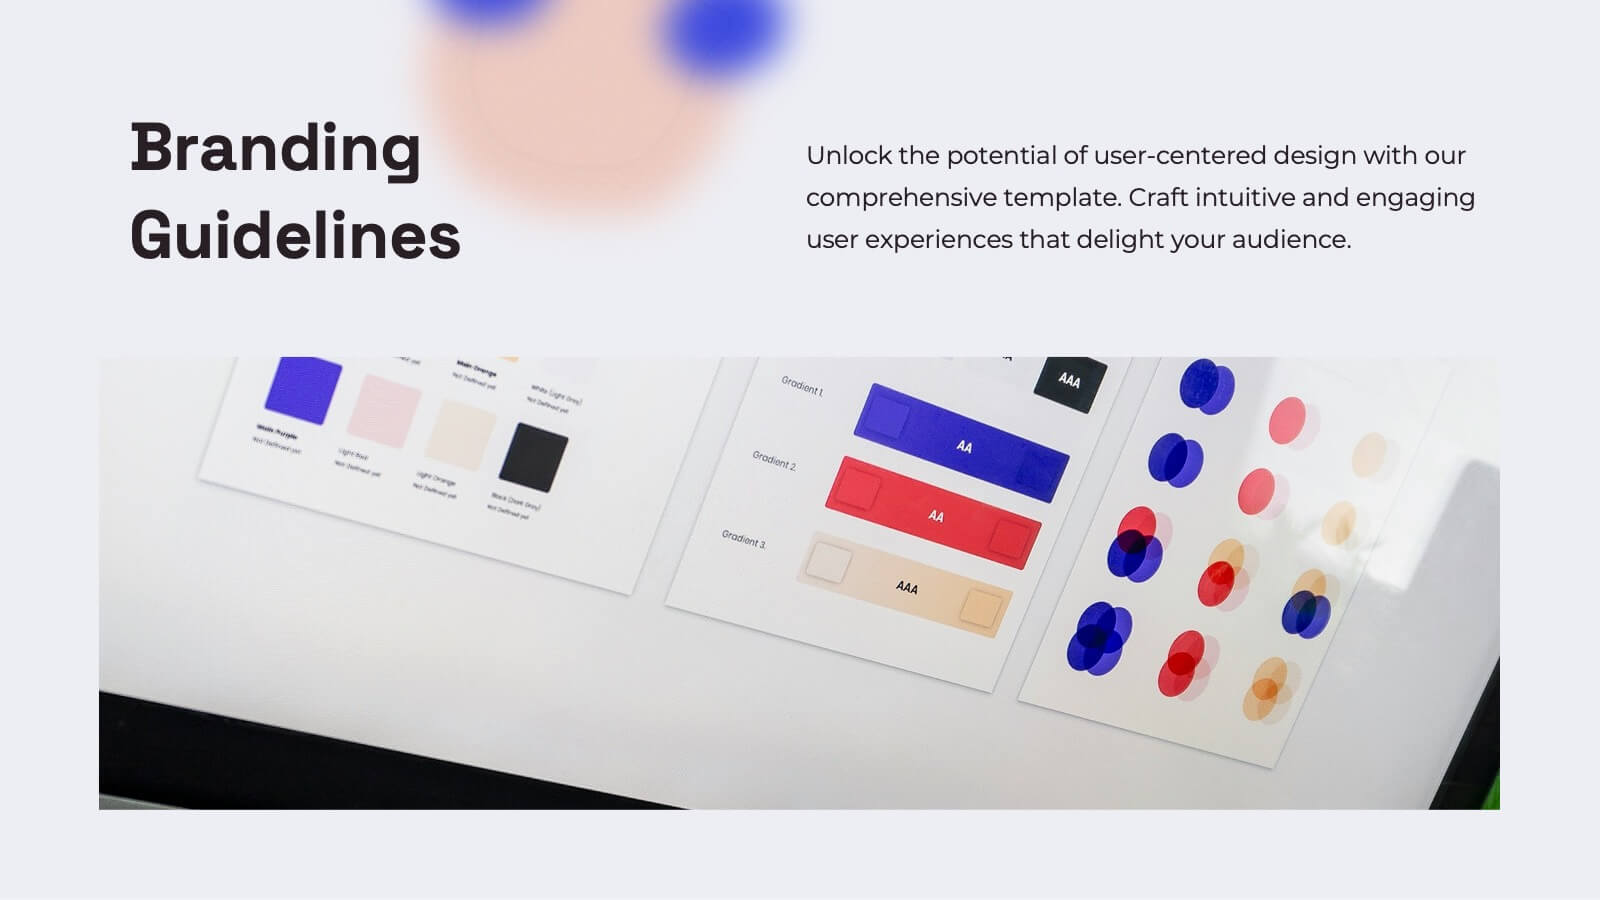
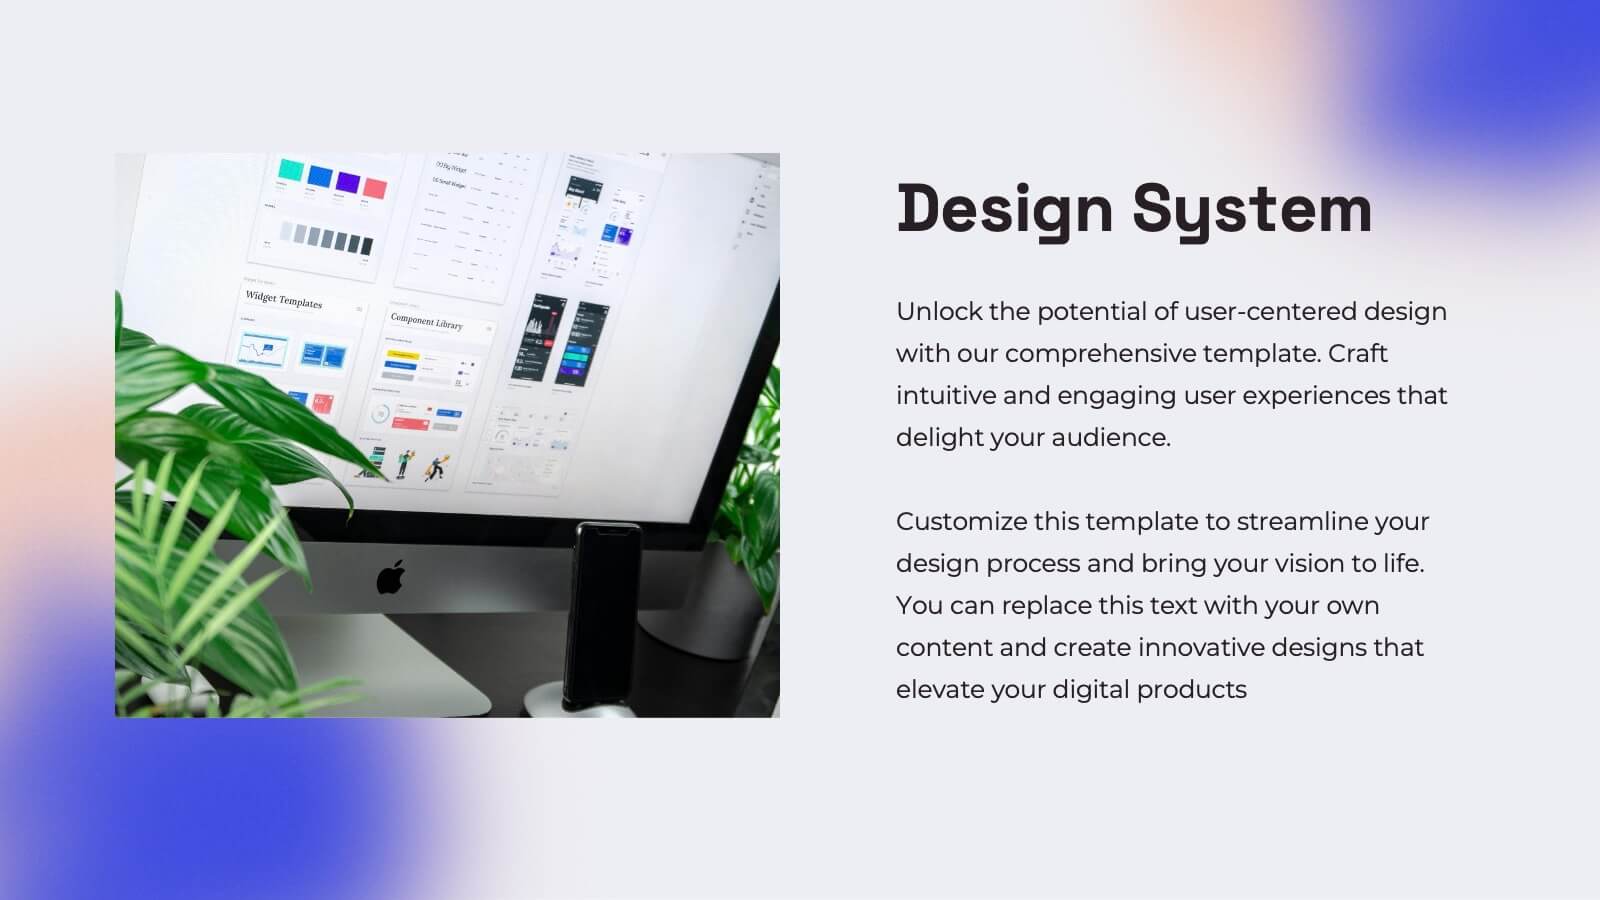
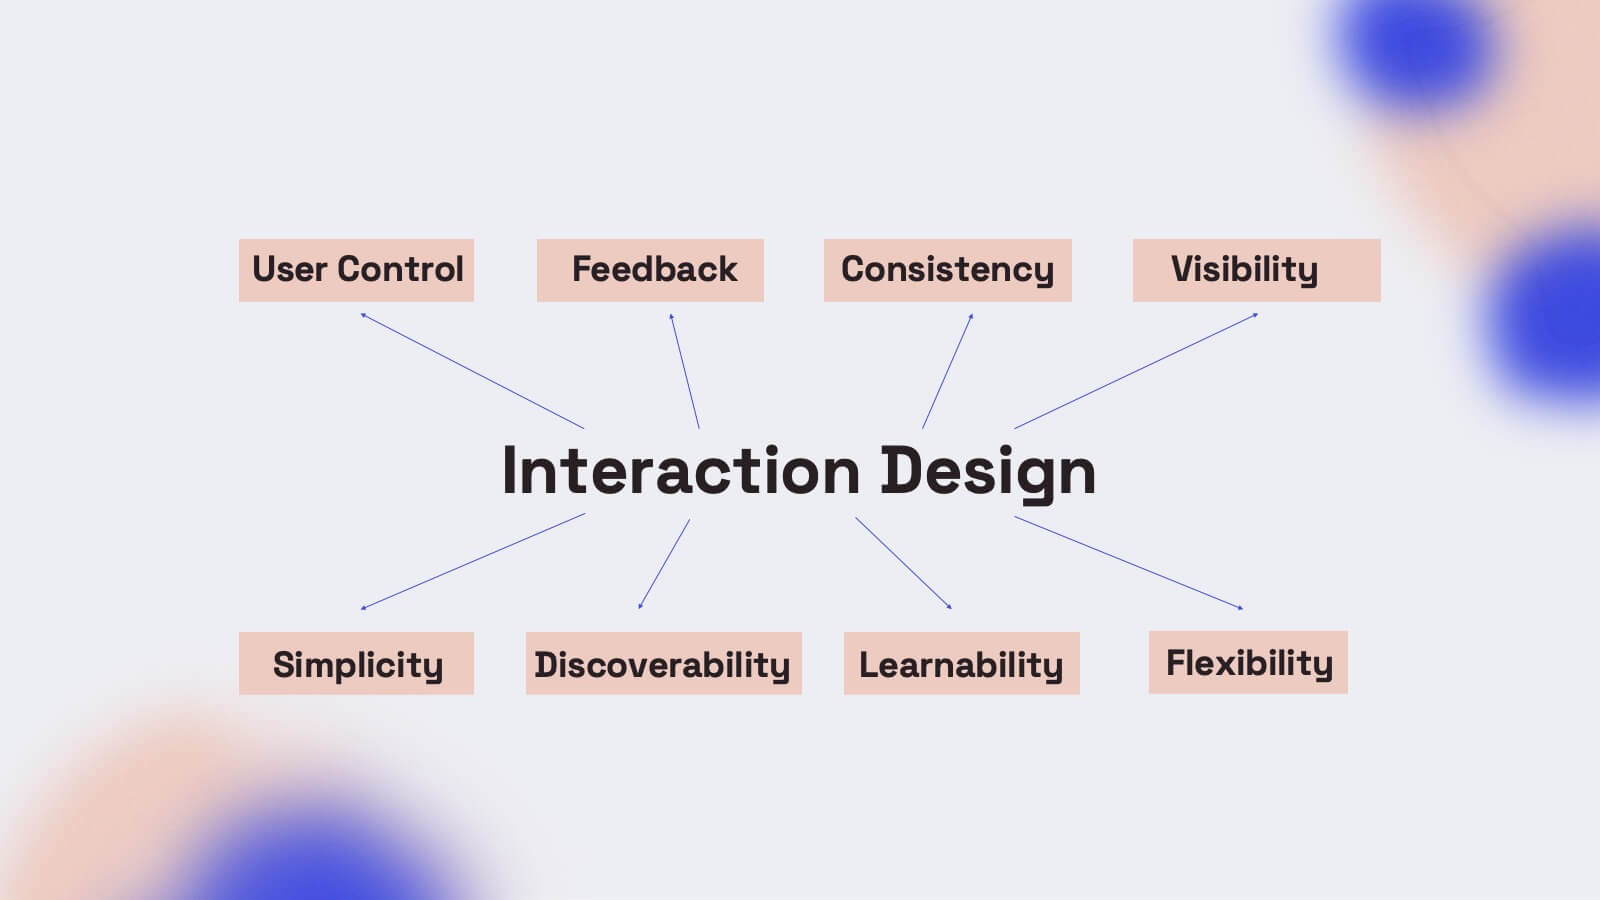
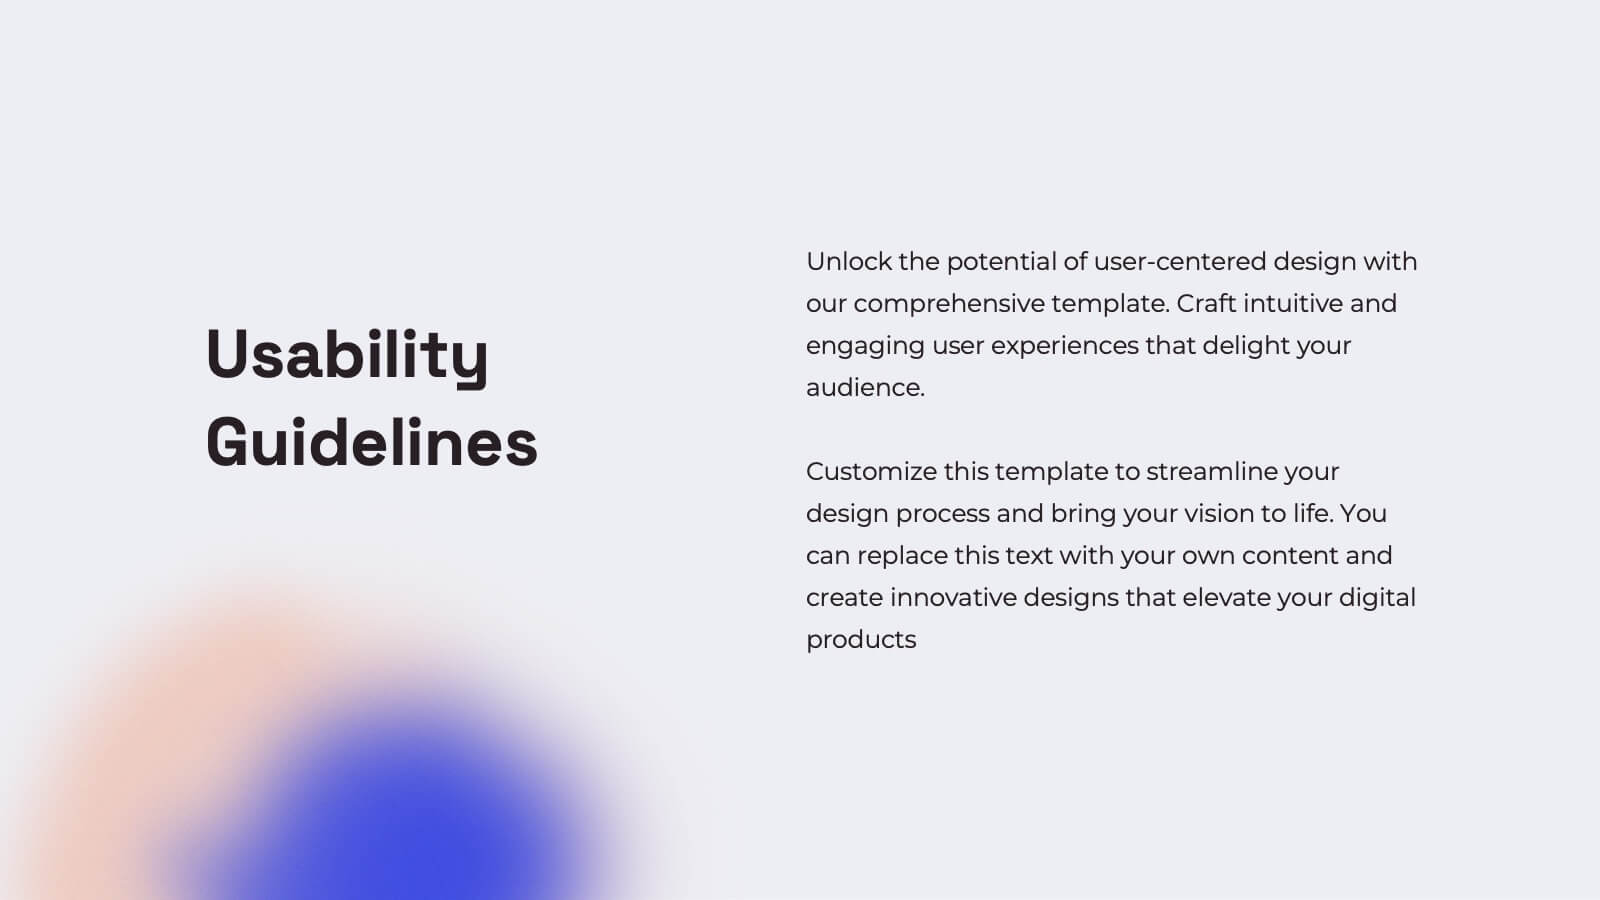
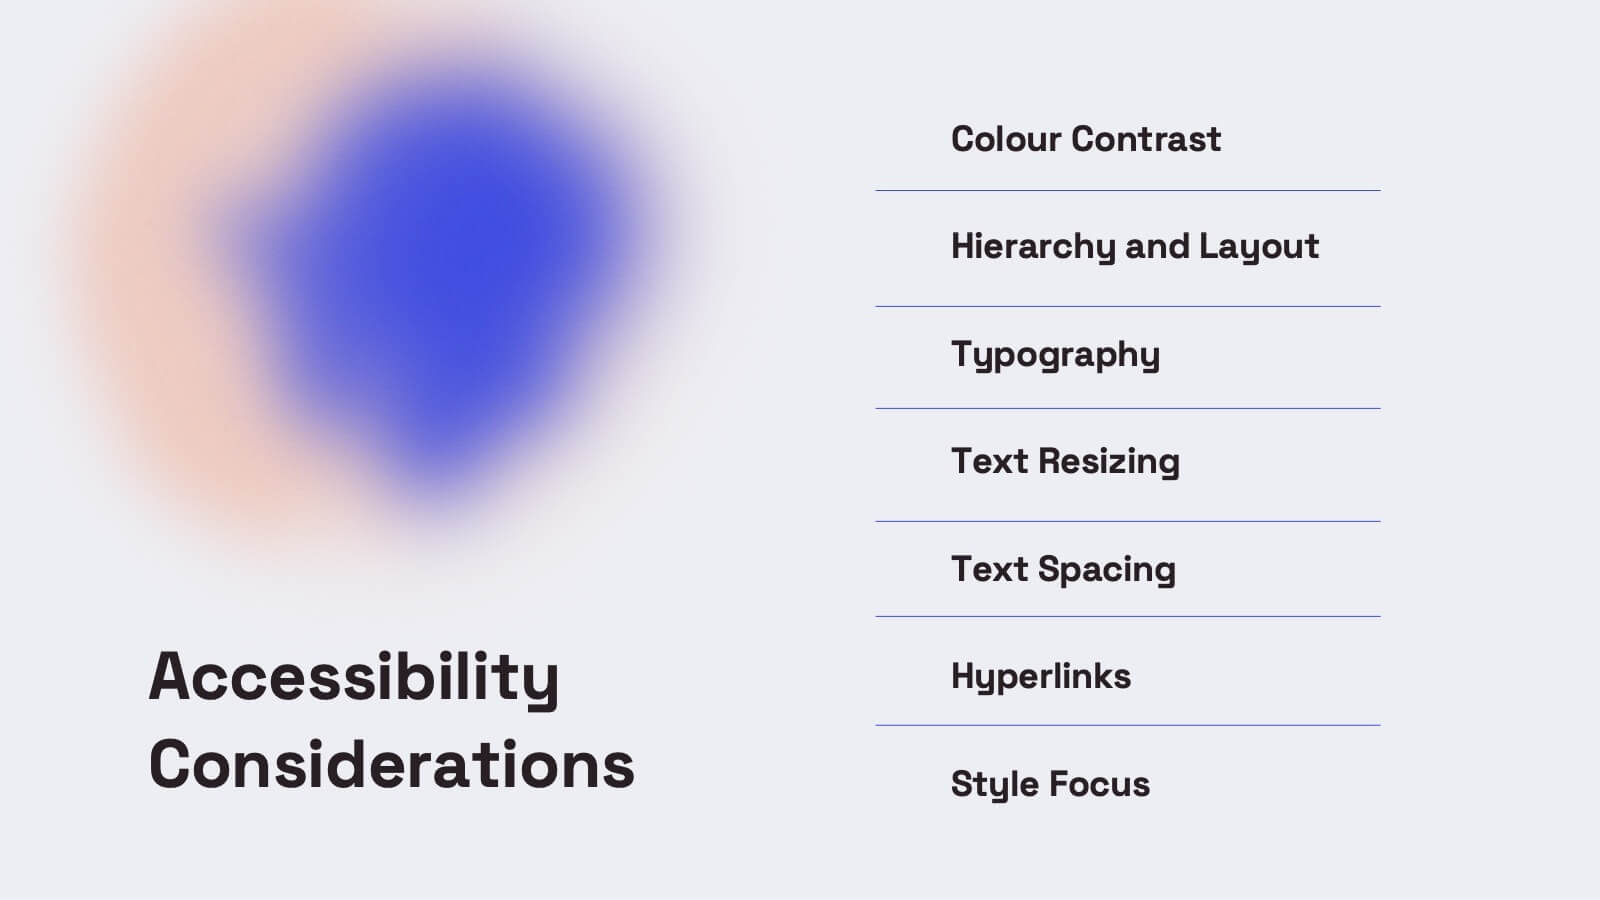
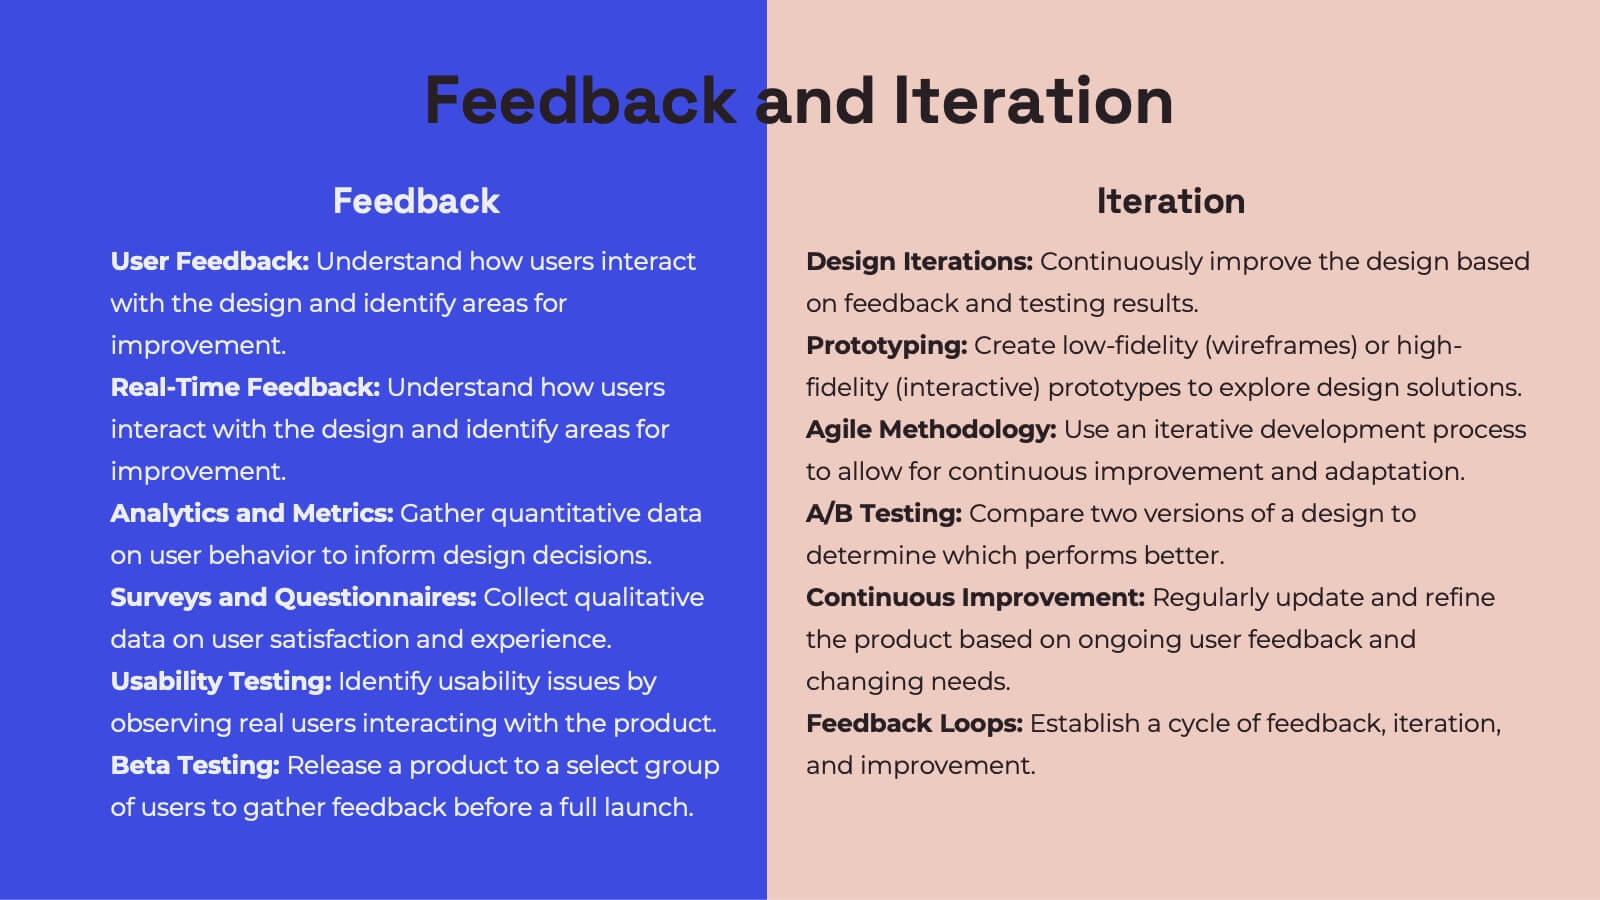
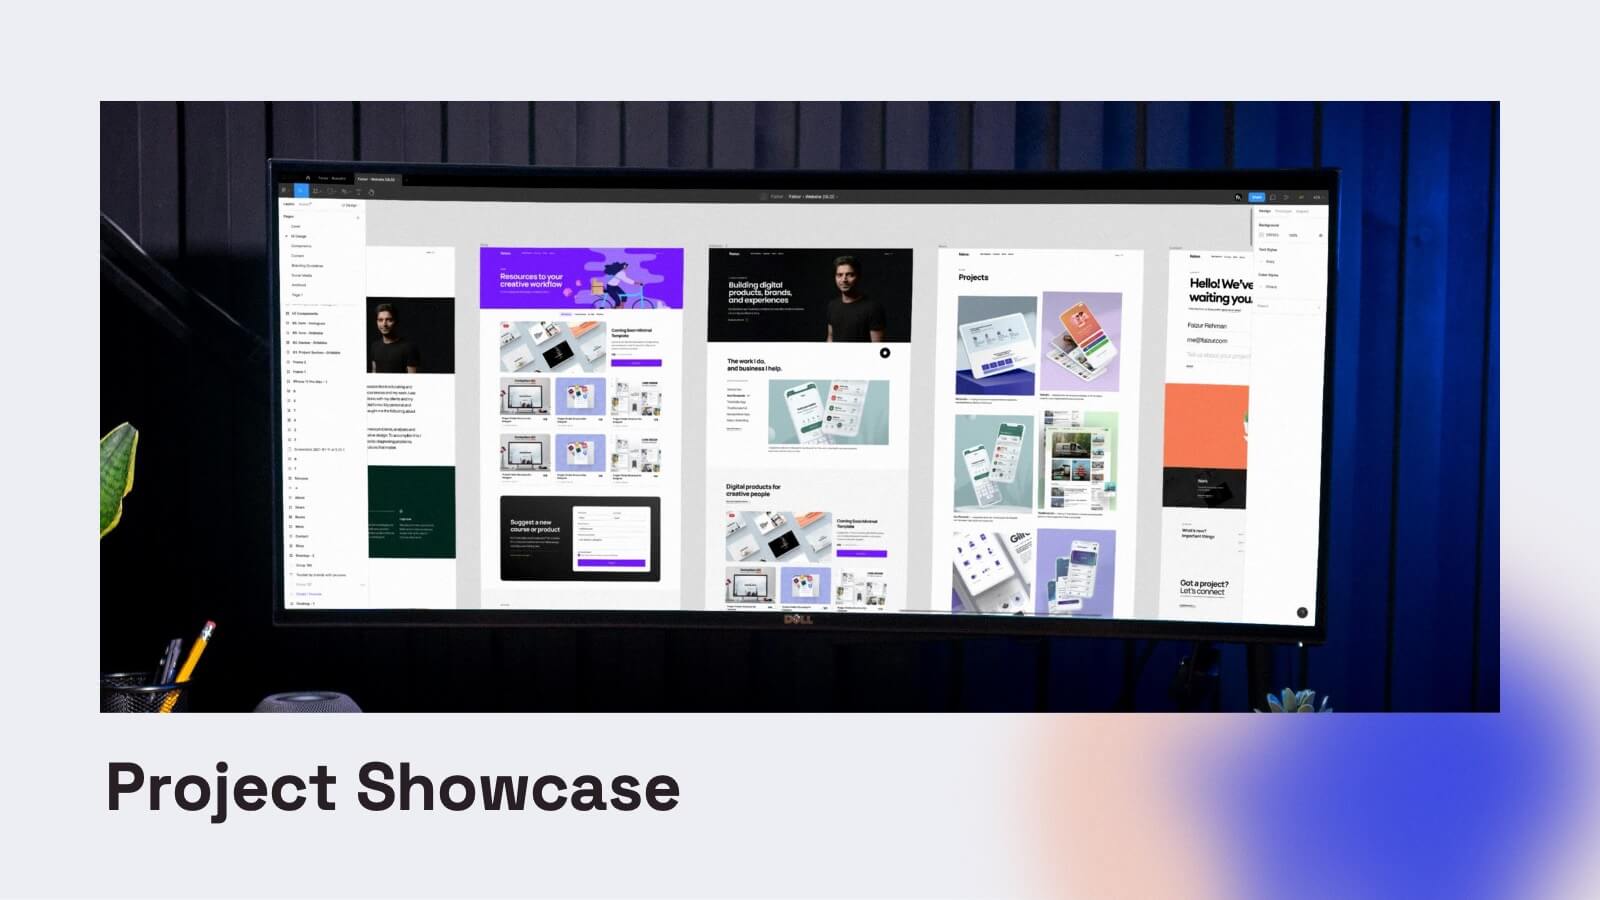
Gemini UX Design Presentation
Enhance your UX presentations with this vibrant and user-friendly template. Designed to cover every aspect of UX design, from user research and personas to wireframes and prototyping, this template ensures a comprehensive and engaging delivery. Its modern design and structured layout make your insights clear and impactful. Compatible with PowerPoint, Keynote, and Google Slides, it's perfect for any platform.


8 diapositivas
Scrum Agile Framework Presentation
Visualize your iterative workflows and deliverables with this Scrum Agile Framework Presentation. Designed for Agile teams, this layout simplifies the depiction of Scrum principles—product backlogs, sprints, and reviews—into one cohesive graphic. Ideal for planning meetings, sprint reviews, or stakeholder updates. Fully editable in PowerPoint, Keynote, and Google Slides.


6 diapositivas
Sales Strategy 30-60-90 Day Plan Presentation
Drive sales success with this structured 30-60-90 day strategy template! Designed to help sales teams and professionals set clear objectives, track progress, and optimize performance, this layout ensures a smooth transition from planning to execution. Fully customizable and compatible with PowerPoint, Keynote, and Google Slides for seamless presentations.