


Características


¿Tienes alguna pregunta?
Recomendar


5 diapositivas
Water Problems Infographics
Water Problems refer to the various issues that arise due to the scarcity, pollution, or mismanagement of water resources. These vertical infographics are perfect for addressing various issues related to water management and conservation. They are effective tools for raising awareness about water-related issues and promoting sustainable water management practices. This template is completely customizable and includes various icons and images related to water such as water droplets, faucets, and ocean waves. The color scheme is predominantly blue, signifying the importance of water conservation and preservation.


6 diapositivas
Governance Tools Infographics
Enhance your understanding of Governance Tools with our customizable infographic template. This template is fully compatible with popular presentation software like PowerPoint, Keynote, and Google Slides, allowing you to easily customize it to illustrate and communicate various governance tools and practices. The Governance Tools infographic template offers a visually engaging platform to explore and explain the tools, frameworks, and strategies used to facilitate effective governance within organizations. Whether you're a governance professional, business leader, or interested in corporate governance, this template provides a user-friendly canvas to create informative presentations and educational materials. Deepen your knowledge of Governance Tools with this SEO-optimized infographic template, thoughtfully designed for clarity and ease of use. Customize it to showcase governance frameworks, compliance mechanisms, risk management tools, and best practices, ensuring that your audience gains valuable insights into this critical field. Start crafting your personalized infographic today to delve into the world of Governance Tools.


21 diapositivas
Blaze Blitz Graphic Design Project Plan Presentation
Introducing the Blaze Black Design Project Plan template—where sophistication meets functionality! This visually striking template is designed to captivate your audience with its bold black and white theme, exuding professionalism and creativity. Perfect for designers and creative agencies, this template is meticulously structured to guide your project from concept to completion. Each slide is designed to highlight key aspects like the Design Brief, Concept Development, Target Audience, and Design Process, ensuring your message is conveyed with clarity and impact. The sleek typography, combined with high-contrast visual elements, enhances readability while adding a modern edge to your presentation. Whether you're pitching a new design project, showcasing your design process, or planning your next creative endeavor, this template is your go-to tool for delivering presentations that leave a lasting impression. Compatible with PowerPoint, Keynote, and Google Slides, it's fully customizable to fit your brand and style. Get ready to wow your audience with this powerful design template!


21 diapositivas
Novaeon Corporate Strategy Proposal Presentation
A sleek and professional presentation template designed for strategy proposals. Includes slides for SWOT analysis, growth opportunities, strategic initiatives, and performance metrics. Fully customizable to fit any corporate need, ensuring impactful communication. Compatible with PowerPoint, Keynote, and Google Slides for seamless presentations.


5 diapositivas
Watercolor Background Design Presentation
Add an artistic edge to your presentation with this Watercolor Background Design Template. Featuring soft, abstract paint splashes behind vibrant alphabet icons, it’s perfect for creative professionals, educators, or marketing teams looking to highlight four core ideas or comparisons. Fully editable in PowerPoint, Keynote, and Google Slides for a seamless customization experience.


10 diapositivas
Hospital Services Overview Presentation
Bring your healthcare message to life with a clean, modern layout that makes complex hospital services easy to understand. This presentation helps you outline key departments, care processes, and essential service details with clarity and confidence. Designed for smooth communication in medical settings, it works seamlessly in PowerPoint, Keynote, and Google Slides.


5 diapositivas
Visionary Leadership Models in Business
Illustrate transformative leadership approaches with the Visionary Leadership Models in Business Presentation. This slide features a central vertical timeline with bold icons and text areas that highlight four key principles or stages of leadership. Ideal for strategy sessions, keynote addresses, or leadership training programs. Fully compatible with PowerPoint, Keynote, and Google Slides.


5 diapositivas
The History of Beer Infographics
Beer has a long and fascinating history that dates back thousands of years, throughout its history beer has played a significant role in social, cultural, and economic contexts. These engaging infographics take viewers on a journey through the fascinating history of beer. It provides a comprehensive overview of the origins, evolution, and cultural significance of beer throughout different eras and regions. This visual resource is perfect for beer enthusiasts, historians, and anyone interested in the cultural and historical aspects of this beloved beverage. Compatible with Powerpoint, Keynote, and Google Slides.


5 diapositivas
SEO Techniques Infographics
SEO (Search Engine Optimization) techniques are strategies and practices used to improve a website's visibility and ranking in search engine results pages (SERPs). These infographic templates are designed to educate and inform about various techniques and strategies used in search engine optimization. With its eye-catching design and clear visual representations, the template helps convey complex SEO concepts in a concise and engaging manner. These provide a foundation for understanding the subsequent techniques discussed in the presentation. Throughout the infographic, best practices and tips are shared to help optimize SEO efforts.
24 diapositivas
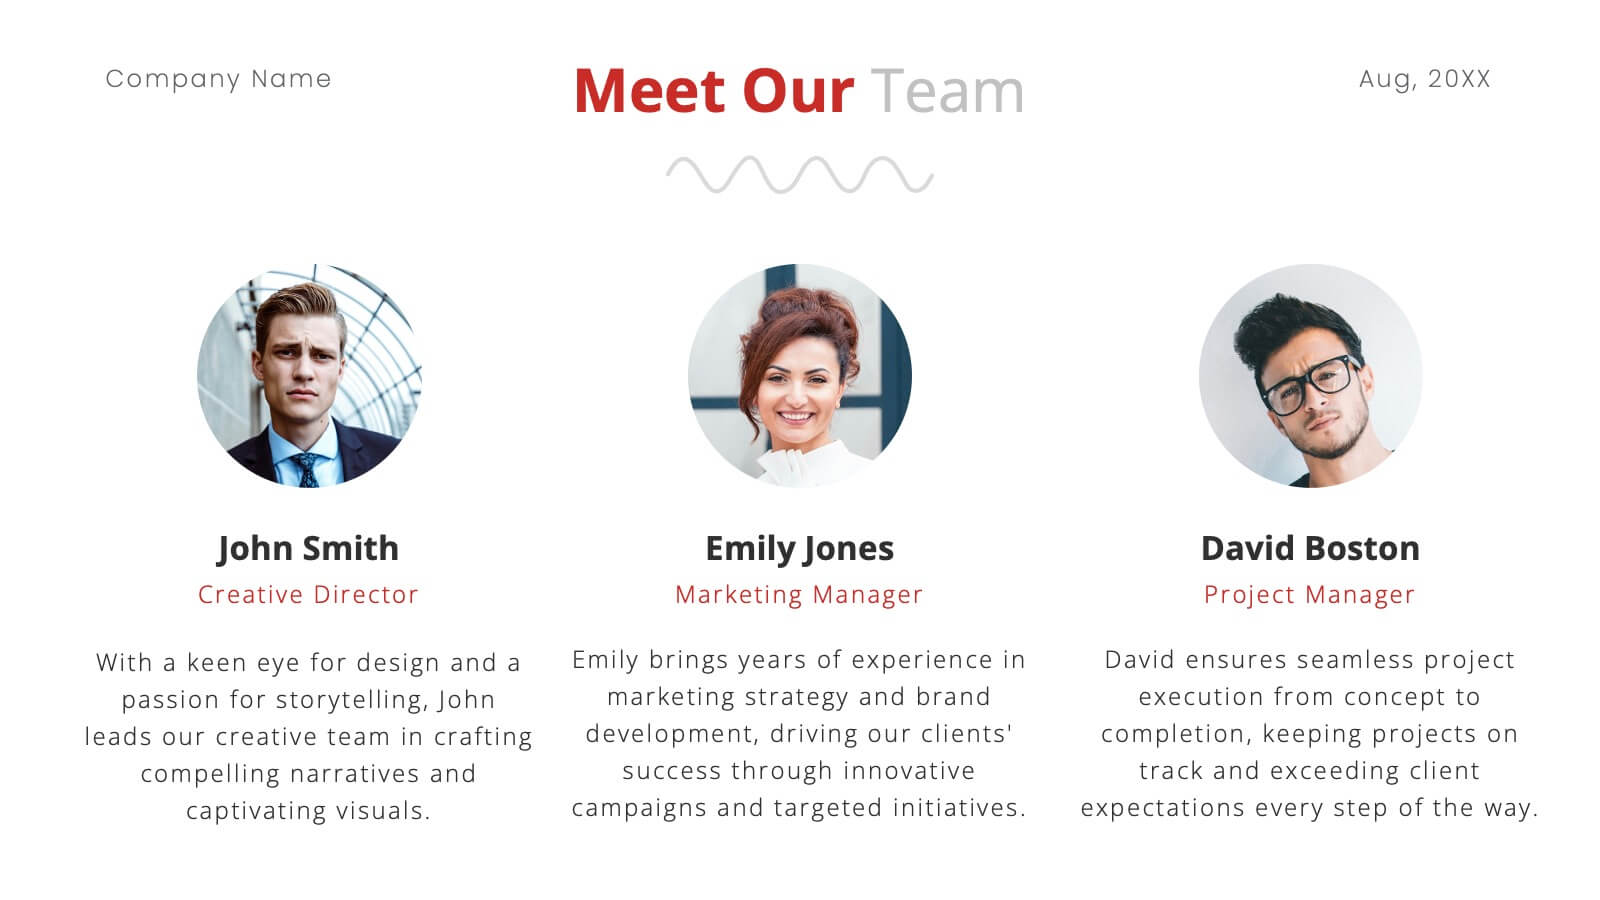
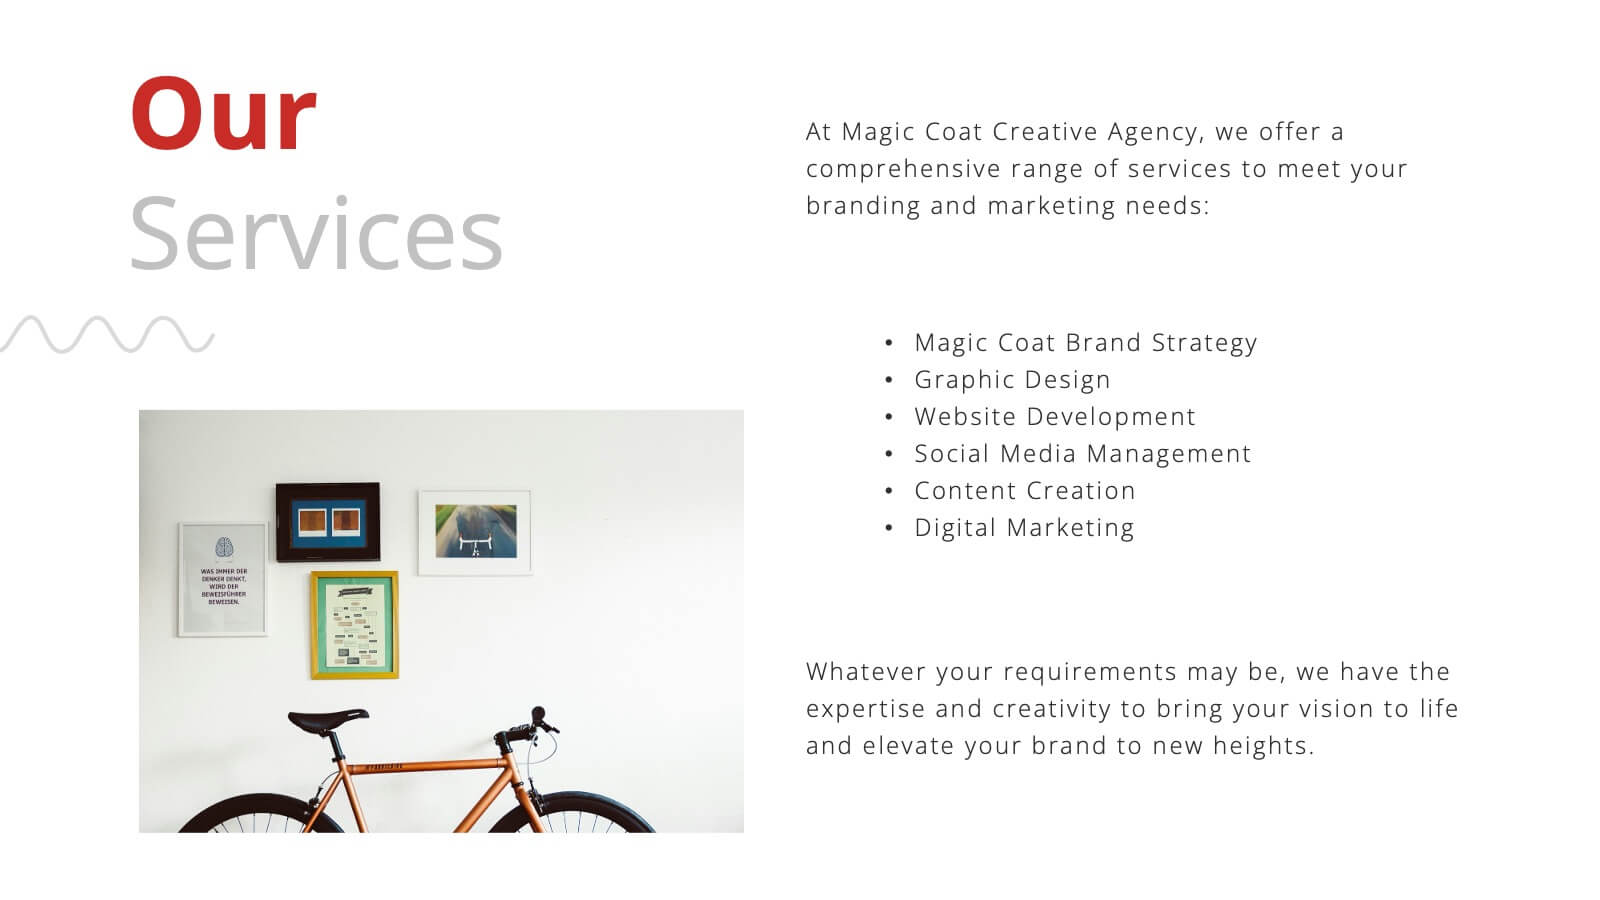
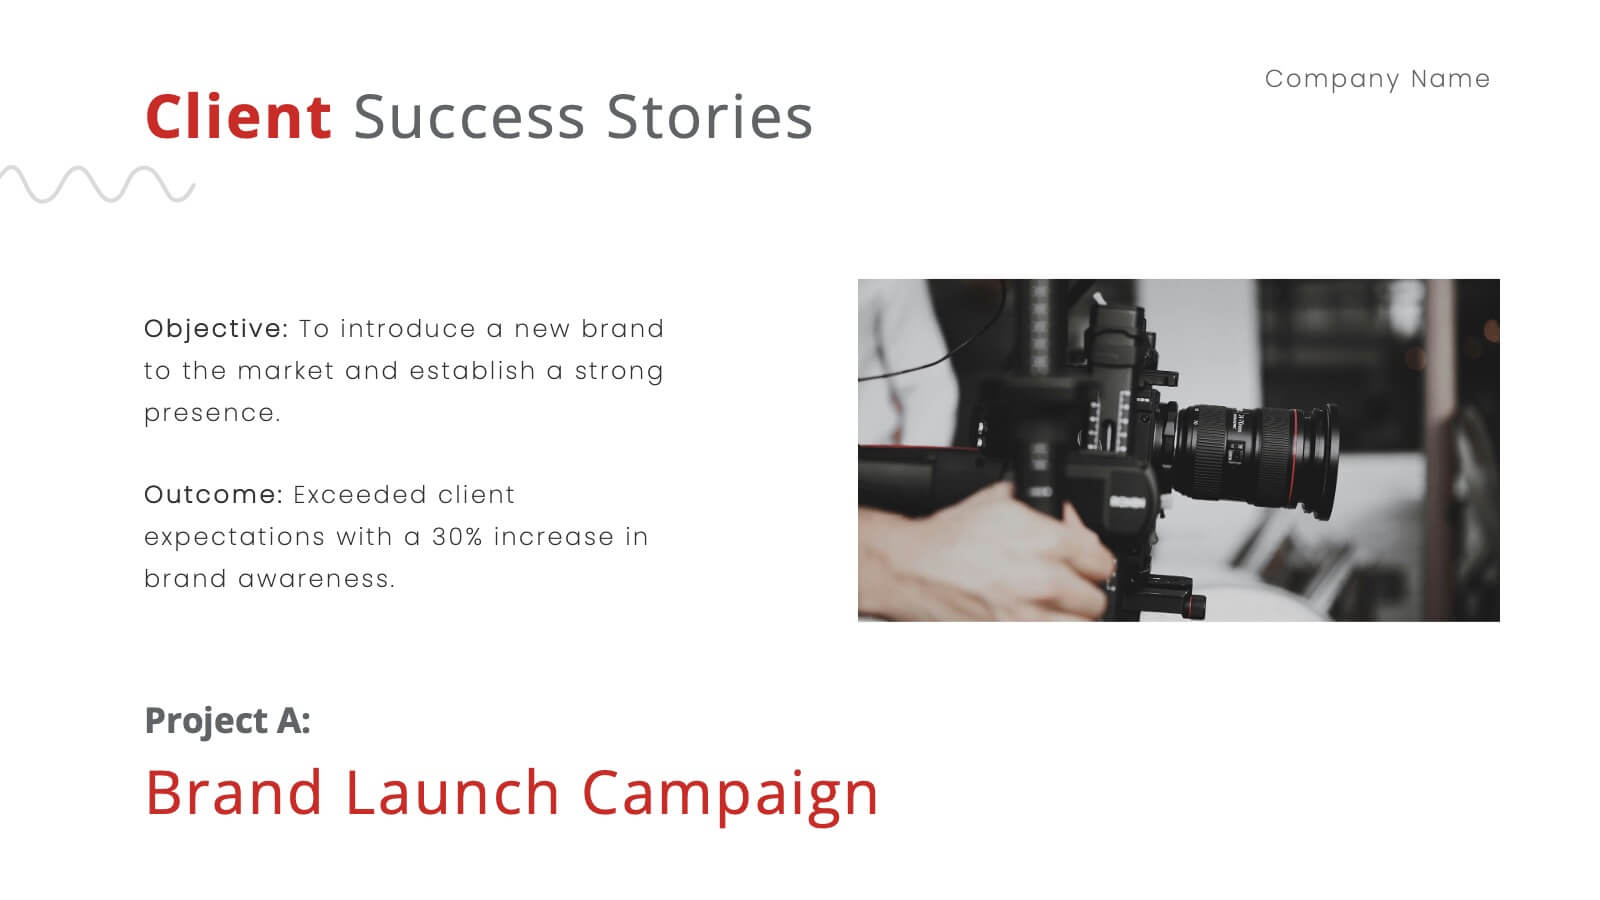
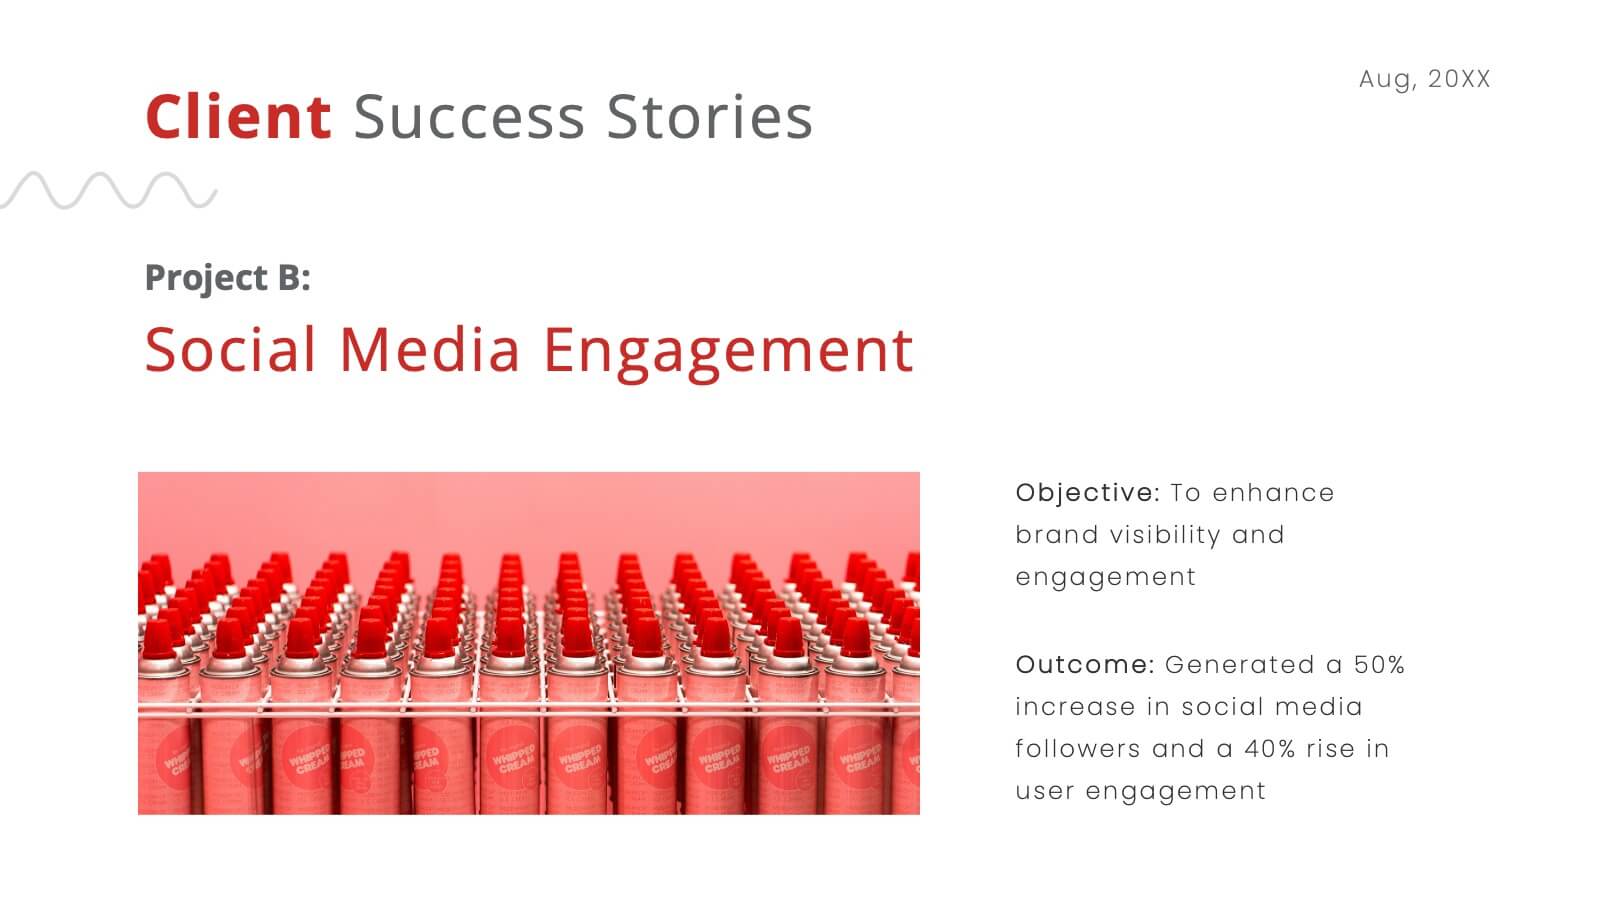
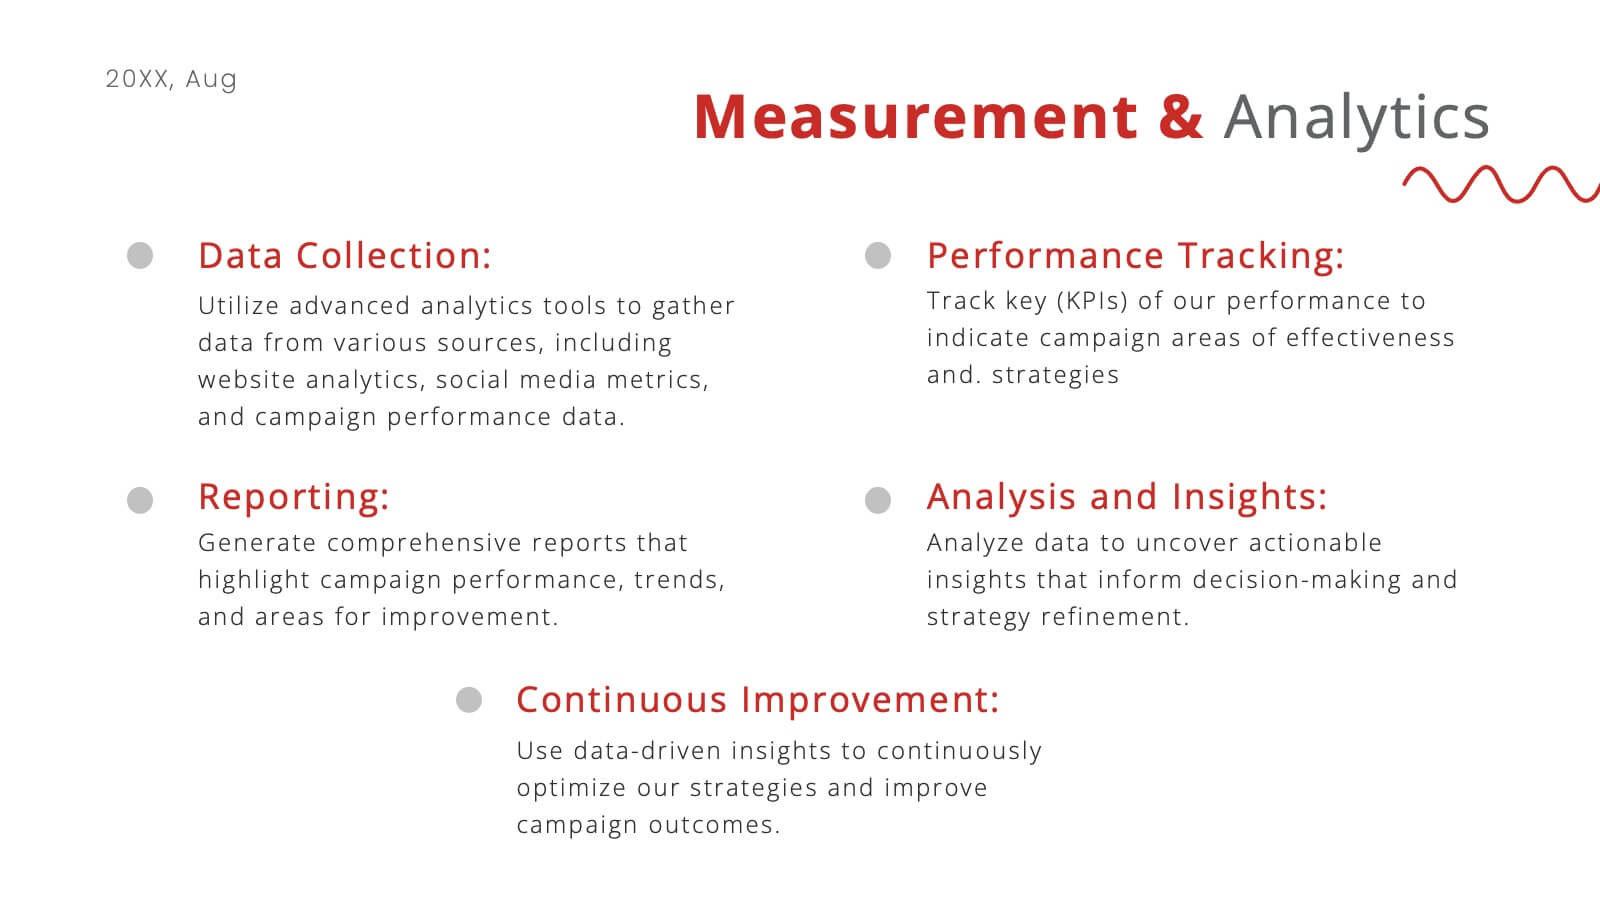
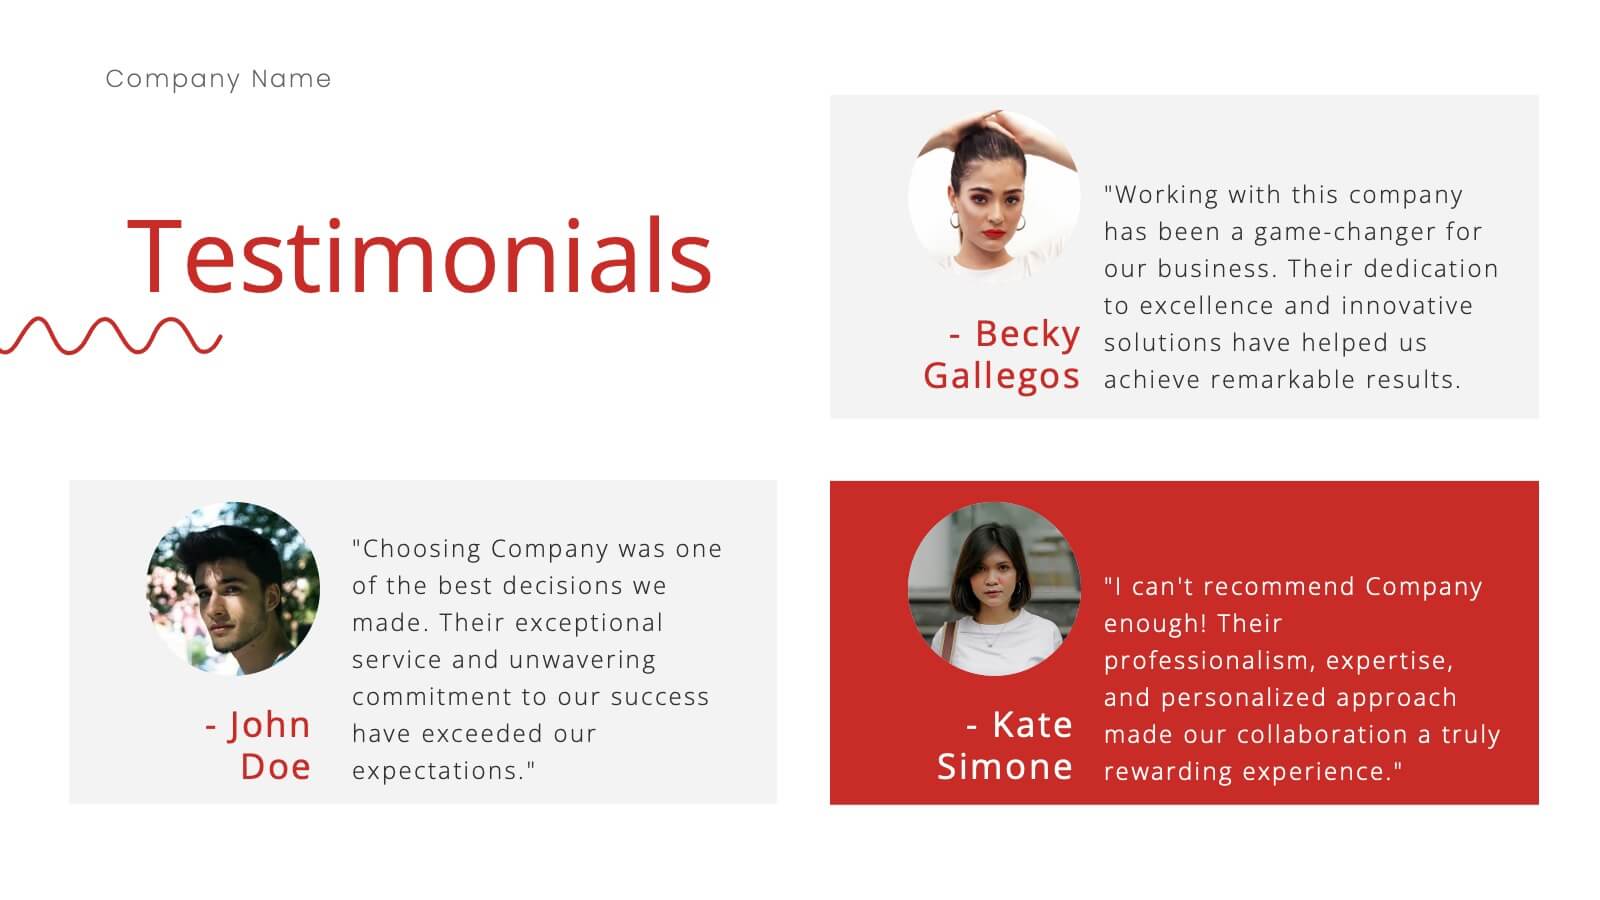
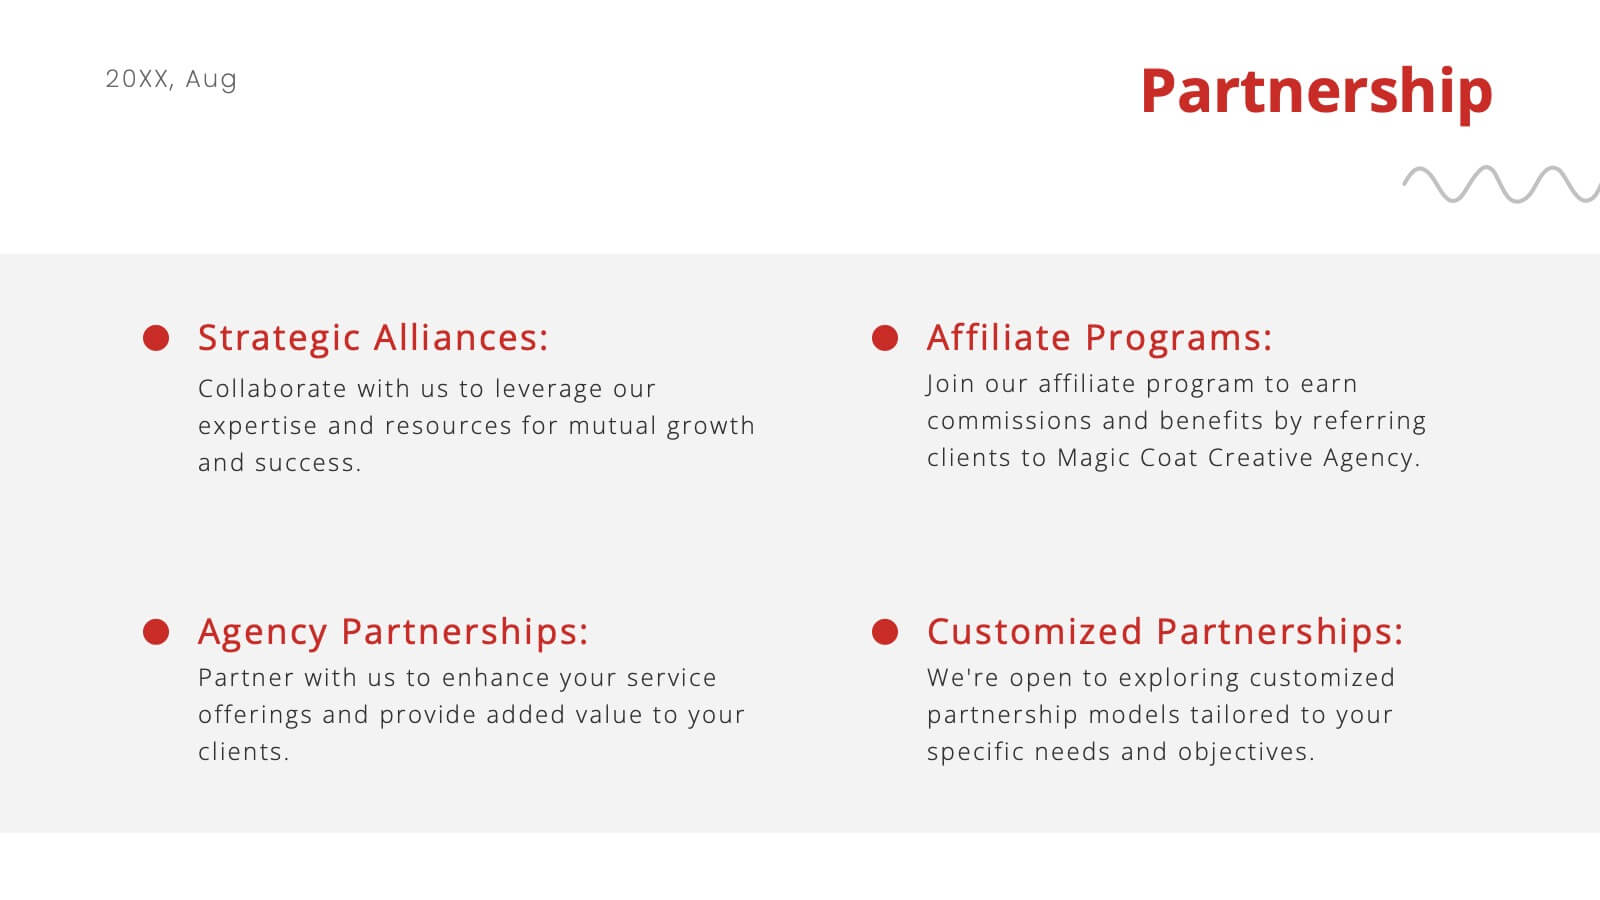
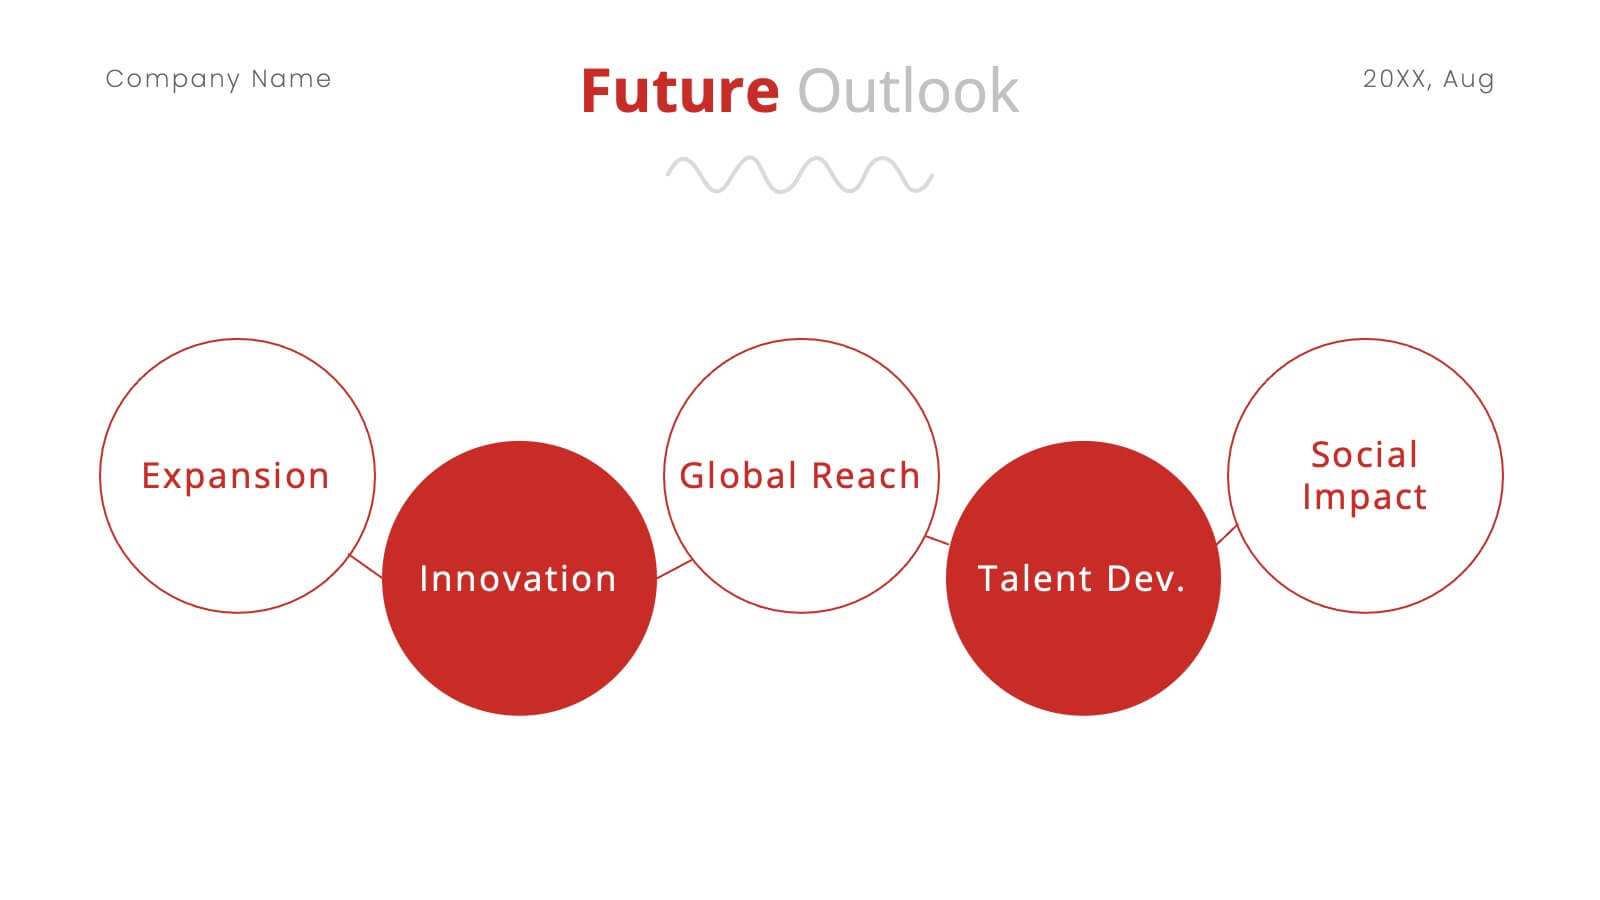
Nickel Advertising Agency Proposal Presentation
Take your advertising agency to the next level with this sleek and modern presentation template! Highlighting your services, team, success stories, and marketing strategies, it’s the perfect tool to showcase your agency’s strengths and capabilities. Fully customizable and compatible with PowerPoint, Keynote, and Google Slides, this template is ideal for impressing potential clients and partners.


4 diapositivas
Medical Overview and Clinical Solutions Presentation
Present medical insights with clarity using the Medical Overview and Clinical Solutions Presentation. This slide features a segmented pill bottle graphic paired with three labeled sections (A, B, C), ideal for explaining treatments, protocols, or phased approaches. Fully editable in Canva, PowerPoint, Keynote, and Google Slides for seamless customization.


21 diapositivas
Crystalhearth UX Design Presentation
This professional template simplifies UX/UI design presentations, covering user research, personas, journey mapping, wireframes, and usability guidelines. Showcase visual elements, branding, accessibility, and responsive design. Ideal for illustrating the iterative process, testing insights, and project showcases. Fully customizable and compatible with PowerPoint, Keynote, and Google Slides.


5 diapositivas
Watercolor Accent Style Template Presentation
Add subtle creativity to your slides with this Watercolor Accent Style Template. Ideal for timelines, progressions, or process visualization, this layout features numbered brushstroke segments in soft, hand-painted textures. Use it to highlight key points with elegance and clarity. Fully editable in PowerPoint, Google Slides, and Canva.


26 diapositivas
Agile Project Management Presentation
Elevate your project management approach with our Agile Project Management presentation template. Compatible with PowerPoint, Keynote, and Google Slides, it's designed to adapt to any presentation environment effortlessly. Ideal for project managers, team leaders, and agile enthusiasts, this template is engineered to illustrate the flexibility and efficiency of agile methodologies in project execution. Our Agile Project Management template is a powerful tool for demonstrating the benefits of agile processes, including increased adaptability, improved stakeholder engagement, and enhanced product quality. With a series of well-organized slides, it guides you through the agile journey, from project inception to completion. The template offers a diverse range of slides that cover all facets of agile project management, including sprint planning, daily stand-ups, and retrospectives. This template is not just visually appealing but also rich in content, providing ample space to detail out roles, responsibilities, and timelines. It ensures that your team and stakeholders are aligned with the project goals, making complex information accessible and understandable. Unlock the potential of your projects with this SEO-optimized template, and become the go-to source for agile project management strategies.


6 diapositivas
Innovation Pipeline and Idea Execution
Streamline your innovation process with the Innovation Pipeline and Idea Execution Presentation. This clean, layered funnel layout is ideal for visualizing each stage from idea generation to implementation. Perfect for R&D teams, product managers, or corporate strategists, this slide is fully editable in PowerPoint, Keynote, and Google Slides.


23 diapositivas
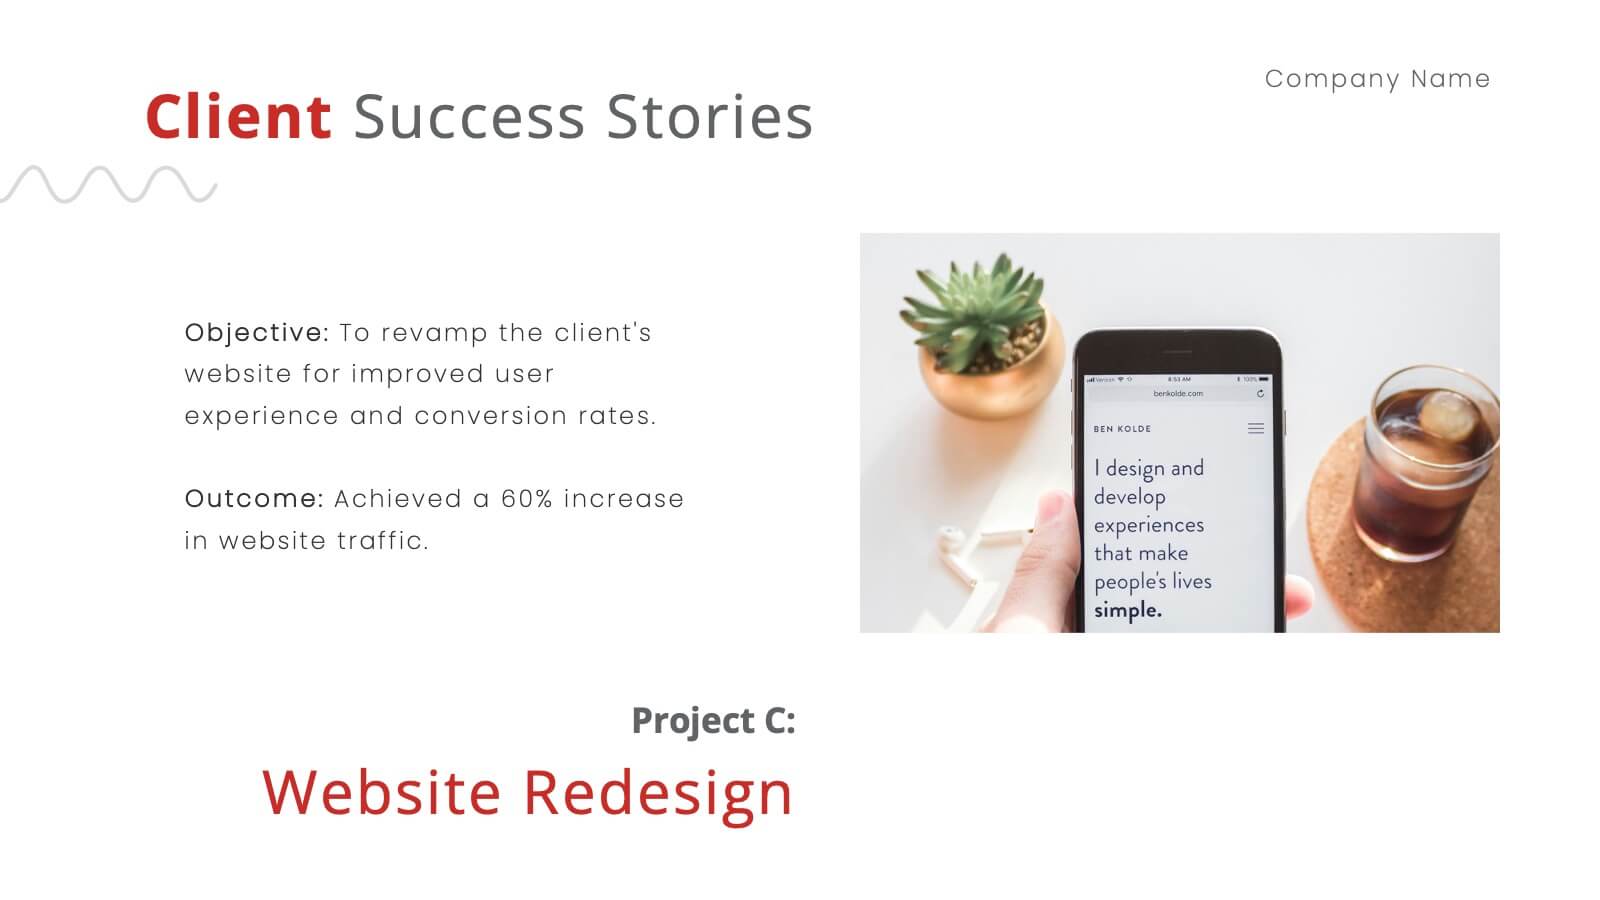
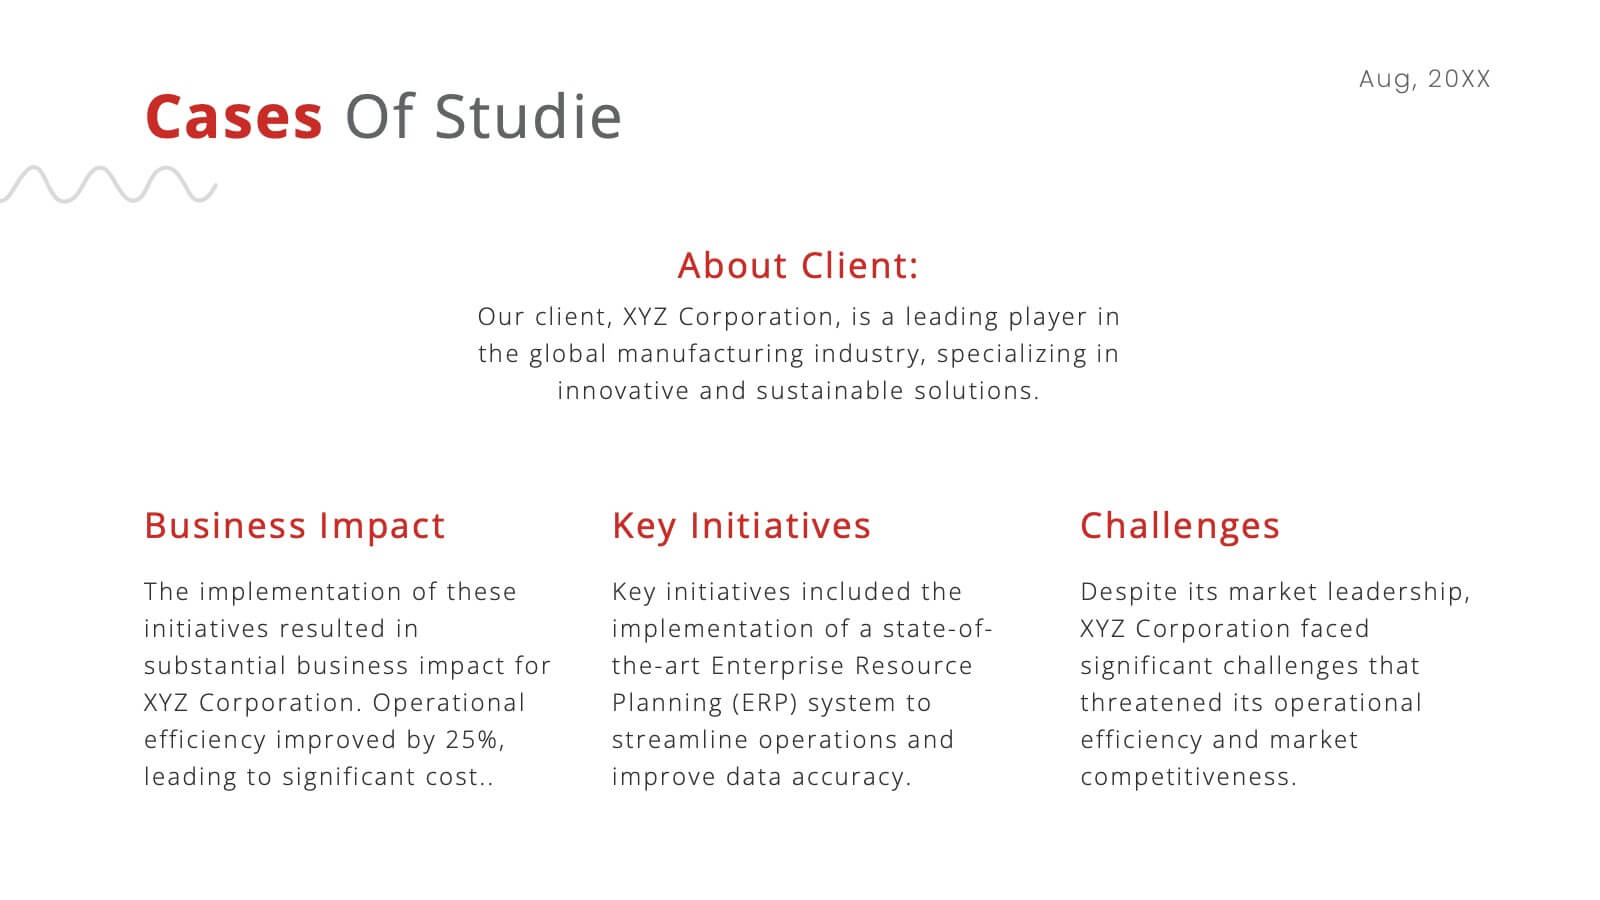
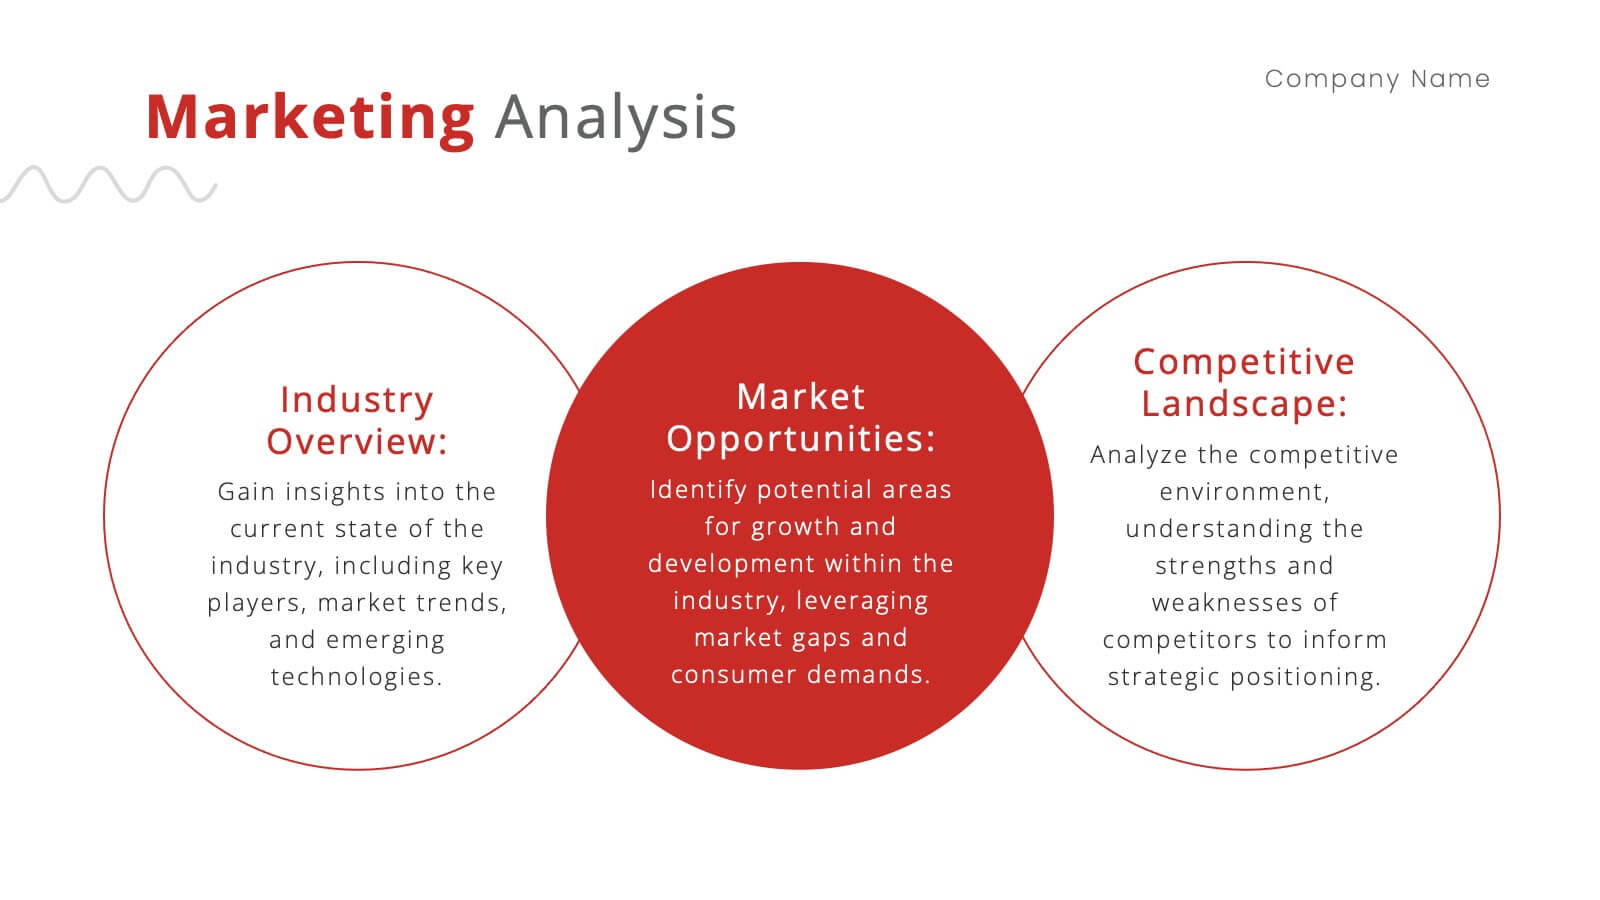
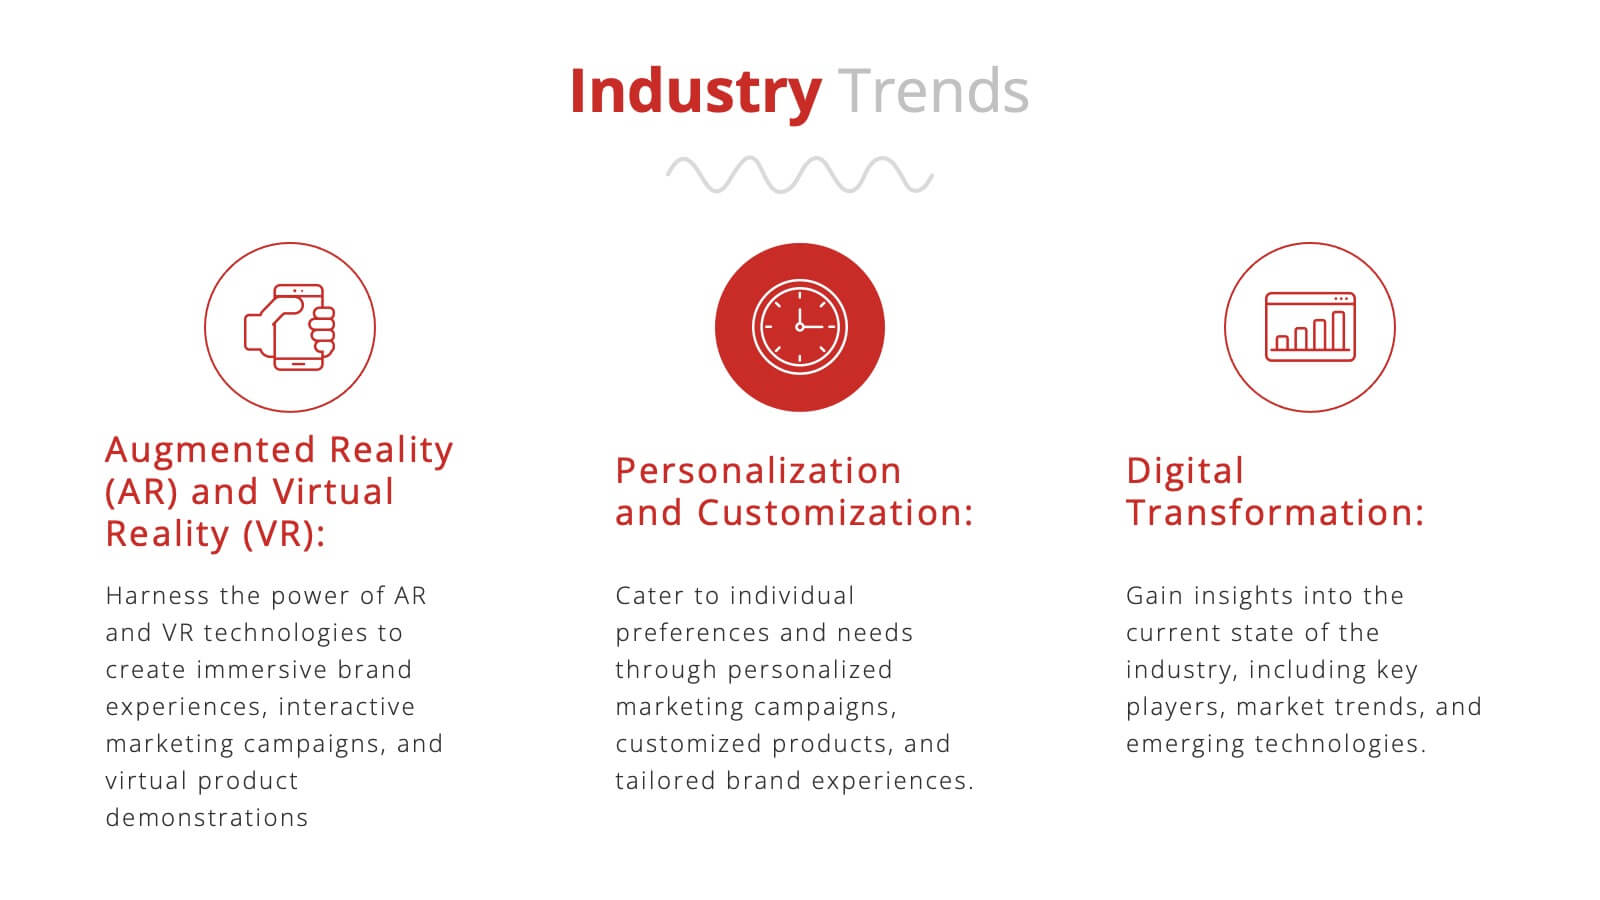
Mystic Small Business Pitch Deck Presentation
Elevate your small business presentations with this sleek, professional pitch deck template! It’s designed to highlight your company's background, market opportunities, and key objectives in a visually appealing format. Perfect for showcasing your products, services, value proposition, and financial performance, this template makes your pitch stand out. Customize it for PowerPoint, Keynote, or Google Slides to suit your needs.


21 diapositivas
Fluorion Startup Strategy Presentation
Kickstart your business with this modern and professional Startup Strategy Presentation Template. Designed to help entrepreneurs, startups, and business owners present their vision, goals, and strategies effectively. This template includes 21 fully customizable slides covering essential sections such as mission and vision, market analysis, business model, financial overview, and growth plan. Compatible with PowerPoint, Keynote, and Google Slides for seamless editing and presentation.