


Características


¿Tienes alguna pregunta?
Recomendar


6 diapositivas
Gantt Charts Analysis Infographic
Streamline your project planning with our Gantt Chart Analysis Infographic, designed for seamless integration with Powerpoint, Google Slides, and Keynote. The Gantt chart layout allows you to display activities against a time scale, making it easy to identify key phases, task durations, and overlapping activities. Each bar represents a task, with colors and lengths that can be customized to reflect different stages or priorities. Perfect for detailing project timelines, and workflow coordination, this template is a visual aid that enhances clarity and fosters collaborative project management. With this Gantt Chart infographic, you can ensure your project stays on track.


26 diapositivas
Sophia Presentation Template
Sophia is a feminine template with a colorful presentation that is simple, clean and organized to make any information stand out. Sophia is suitable for personal projects as well as anyone looking for a presentation for their business. It's equipped to keep your content and layout consistent. The theme is eye catching with the colors, images and font. Anyone who has a bakery would love this template. Editing features make it easy to customize for your own needs by adding company logos, product information and other relevant details on your template. It is lightweight, fast and easy to use.


7 diapositivas
Performance Summary Infographic
Boost your reporting capabilities with our Infographic Templates, designed to deliver exceptional clarity and impact. This series is perfectly suited for professionals seeking to present performance data compellingly and concisely. With a variety of designs including radial graphs, tiered lists, and comparative bars, these templates allow for an informative and aesthetically pleasing showcase of critical metrics. Each template is customizable, letting you adjust the color schemes and text to fit your corporate style, enhancing both visual appeal and brand consistency. Whether used in PowerPoint, Google Slides, or Keynote, these tools are vital for anyone looking to articulate achievements, assess comparative results, and plan based on solid data insights. They are indispensable for consultants, managers, and team leaders who require clear, persuasive presentation resources to drive decisions and highlight successes.


13 diapositivas
Market Segmentation and Consumer Demographics Presentation
Visualize your audience breakdown with this clean, data-driven demographic infographic slide. Featuring customizable male and female icons, percentage metrics, and bar charts for segment analysis, this layout is perfect for showcasing consumer insights, behavior patterns, and target group comparisons. Ideal for marketing reports, business plans, and audience research decks. Fully editable in PowerPoint, Keynote, and Google Slides.


7 diapositivas
Spider Diagram Mind Map Presentation
Turn scattered ideas into structured brilliance with a clean, visual layout that connects every concept effortlessly. This presentation helps you organize thoughts, brainstorm strategies, or map out projects with clarity and flow. Fully editable and compatible with PowerPoint, Keynote, and Google Slides for easy customization and collaboration.


6 diapositivas
Hexagon Infographic Diagram Presentation
Turn your data into a story worth seeing with a clean, geometric layout that connects six key ideas in one bold visual. This presentation is perfect for showcasing processes, strategies, or relationships in a modern, engaging way. Fully compatible with PowerPoint, Keynote, and Google Slides.


6 diapositivas
Pillar Ideas Infographic
"Pillar ideas" usually refer to the fundamental principles, concepts, or key components that form the foundation of a particular topic, strategy, or framework. This infographic template outlines and explains the core pillars or key principles of a particular topic, concept, or strategy. These pillars are essential for understanding and implementing the core aspects of that subject. The pillars included in the infographic provide structure and a clear understanding of the foundational elements that contribute to the success and effectiveness of various endeavors. This template is compatible with Powerpoint, Keynote, and Google Slides.


5 diapositivas
CBD Oil Infographics
CBD oil, also known as cannabidiol oil, is a natural extract derived from the cannabis plant. These infographic templates can effectively present information about CBD oil in an engaging and informative manner, allowing your audience to grasp the potential benefits and practical considerations associated with its use. It is designed to educate and inform the audience about the uses, benefits, and considerations related to CBD oil. The infographics are fully customizable with visually appealing vibrant colors, relevant icons, and eye-catching layouts to capture your audience's attention.


24 diapositivas
Petricor UX Strategy Plan Presentation
This UX Strategy Presentation offers a structured approach to user experience design, covering key aspects such as user research, wireframing, prototyping, and usability guidelines. With sections on branding, responsive design, and accessibility, this template is ideal for UX professionals. Fully editable and compatible with PowerPoint, Keynote, and Google Slides.


21 diapositivas
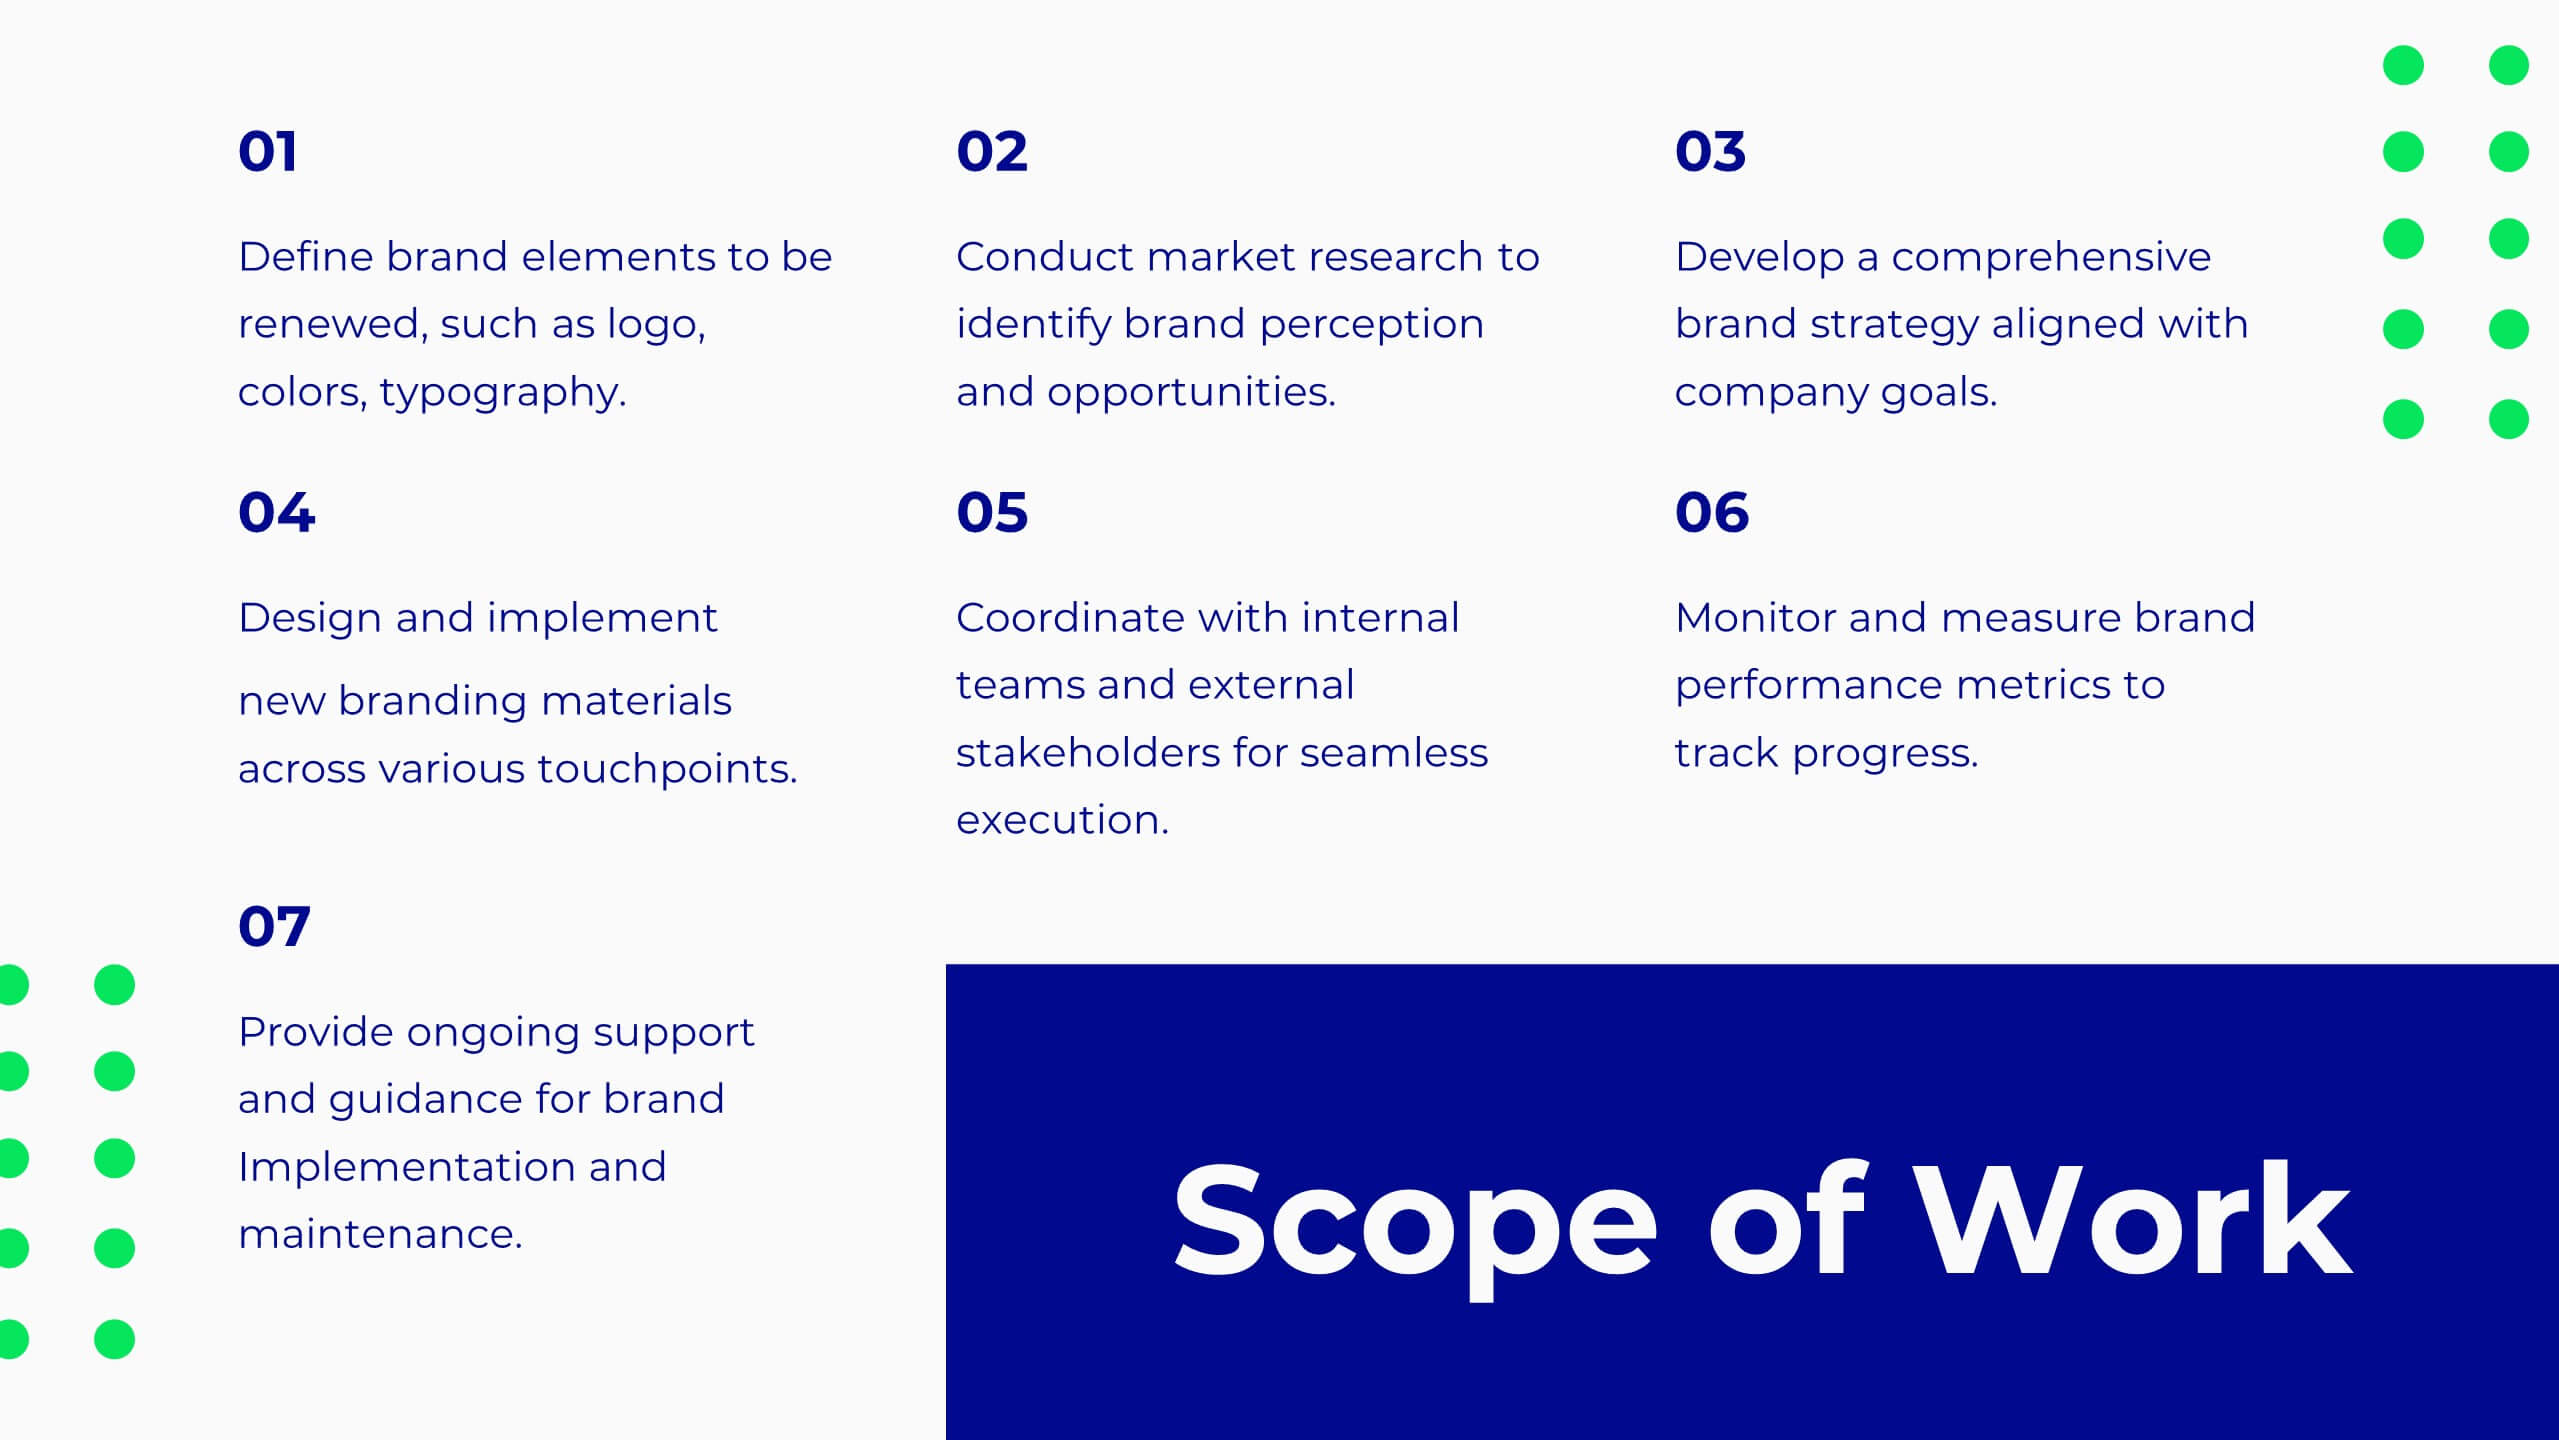
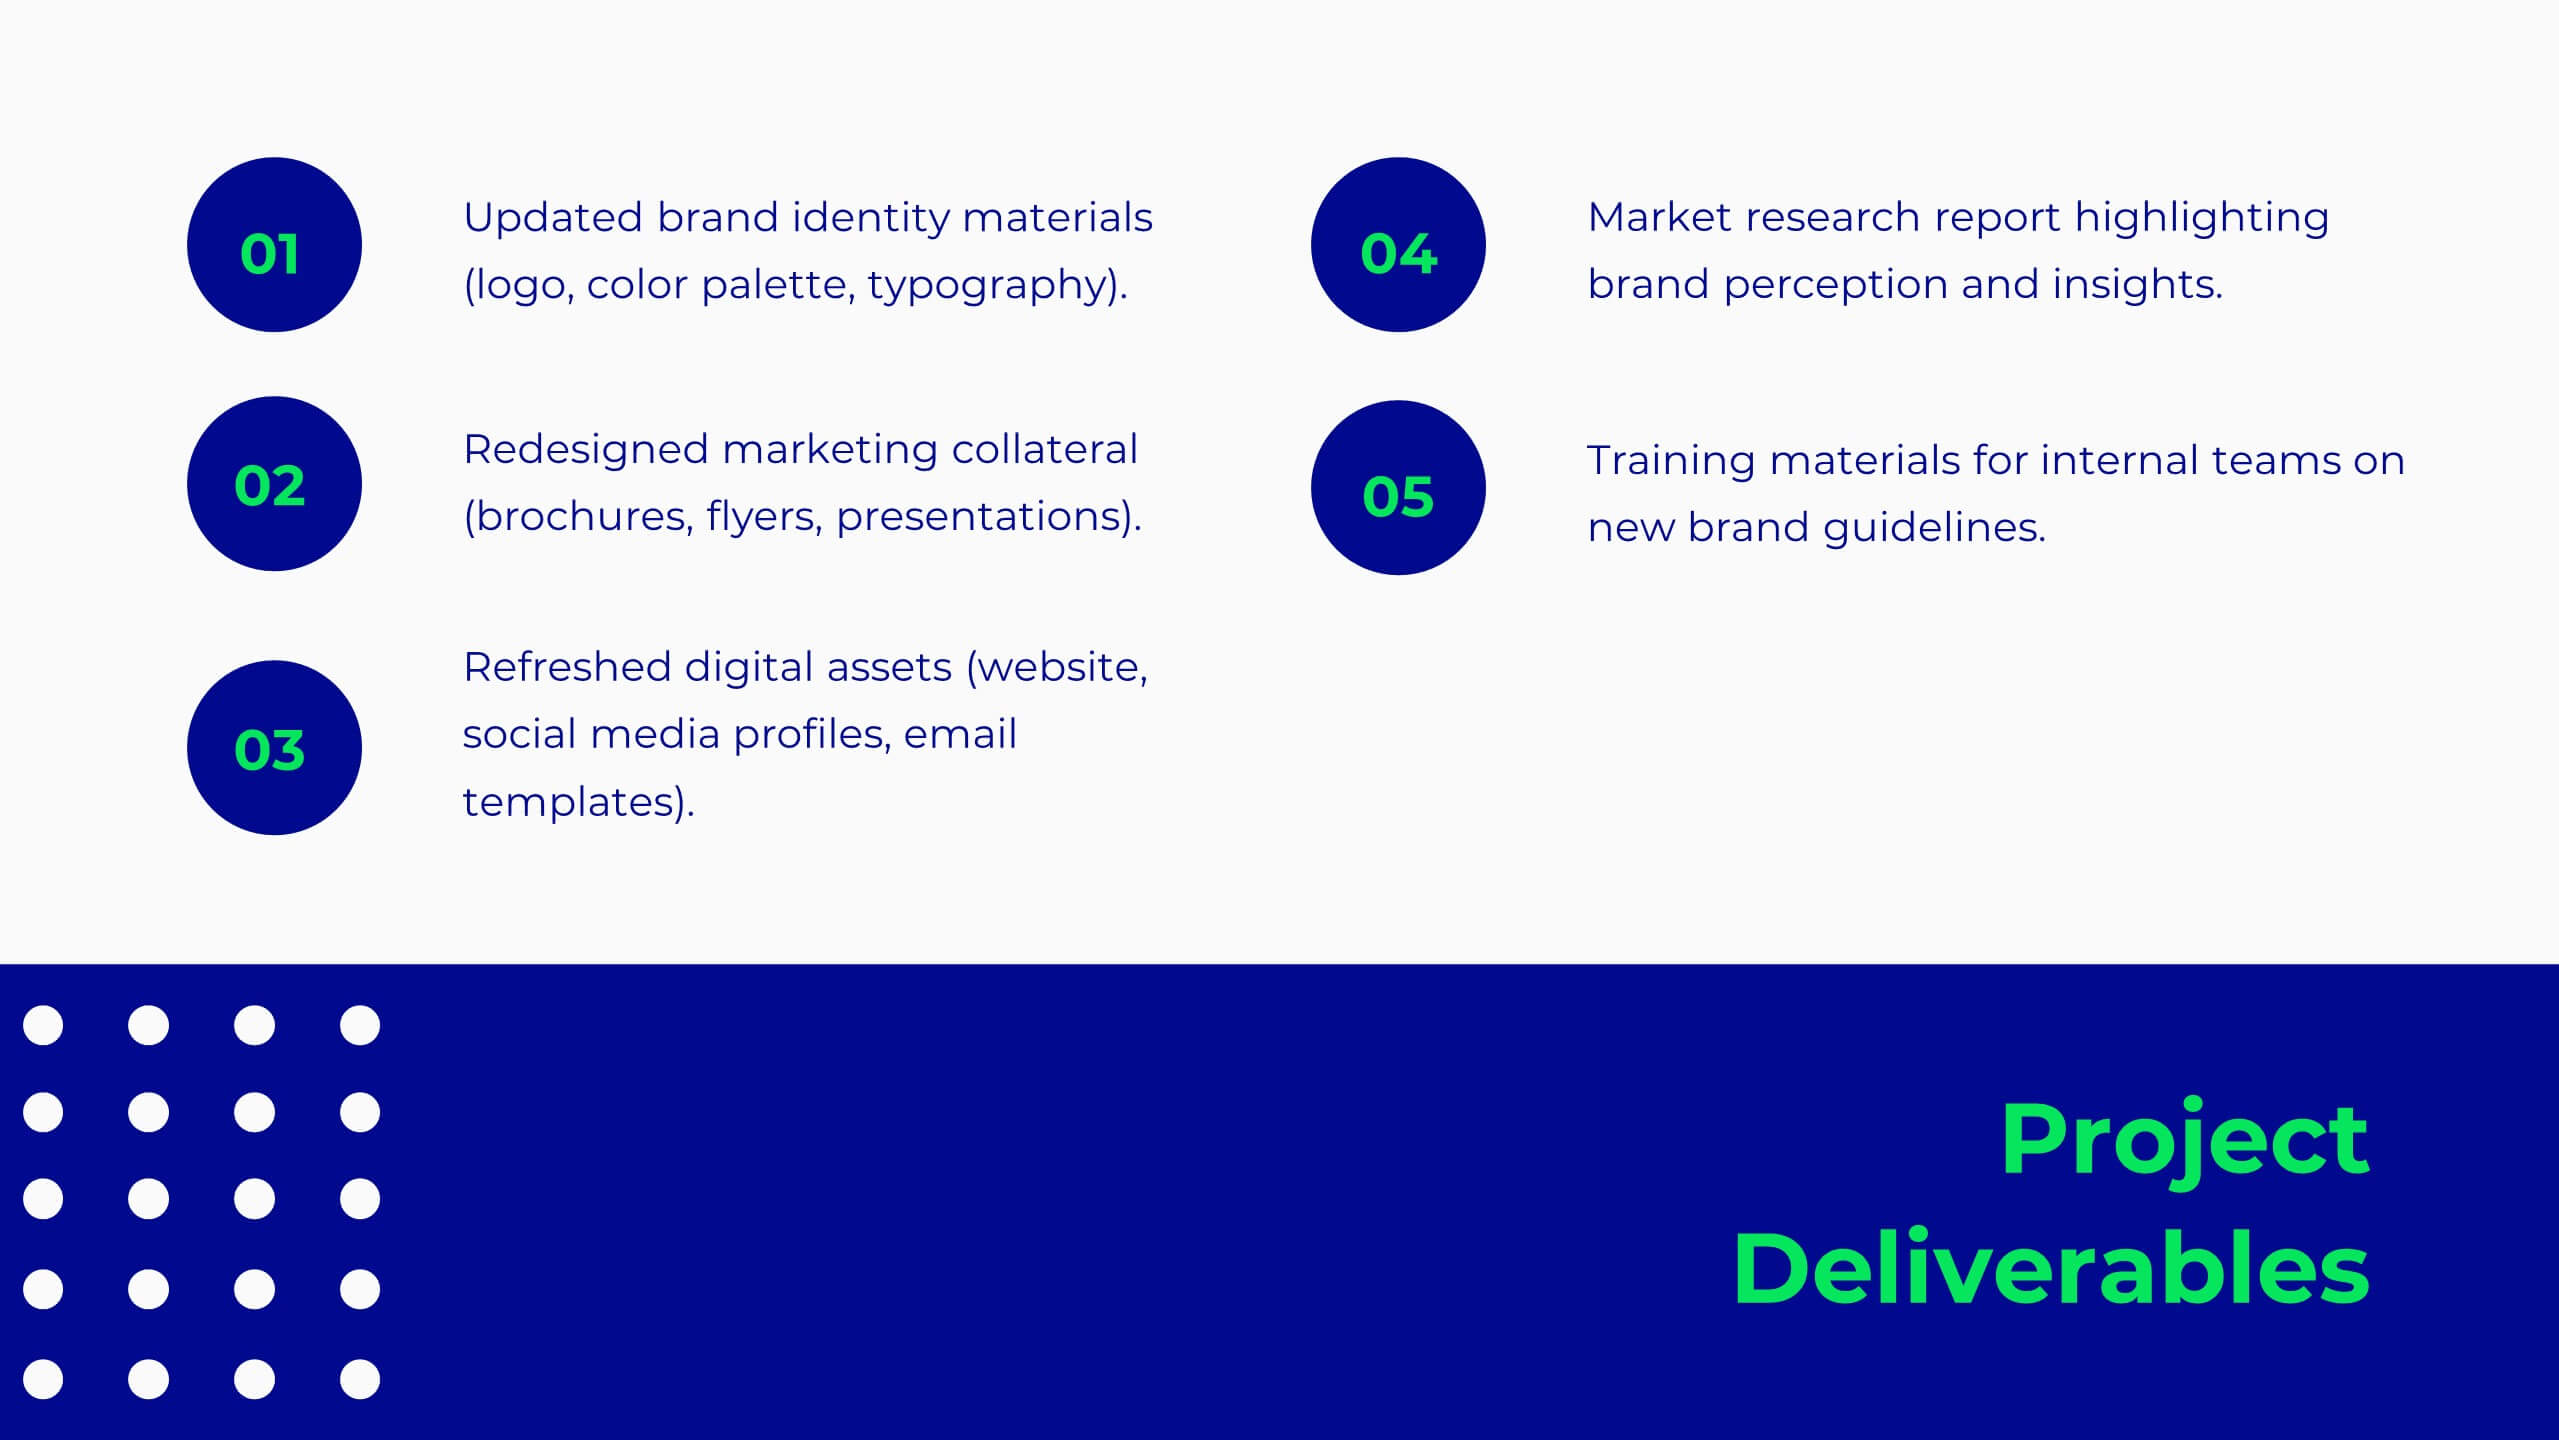
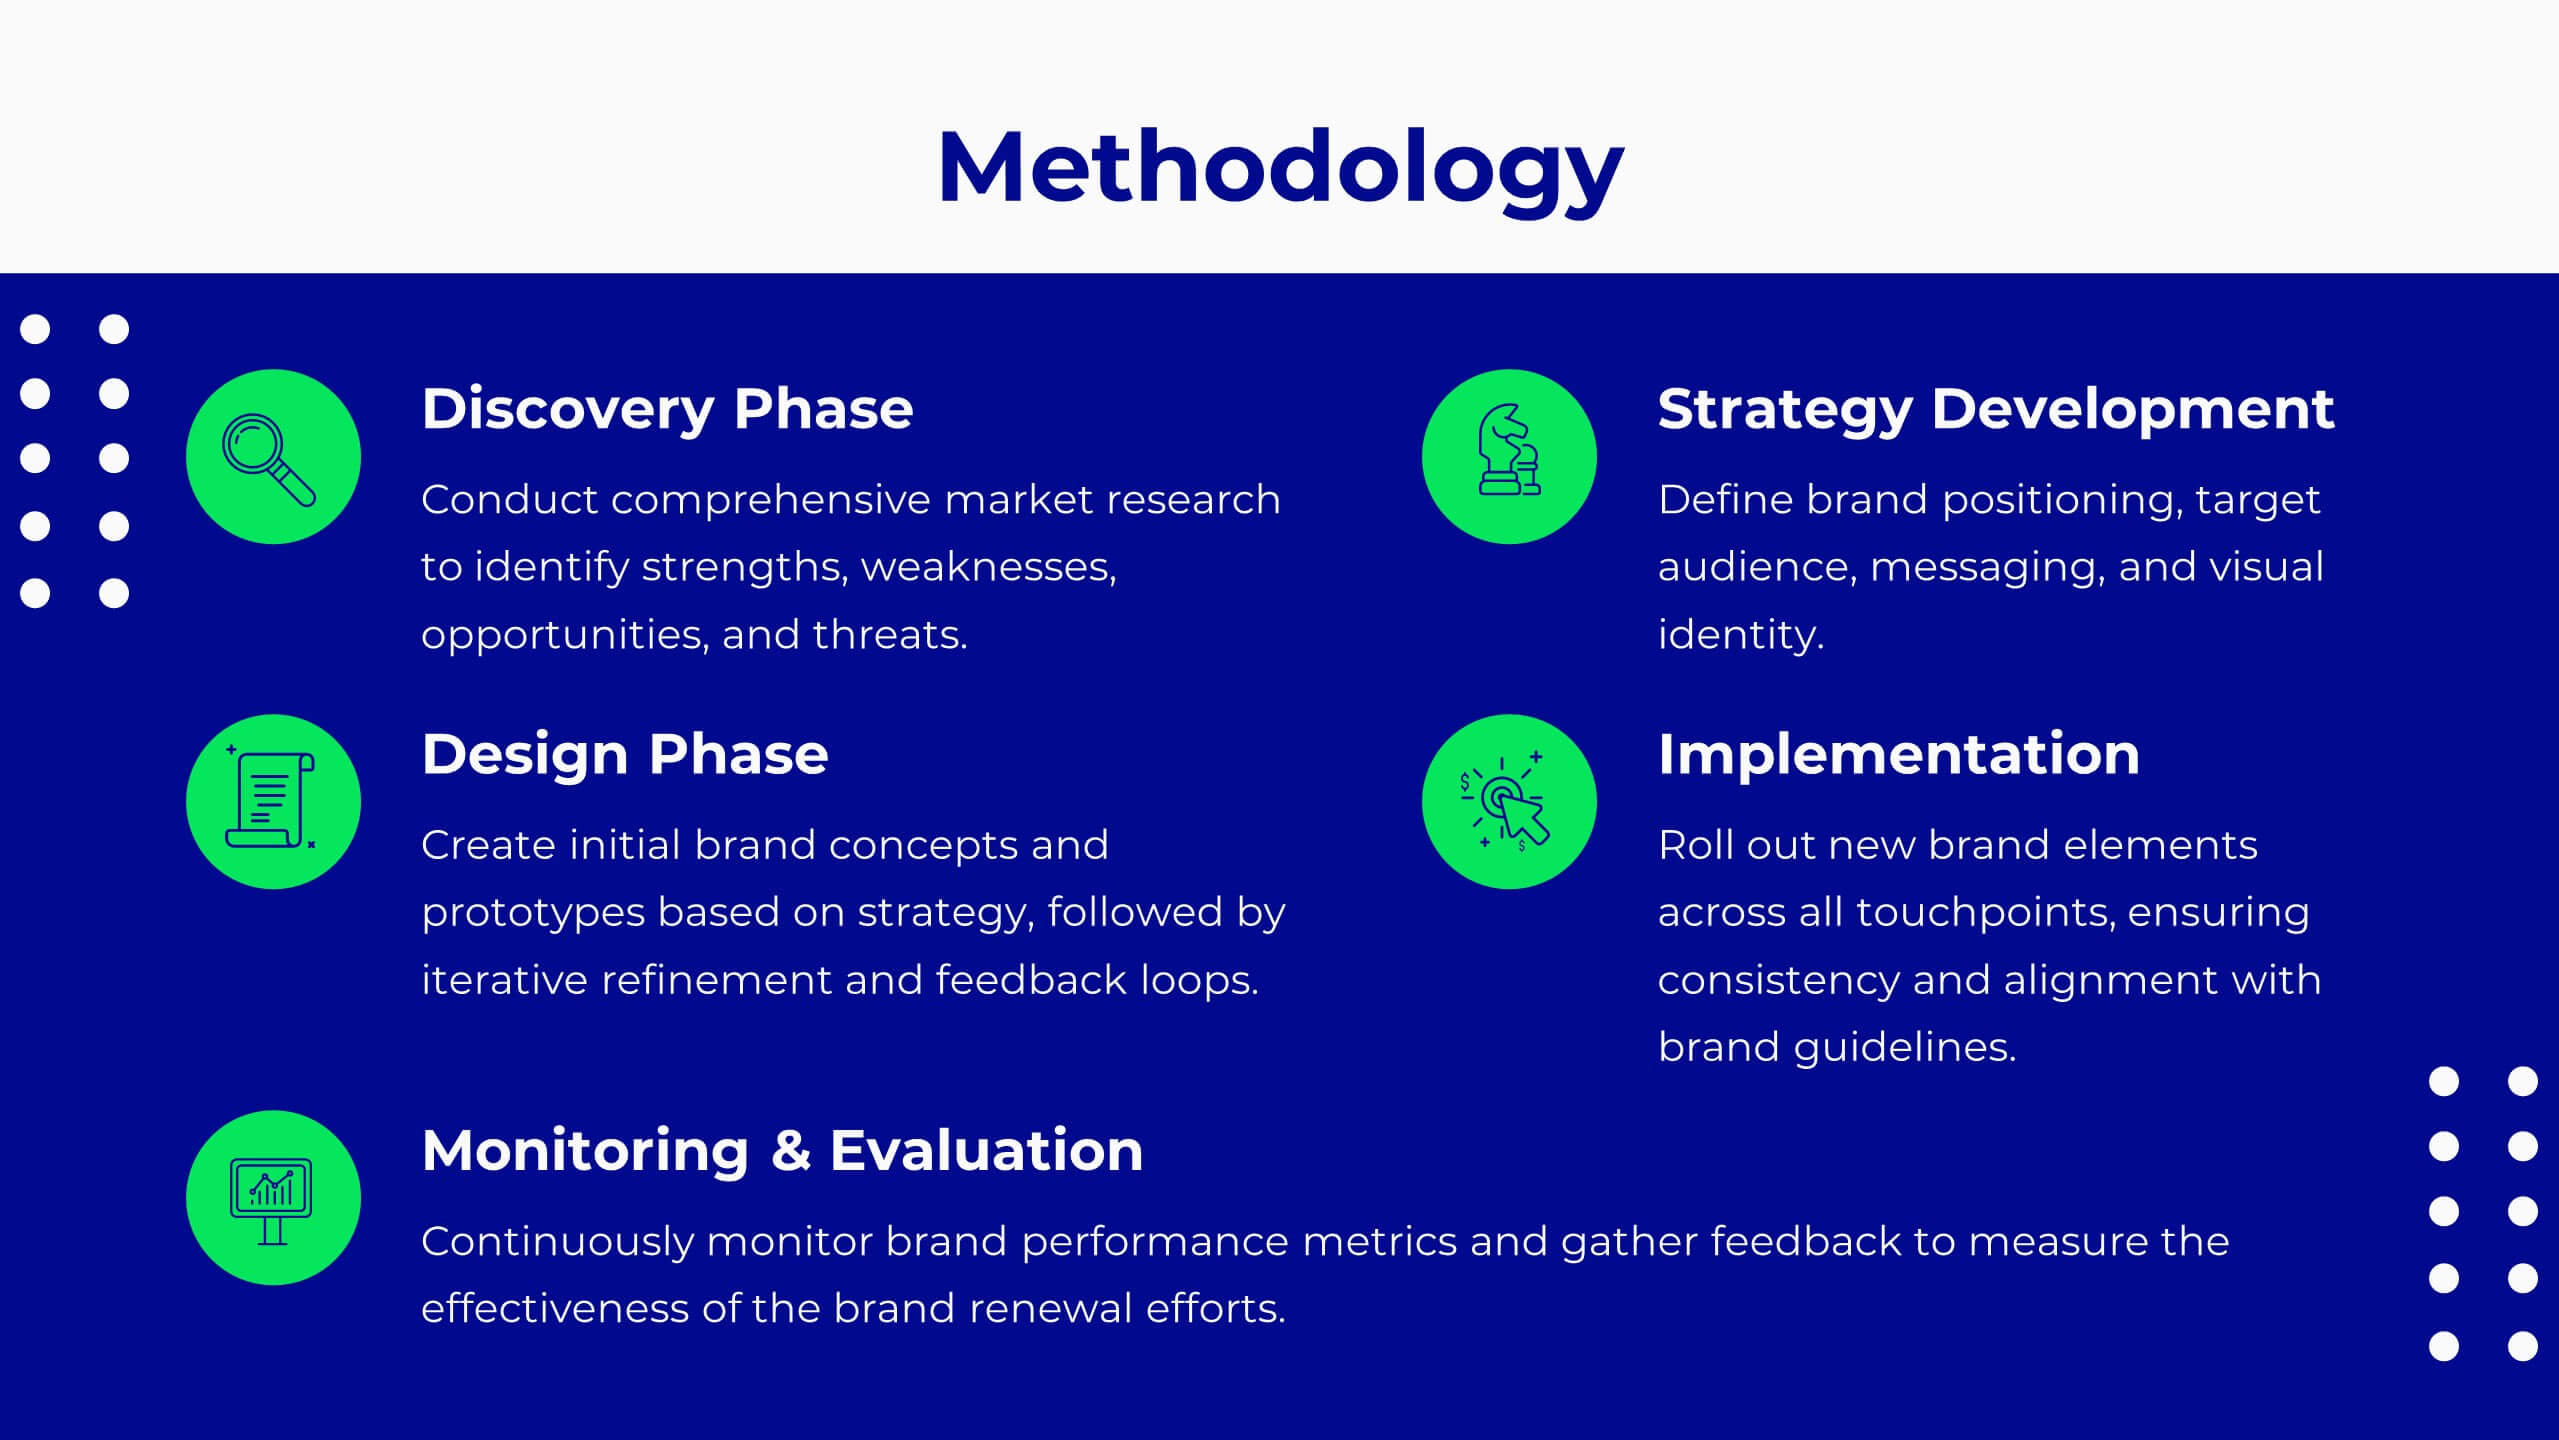
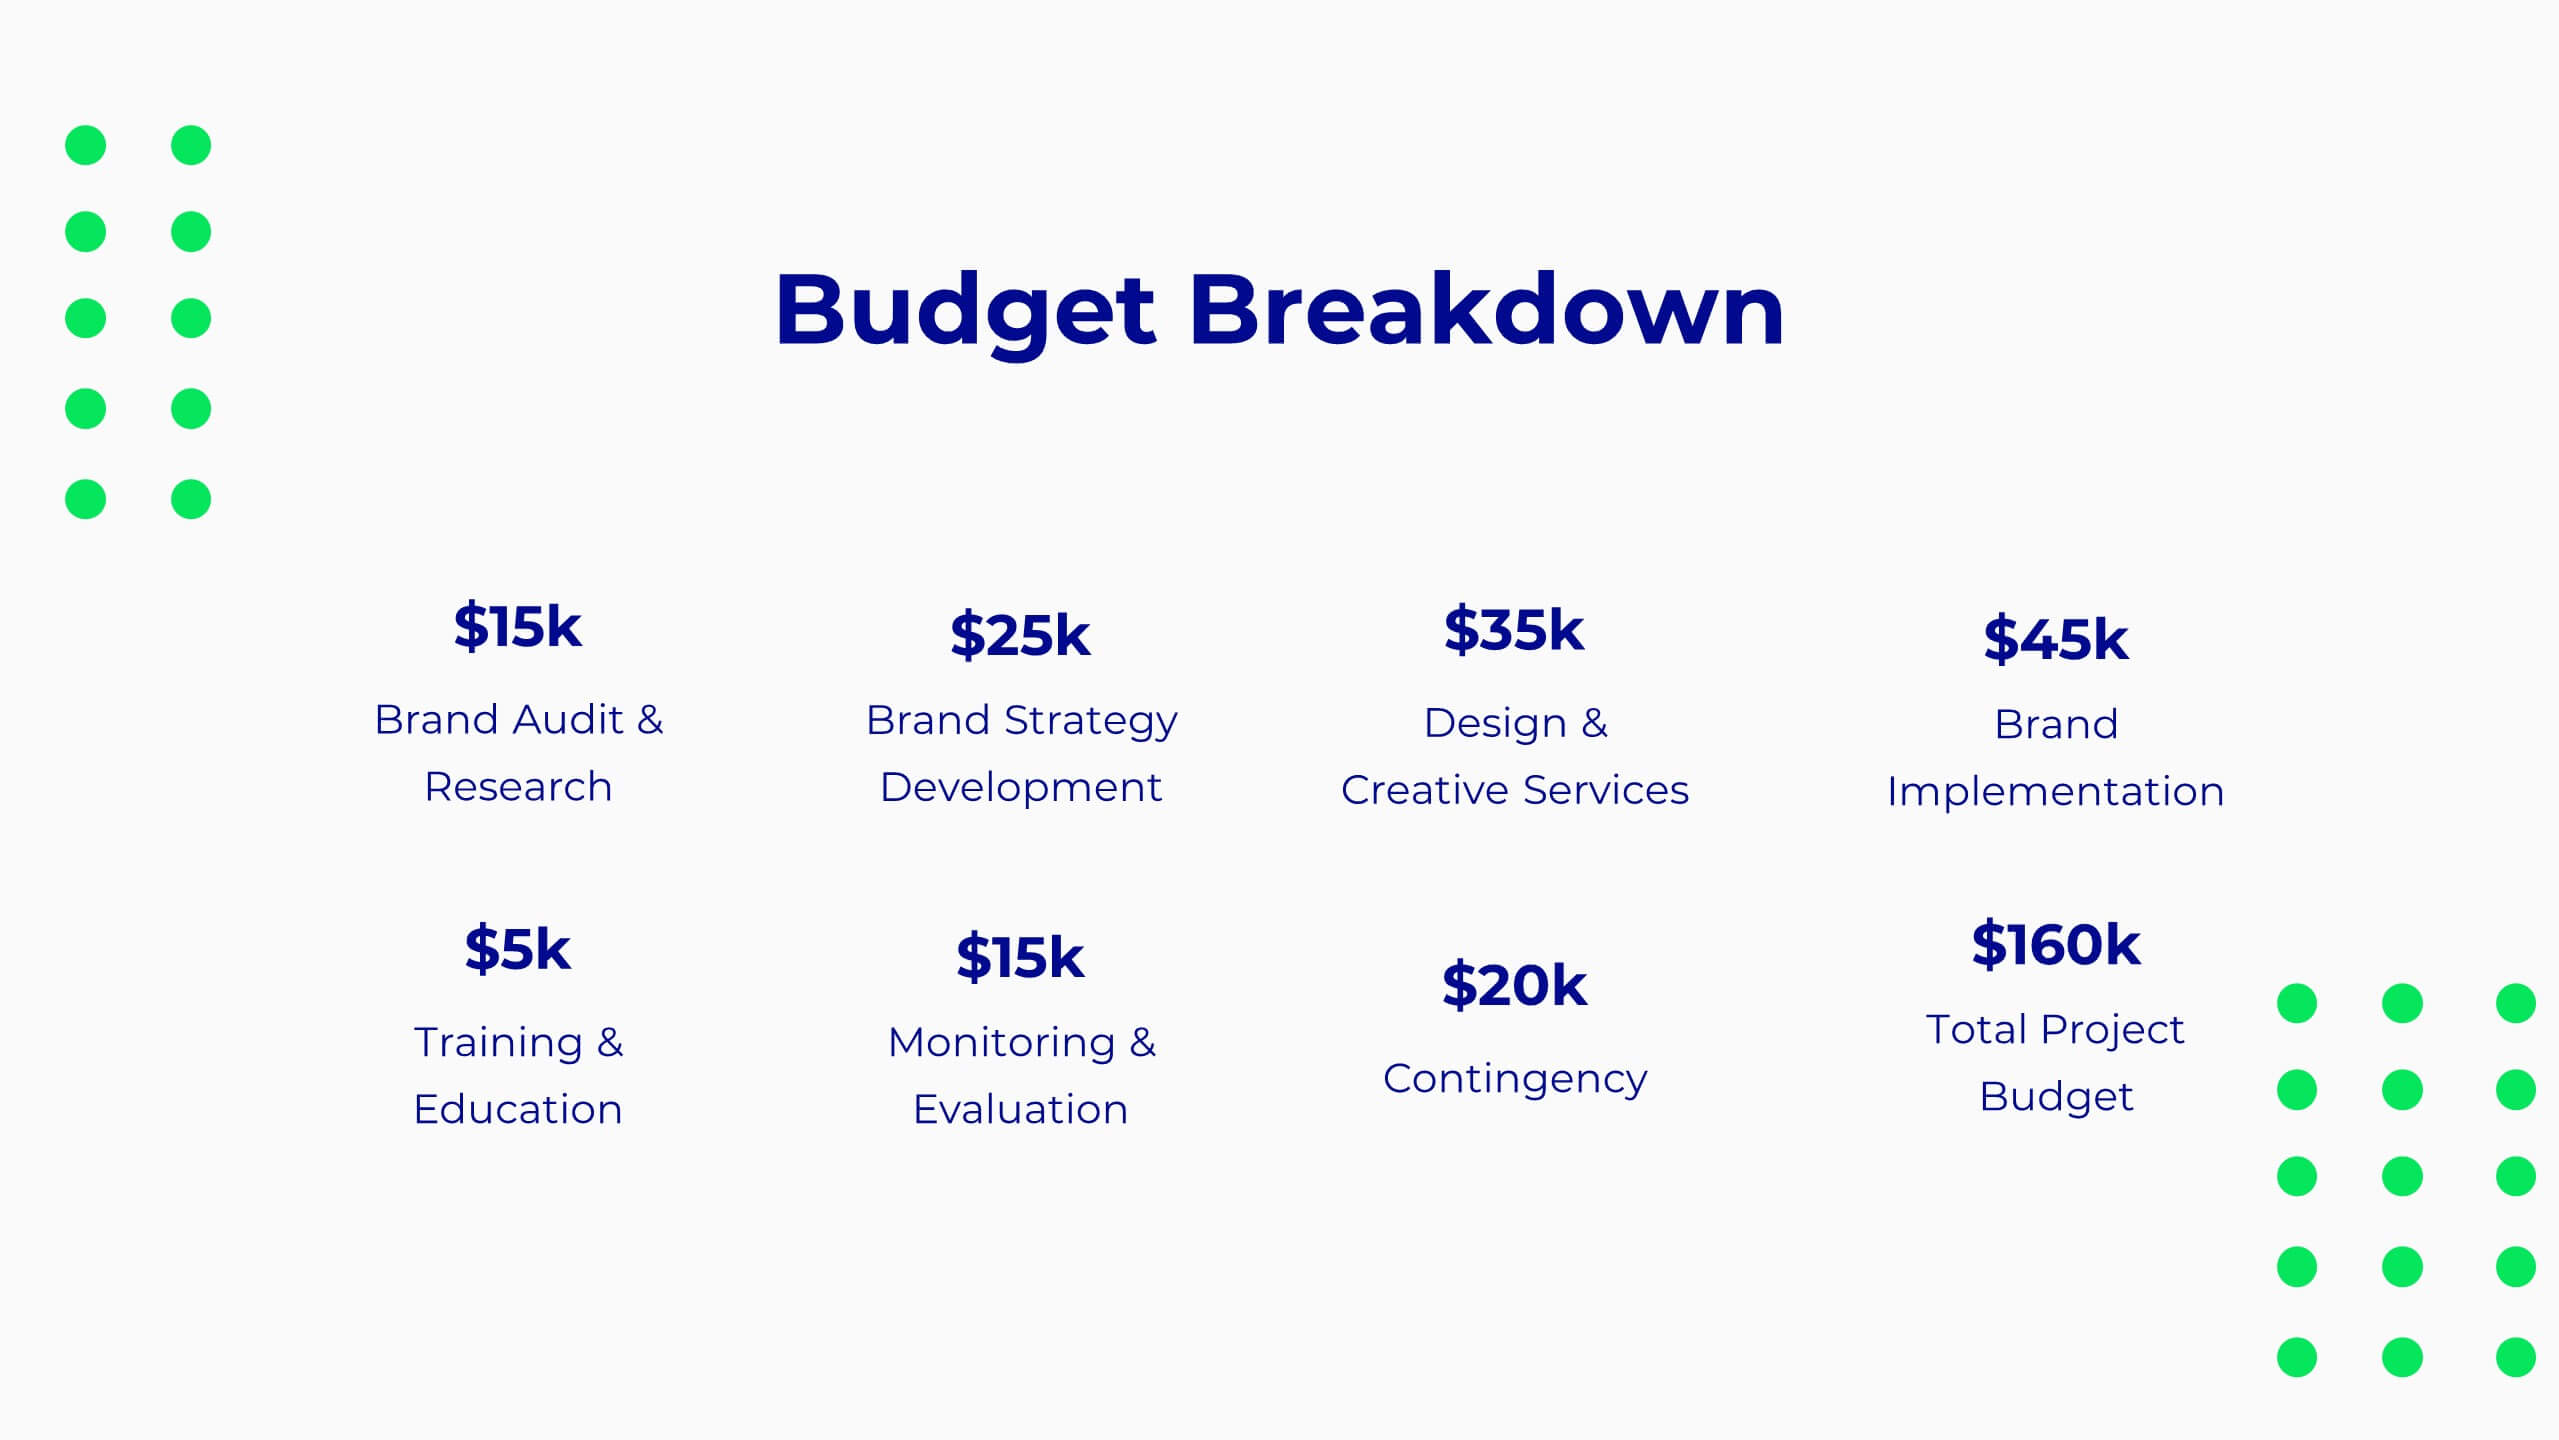
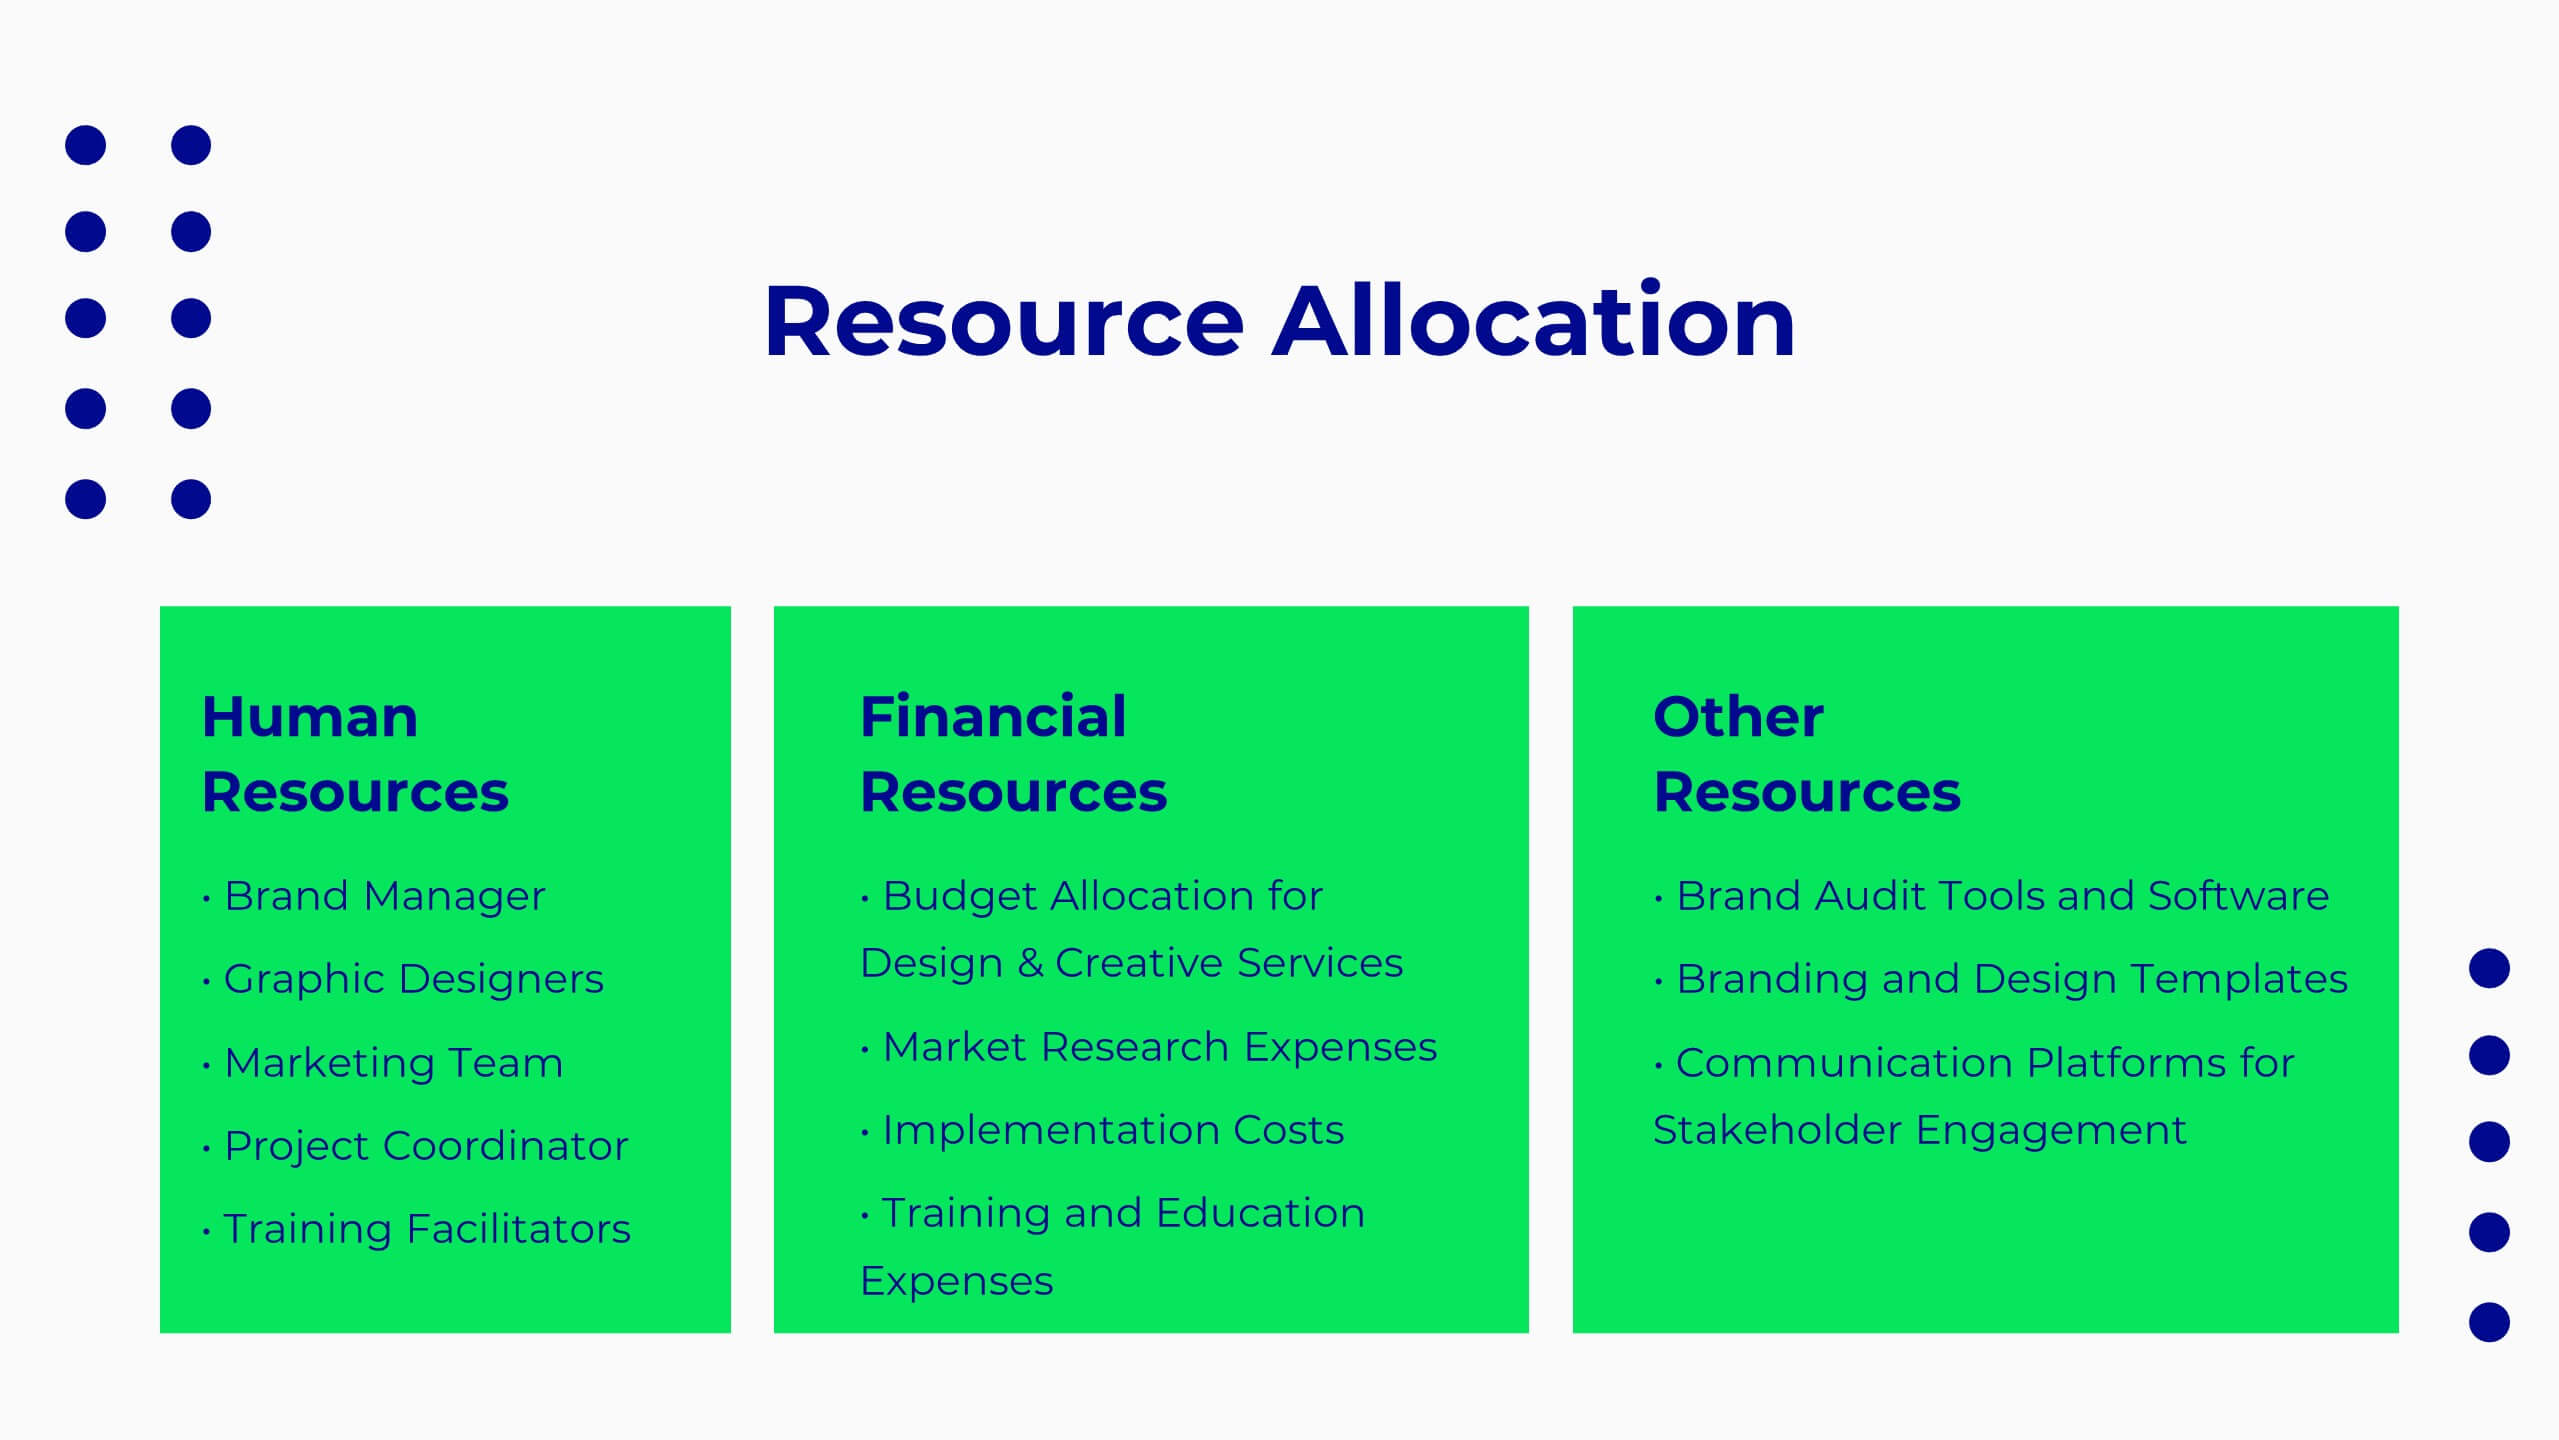
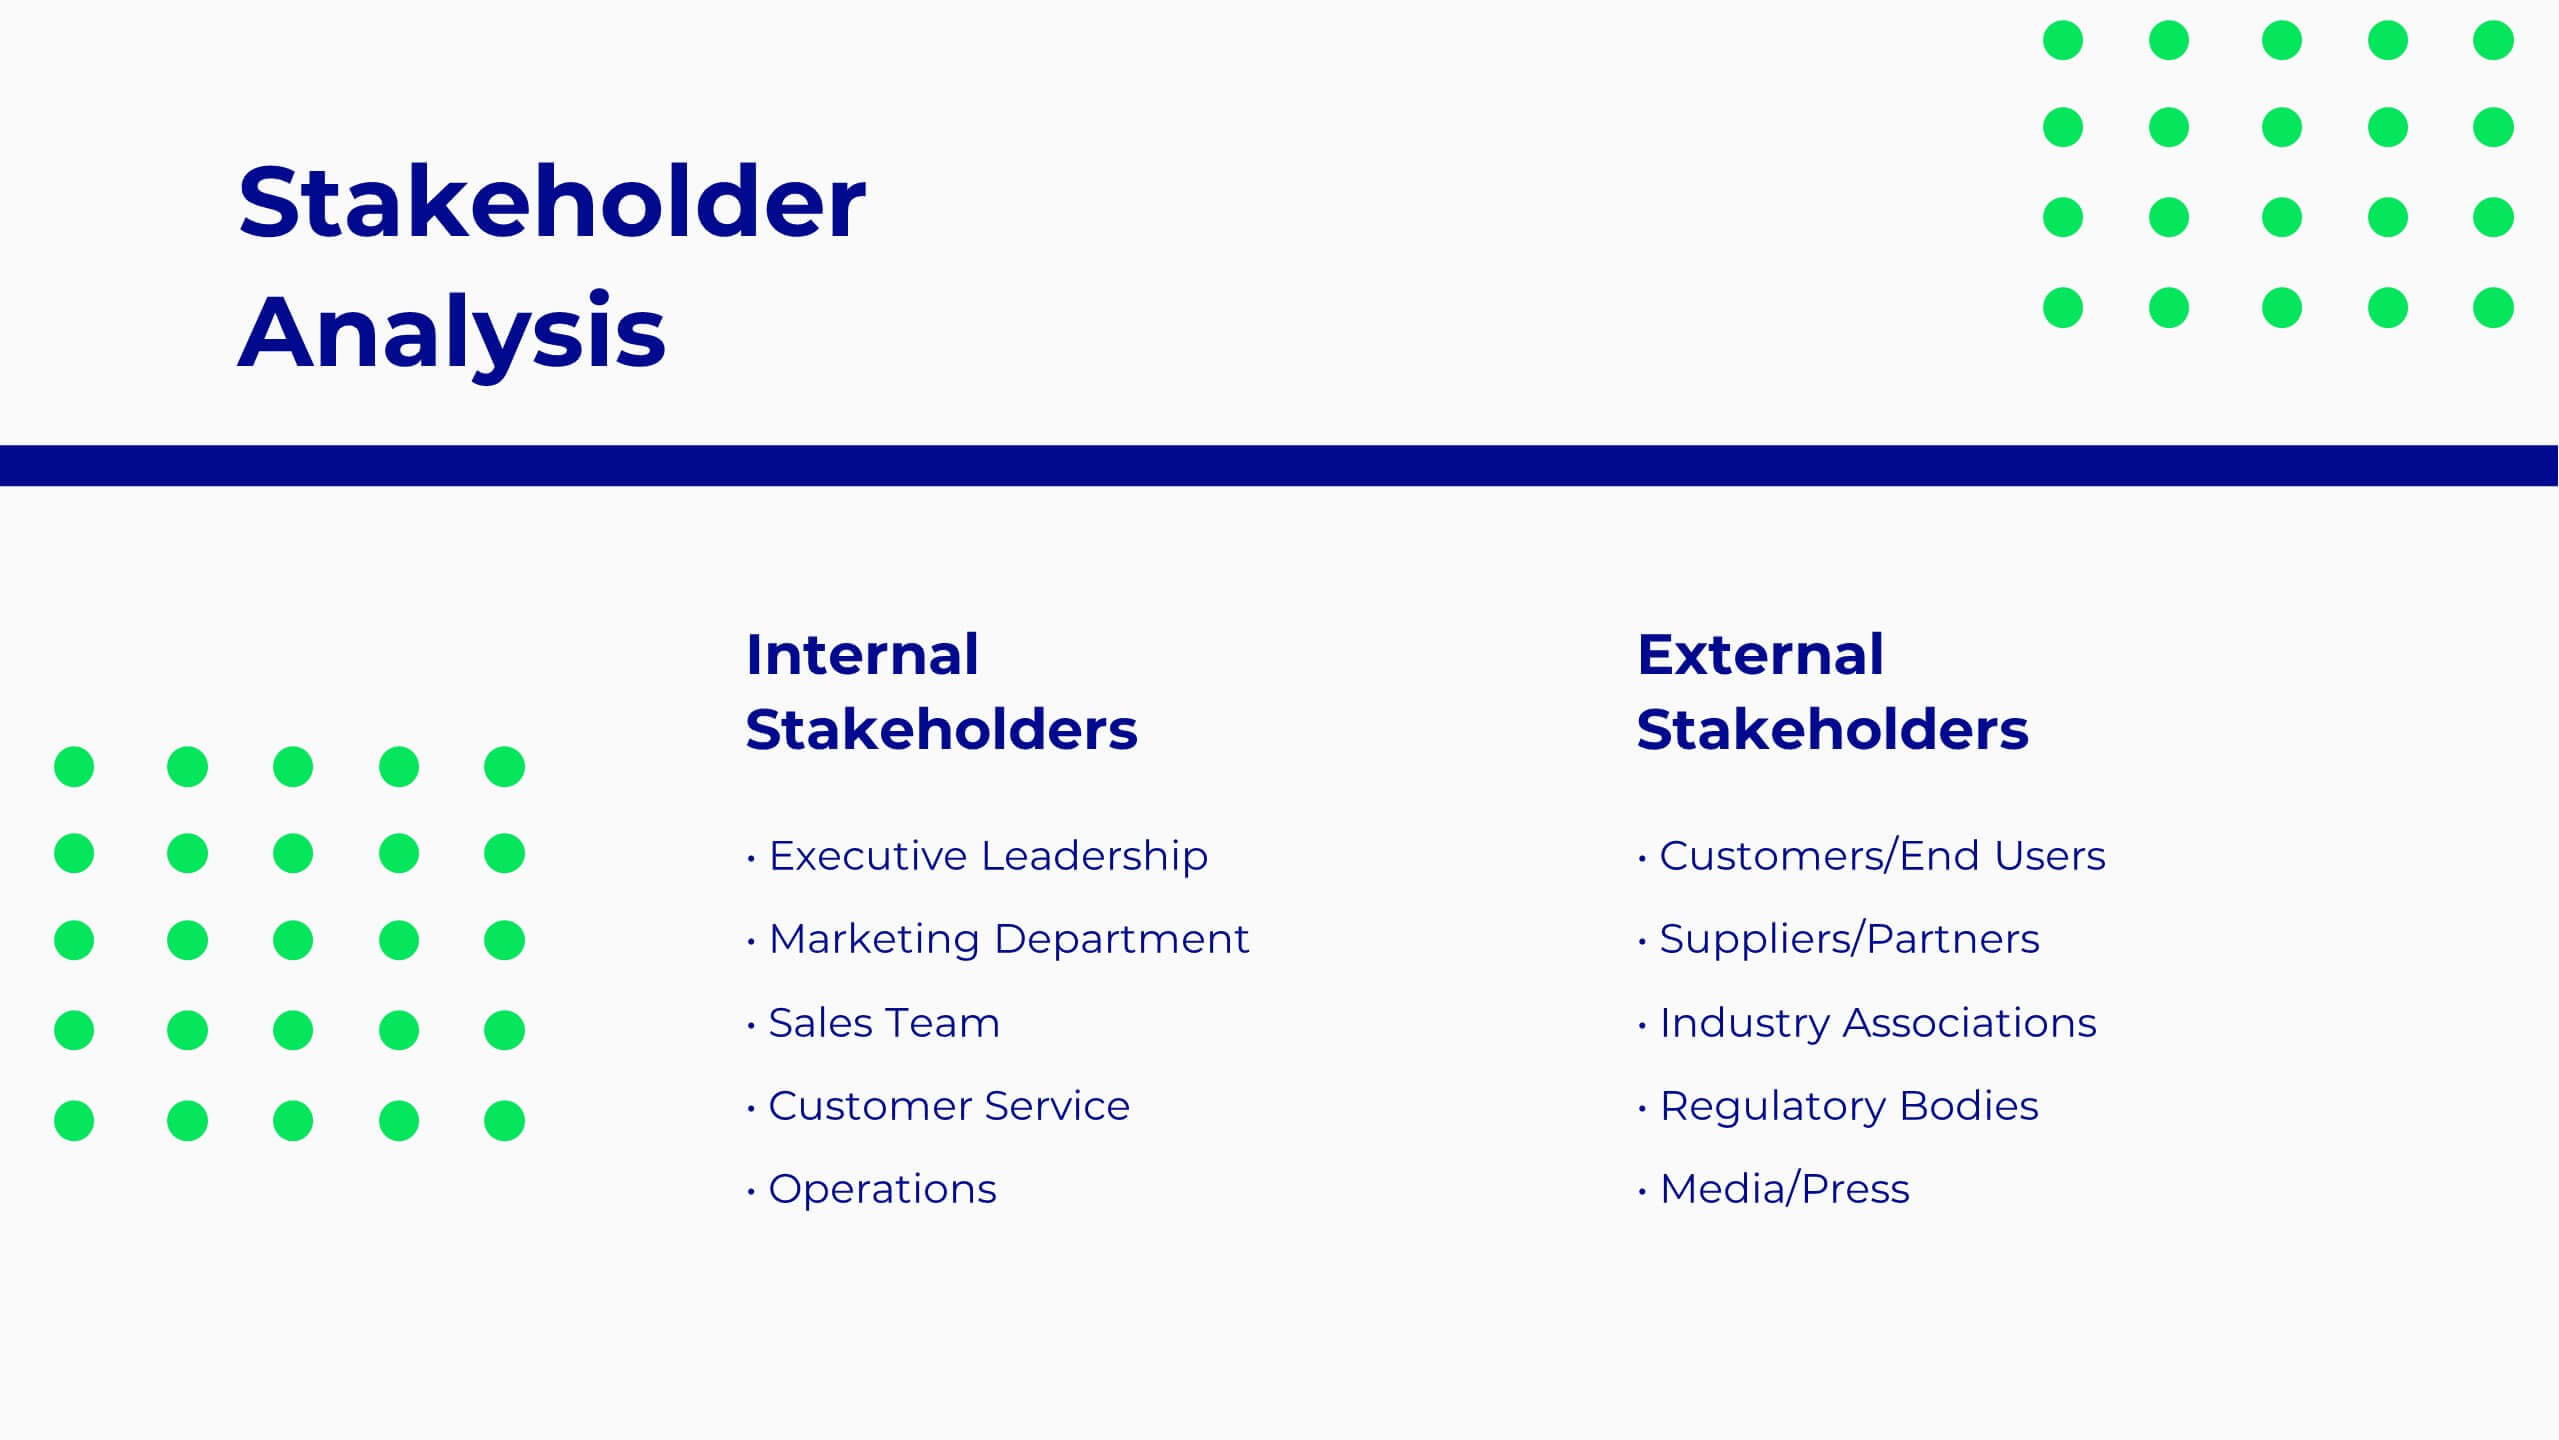
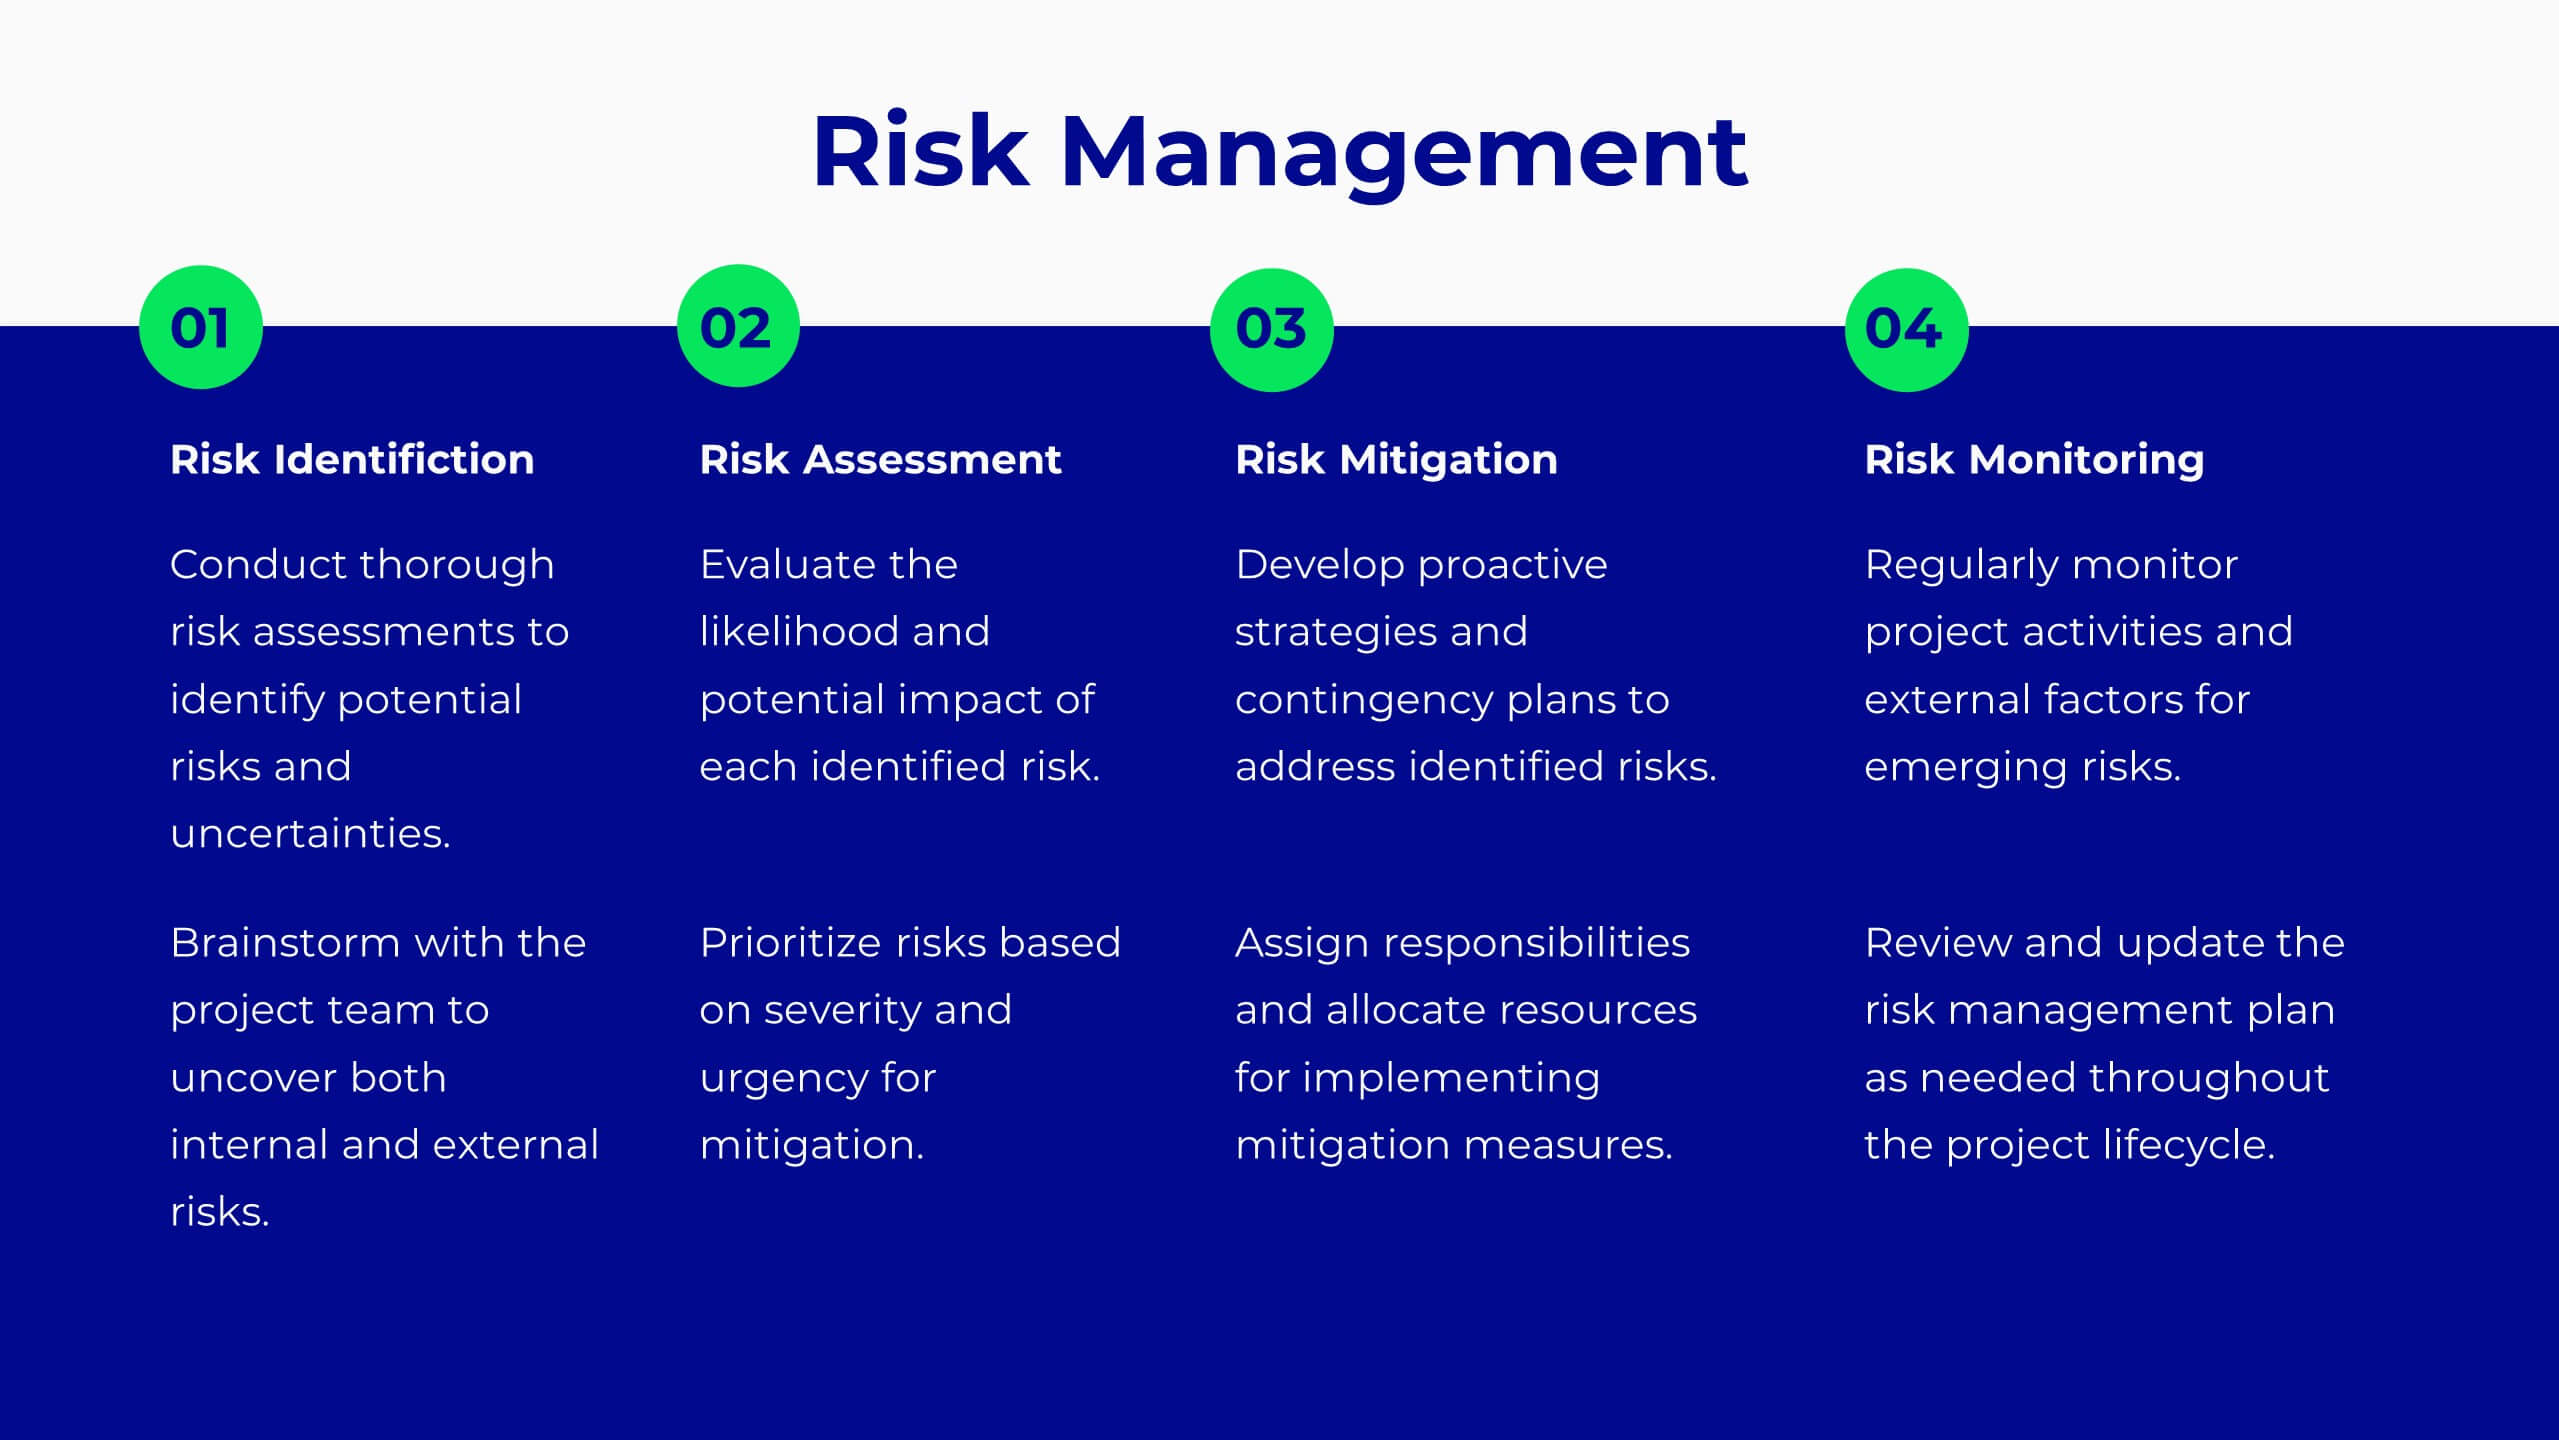
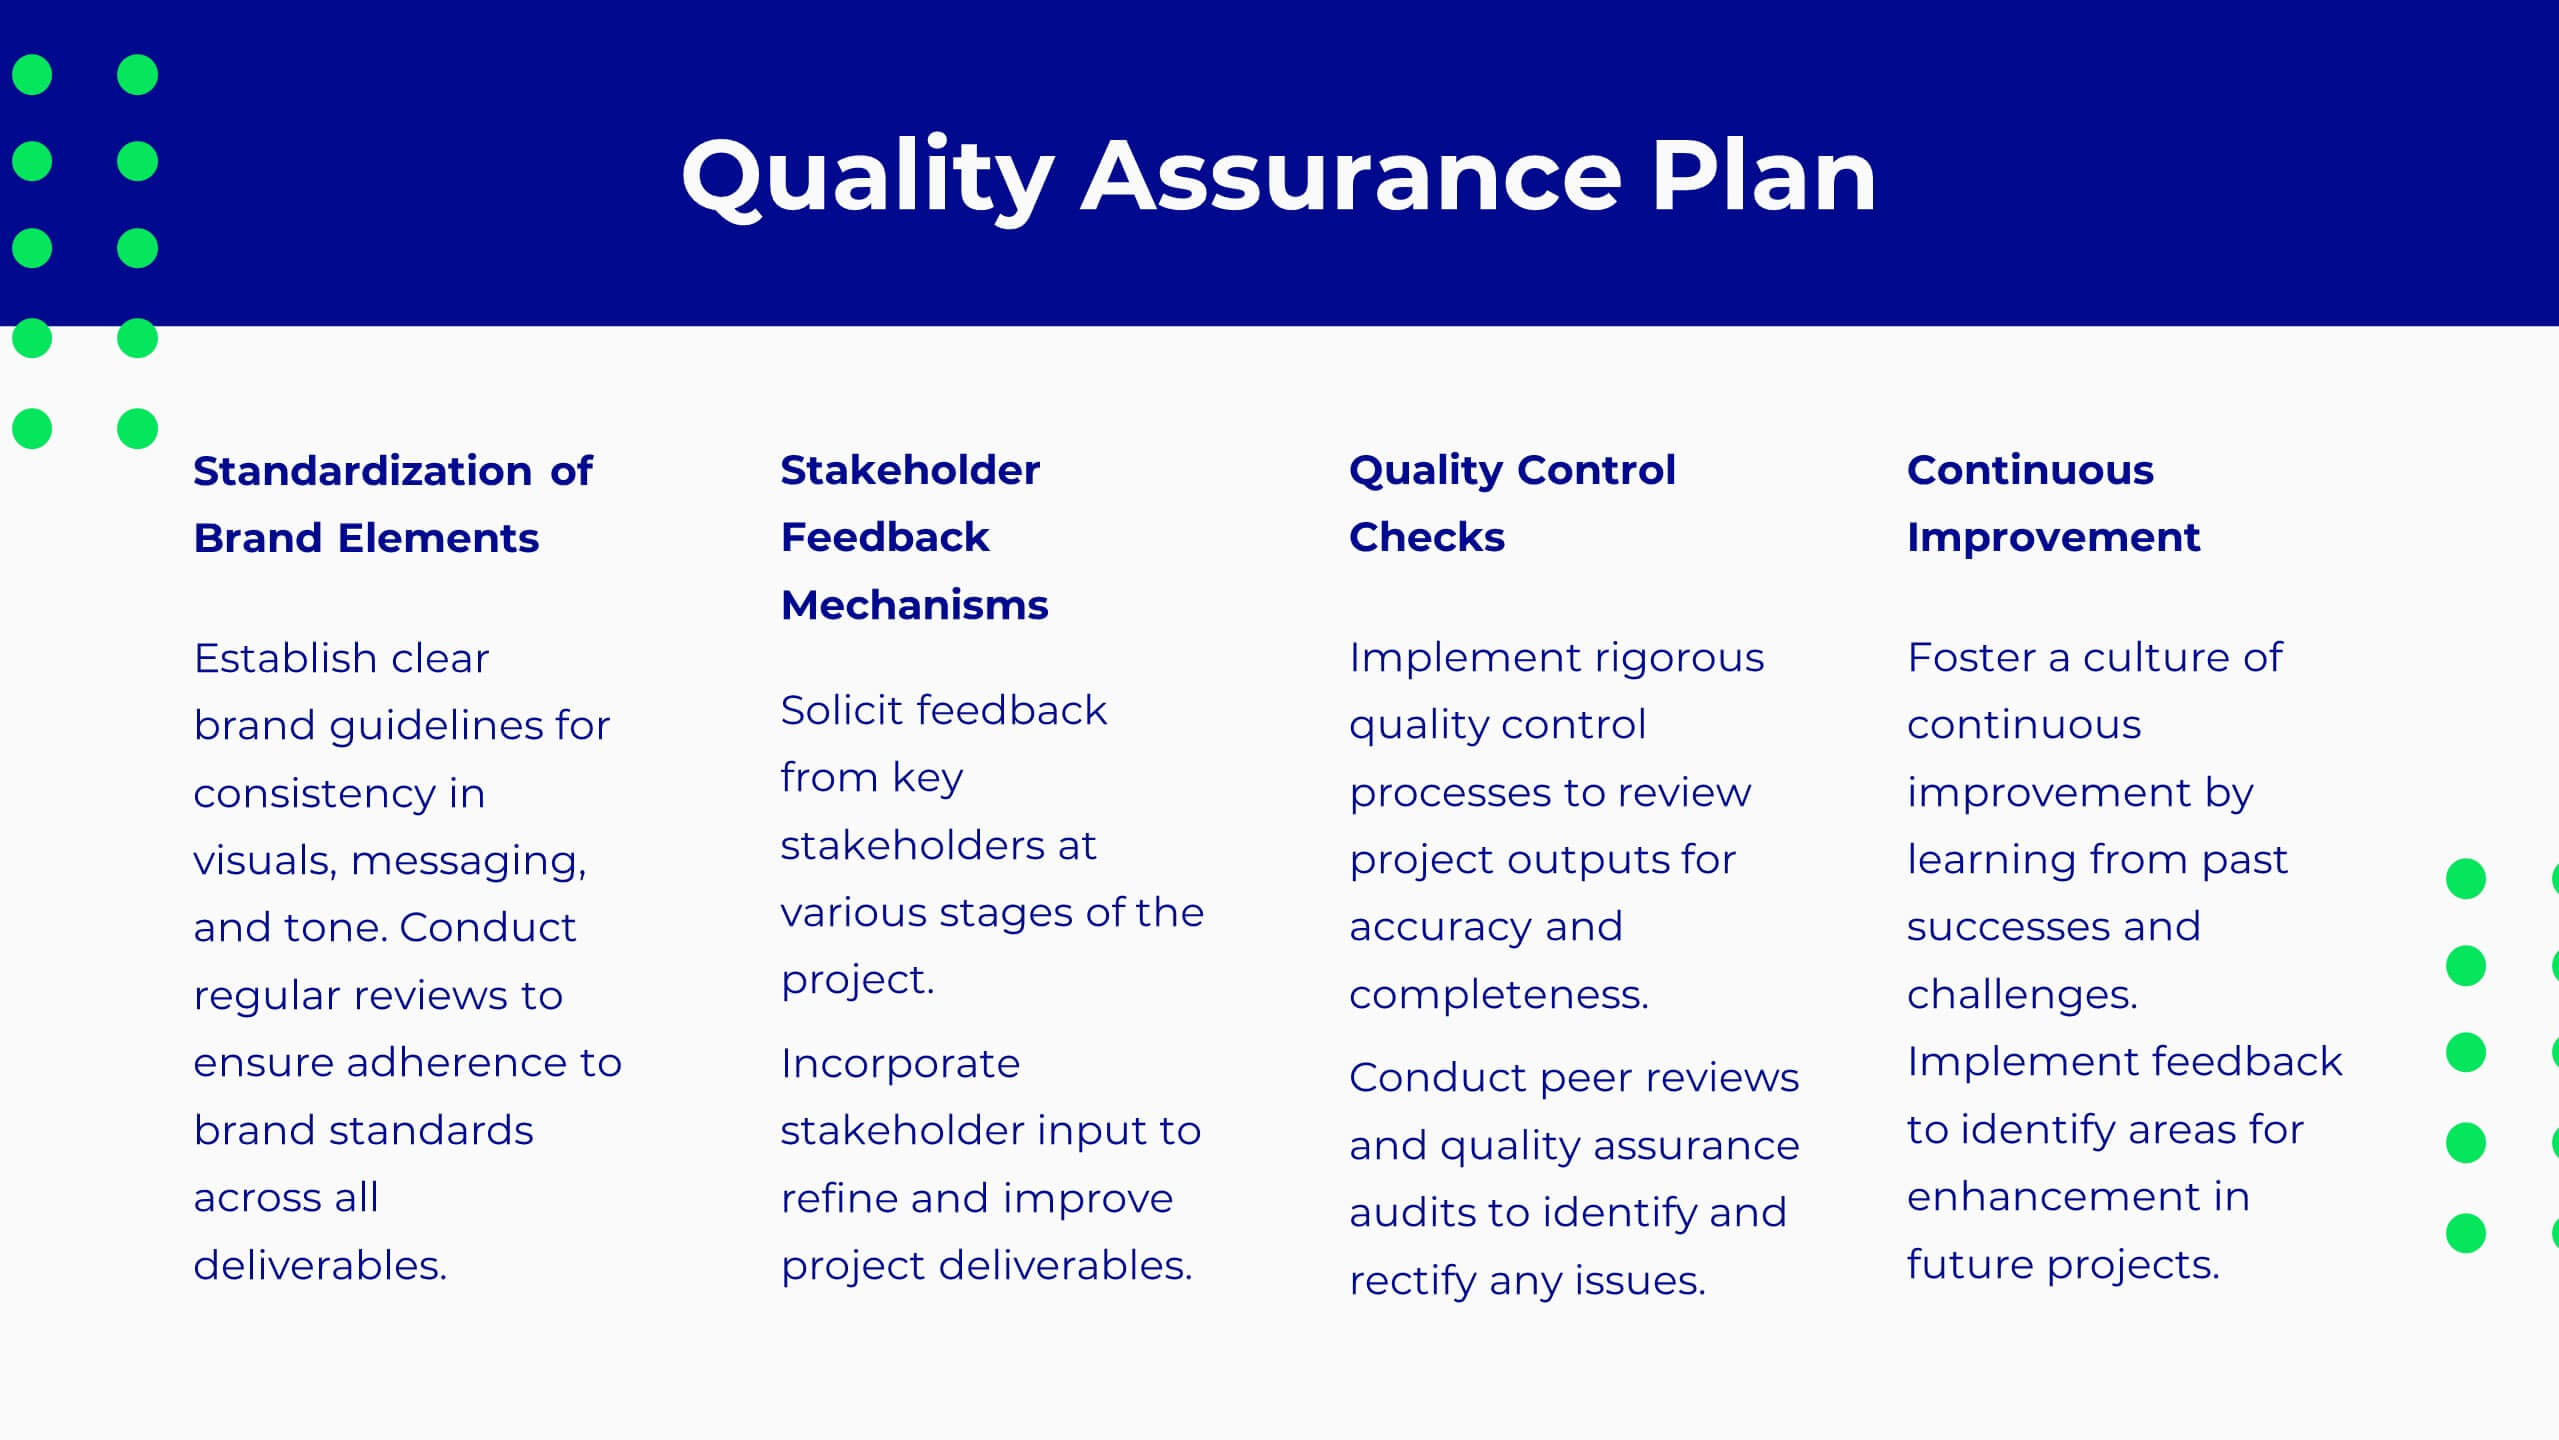
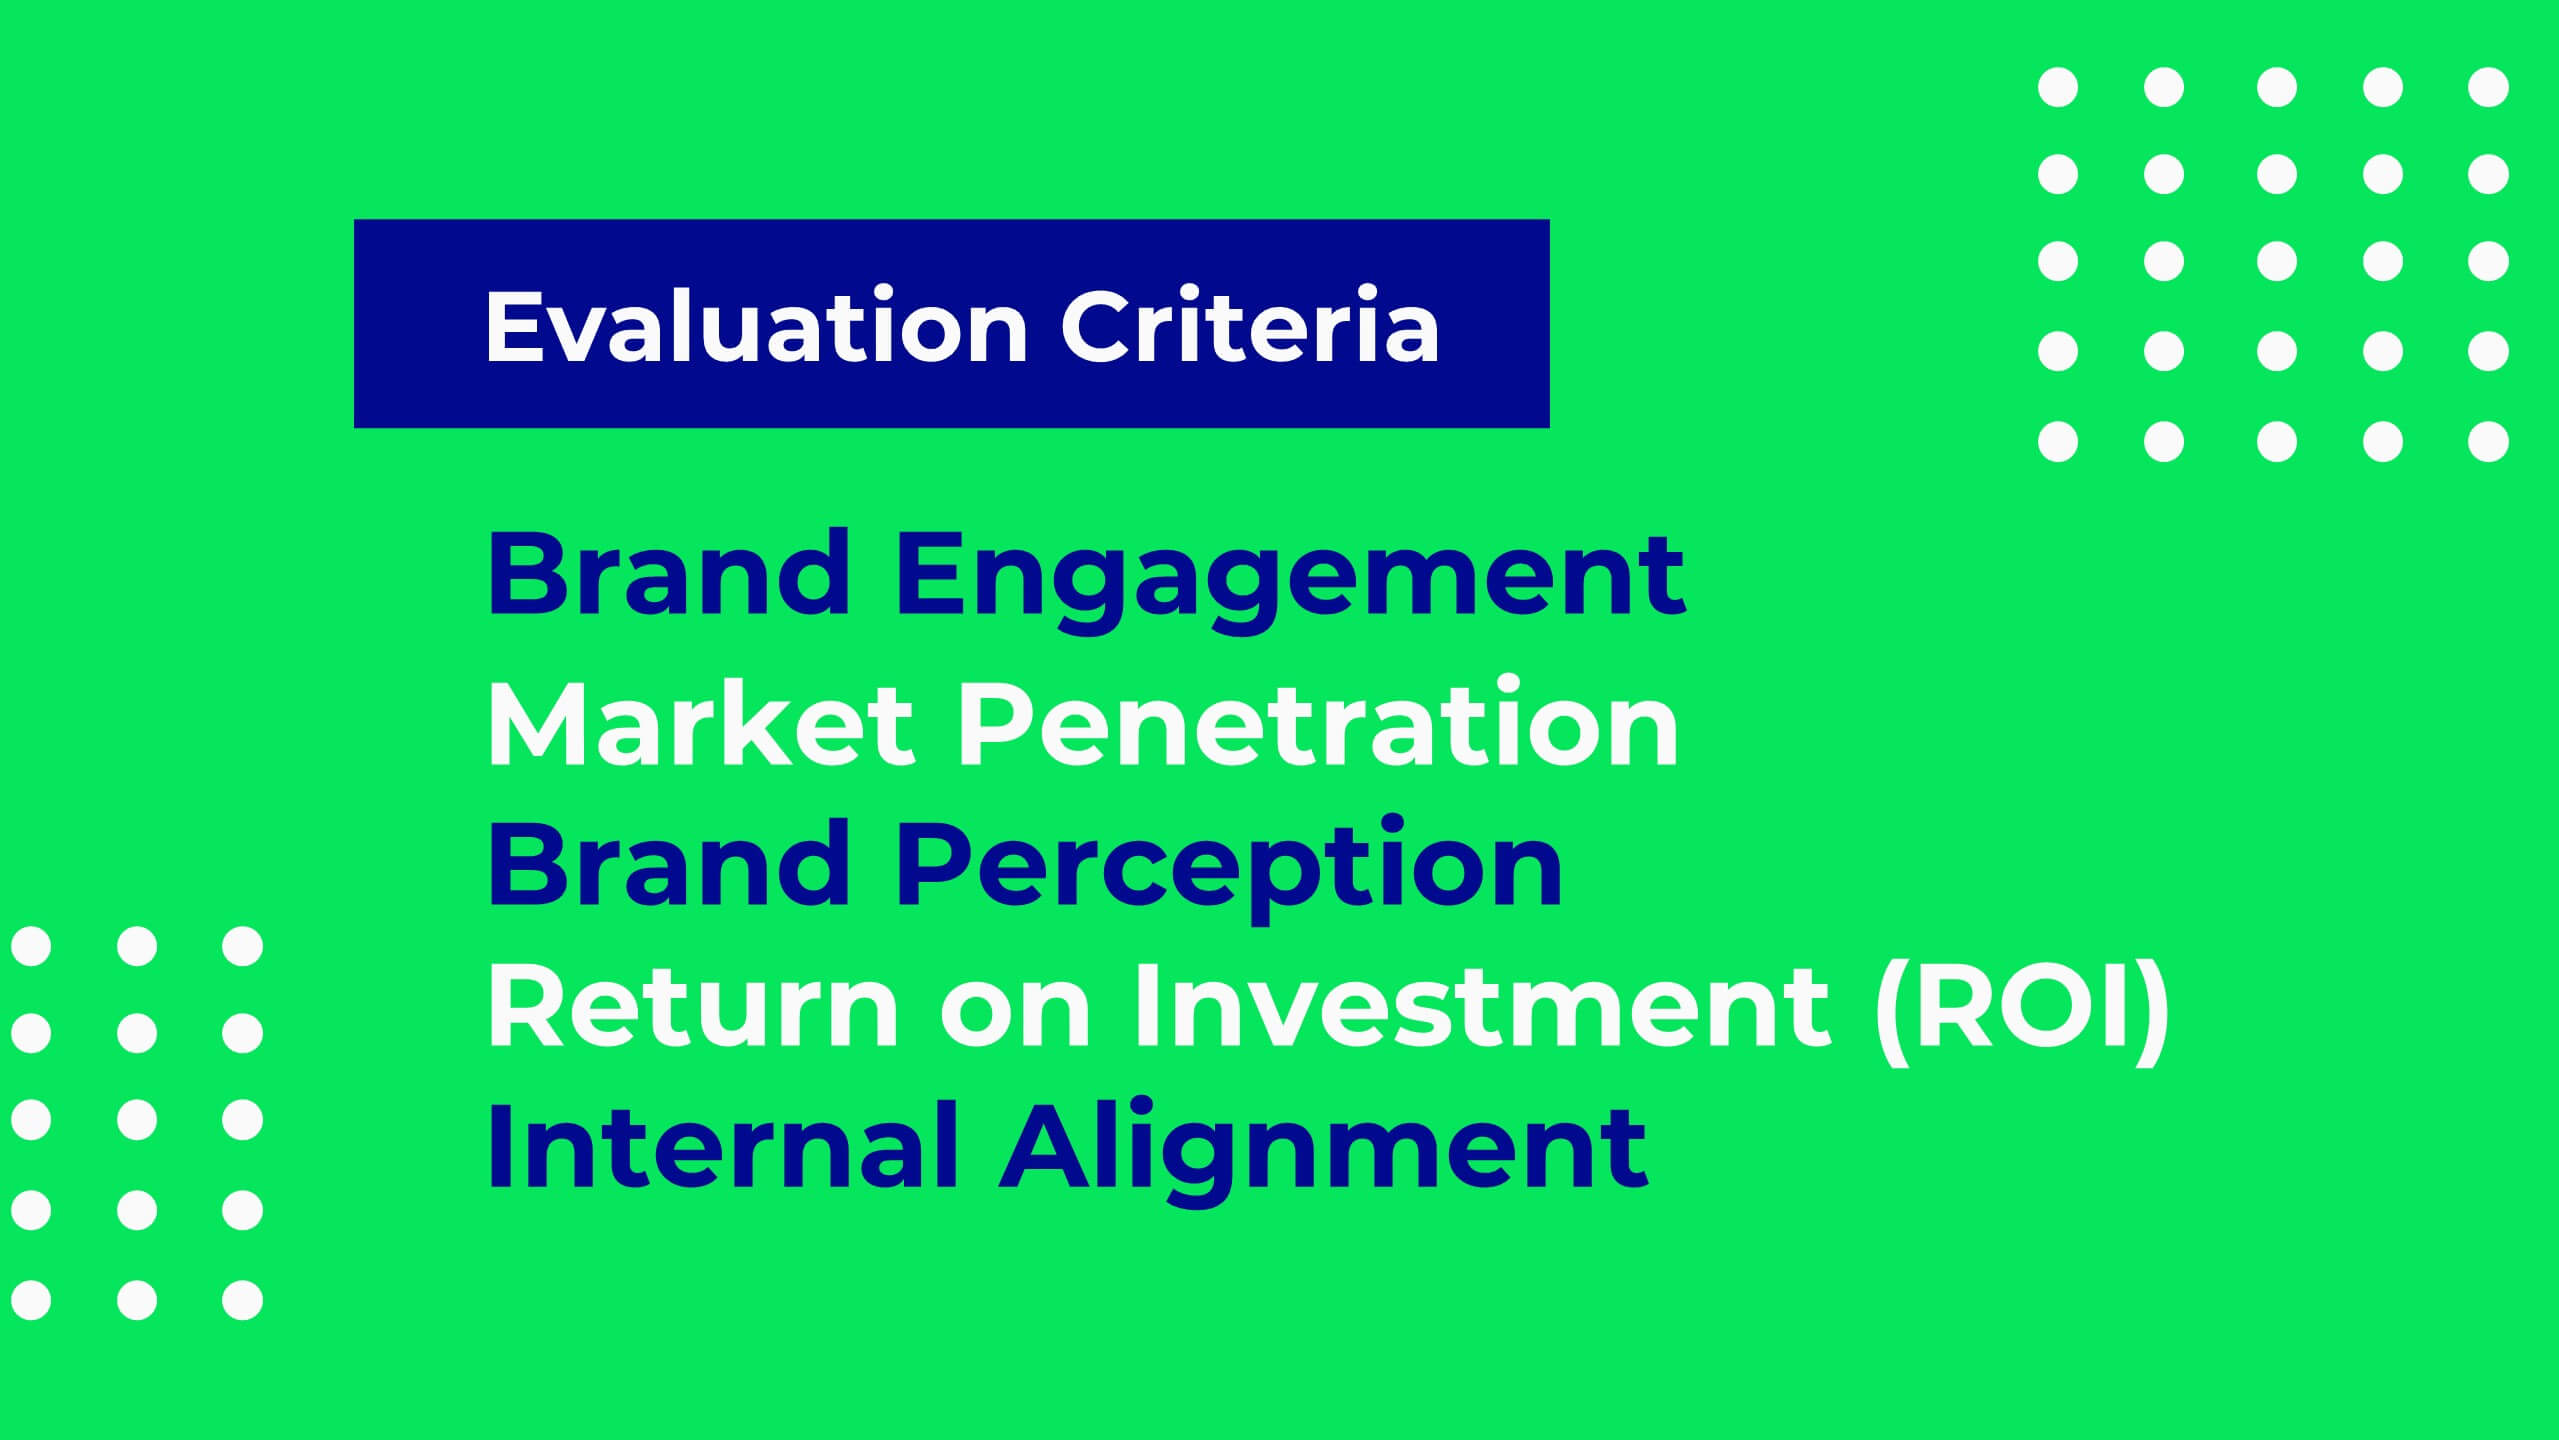
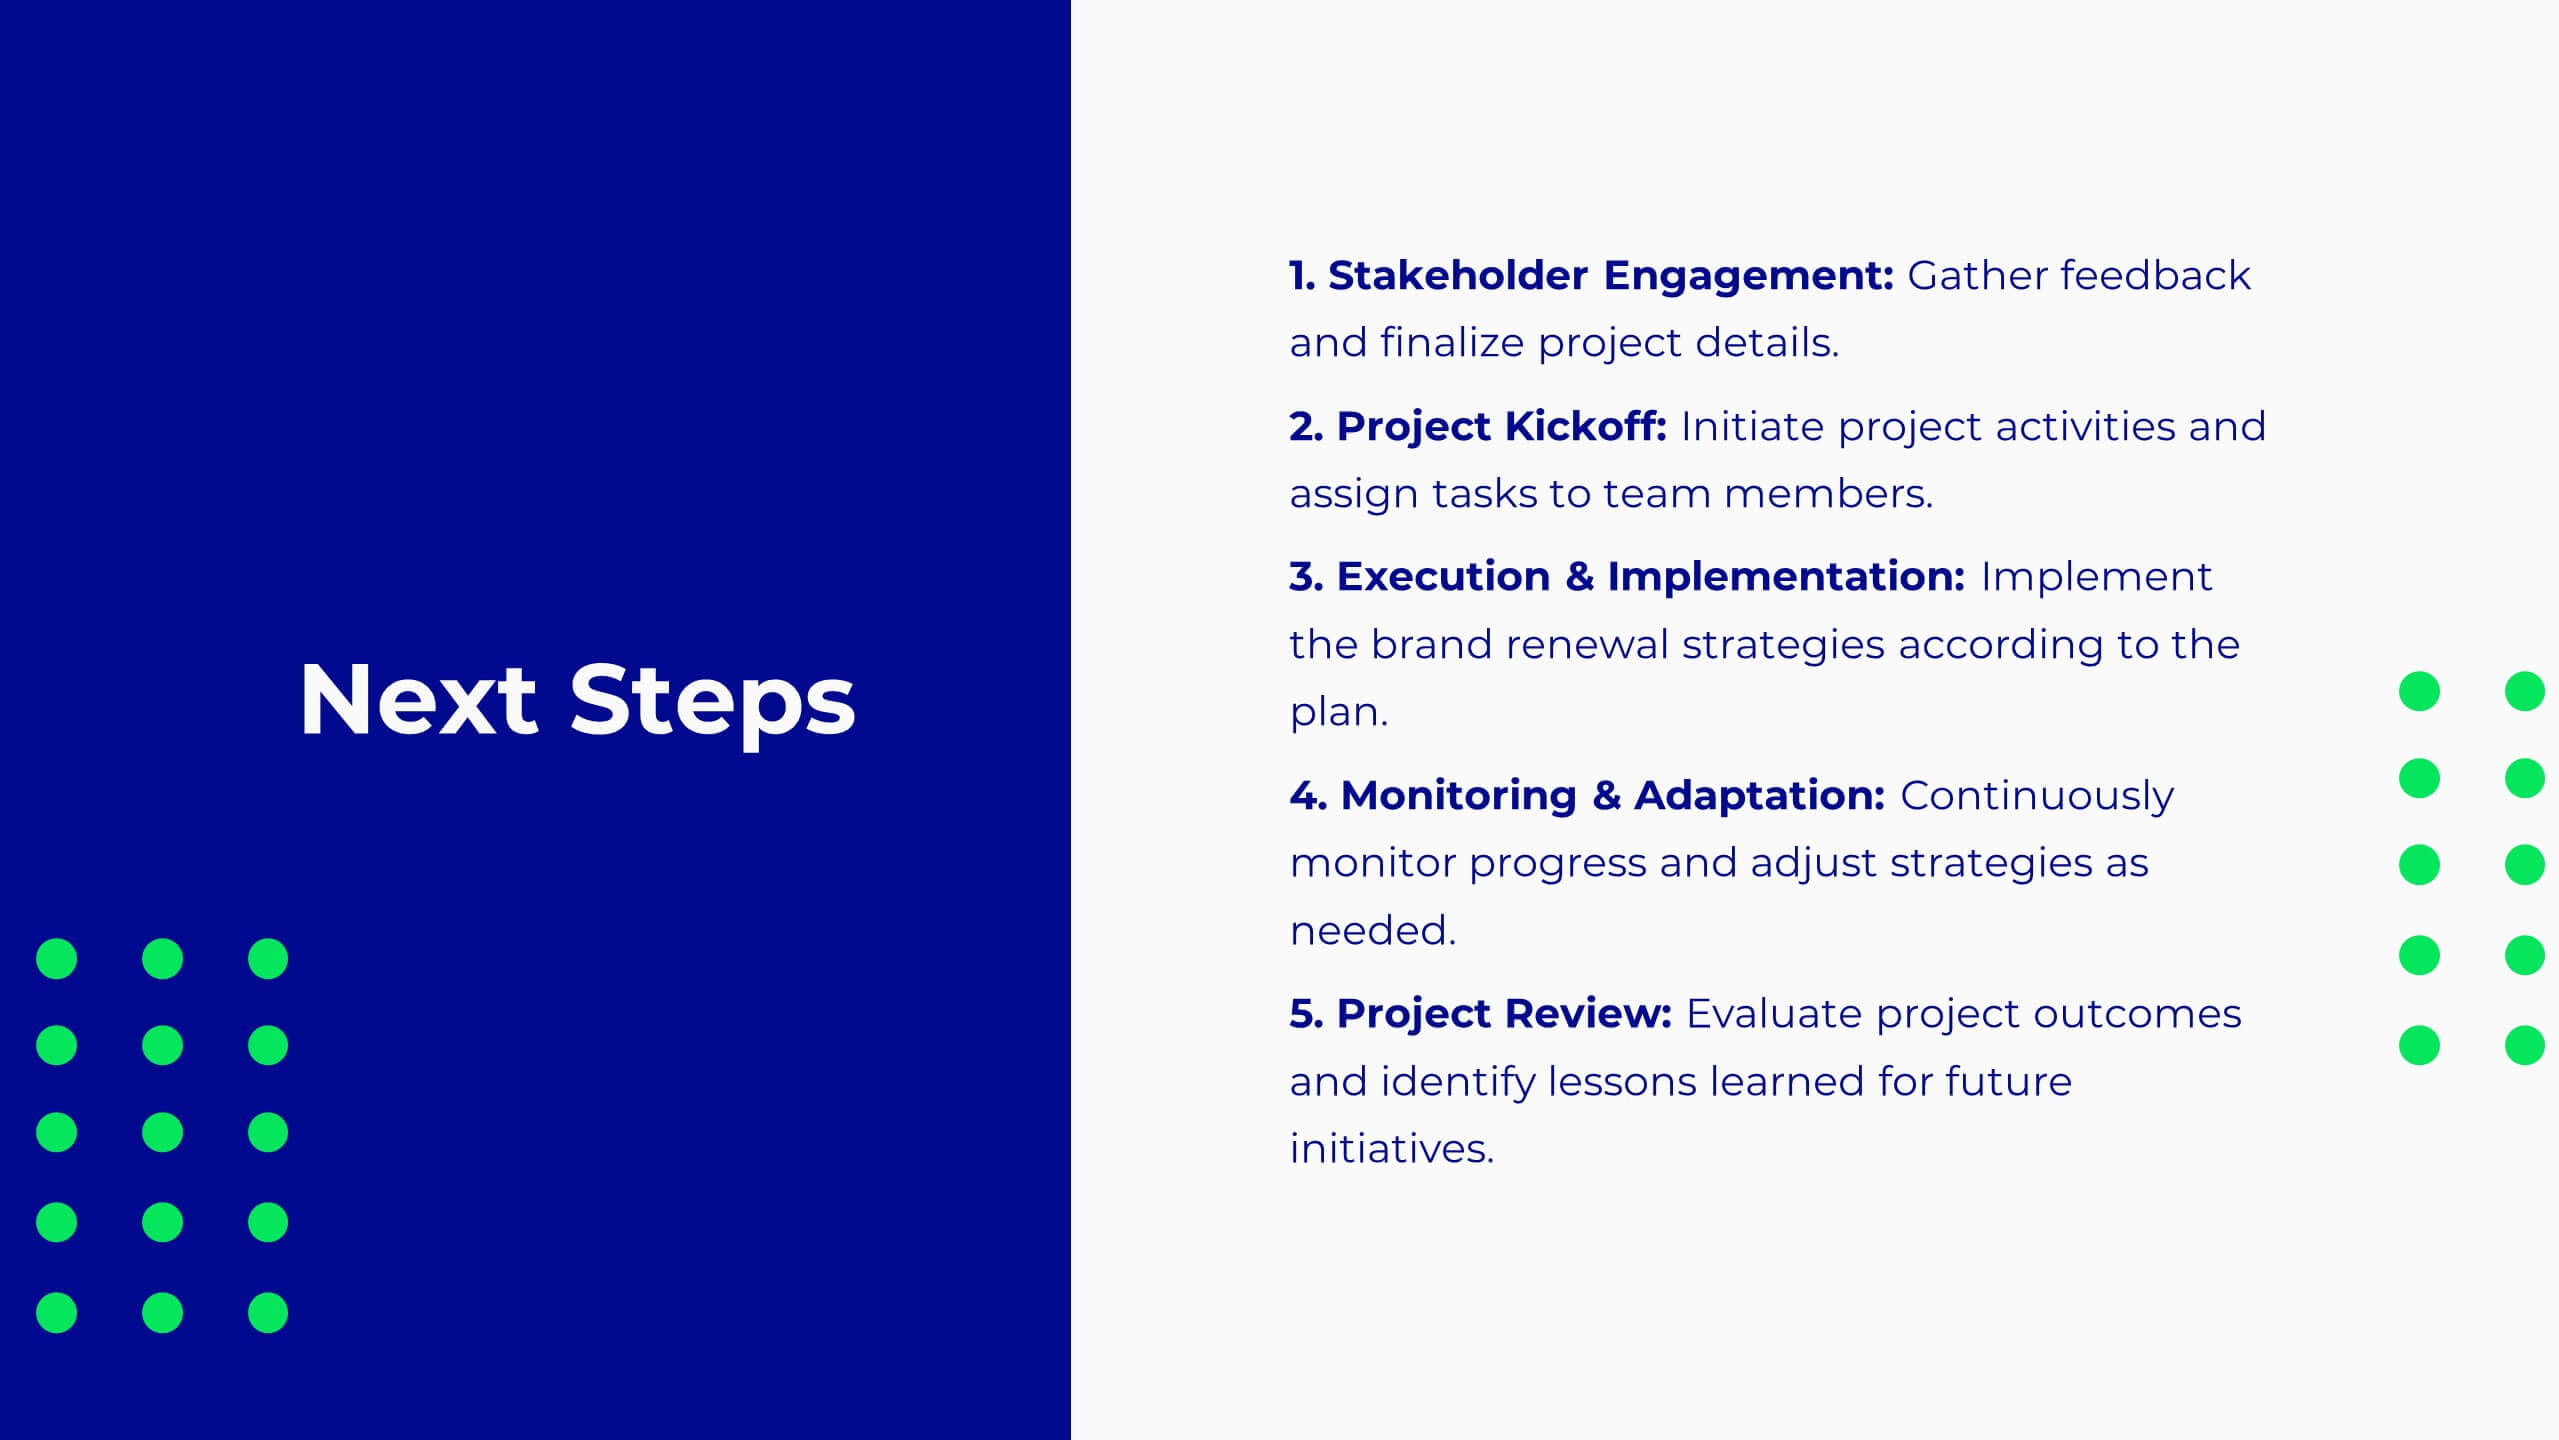
Pulse Project Milestones Report Presentation
Present project milestones effectively with this sleek, professional template. Cover project overview, timeline, and budget. Perfect for defining objectives, scope of work, and resource allocation. Highlight team introductions and stakeholder analysis. Ensure quality with risk management and assurance plans. Compatible with PowerPoint, Keynote, and Google Slides. Elevate your presentations today!


5 diapositivas
Political Campaign Strategies Infographics
A political campaign refers to the organized efforts of individuals or groups to promote a particular candidate, political party, or specific political agenda during an election or to raise awareness and support for a specific issue. These infographic templates are designed to showcase various strategies and techniques used in political campaigns. This is perfect for politicians, campaign managers, or anyone involved in the political arena who wants to present their campaign strategies. Its customizable layout and eye-catching design enable politicians to communicate their campaign, engage with their audience, and rally support for their goals.


22 diapositivas
Shield Digital Agency Strategy Plan Presentation
Embark on a journey to elevate your digital agency with this comprehensive and sleek presentation template! Perfect for showcasing your agency’s strengths, strategies, and successes, this template covers everything from market analysis to client testimonials. It’s designed to make your agency’s strategy plan stand out. Compatible with PowerPoint, Keynote, and Google Slides for seamless use.


6 diapositivas
Emerging Tech Trends and Tools Presentation
Stay ahead of the curve with this Emerging Tech Trends and Tools Presentation. Featuring a sleek computer-based layout with six data points, this template is ideal for showcasing innovations, tools, or future-focused strategies. Easily customizable in Canva, PowerPoint, and Google Slides for a professional and modern tech presentation.


6 diapositivas
Anatomy of the Body Infographics
Explore the Anatomy of the Body with our customizable infographic template. This template is fully compatible with popular presentation software like PowerPoint, Keynote, and Google Slides, allowing you to easily customize it to illustrate and communicate various aspects of human anatomy. The Anatomy of the Body infographic template offers a visually engaging platform to outline the major systems, organs, and structures within the human body. Whether you're a student, healthcare professional, or simply interested in understanding the human body, this template provides a user-friendly canvas to create informative presentations and educational materials. Deepen your knowledge of human anatomy with this SEO-optimized infographic template, thoughtfully designed for clarity and ease of use. Customize it to showcase the circulatory system, respiratory system, digestive system, skeletal system, and more, ensuring that your audience gains a comprehensive understanding of the complex and fascinating world of human anatomy. Start crafting your personalized infographic today to explore the Anatomy of the Body in greater detail.


8 diapositivas
Team Time Allocation and Planning Presentation
Stay on top of your team's workload with the Team Time Allocation and Planning presentation slide. This template features a clear, month-by-month Gantt-style layout, helping you visualize team tasks, priorities, and resource distribution across the year. Ideal for project managers, department leads, or operations teams aiming to streamline scheduling and improve collaboration. Fully customizable in PowerPoint, Keynote, and Google Slides.


6 diapositivas
Conversion Funnel Stages Overview Presentation
Visualize user journeys with clarity using the Conversion Funnel Stages Overview Presentation. This funnel diagram template breaks down key conversion phases—from awareness to decision—into distinct, color-coded stages. Ideal for marketing reports, sales strategies, or product demos. Fully editable in PowerPoint, Google Slides, and Canva.


5 diapositivas
Business Travel Logistics Plan Presentation
Plan and present business travel operations with clarity using this Business Travel Logistics Plan Presentation. Designed around a global layout with visual transport icons, this slide helps outline travel modes, routes, and logistics points. Ideal for corporate travel managers, event organizers, and logistics teams. Fully editable in PowerPoint, Keynote, and Google Slides.