


Características


¿Tienes alguna pregunta?
Recomendar


6 diapositivas
Personal SWOT Development Presentation
Highlight personal growth with this clean and structured Personal SWOT Development layout. Ideal for coaching, career planning, or self-assessment, it clearly separates strengths, weaknesses, opportunities, and threats. Easy to customize in PowerPoint, Keynote, or Google Slides—perfect for visualizing goals and building strategic self-awareness in a professional format.


10 diapositivas
SEO and Social Media Marketing Presentation
Shine a spotlight on your brand’s digital growth with this bold and professional layout designed to showcase analytics, engagement, and SEO strategies. Ideal for marketers, strategists, and agencies, it transforms data into visuals that persuade and inform. Fully compatible with PowerPoint, Keynote, and Google Slides for easy editing.


4 diapositivas
Employee Onboarding Process Presentation
Streamline your onboarding process with clarity and efficiency. This Employee Onboarding Process template visually maps out key steps for a smooth transition into your organization. Ideal for HR professionals, managers, and team leads. Fully editable and compatible with PowerPoint, Keynote, and Google Slides for seamless integration into your workflow.


6 diapositivas
Root Cause Steps Infographic
Root Cause Analysis (RCA) is a systematic process used to identify the underlying causes of problems, incidents, or issues in various fields, such as business, healthcare, engineering, and more. This infographic template illustrates the concept of root cause analysis, a method used to identify the underlying causes of a problem or issue. This infographic is a valuable tool for organizations to improve their processes, systems, and outcomes. This template helps in identifying and addressing the underlying issues that may not be immediately obvious, thereby promoting continuous improvement and problem-solving.


6 diapositivas
Stages of the Product Life Cycle Presentation
Illustrate the evolution of a product from launch to decline with the Stages of the Product Life Cycle presentation. This vibrant, segmented chart template visualizes key phases—Introduction, Growth, Maturity, and Decline—making it perfect for marketers, product managers, and strategists. Each stage is color-coded and icon-marked to enhance clarity and engagement. Fully customizable in PowerPoint, Keynote, and Google Slides.


21 diapositivas
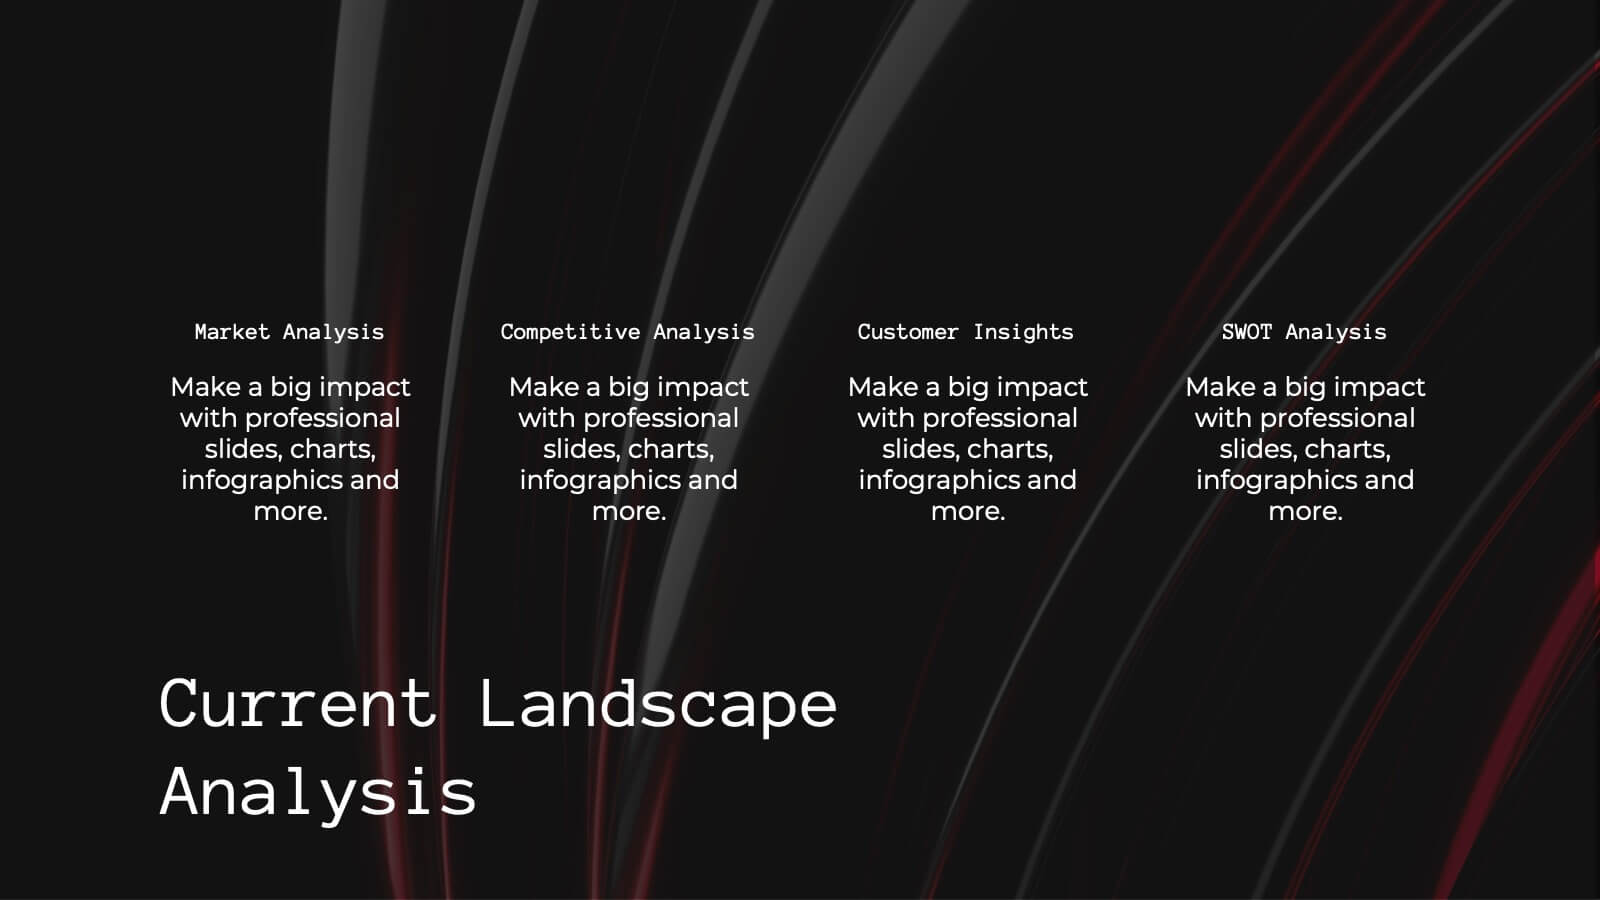
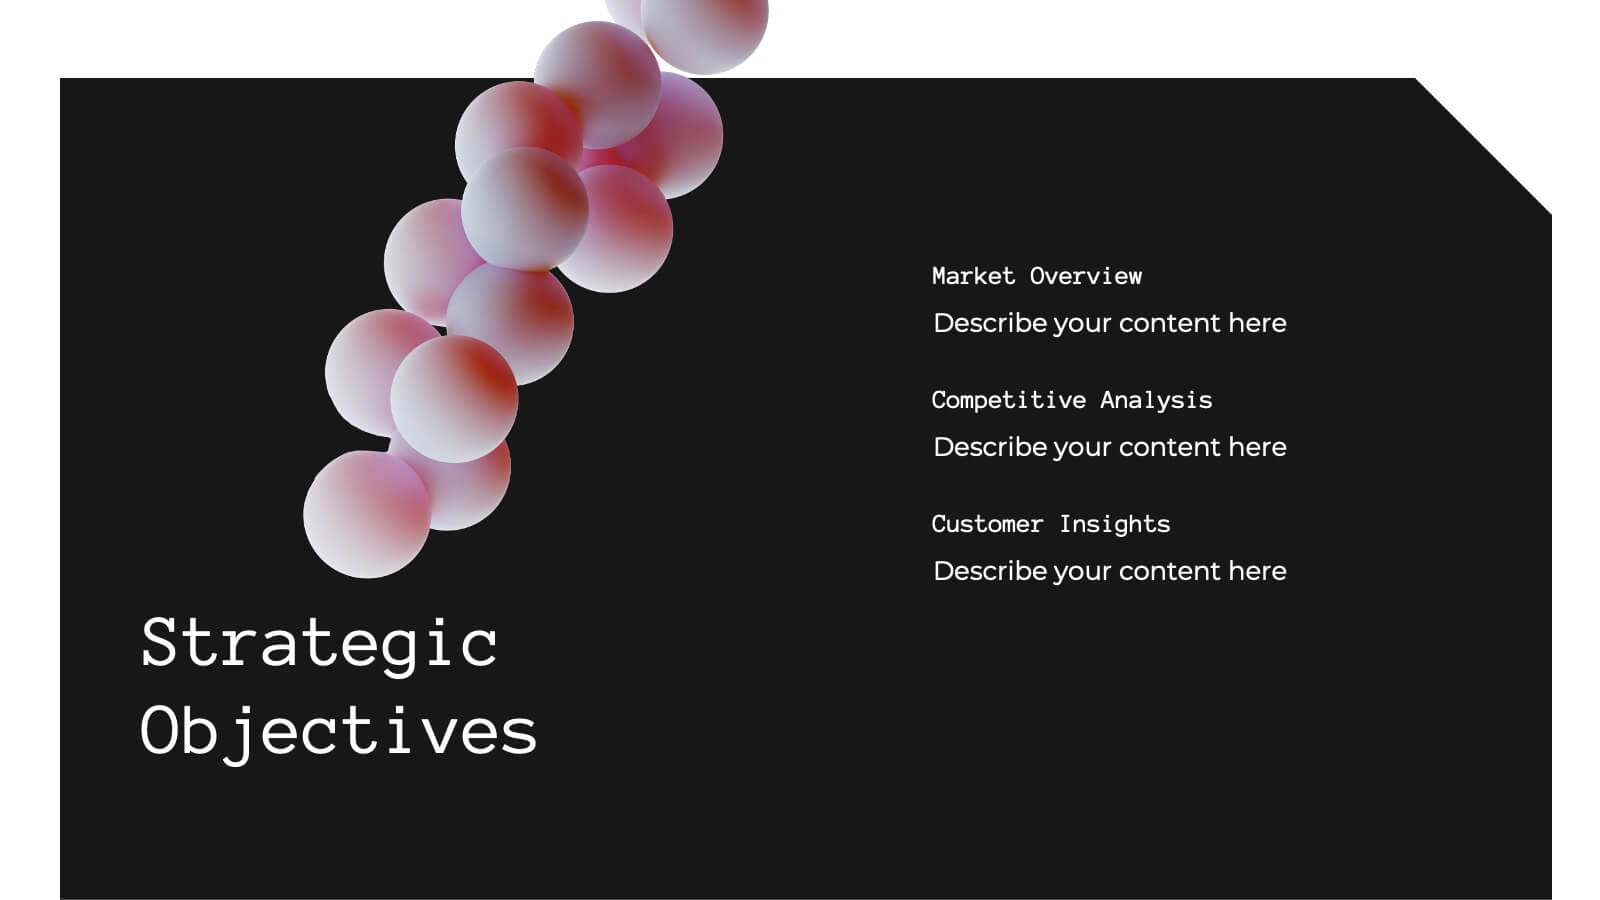
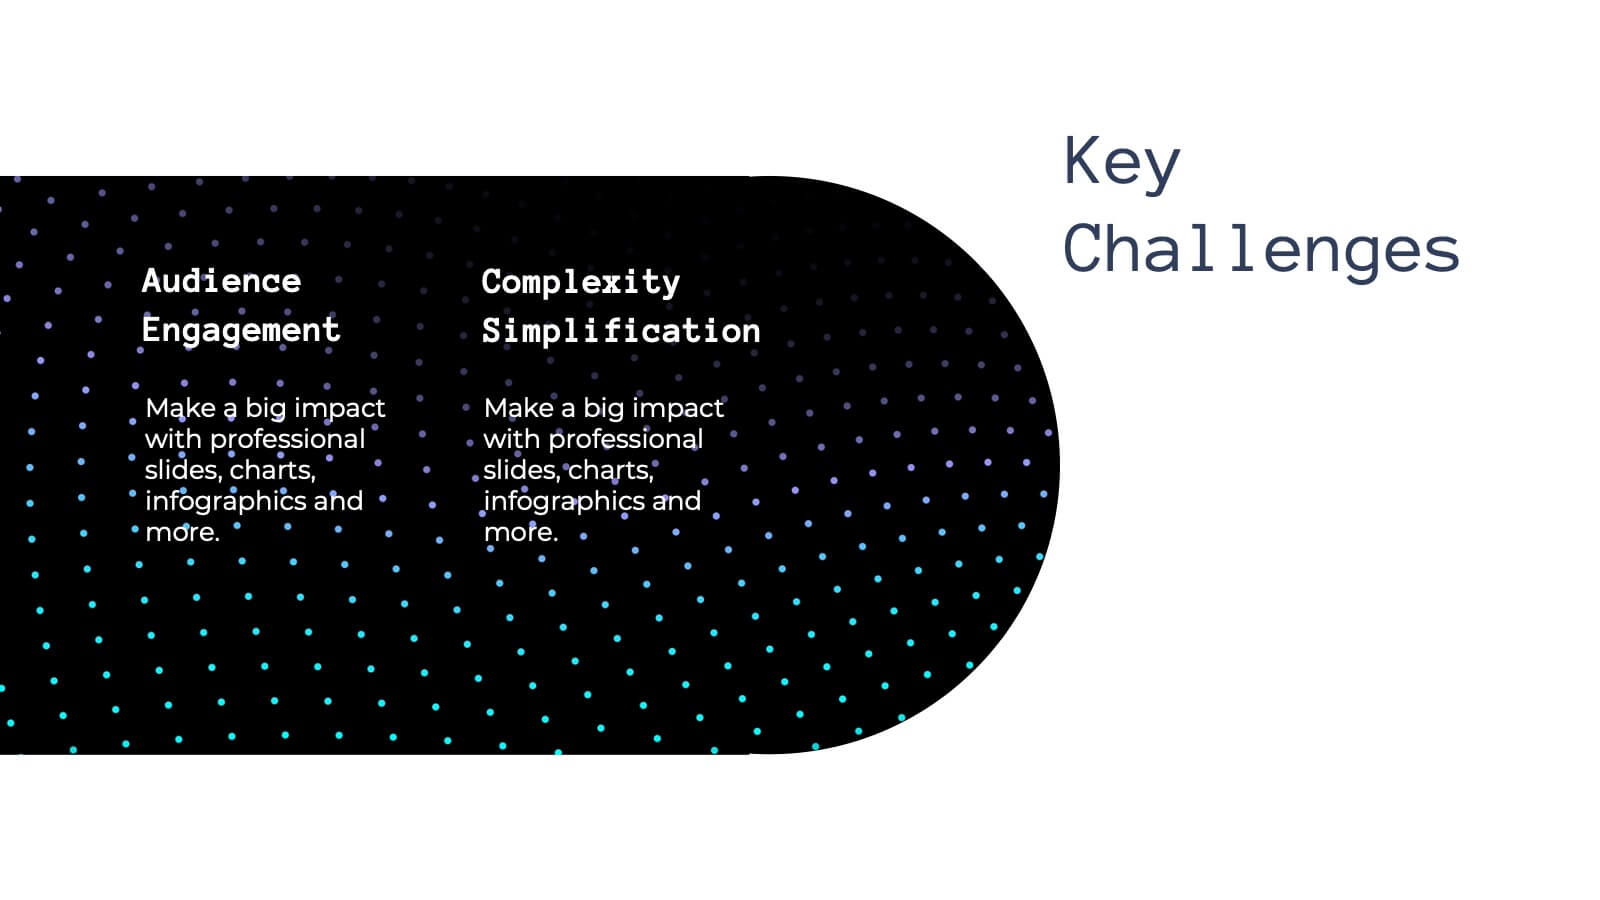
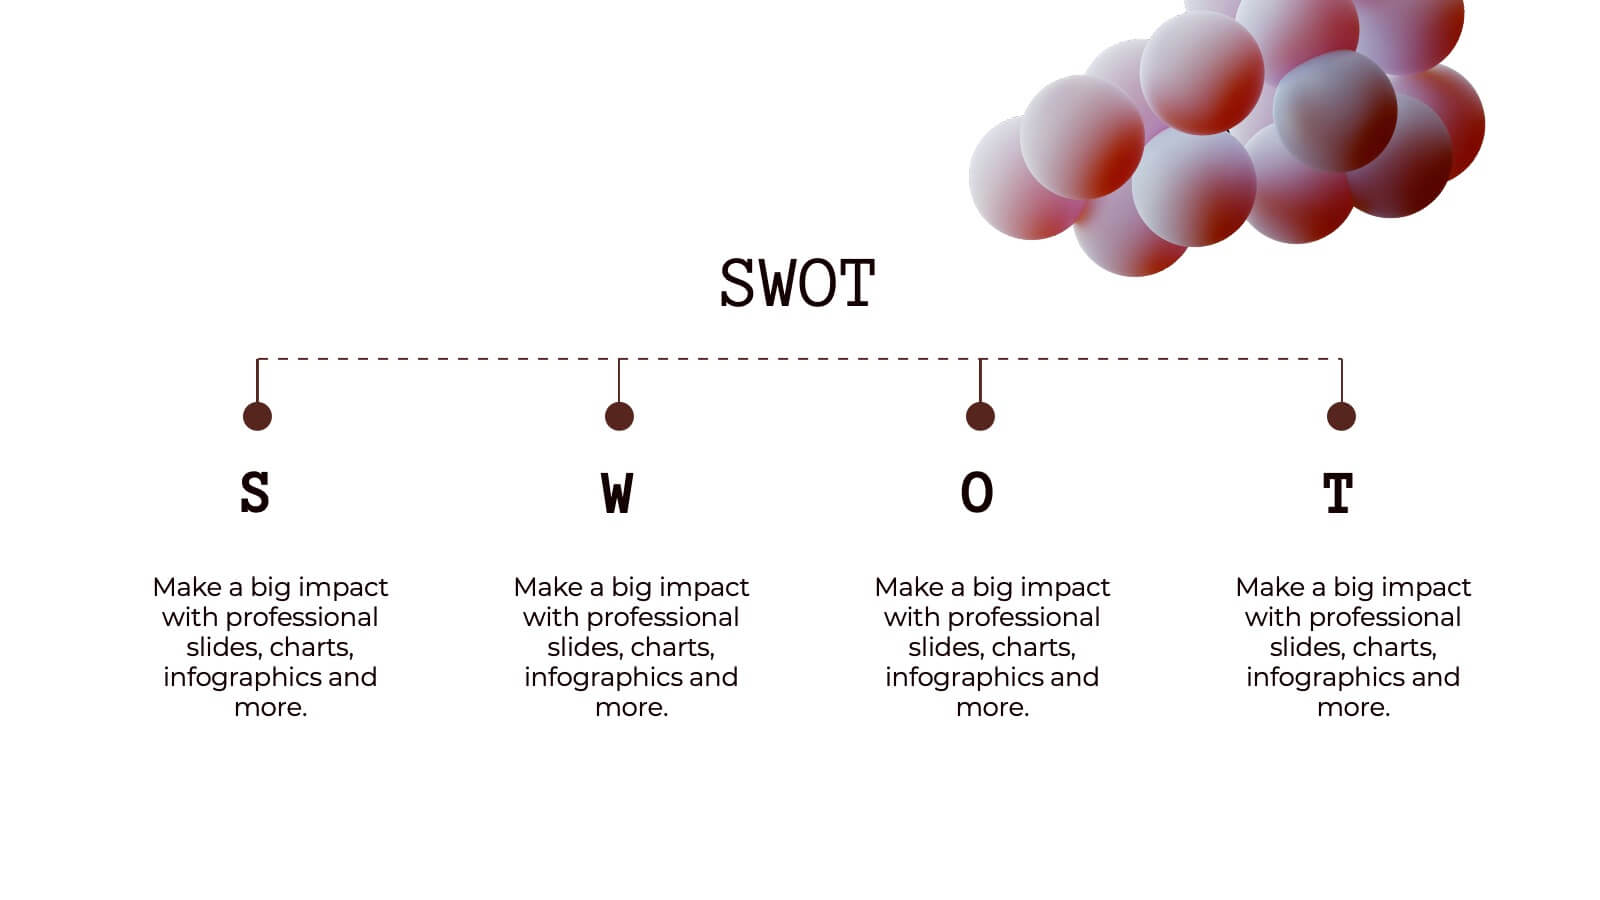
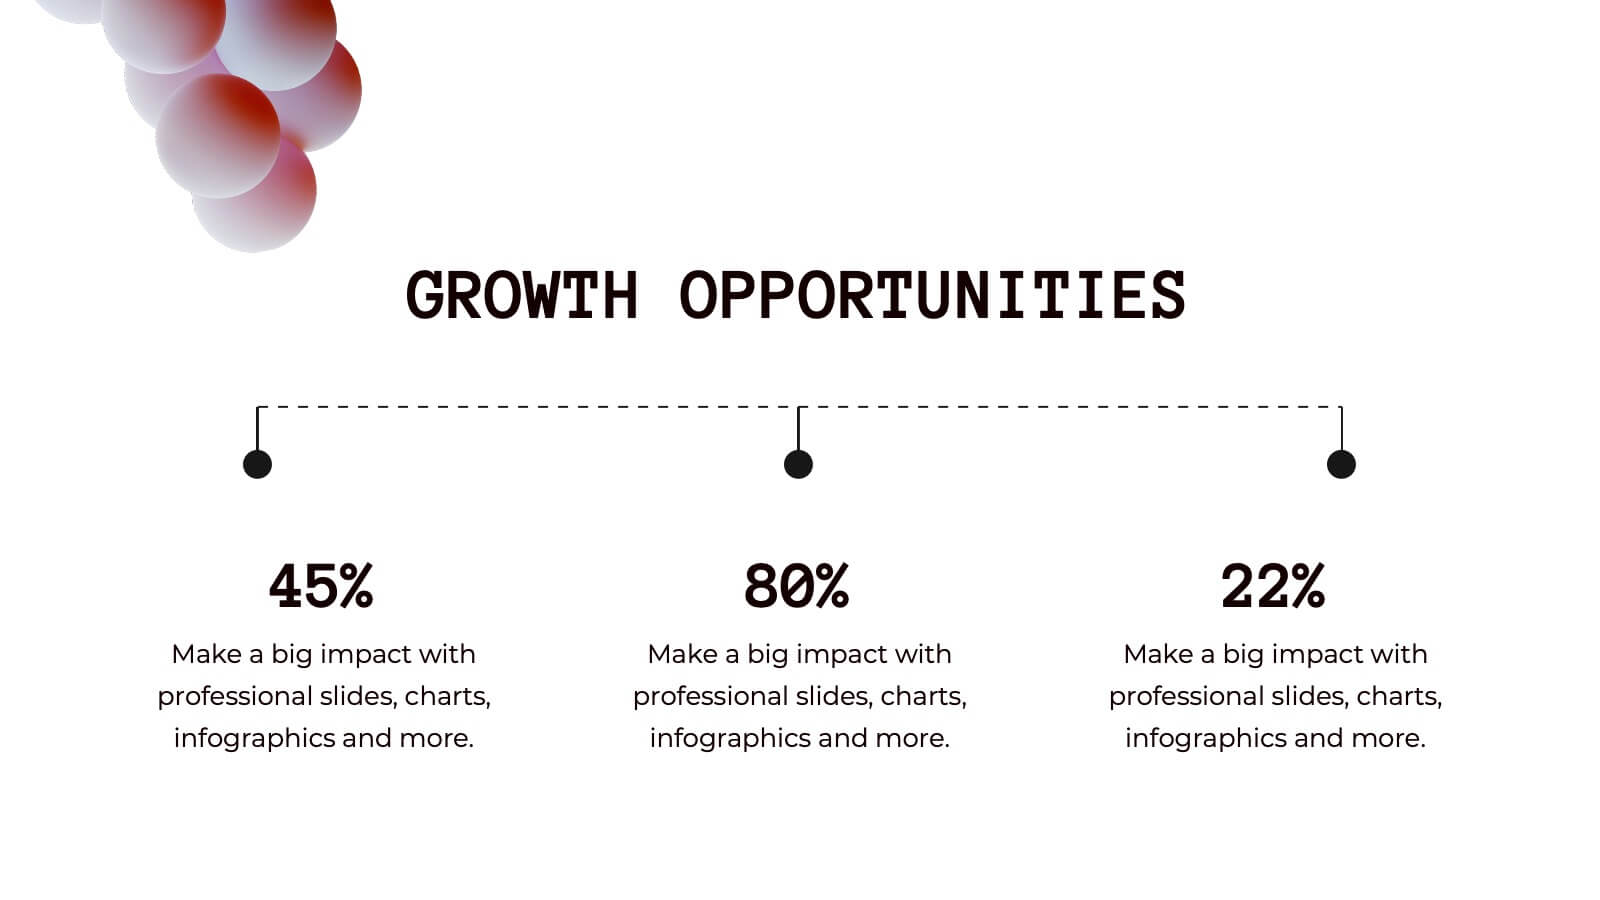
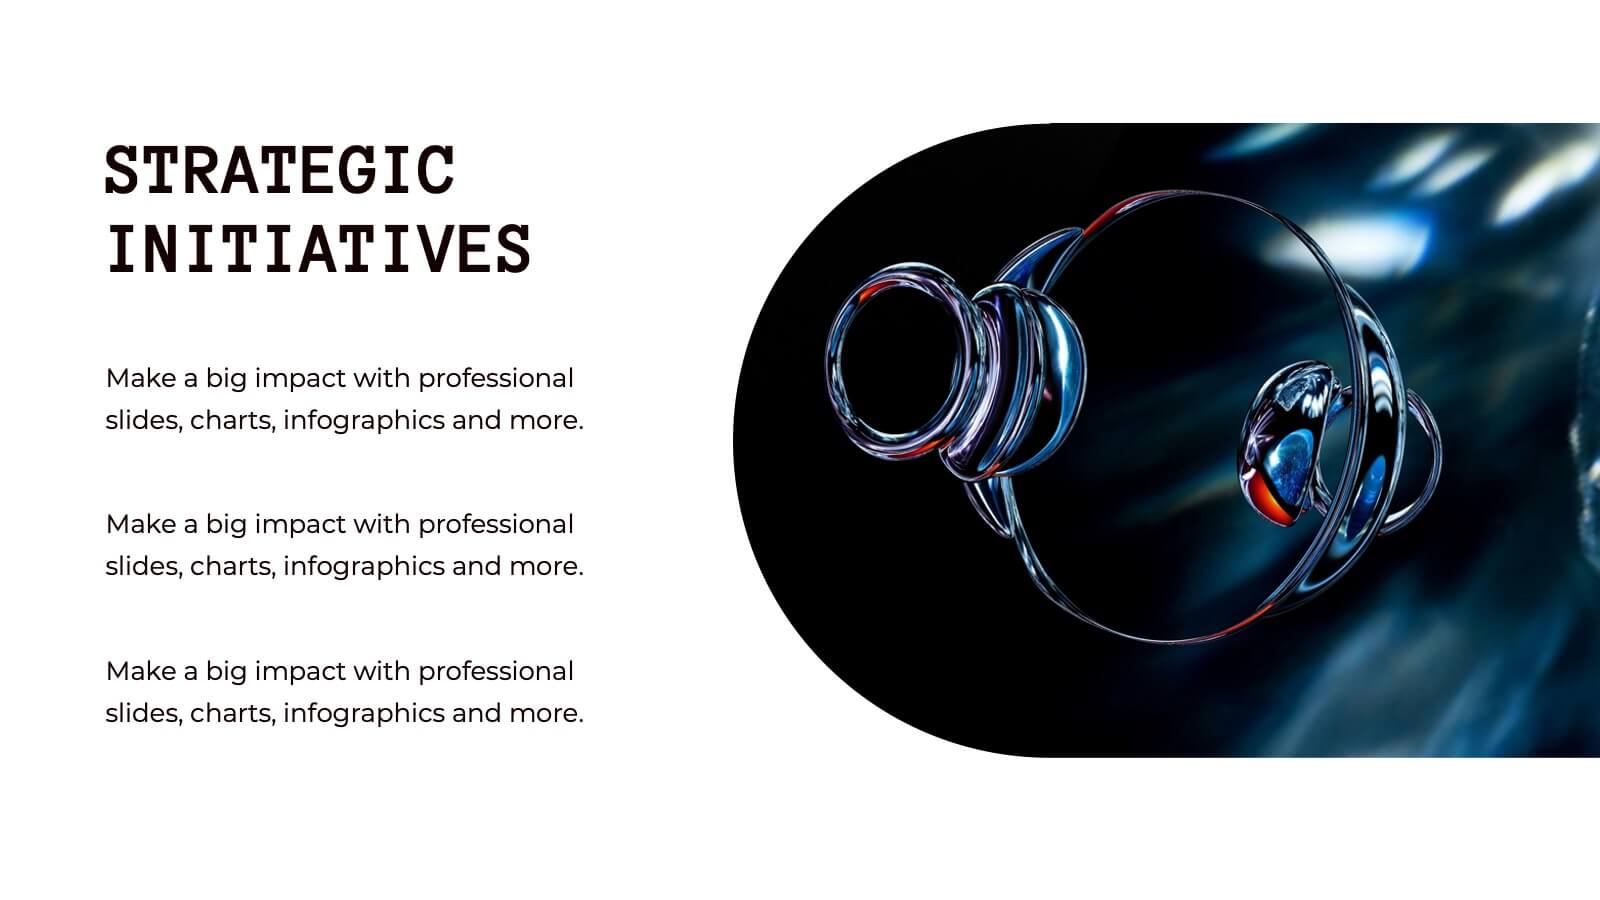
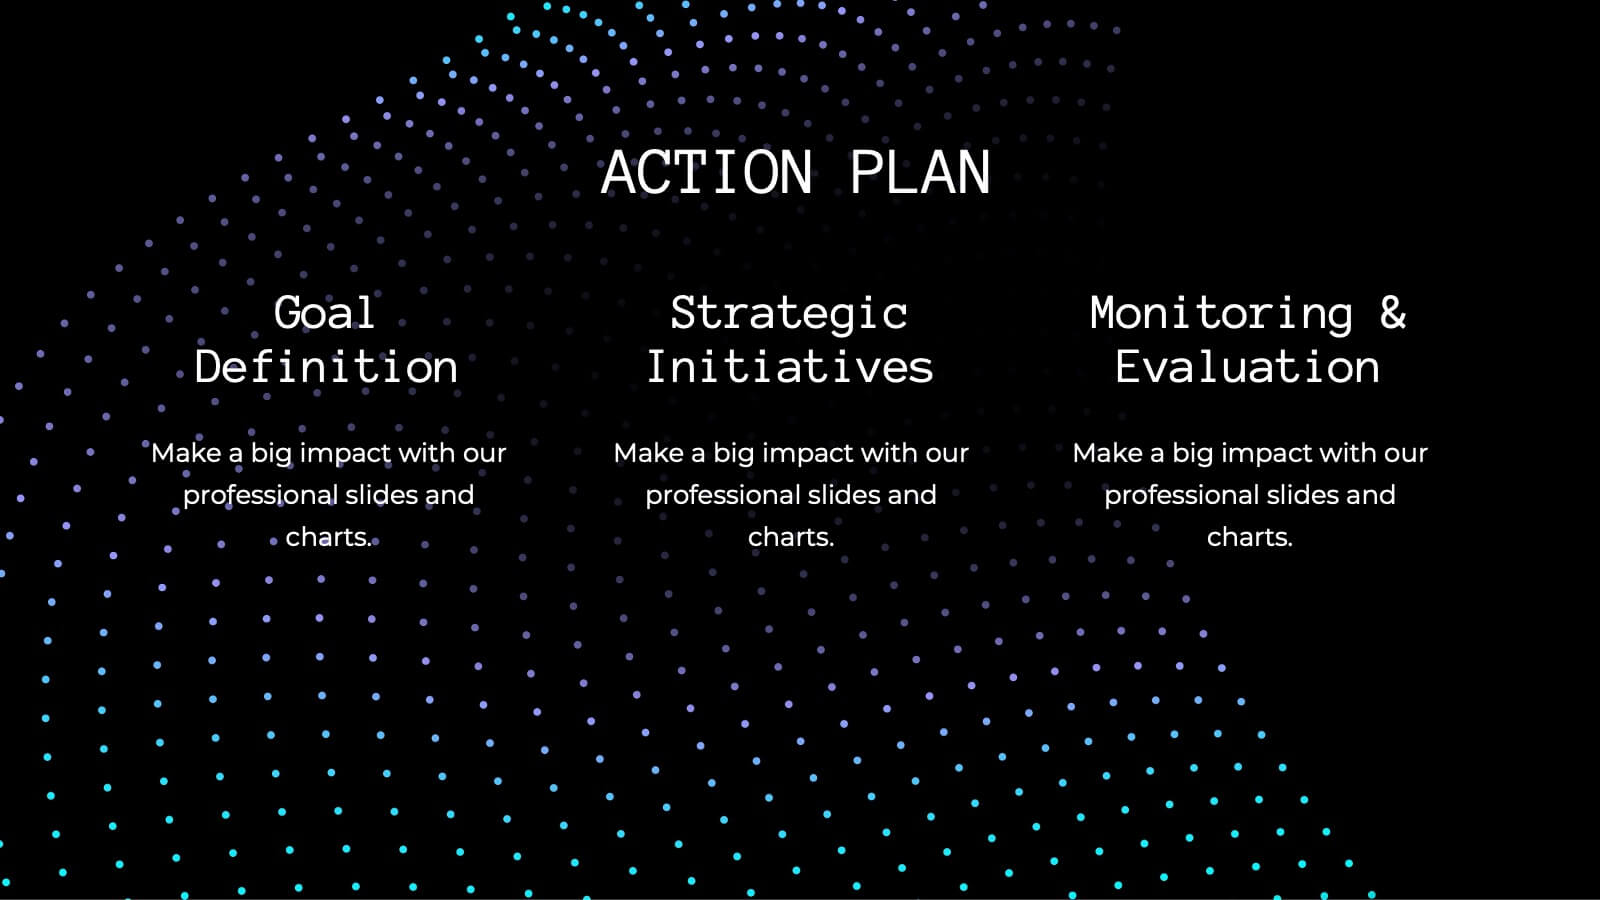
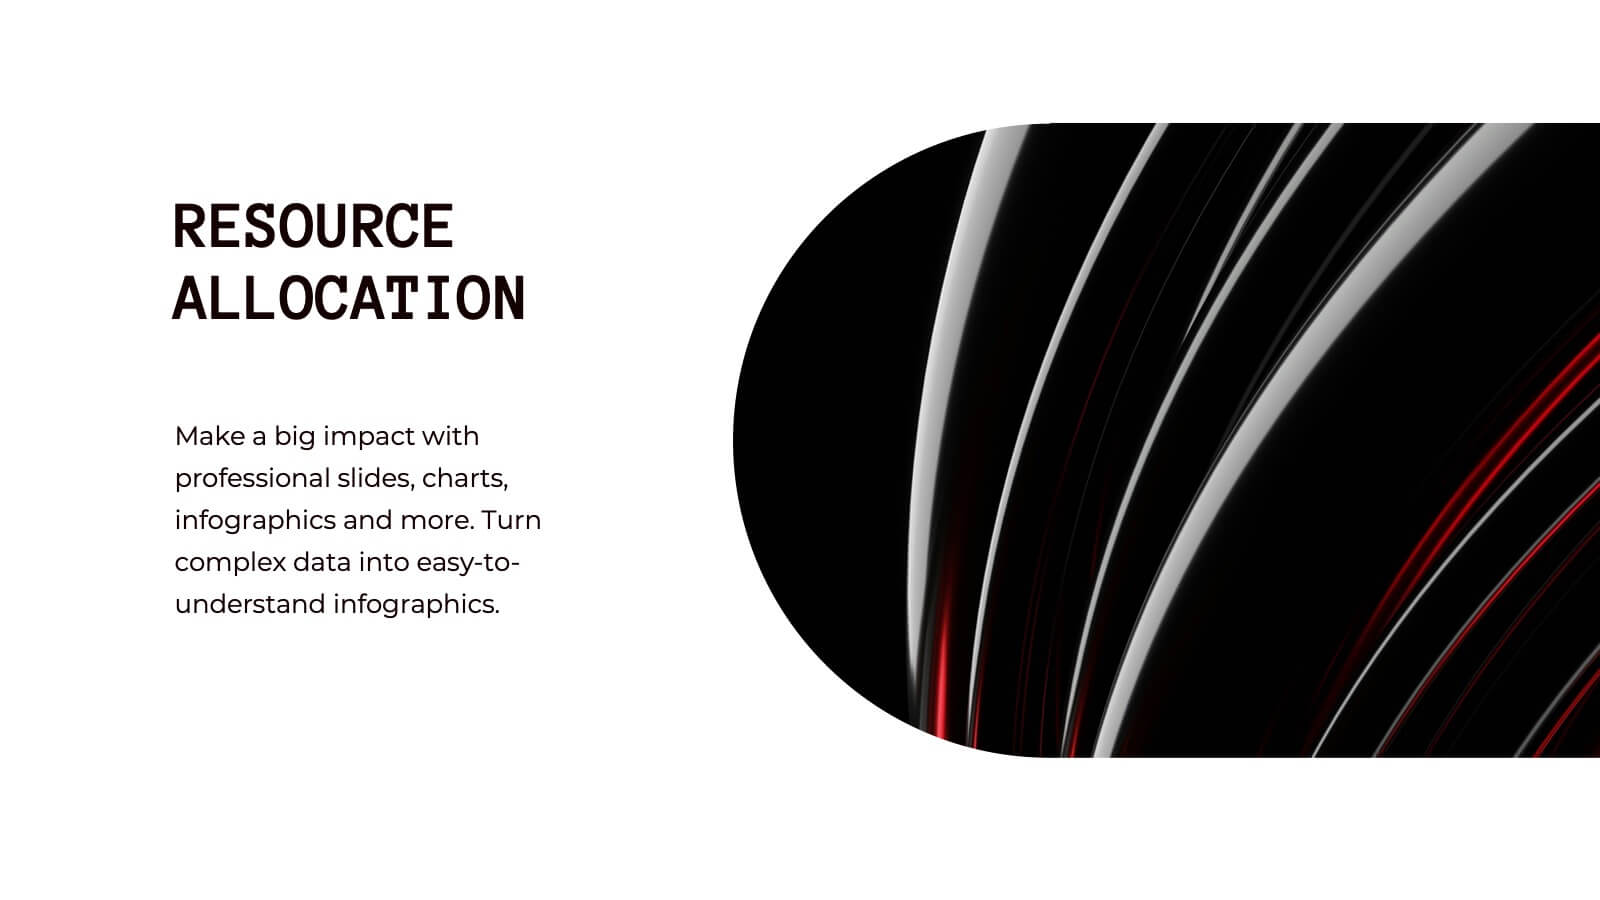
Mermaid Corporate Strategy Proposal Presentation
Present your corporate strategy with confidence using this sleek, modern proposal template! It covers strategic objectives, market trends, SWOT analysis, and resource allocation, ensuring a comprehensive overview of your plan. Fully customizable and compatible with PowerPoint, Keynote, and Google Slides, this template is ideal for launching new initiatives and achieving business goals.


6 diapositivas
Audience Targeting and Segmentation
Get to know your audience like never before with this human-centered visual layout—ideal for mapping out key segments, demographics, and targeting strategies. Great for marketing plans, user personas, or customer insights presentations, this slide keeps your data visually focused and easy to digest. Fully compatible with PowerPoint, Keynote, and Google Slides.


26 diapositivas
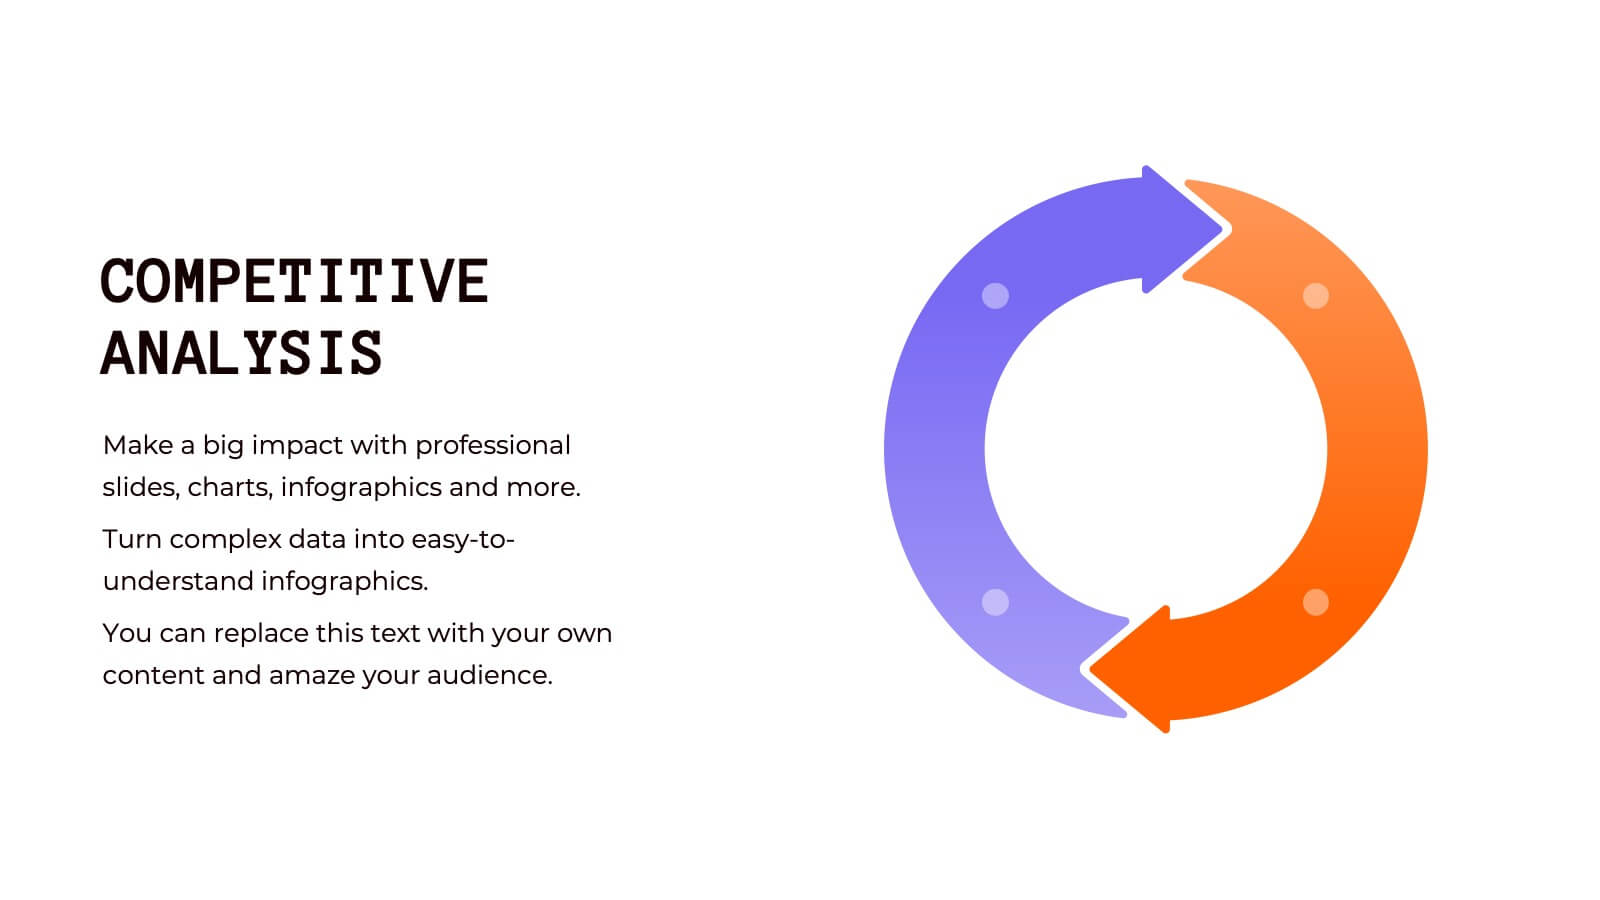
Competitive Market Analysis Professional Presentation
Navigate the complex landscape of market competition with this comprehensive presentation template, designed to illustrate competitive market analysis with clarity and impact. The sleek slides are steeped in a modern color palette, artfully combining cool purples and warm corals to capture attention and highlight key insights. Strategic use of infographics brings data to life, from SWOT analyses to market segmentation, ensuring the delivery of information is both visually appealing and easily digestible. It's a template that offers professionals and students alike the ability to dissect and present competitive dynamics with precision, whether it’s for a business plan, academic project, or strategic meeting. Each slide is a blueprint for understanding market forces, customer segmentation, and competitive positioning. This template is fully compatible with PowerPoint, Keynote, and Google Slides, making it a versatile and indispensable tool for those seeking to make informed decisions and craft compelling market narratives.


6 diapositivas
Key Points Overview Presentation
Bring your message to life with a slide that makes every key point feel clear, organized, and easy to follow. This presentation helps you highlight essential ideas, compare insights, and simplify complex information for any audience. Perfect for meetings, reports, or strategy updates. Fully compatible with PowerPoint, Keynote, and Google Slides.


5 diapositivas
Law and Criminal Justice Infographics
Law and Criminal Justice are two interconnected fields that encompass the study, enforcement, and administration of laws and regulations within a society. These vertical infographic templates provide an overview of key concepts, statistics, and information related to the field of law and criminal justice. It is designed to educate and inform the audience about various aspects of the legal system and the criminal justice process. These infographics will allow you to provide a comprehensive overview of the law and criminal justice system. Easily customizable and compatible with Powerpoint, Keynote, and Google Slides.


5 diapositivas
Client Engagement Journey Touchpoints
Map out every stage of client interaction with the Client Engagement Journey Touchpoints Presentation. This visual slide template highlights four key customer touchpoints, with a central user icon to emphasize the client-centric approach. Ideal for showcasing brand awareness, first contact, engagement strategies, and conversion steps. Easily customizable in PowerPoint, Keynote, and Google Slides.


5 diapositivas
Coffee Brewing Methods Infographics
Coffee brewing methods refer to the various techniques and processes used to extract flavor and aroma from coffee beans. These infographic templates are a visually appealing and informative presentation tool designed to showcase various methods of brewing coffee. Whether you're a coffee enthusiast, a barista, or someone interested in learning more about coffee preparation, this template provides an engaging way to explore different brewing techniques and their unique characteristics. These allows you to showcase and educate others about various coffee brewing techniques. Fully customizable and compatible with Powerpoint, Keynote, and Google Notes.


7 diapositivas
KPI Software Dashboard Infographic
Maximize the effectiveness of your performance analysis with our KPI Software Dashboard infographic, optimized for use in Powerpoint, Keynote, and Google Slides. This dynamic infographic is an indispensable tool for business analysts, project managers, and data-driven professionals seeking to present key performance indicators (KPIs) in an insightful and engaging manner. Our KPI Software Dashboard infographic offers a clear, visual representation of critical data points that influence business decisions. With its diverse array of charts, graphs, and meters, it provides an at-a-glance overview of company performance across various metrics. The design is tailored to enhance readability and comprehension, allowing your audience to quickly grasp complex data trends and patterns. Whether you're reviewing sales figures, monitoring customer satisfaction, or tracking project progress, this infographic is designed to streamline the presentation of your data. The compatibility with popular presentation platforms ensures a smooth integration into your slide deck, making it a breeze to communicate the insights that matter. Utilize this infographic to turn your KPI data into compelling narratives that drive strategic business actions.


6 diapositivas
Creative Process Infographic
The Creative Process Infographic offers a visually engaging and systematic approach to outlining the steps of a successful project or strategy. This template beautifully segments the process into distinct, color-coded stages, making it ideal for presentations, workshops, or educational materials that aim to simplify and illustrate the progression from concept to completion. Each section is clearly defined, providing a structured pathway that can be customized to detail specific tasks, checkpoints, or goals. This infographic is versatile and fully editable, suitable for Powerpoint, Google Slides, and Keynote, ensuring that it can be adapted to a wide range of topics and audiences.


10 diapositivas
Key Strategies for Business Success Presentation
Achieve your goals with the Key Strategies for Business Success Presentation template. This structured and visually compelling slide deck is designed to outline essential business strategies, success factors, and growth plans. Featuring a clean and professional layout, this template is perfect for entrepreneurs, corporate teams, and business consultants. Fully customizable and available for PowerPoint, Keynote, and Google Slides, making it easy to tailor for your specific needs.


5 diapositivas
Effective Decision-Making with RAPID
Streamline training and clarify roles with this directional RAPID decision-making template. Designed around the Recommend, Agree, Perform, Input, and Decide framework, this visual uses signpost-style arrows to guide teams through each responsibility in a clear, intuitive layout. Ideal for workshops, onboarding, or leadership development sessions. Fully editable in PowerPoint, Keynote, and Google Slides.


6 diapositivas
Regional Finance Infographic
Regional finance plays a vital role in fostering economic growth, attracting investments, and improving the overall well-being of communities within a specific region. This infographic template focuses on financial trends, insights, and data related to specific regions or countries. It is designed to help businesses, organizations, or financial professionals analyze and understand the financial landscape of a particular region. The data-driven content in this template is suitable for businesses or individuals seeking insights to make informed decisions regarding investments, market entry, or financial planning in a specific region.