


Características


¿Tienes alguna pregunta?
Recomendar


34 diapositivas
MVP Startup
An MVP Startup is a type of business that focuses on developing and launching a minimal version of their product or service with the basic features required to test its viability in the market and gather feedback. This template is designed with a bold and dynamic red color palette, perfect for start-ups that want to convey a sense of passion, innovation, and urgency. It features a range of customizable slides that are specifically tailored for start-up presentations to showcase your MVP concept, market validation, and growth strategy. Compatible with Powerpoint, Keynote, and Google slides, all 34 slides are fully editable.


5 diapositivas
Hydrological Cycle Explained Presentation
Break down complex water systems with ease using the Hydrological Cycle Explained Presentation. This clean and modern slide illustrates each phase of the cycle—from precipitation to collection—with intuitive icons and a pipeline layout. Ideal for educational, environmental, or sustainability content. Fully editable in Canva, PowerPoint, Keynote, and Google Slides.


5 diapositivas
HIV Treatment & Awareness Infographics
Explore the critical realms of healthcare with our HIV treatment & awareness infographics. Rendered in striking shades of red and blue, this vertical, informative, and creatively designed template serves as a profound educational tool. It's intricately crafted for healthcare professionals, awareness campaign coordinators, and community health educators, providing a visual journey through the complexities of HIV understanding. This infographic includes compelling graphics and relevant icons, making it indispensable for those seeking to inform, prevent, and empower communities about HIV. Elevate awareness with clarity and a deep sense of humanity, one fact at a time.


6 diapositivas
Competitive Market Forces Analysis Presentation
Elevate your insights with a dynamic circular layout that turns complex market pressures into a clear, structured story. This presentation helps you compare key forces, highlight competitive advantages, and communicate strategic recommendations with confidence and simplicity. Fully editable and compatible with PowerPoint, Keynote, and Google Slides.


20 diapositivas
Oceandra Sales Proposal Presentation
Present your sales strategy with precision and professionalism using this versatile proposal template. Designed to clearly communicate your problem statement, proposed solutions, and goals, it’s perfect for impressing potential clients and stakeholders. Walk your audience through the project scope, methodology, and deliverables with clean, visually appealing layouts. With sections for pricing structures, team expertise, and risk mitigation strategies, this template ensures your proposal is comprehensive and persuasive. The next steps and action plan slide helps solidify your commitment to achieving results. Fully compatible with PowerPoint, Google Slides, and Keynote, it’s customizable to meet any business or industry requirements. Ideal for turning prospects into partnerships!


5 diapositivas
Cost Analysis and Budgeting
Visualize financial shifts with clarity using the Cost Analysis and Budgeting Presentation. This slide template uses a dual-stack design to contrast cost reductions against budget increases, supported by percentage change labels and layered visual elements. Ideal for finance teams, operations reviews, or executive summaries, this layout highlights five customizable categories per stack. Compatible with PowerPoint, Keynote, and Google Slides, it's fully editable to match your company branding and color palette.


5 diapositivas
Climate Change Impacts Infographics
Climate Change refers to long-term shifts in temperature, precipitation patterns, wind patterns, and other aspects of the Earth's climate system. These infographic templates are perfect to educate and raise awareness about the impacts of climate change on our planet. These templates are suitable for environmental organizations, educators, or anyone seeking to convey the urgency and significance of addressing climate change. The compelling visuals, data-driven content, and clear messaging, in these templates aims to educate and inspire individuals to contribute to global efforts to address climate change and protect our planet's future.


7 diapositivas
Asia Countries Map Infographic
This Asia Countries Map infographic template is ideal for presentations requiring a detailed breakdown of geographic and statistical data across Asia. Compatible with PowerPoint, Google Slides, and Keynote, it features a collection of map styles and data visualization tools including icons, bar charts, and color-coded points for easy data comparison and interpretation. The template is perfect for visualizing diverse metrics such as demographic details or social statistics, with each slide tailored to display information in a clear, engaging manner. This tool is exceptionally suited for educators, and business professionals who need to convey complex data about Asian countries.


7 diapositivas
Finance Infographic Presentation Template
Finance is a field that deals with the study of investments and the management of money. Finance Infographics are visual representations of financial information, data, and concepts. This template uses charts, graphs, diagrams, and illustrations to help explain complex financial information in a simple and easy-to-understand way. This Finance Infographic can cover a range of topics including budgeting, investments, expenses, and market analysis, among others. This is the perfect template to use for businesses, financial organizations, and educators to help people understand financial concepts.


7 diapositivas
Real Estate Housing Market Infographic
Real estate is an important asset class that plays a vital role in the economy and society. This real estate template is perfect for presenting your local housing market statistics to potential homeowners, buyers and renters. Use these charts and tables to show trends in sales prices, gross produce, average household income over time and so much more. This presentation contains 7 slides of the housing market. It is fully customizable with many photo layouts to choose from and all professional charts are included in the file. This template can be used with Powerpoint, keynote or Google Slides.


8 diapositivas
Sustainable Operation & Ethical Practice Presentation
Illustrate your ethical initiatives and operational sustainability with this water drop flow diagram. Ideal for outlining four key actions or principles, it features a faucet visual and icon-based content drops. Fully customizable in PowerPoint, Keynote, and Google Slides—perfect for ESG reporting, CSR updates, and eco-conscious business presentations.


6 diapositivas
Matrix Diagram
A matrix diagram, also known as a matrix chart, is a visual tool used to analyze and organize complex information by displaying it in a matrix format. This infographic template provides a visual framework for analyzing complex information, and improving understanding of relationships between different elements or factors. This template allows users to effectively communicate complex relationships and categorize information using a matrix format. This is perfect to use in a wide range of contexts, including project management, problem-solving, decision-making, strategic planning, and data analysis.


5 diapositivas
Mental Health Counseling Infographics
Mental health counseling is a form of therapy that focuses on helping individuals improve their mental and emotional well-being. These infographic templates are designed to raise awareness about mental health counseling and its benefits. This aims to educate and inform individuals about the importance of seeking professional help for mental health concerns and highlights the various aspects of mental health counseling. Use these to present your next educational presentation on mental health or online platforms, this provides essential information and visual aids to encourage the benefits of seeking counseling.


5 diapositivas
Business People Collaboration Overview Presentation
Showcase team dynamics with the Business People Collaboration Overview Presentation. This template uses a clean hexagon layout to highlight roles, responsibilities, or partnerships between individuals or departments. Ideal for collaboration strategies, organizational structures, or cross-functional workflows. Fully editable in PowerPoint, Canva, and Google Slides.


6 diapositivas
Product Development Cycles Presentation
A great product starts with a clear, engaging story—this presentation brings that journey to life. It outlines each stage of the development cycle in a simple, visual flow that helps teams communicate progress, milestones, and next steps. Perfect for strategy, planning, and updates. Fully compatible with PowerPoint, Keynote, and Google Slides.


6 diapositivas
Business Calendar and Monthly Overview Presentation
Bring structure to your chaos with a bold and colorful visual planner! This easy-to-use layout helps track tasks, deadlines, or projects across multiple months in one glance. Ideal for team coordination or solo planning. Fully editable and compatible with PowerPoint, Keynote, and Google Slides for seamless calendar-based presentations.
4 diapositivas
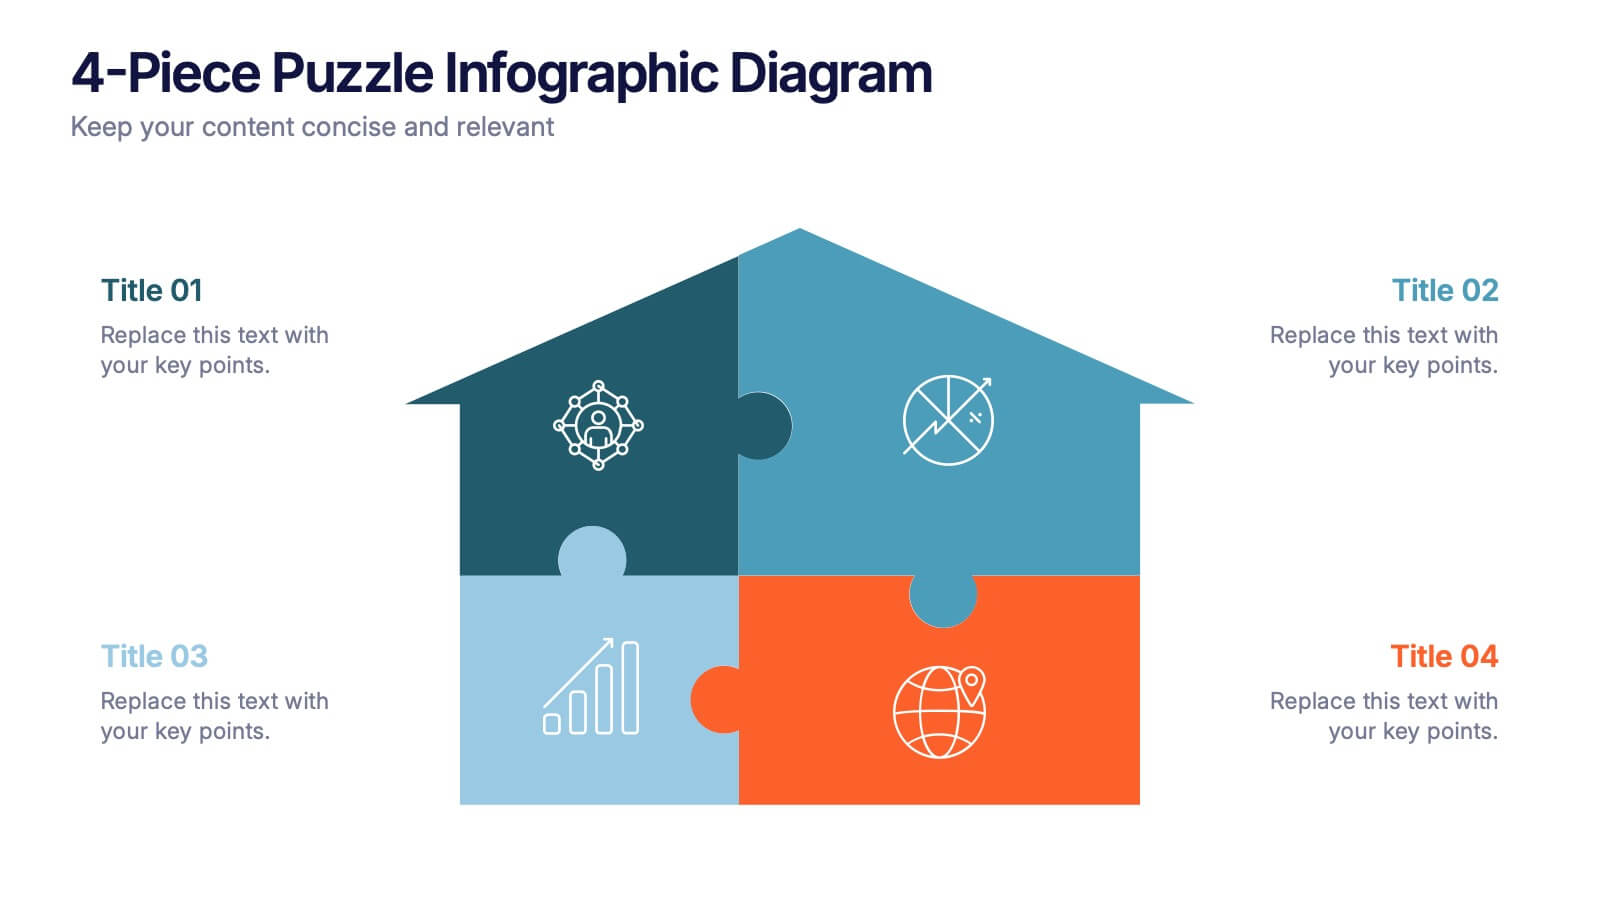
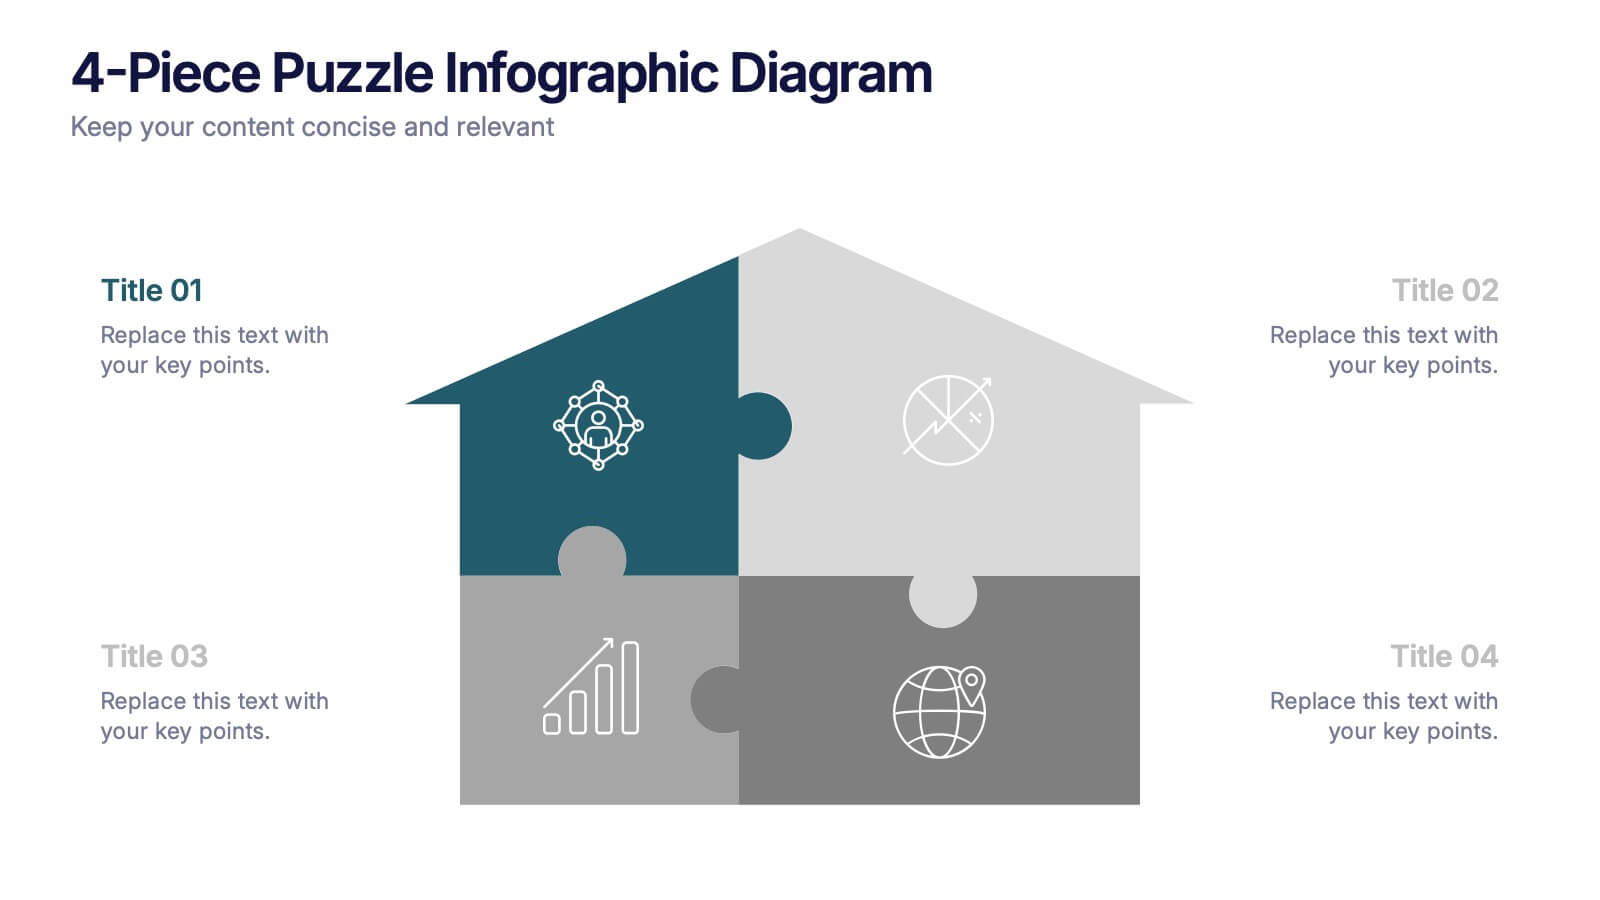
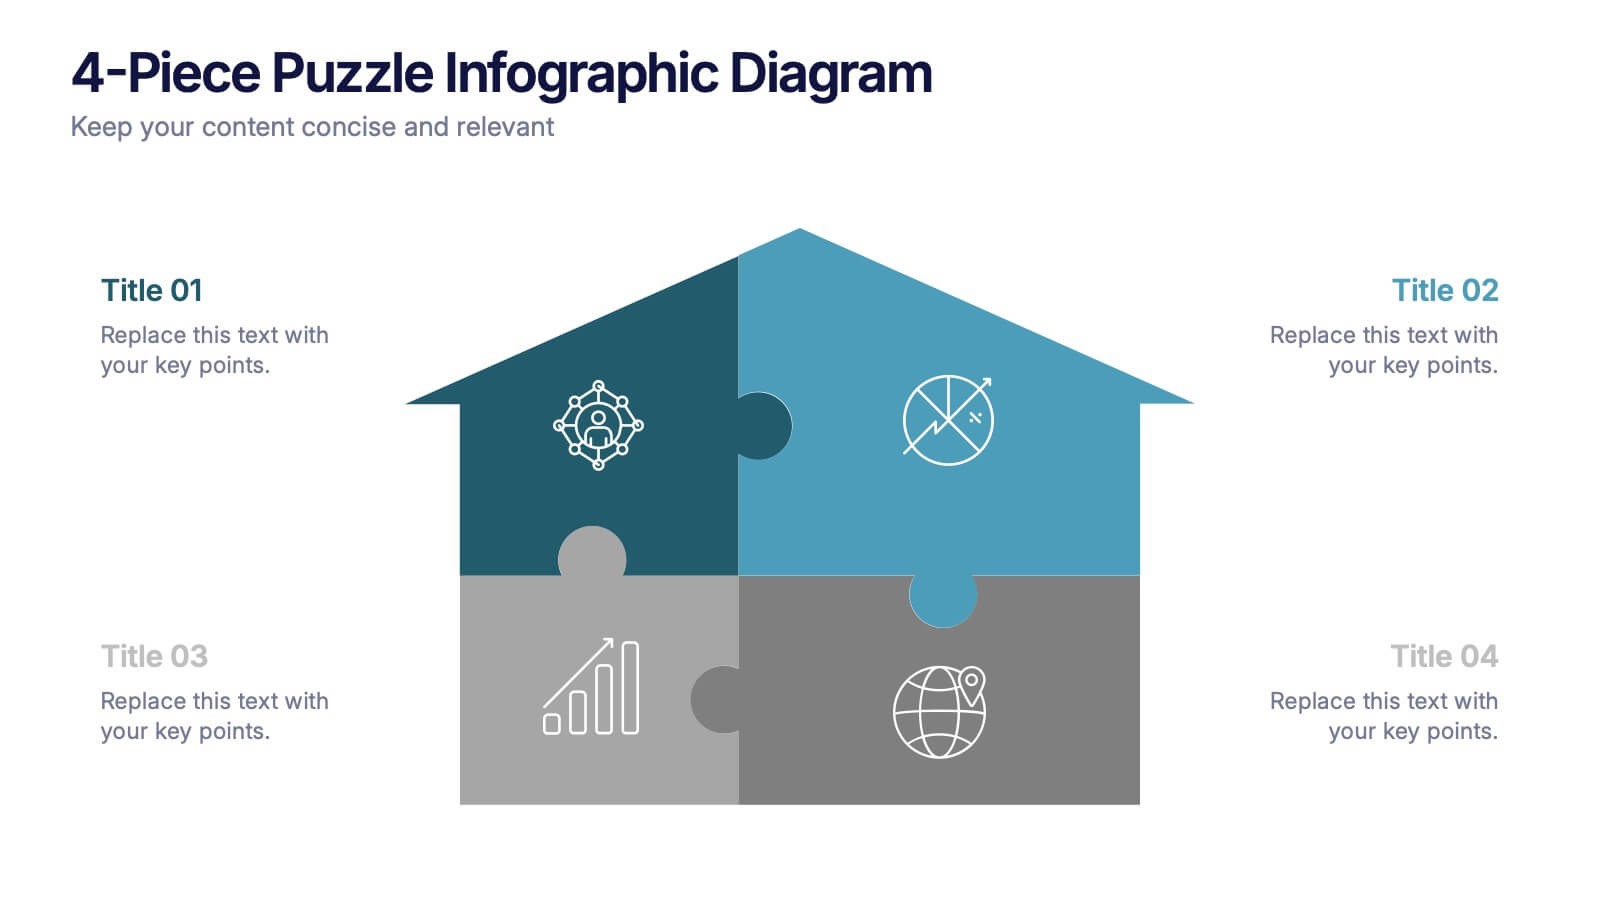
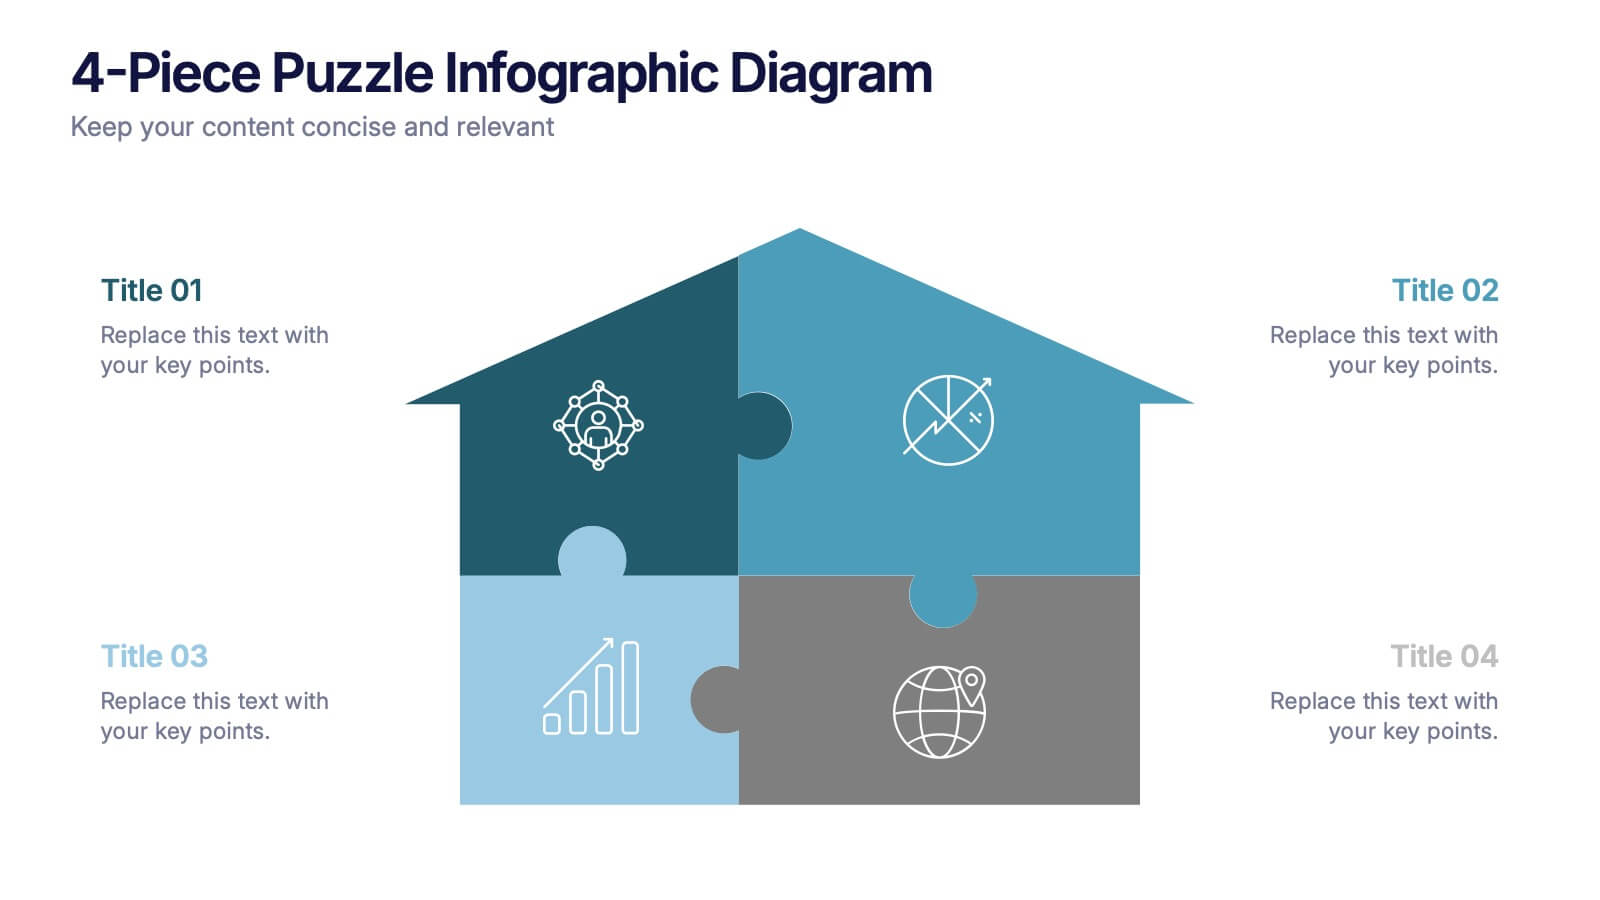
4-Piece Puzzle Infographic Diagram Presentation
Bring clarity and impact to your message with a visual layout that snaps big ideas together like a puzzle. This presentation helps you break complex concepts into four connected sections, making explanations easier and more engaging for any audience. Ideal for planning, insights, or strategy sessions. Fully compatible with PowerPoint, Keynote, and Google Slides.