


Características


¿Tienes alguna pregunta?
Recomendar


6 diapositivas
Home Security Infographics
Enhance your home security awareness with our Home Security infographic template. This template is fully compatible with popular presentation software like PowerPoint, Keynote, and Google Slides, allowing you to easily customize it to illustrate and communicate various aspects of home security measures and best practices. The Home Security infographic template offers a visually engaging platform to outline home security strategies, including alarm systems, surveillance, access control, and safety tips. Whether you're a homeowner, security professional, or simply interested in safeguarding your property and loved ones, this template provides a user-friendly canvas to create informative presentations and educational materials. Optimize your home security with this SEO-optimized Home Security infographic template, thoughtfully designed for clarity and ease of use. Customize it to showcase security device options, safety checklists, emergency procedures, and the importance of a secure home environment, ensuring that your audience gains valuable insights into this critical aspect of personal safety. Start crafting your personalized infographic today to bolster your home security knowledge and practices.


6 diapositivas
Supply & Freight Route Management Deck Presentation
Take your logistics reporting to the next level with this circular supply route diagram. Ideal for visualizing freight movement, delivery checkpoints, and warehouse coordination, this slide offers a clean and organized way to map your operational flow. Fully compatible with PowerPoint, Keynote, and Google Slides.


20 diapositivas
Cometis Small Business Pitch Deck Presentation
Introduce your business effectively with this pitch deck template, crafted for small businesses seeking impactful presentations. From company overview to objectives and strategies, this design is tailored to highlight your key messages. Dive into sections such as business highlights, team introductions, and future goals while maintaining a professional flow. This template includes callout slides, break announcements, and customizable placeholders for your brand visuals and content. Ideal for pitching ideas to stakeholders or presenting at workshops, it ensures clarity and engagement. Compatible with PowerPoint, Google Slides, and Keynote, it offers flexibility across platforms.


24 diapositivas
Machina UX Design Presentation
The UX Design Presentation Template is tailored for user experience projects. Covering sections like user research, personas, wireframes, prototyping, and usability guidelines, it offers a clean, professional layout. Fully customizable and compatible with PowerPoint, Keynote, and Google Slides, it's perfect for showcasing your design process and insights with clarity.

20 diapositivas
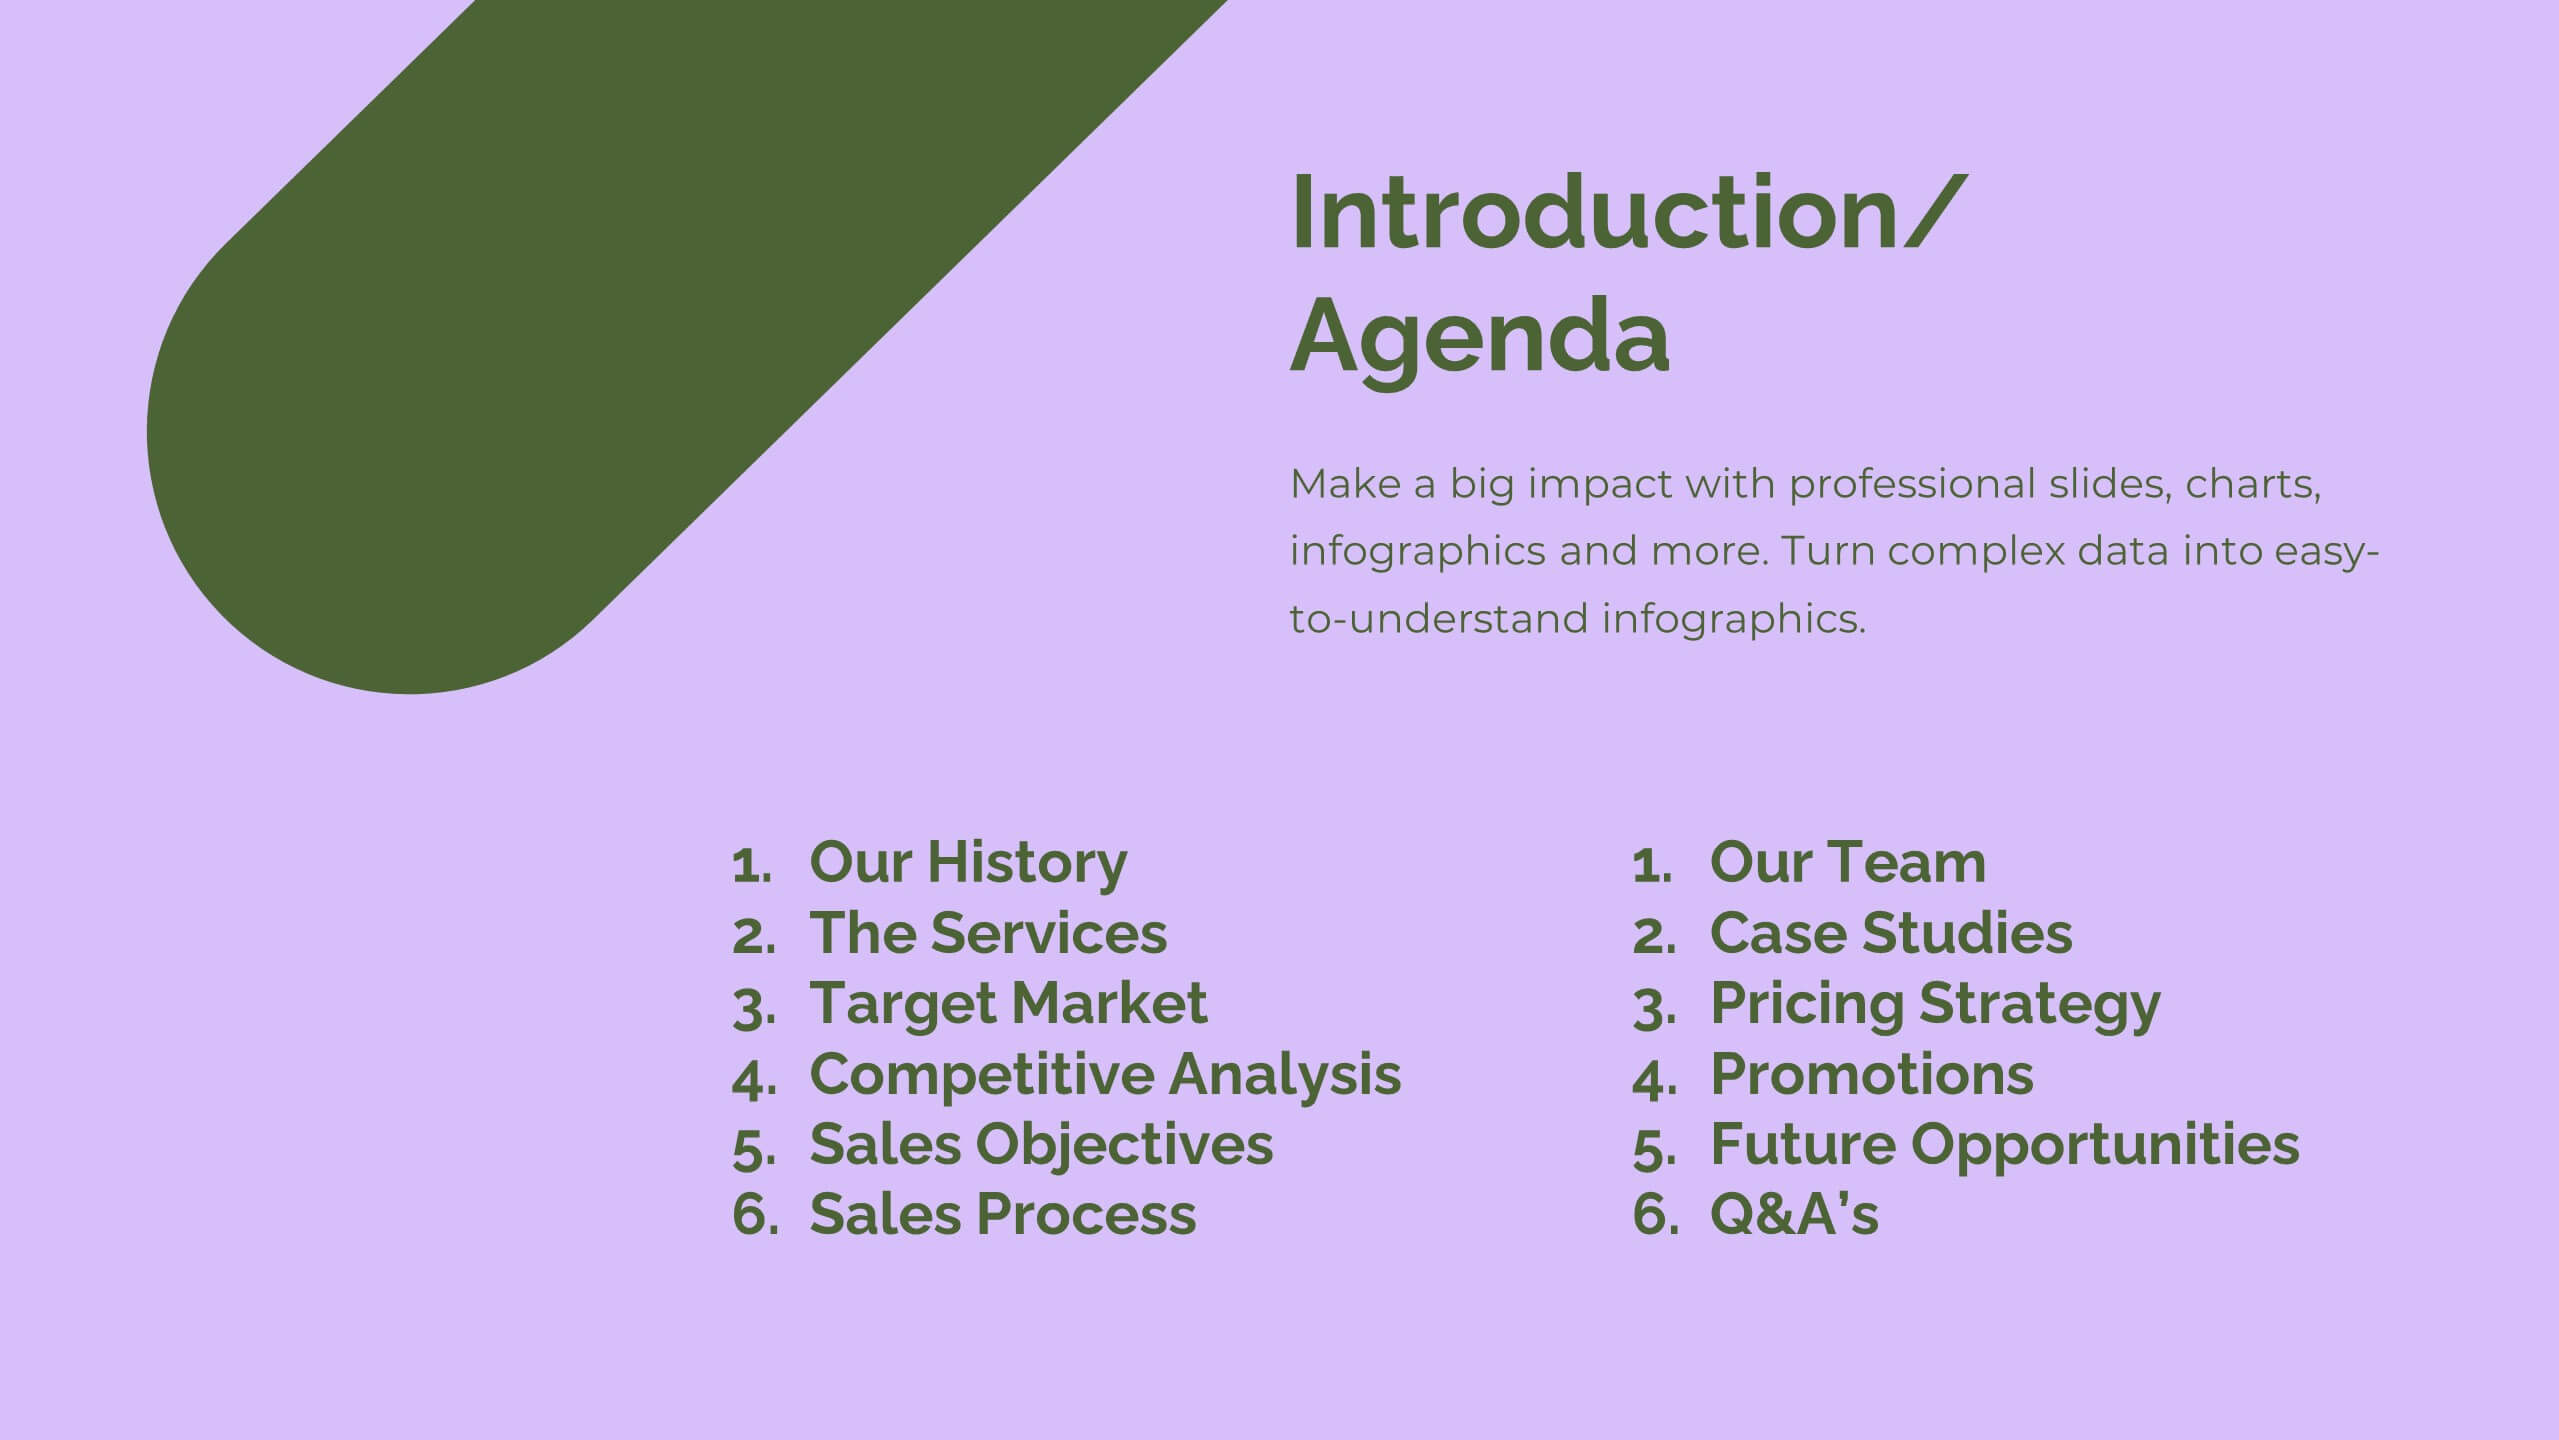
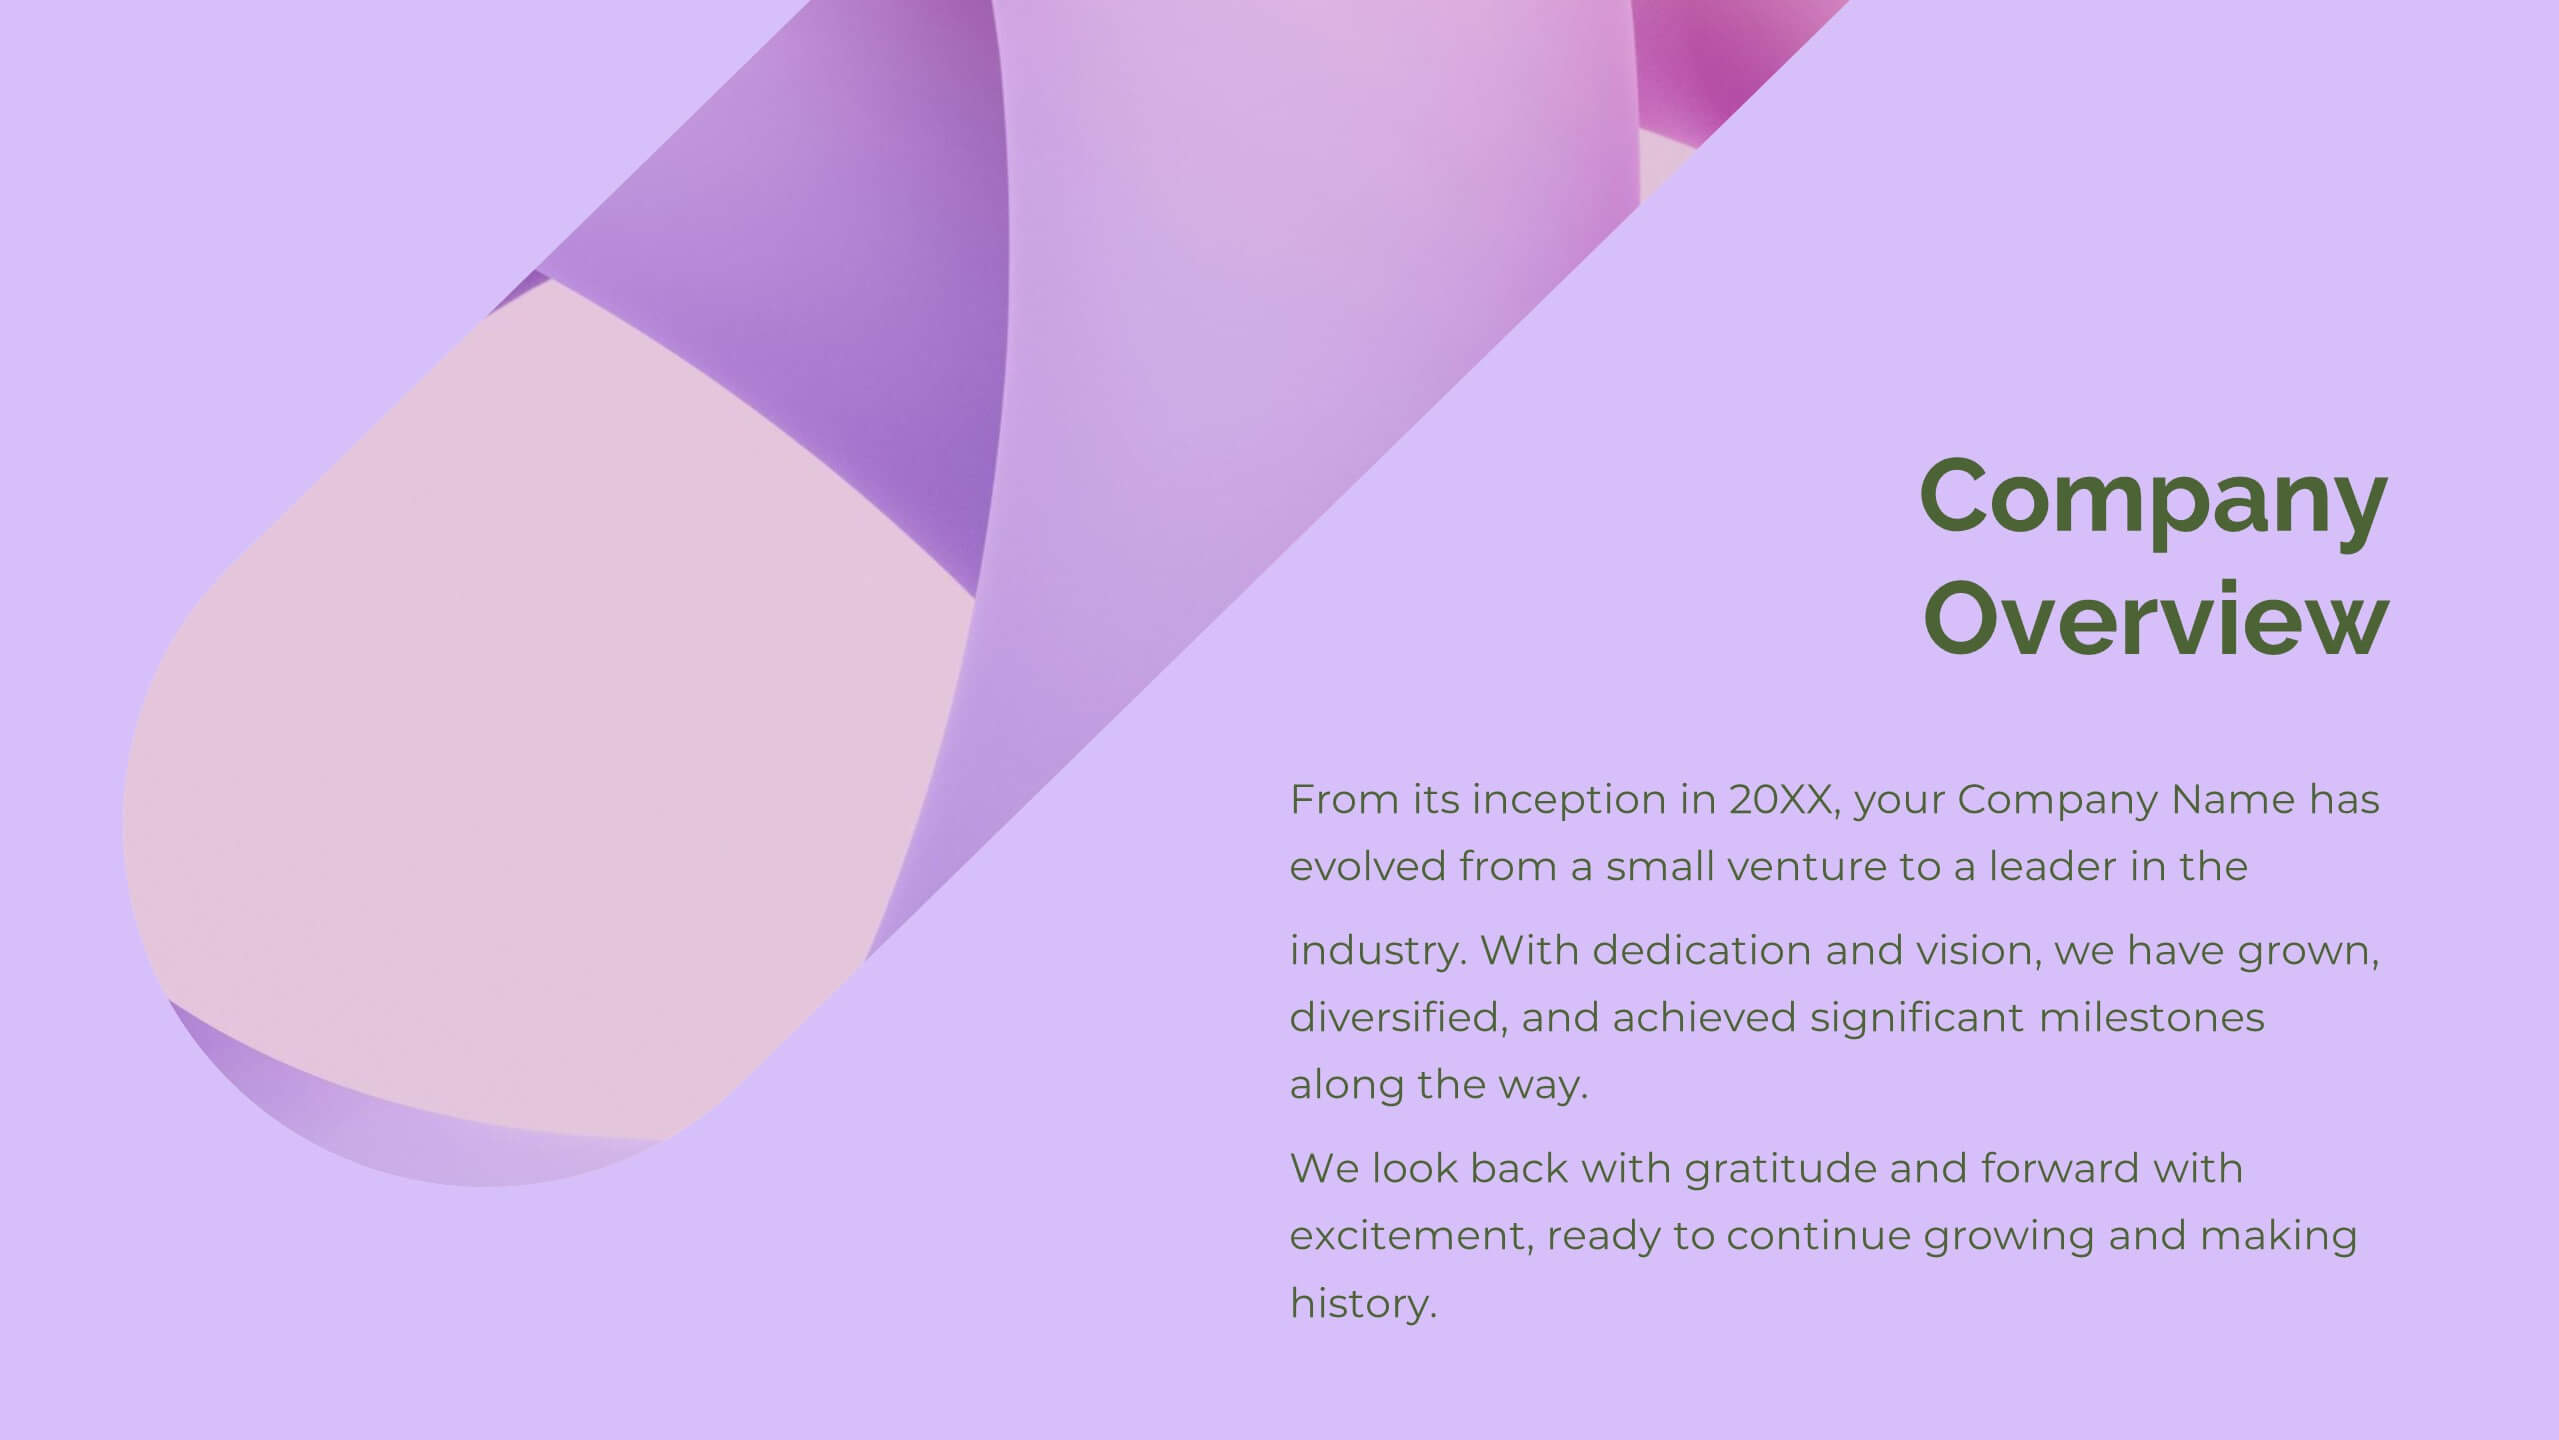
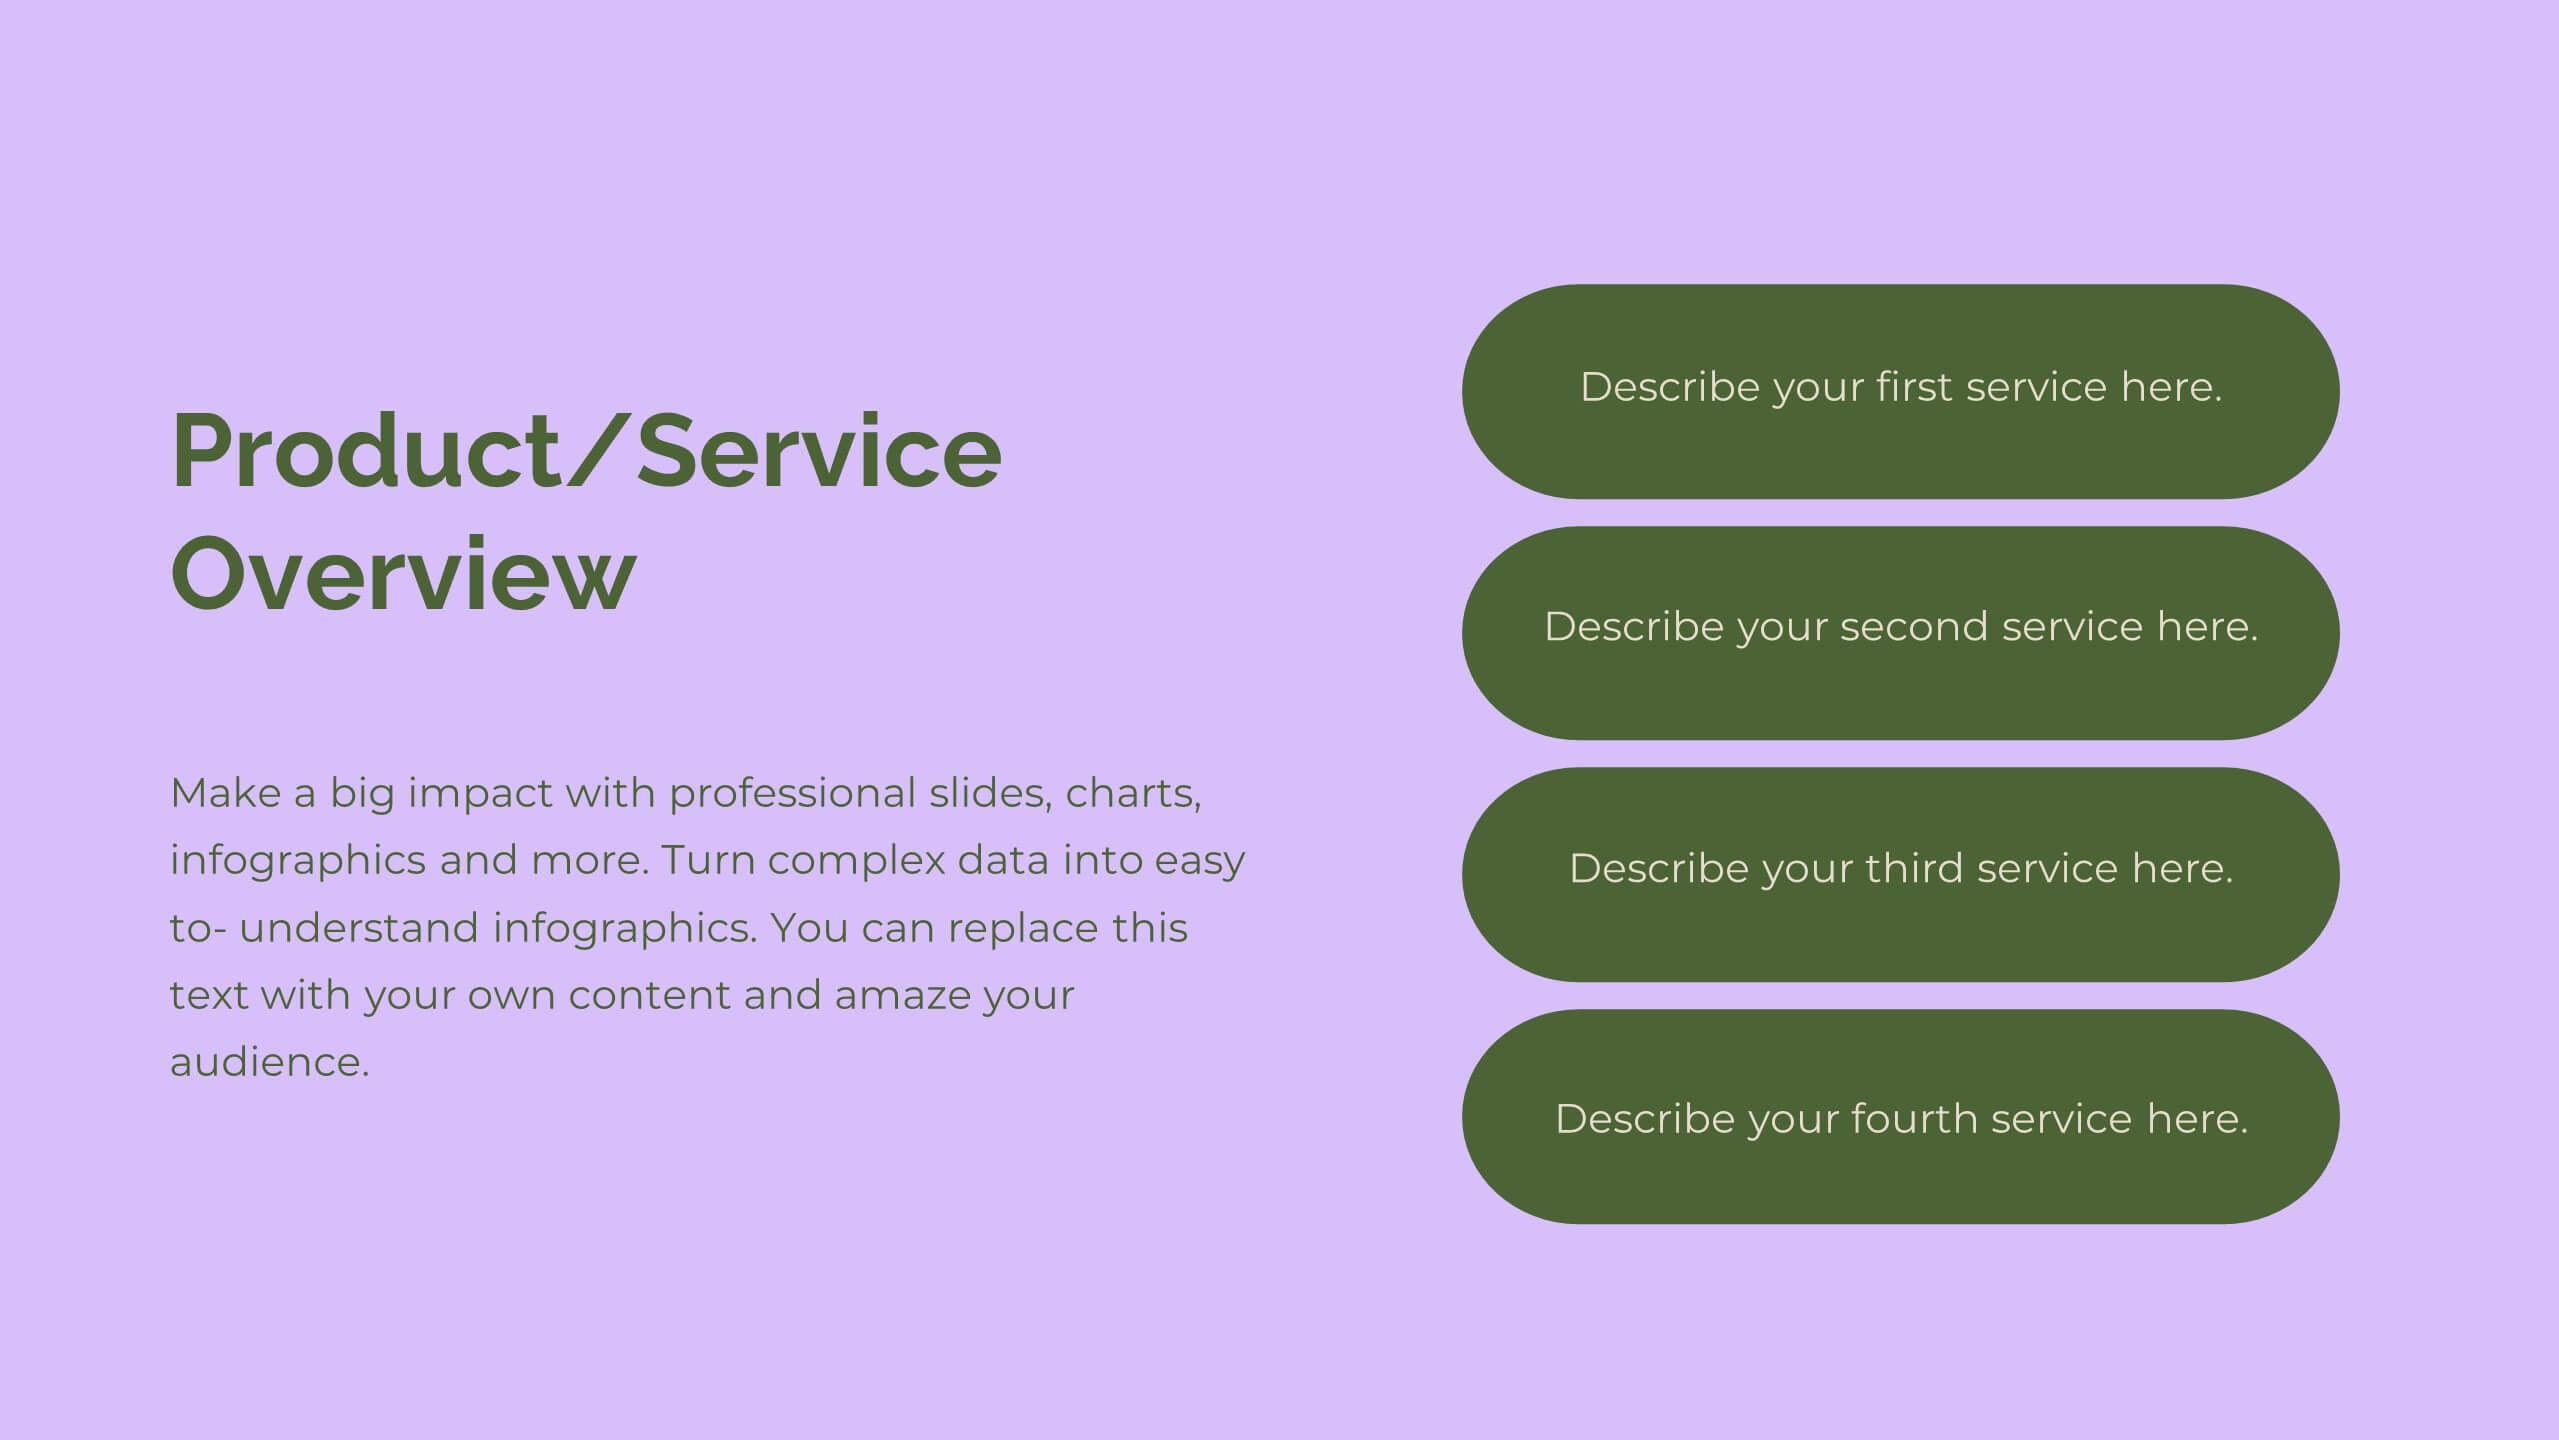
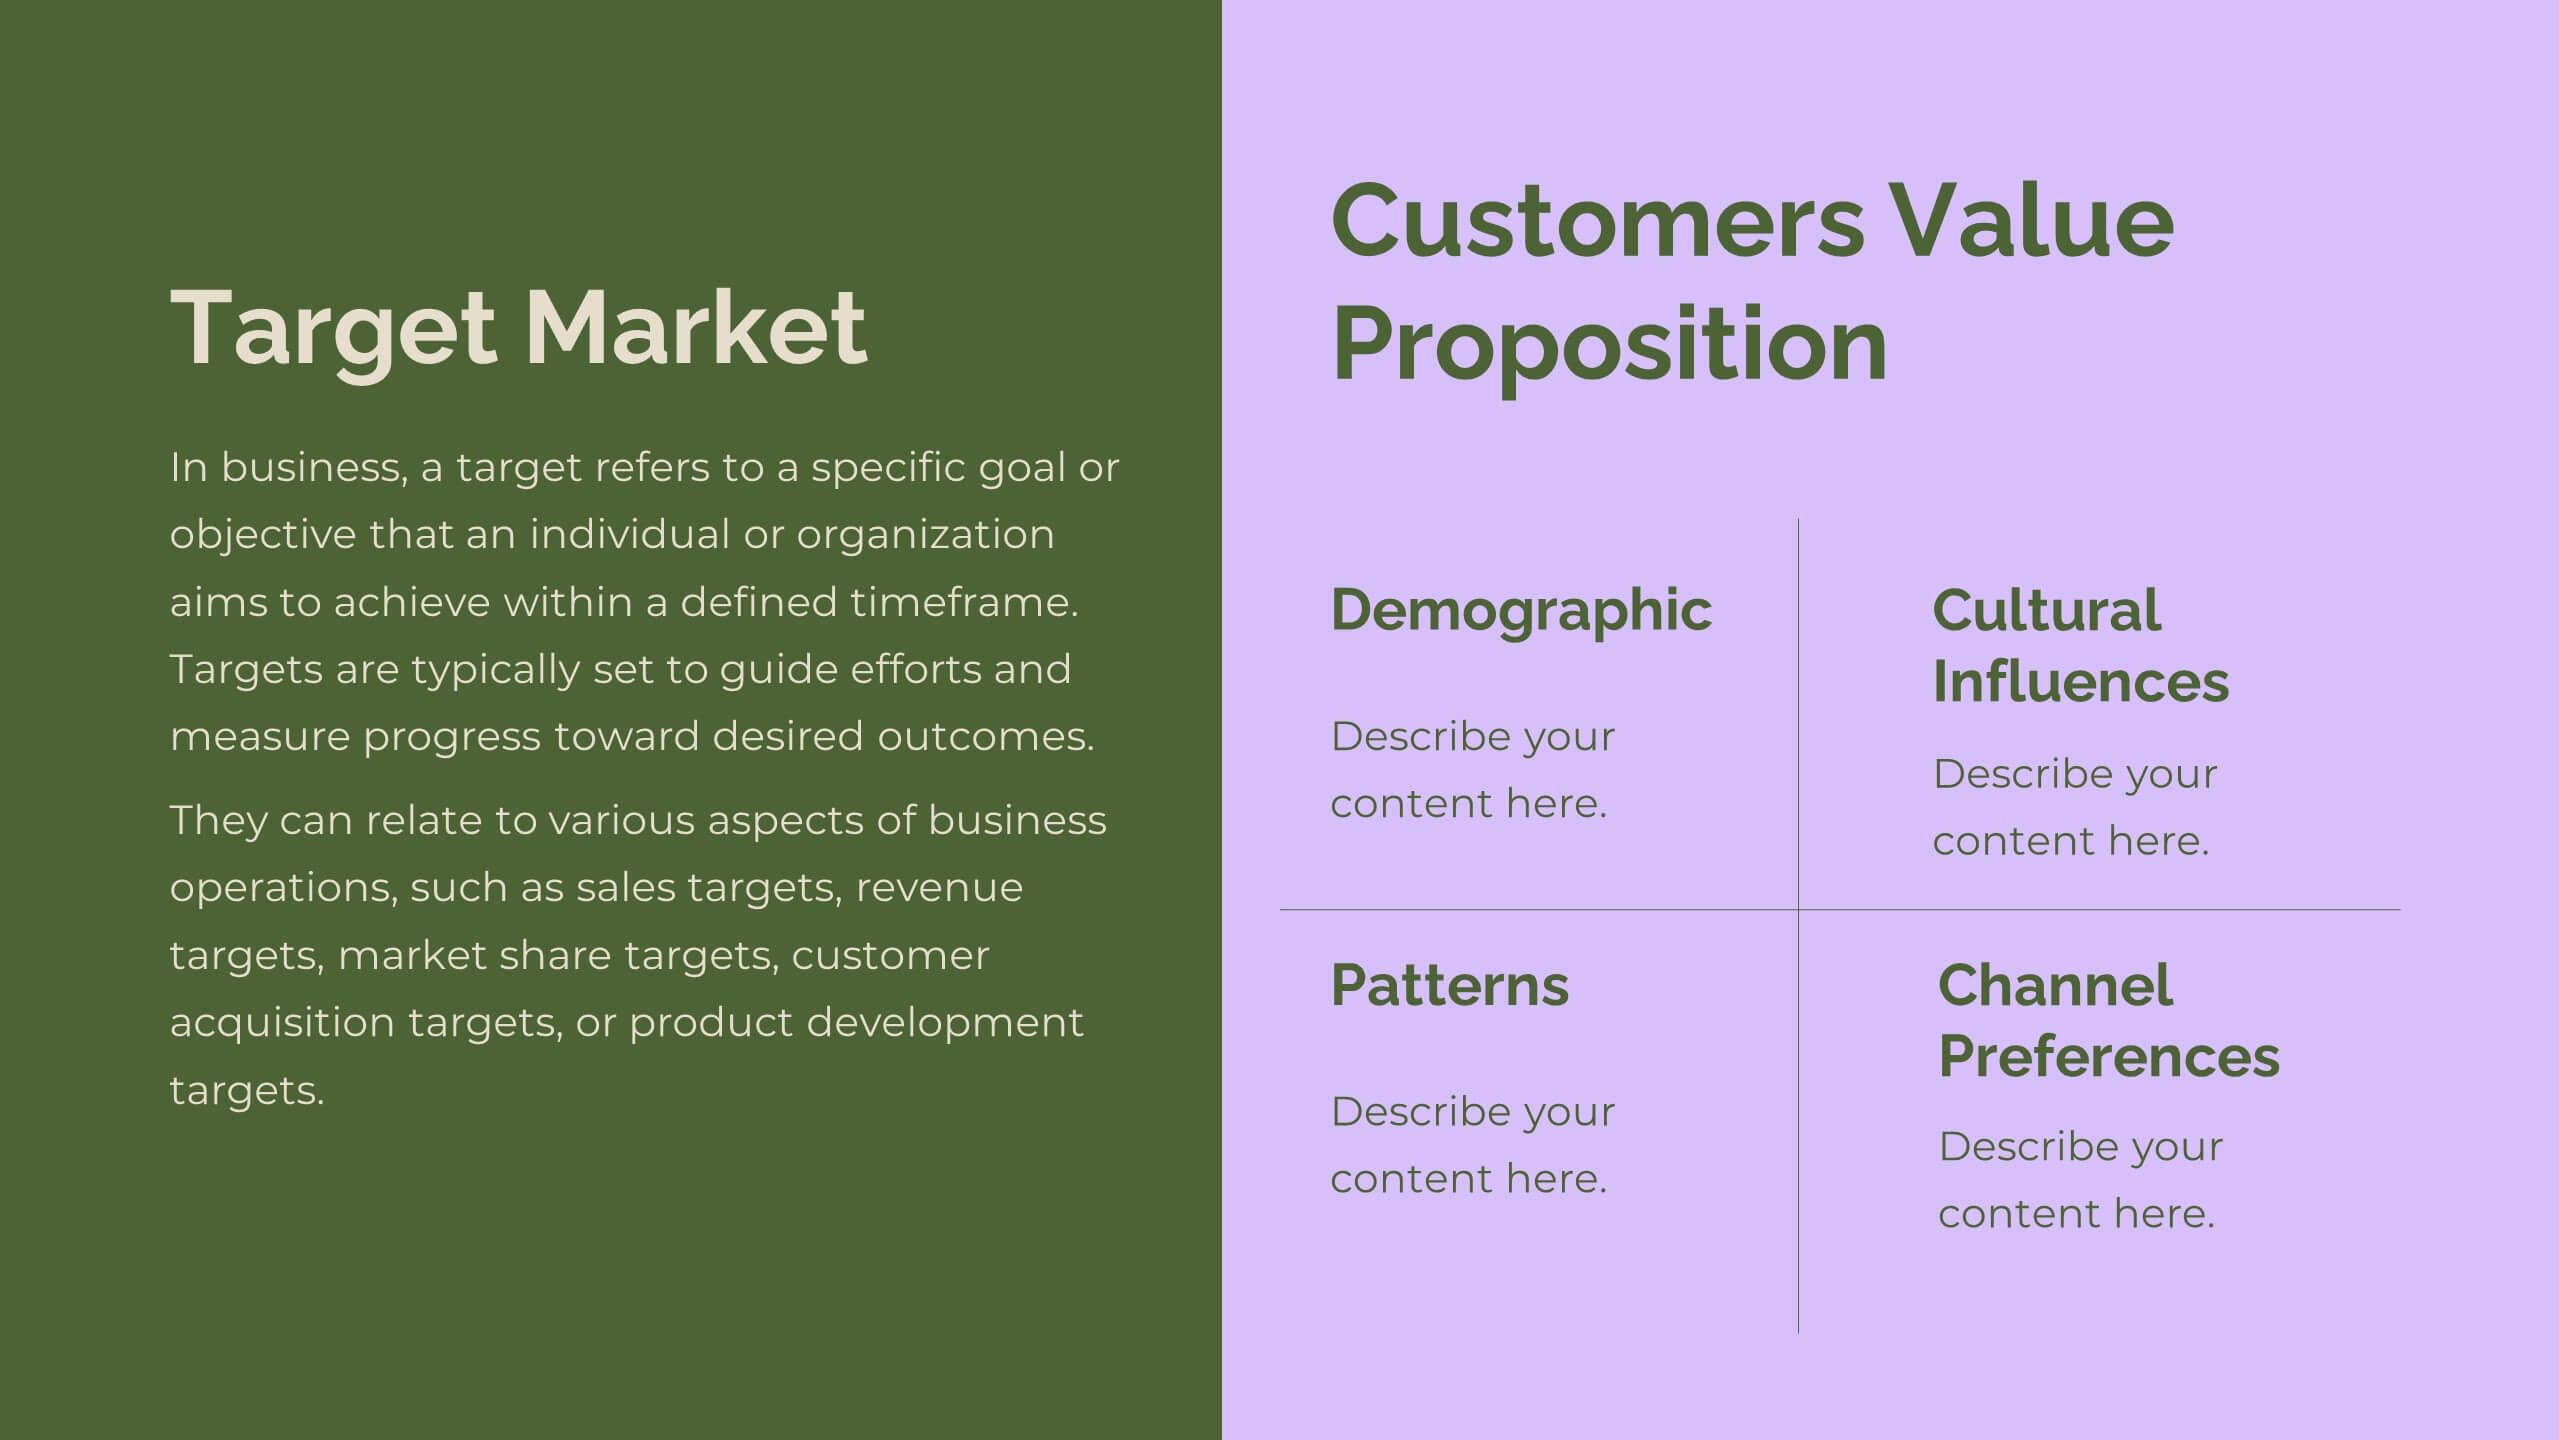
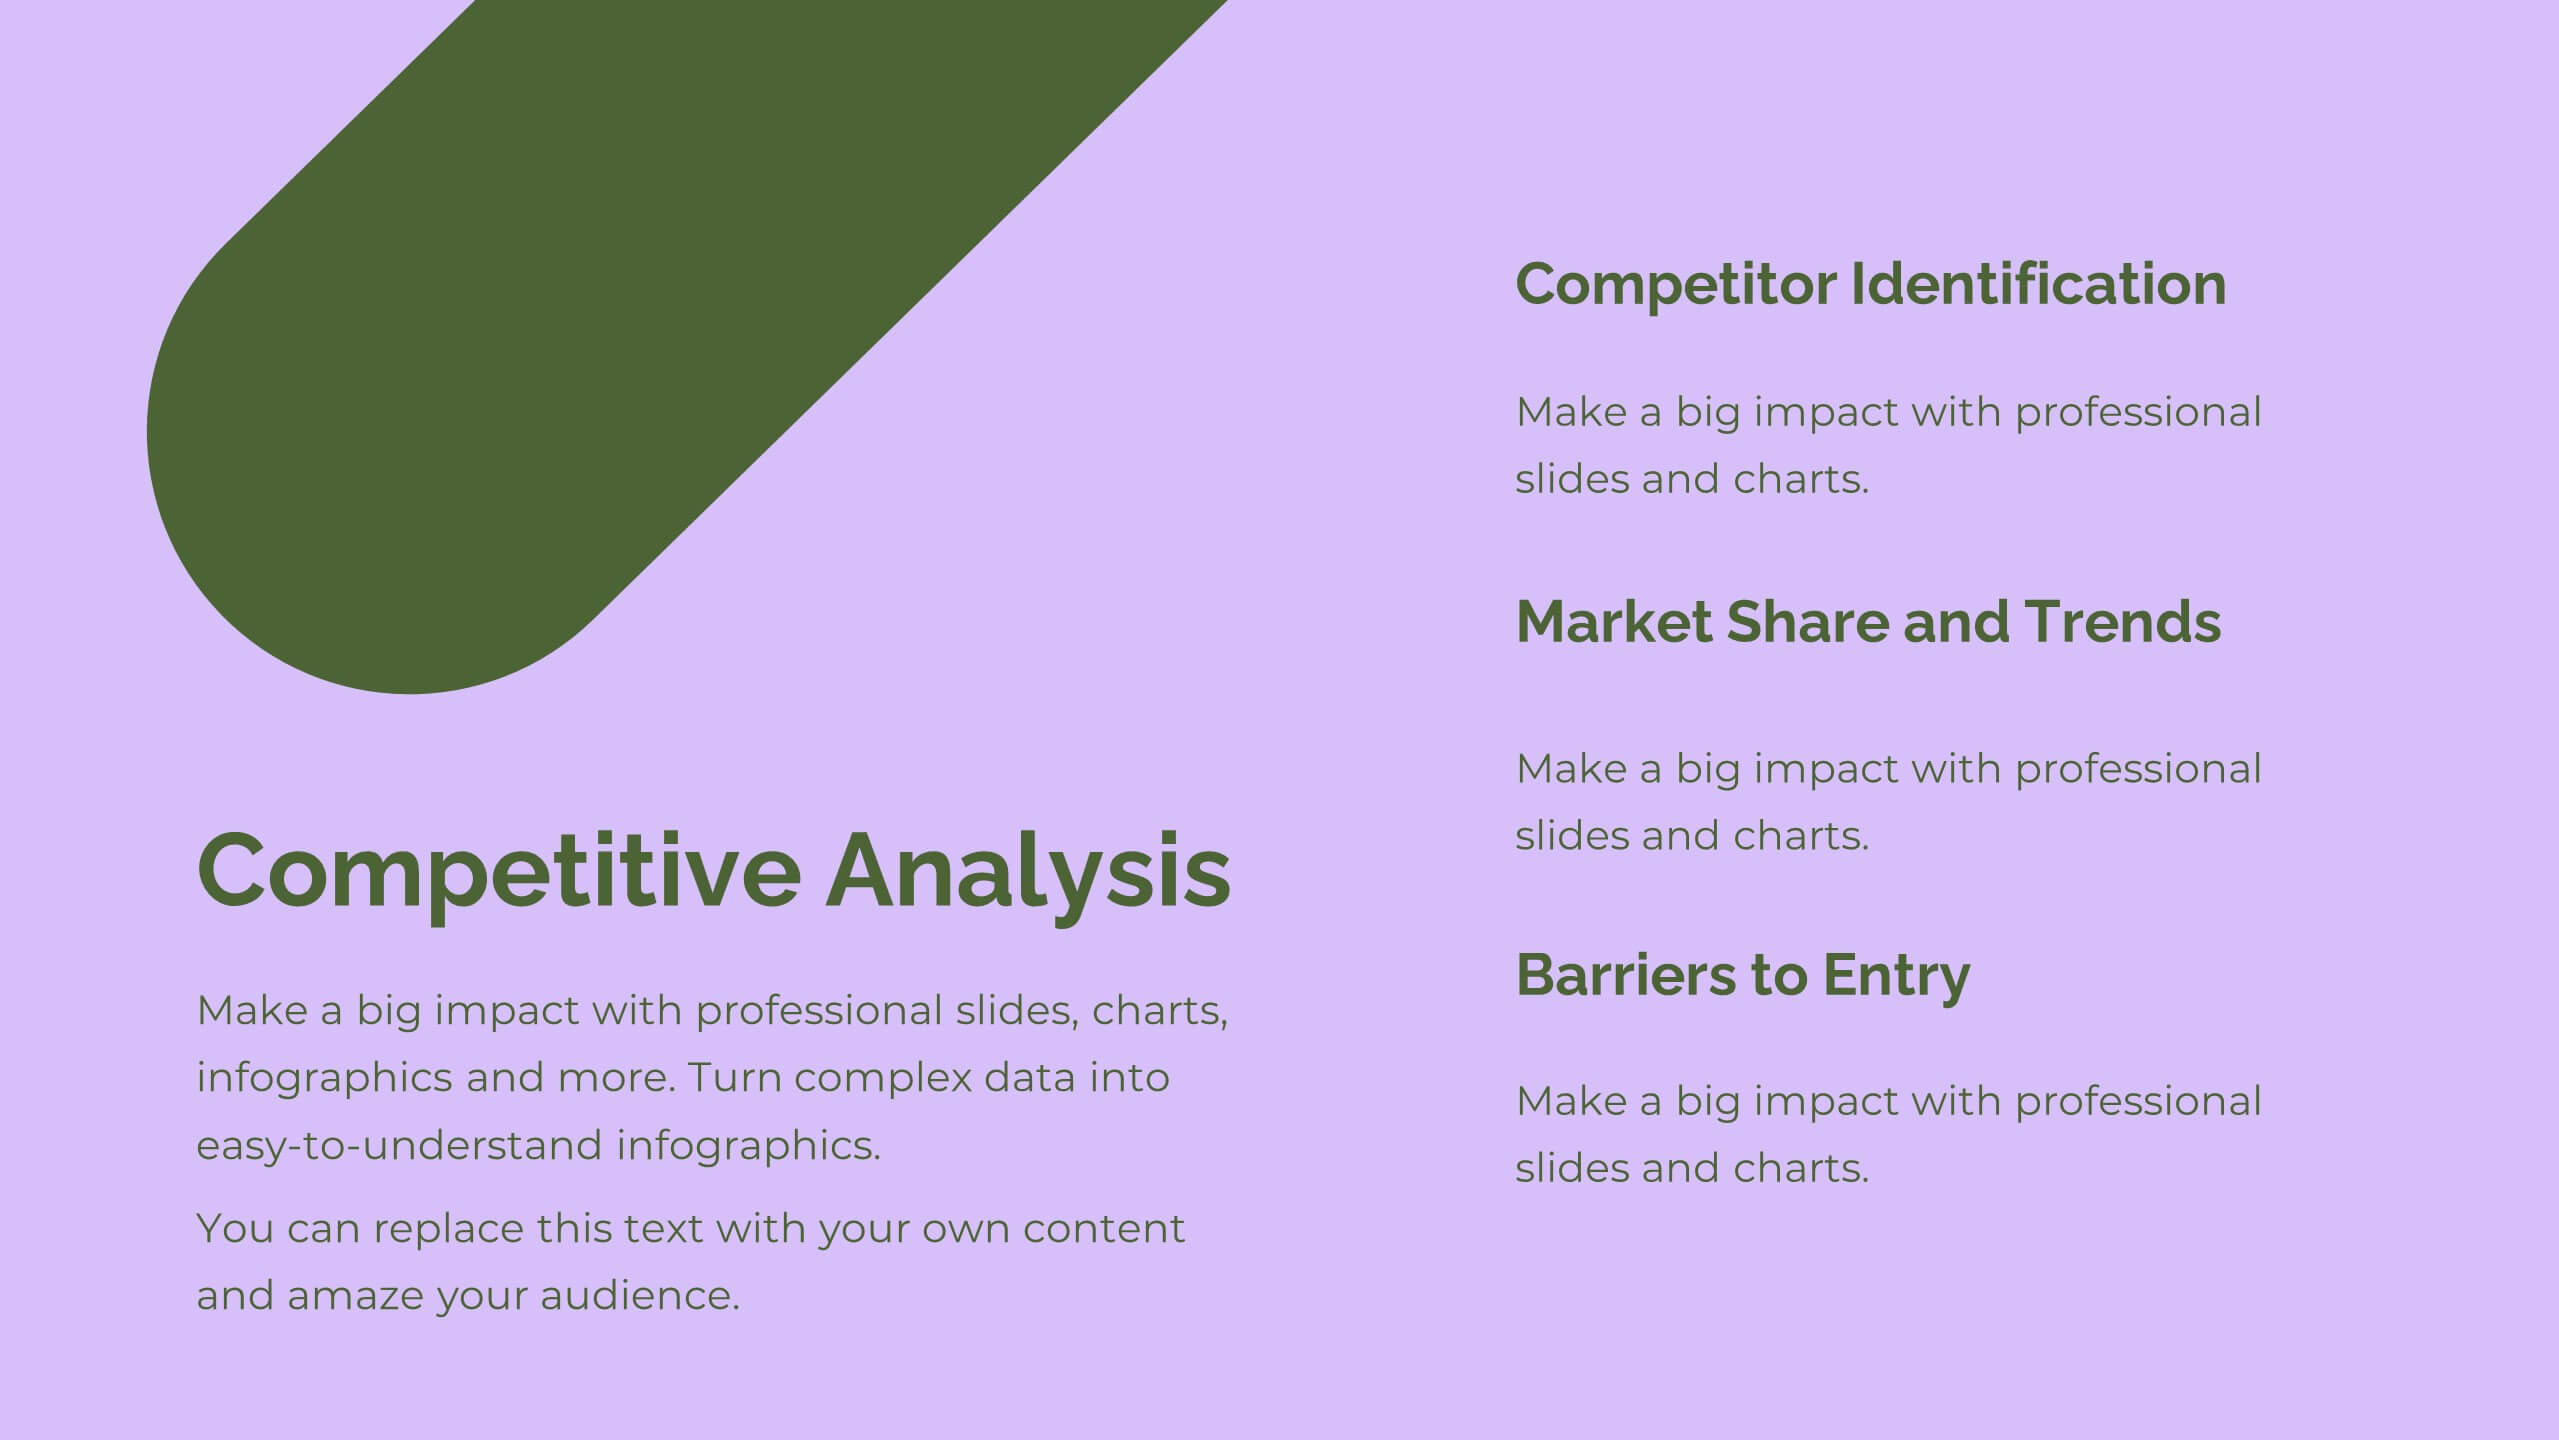
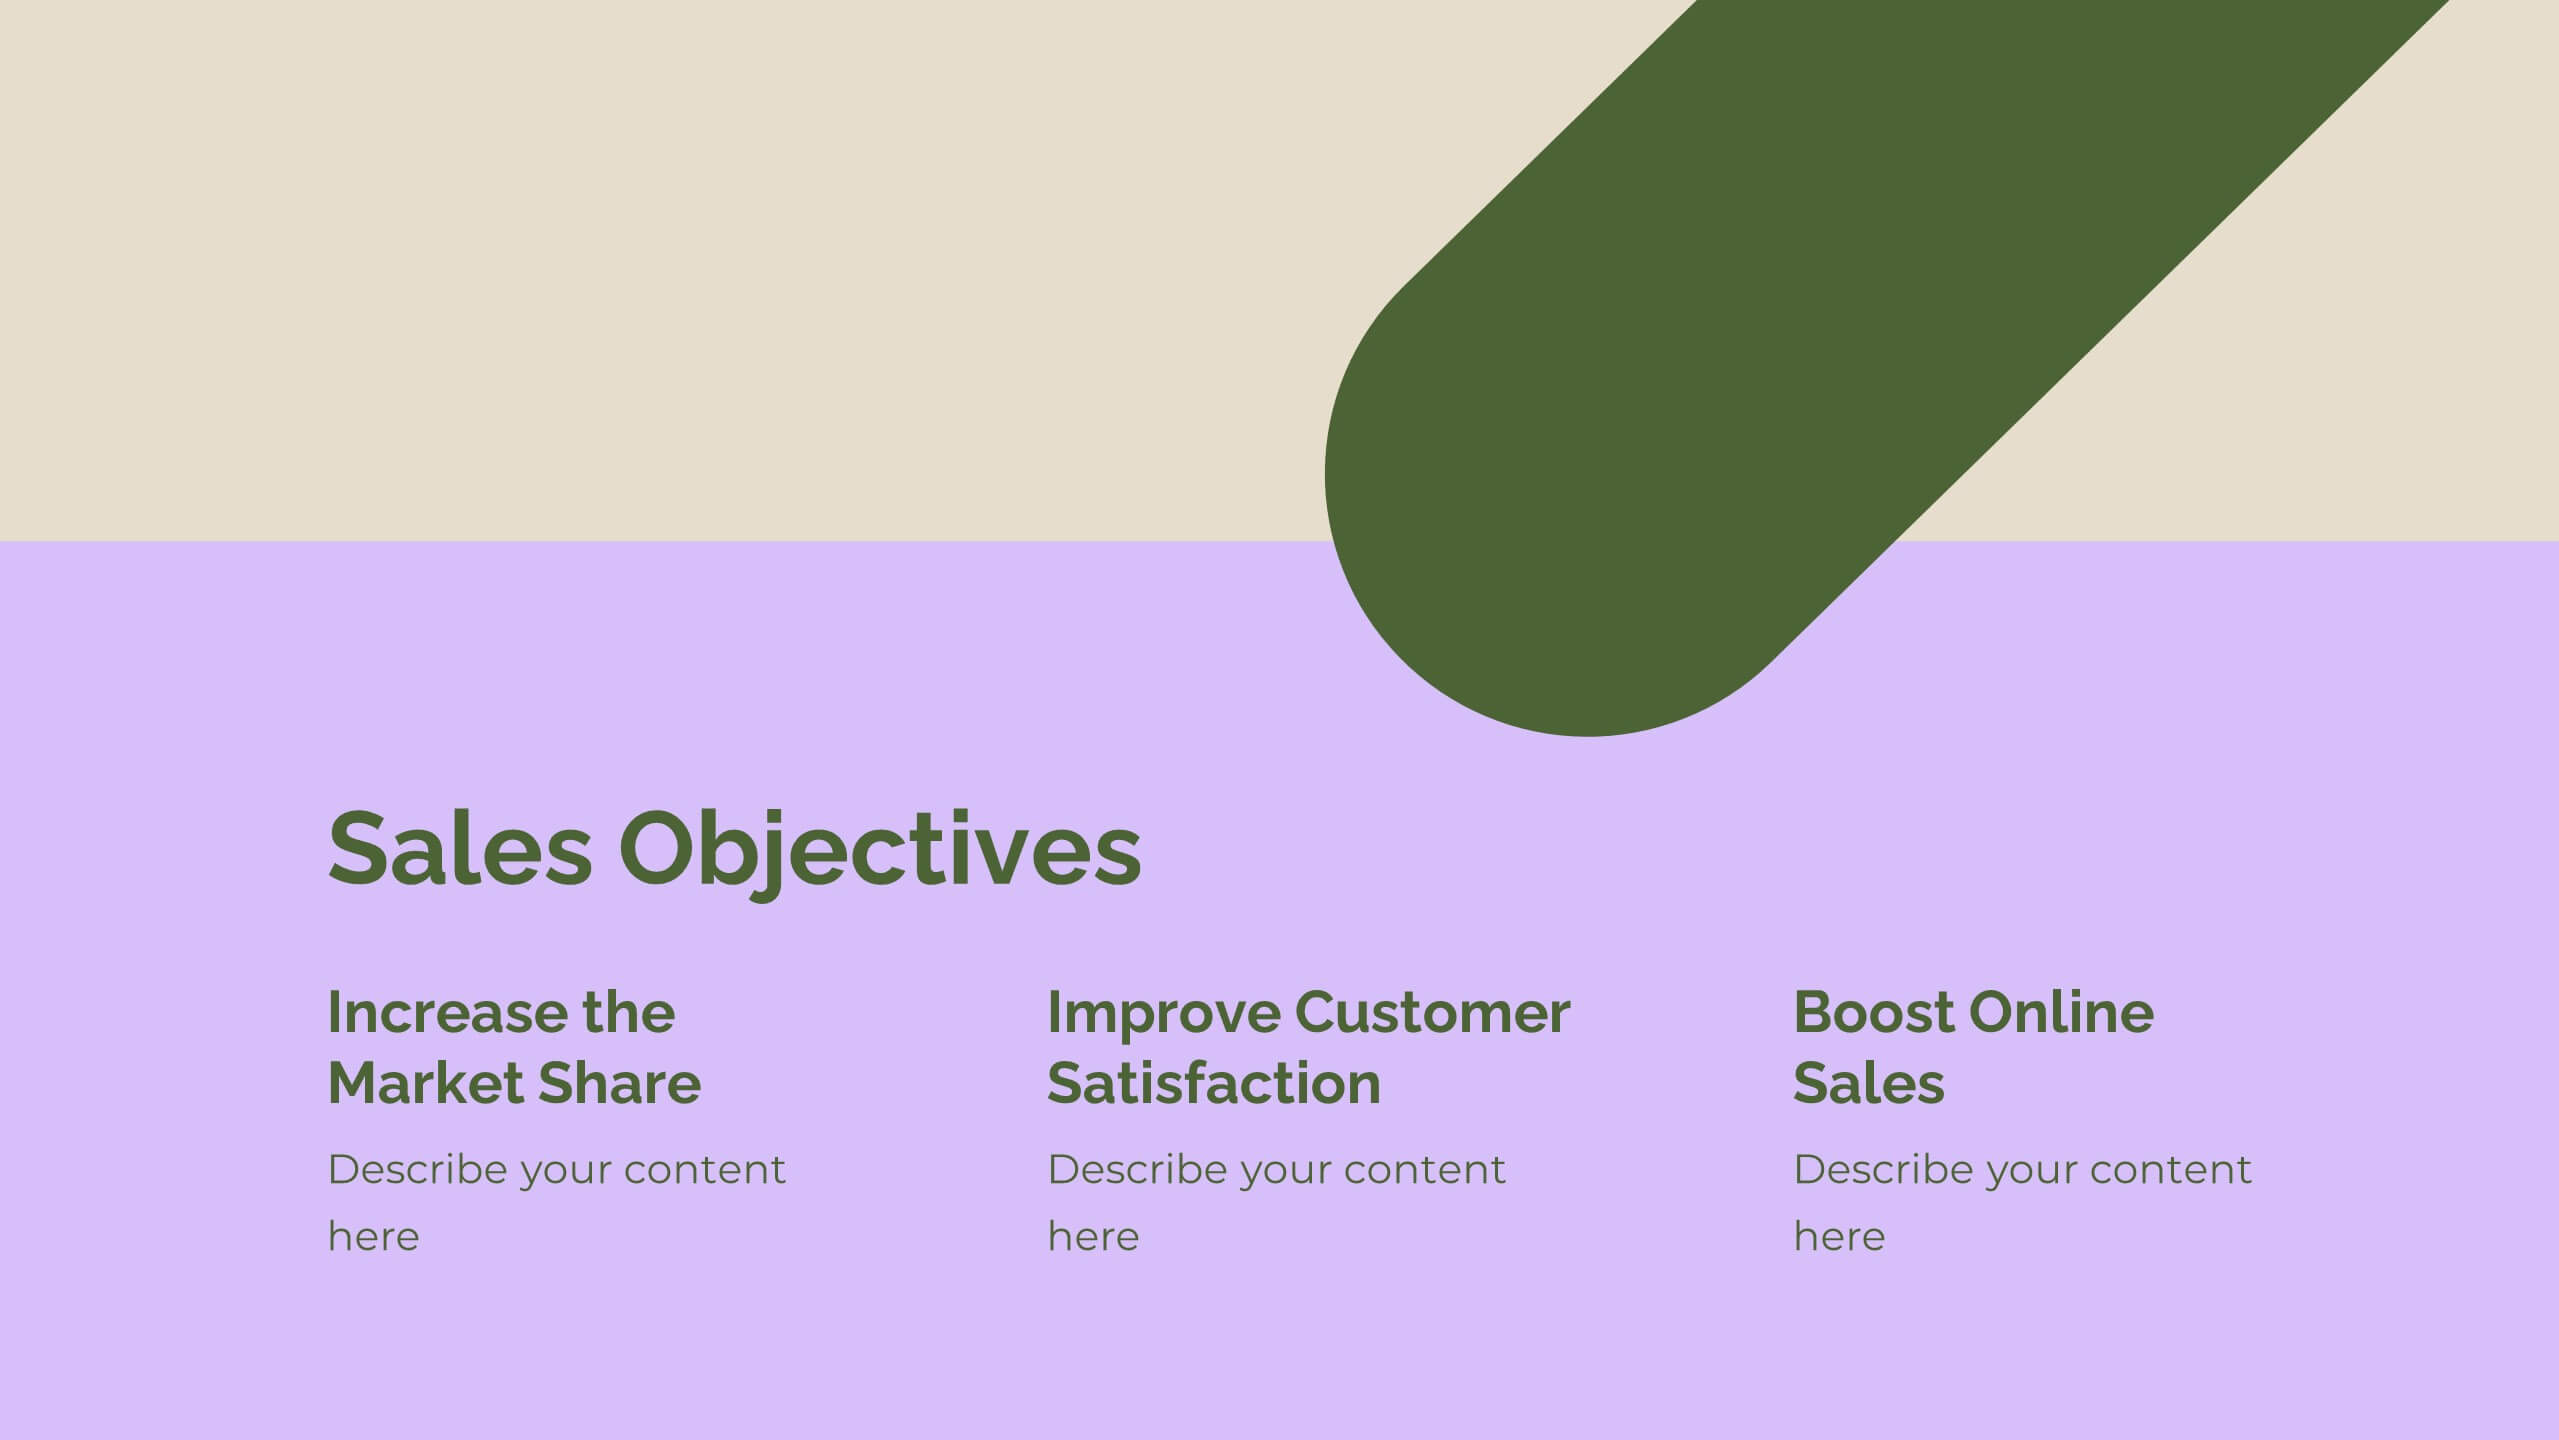
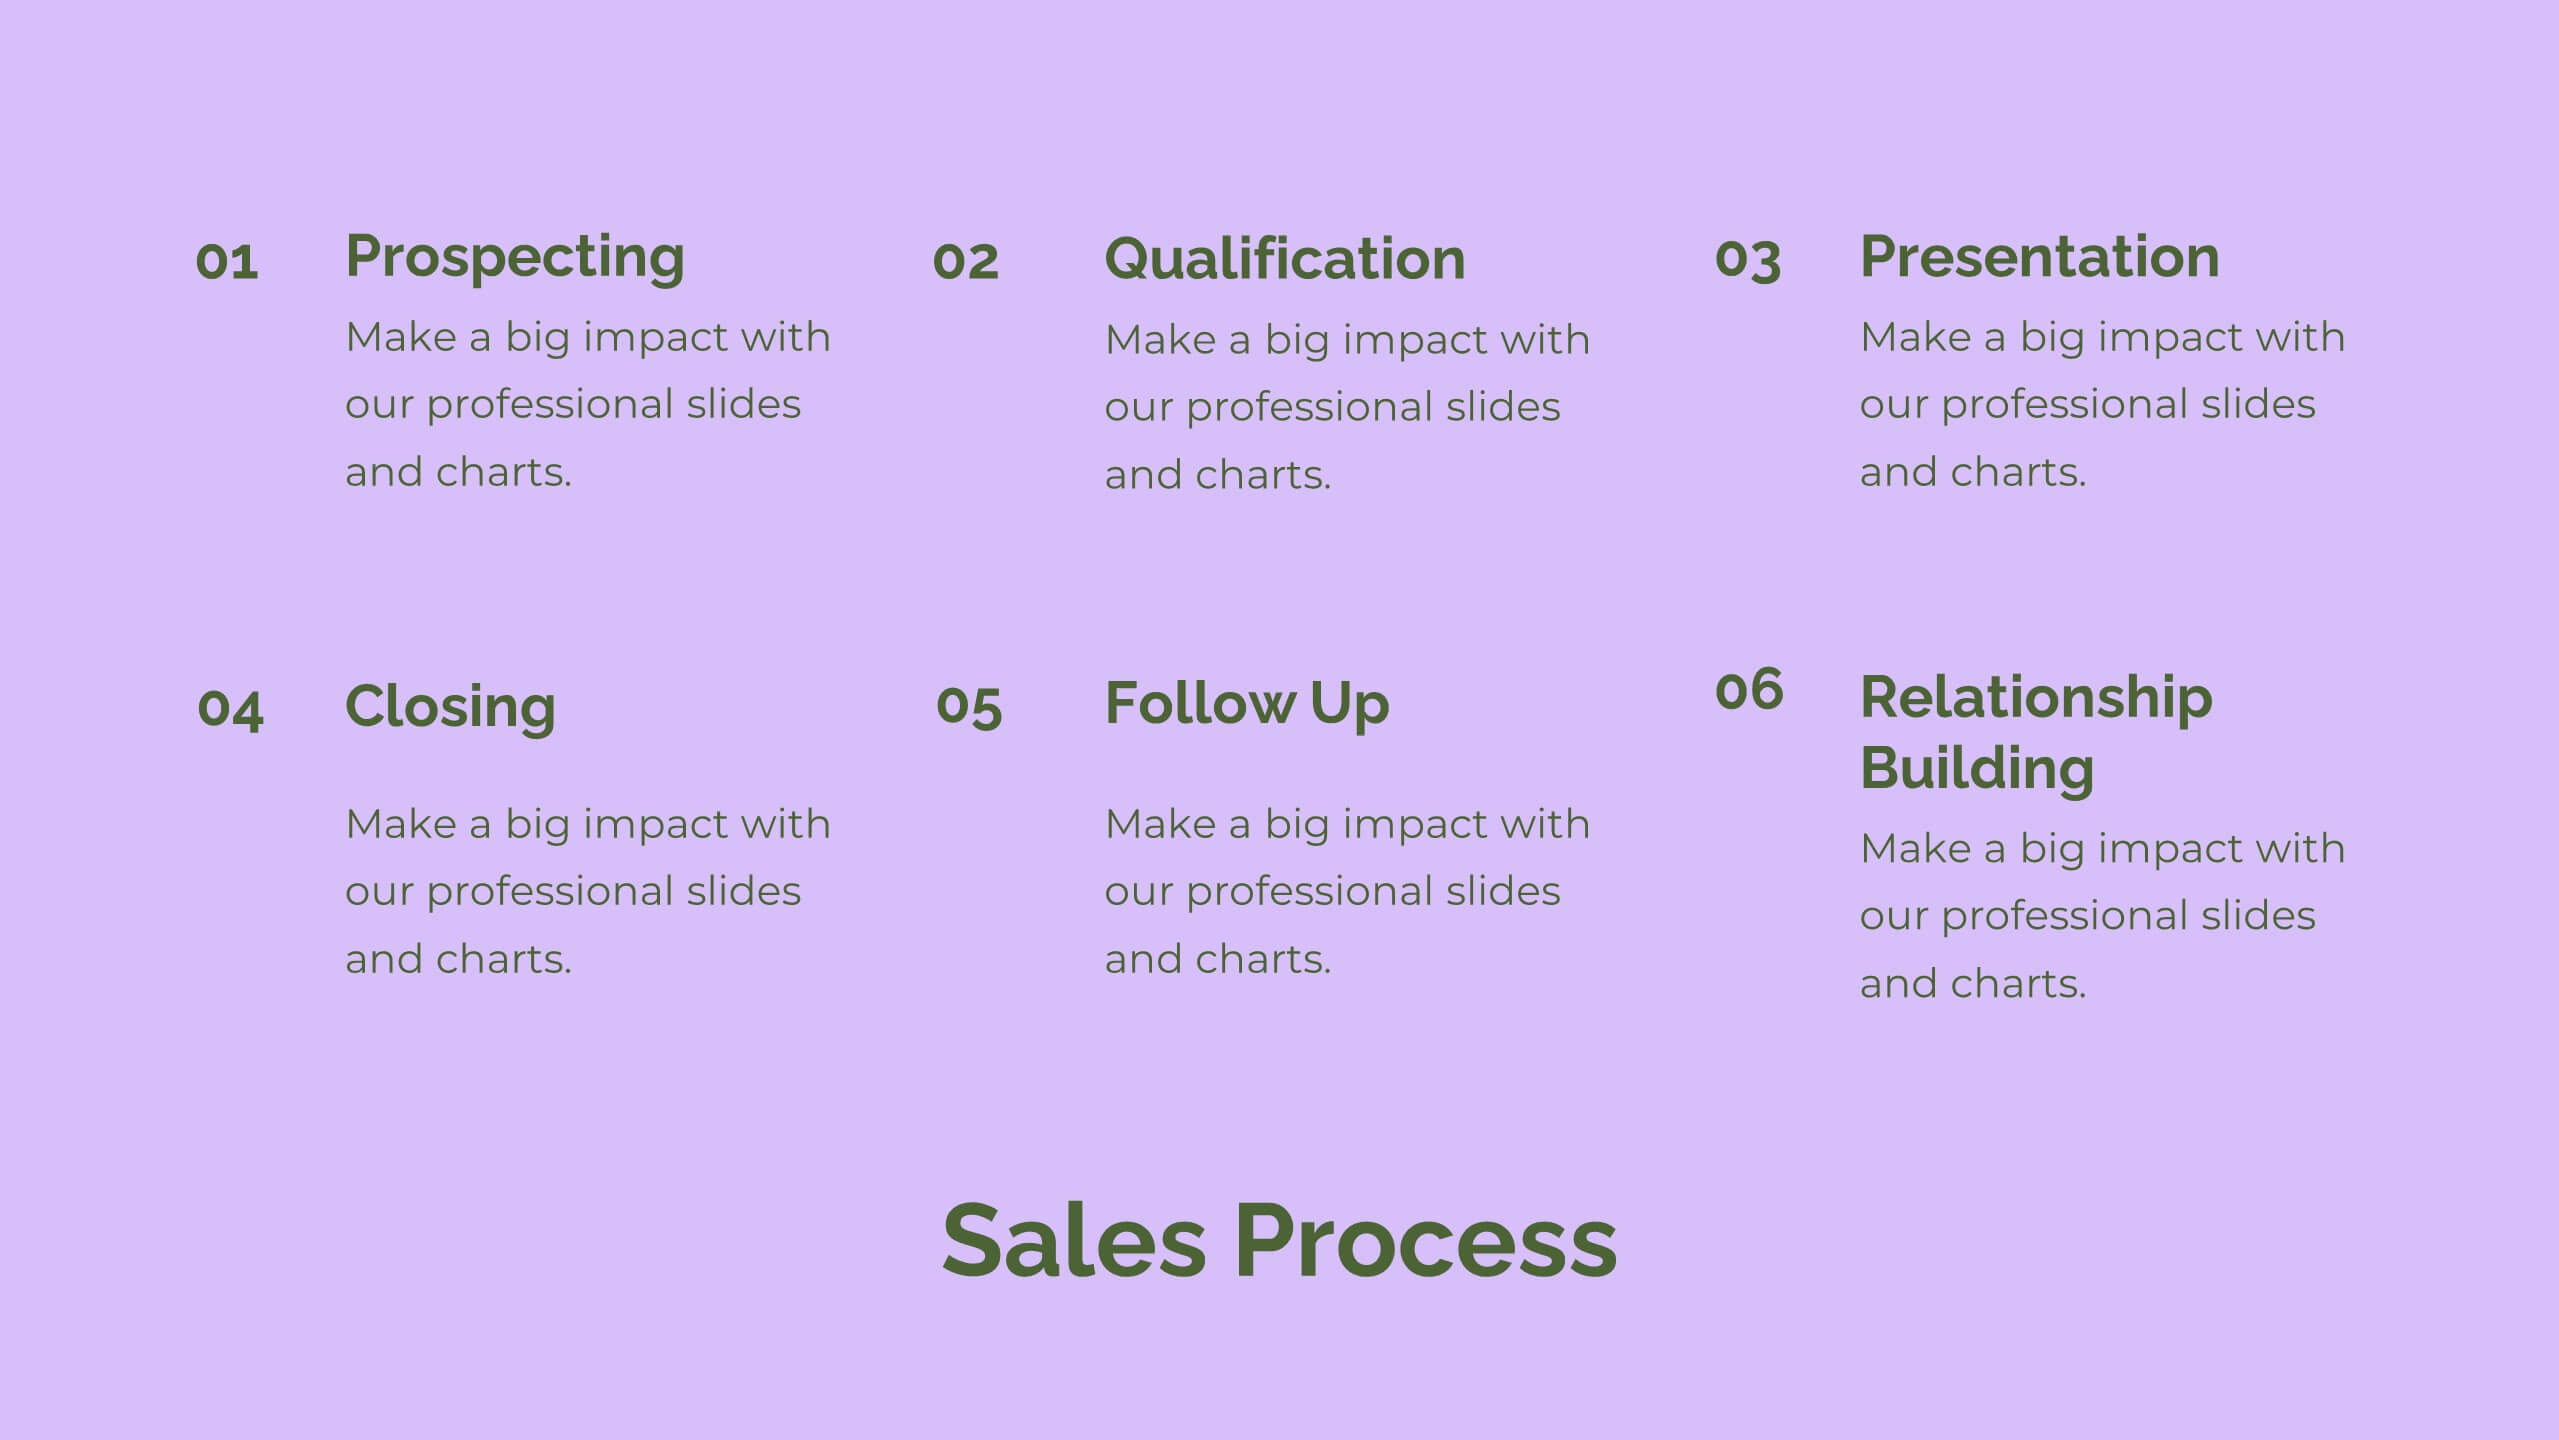
Glint Sales Strategy Presentation
Boost your sales performance with this dynamic sales strategy template! Perfect for presenting your company overview, product details, and competitive analysis, it includes slides for sales objectives, pricing strategy, and performance metrics. Engage your team with vibrant visuals and clear, structured content. Compatible with PowerPoint, Keynote, and Google Slides for seamless presentations on any platform.


10 diapositivas
Corporate Business Plan Strategy Presentation
Present your strategy with professionalism using this Corporate Business Plan slide. Designed with a handshake graphic and clean icon-labeled sections, this layout is ideal for showcasing four key pillars—such as partnerships, operations, goals, and performance. Each title is fully editable, helping you keep your message clear and concise. Compatible with PowerPoint, Keynote, and Google Slides.


6 diapositivas
Corporate Company Profile Presentation
Showcase Your Business with a Professional Company Profile! The Corporate Company Profile template is designed to present your brand, values, and key highlights in a structured and visually appealing format. Featuring modern circular image placements, strategic content sections, and sleek infographics, this template is ideal for introducing your company, highlighting milestones, and communicating your business strategy. Fully editable in PowerPoint, Keynote, and Google Slides, this design ensures seamless customization for any industry.


4 diapositivas
Strategic Planning Gap Assessment
Visualize growth opportunities with this Strategic Planning Gap Assessment template. Perfect for showcasing the gap between actual progression and potential performance over time. Ideal for risk evaluation, diversification, and product development planning. Fully editable for PowerPoint, Keynote, and Google Slides.


6 diapositivas
Overlapping Venn Diagram Comparison Presentation
Highlight similarities and distinctions with the Overlapping Venn Diagram Comparison Presentation. This template is perfect for showcasing three interconnected concepts, ideas, or departments in a clean and professional layout. Each circle is color-coded and labeled, with the intersections visually emphasizing shared elements. Ideal for project planning, business analysis, or strategic presentations. Fully editable in PowerPoint, Keynote, and Google Slides.


6 diapositivas
Cloud Computing Infrastructure Overview Presentation
Break down complex systems with ease using the Cloud Computing Infrastructure Overview slide. This layout features a central cloud icon with multiple surrounding components, perfect for mapping out services, connections, or infrastructure layers. Fully editable in PowerPoint, Keynote, and Google Slides.


20 diapositivas
Sylph Design Portfolio Presentation
Dive into a creative journey with this visually striking design portfolio presentation template! Ideal for showcasing design processes, mood boards, and final outcomes, it’s perfect for impressing clients or stakeholders. Highlight your design skills and methodology with this modern, sleek format. Compatible with PowerPoint, Keynote, and Google Slides for seamless integration into your workflow.


6 diapositivas
Team Collaboration Overview Presentation
Showcase team structure and collaboration dynamics with this clear, visual overview. Highlight roles, communication flow, and key contributors using a clean layout with up to five team members. Ideal for onboarding, planning, or reporting sessions. Fully editable in PowerPoint, Keynote, and Google Slides—perfect for any organizational or project-based setting.


20 diapositivas
Feronia Marketing Proposal Presentation
Present your marketing strategy with this visually engaging proposal deck, featuring sections on objectives, methodology, budget breakdown, and client testimonials. Ideal for structured presentations, it’s compatible with PowerPoint, Keynote, and Google Slides, offering a flexible format to captivate and convince clients or stakeholders.


6 diapositivas
5-Step Investment Planning Presentation
Guide your audience through a clear, structured journey with a modern layout that turns each financial step into a simple, visual milestone. This presentation helps you explain goals, outline processes, and communicate actionable insights with ease and clarity. Fully editable and compatible with PowerPoint, Keynote, and Google Slides.


12 diapositivas
Digital Threat Prevention Framework Presentation
Make cybersecurity visuals as clear as your strategy. This digital threat prevention infographic template helps break down complex security frameworks into visually engaging and easy-to-follow steps. Great for showcasing layered defenses or network protocols. Fully customizable and works seamlessly with PowerPoint, Keynote, and Google Slides.


5 diapositivas
Editable Data Charts Presentation
Bring your data to life with a clean, engaging layout that makes every insight easy to understand. This presentation helps you explain percentages, comparisons, and key metrics with clarity while keeping your narrative smooth and professional. Designed for clear data storytelling and effortless editing, it's fully compatible with PowerPoint, Keynote, and Google Slides.


4 diapositivas
Project Workflow Steps and Flowchart Presentation
Map out each phase of your project with clarity using the Project Workflow Steps and Flowchart Presentation. This detailed template offers a visual grid layout for illustrating task sequences, decision points, and team responsibilities. Ideal for project managers, analysts, and operations teams. Fully editable and compatible with PowerPoint, Keynote, and Google Slides.