


Características


¿Tienes alguna pregunta?
Recomendar

22 diapositivas
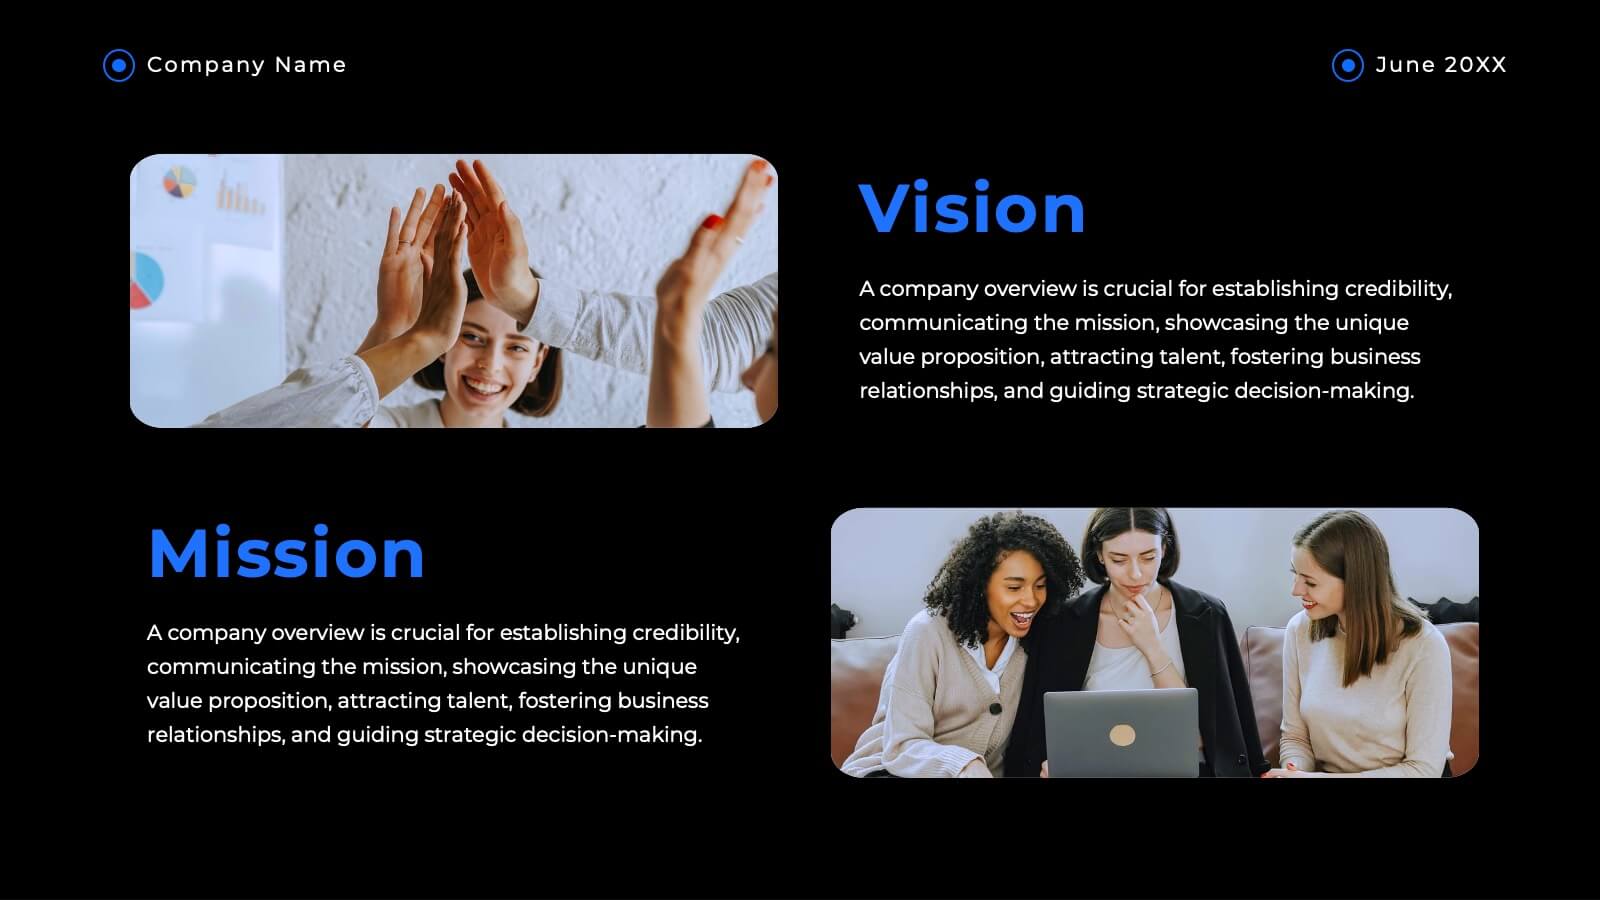
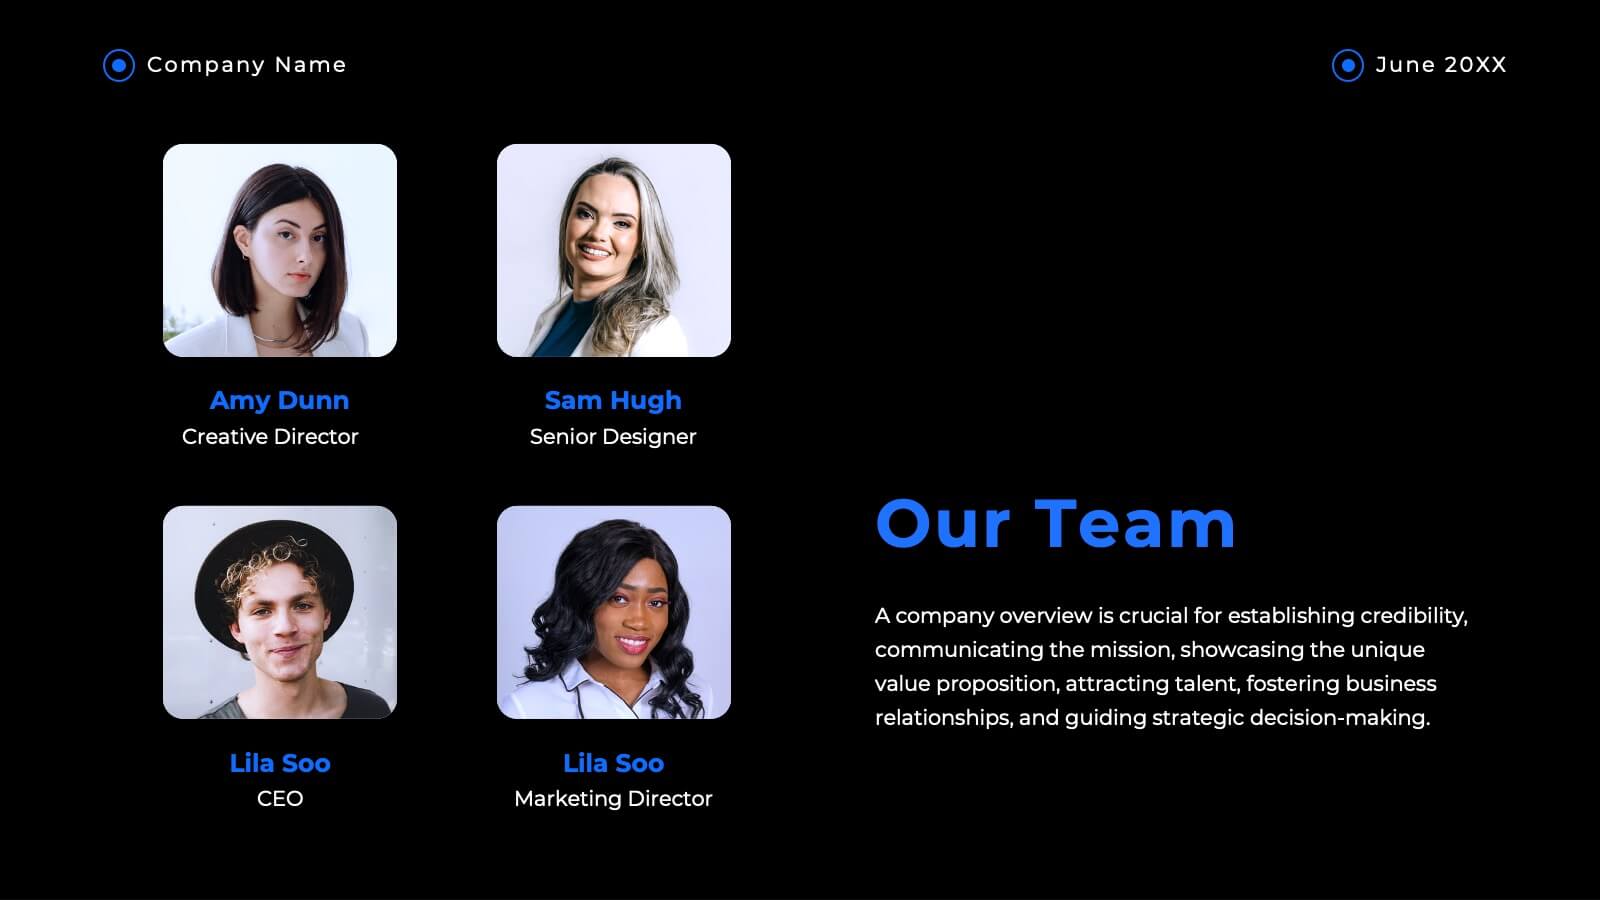
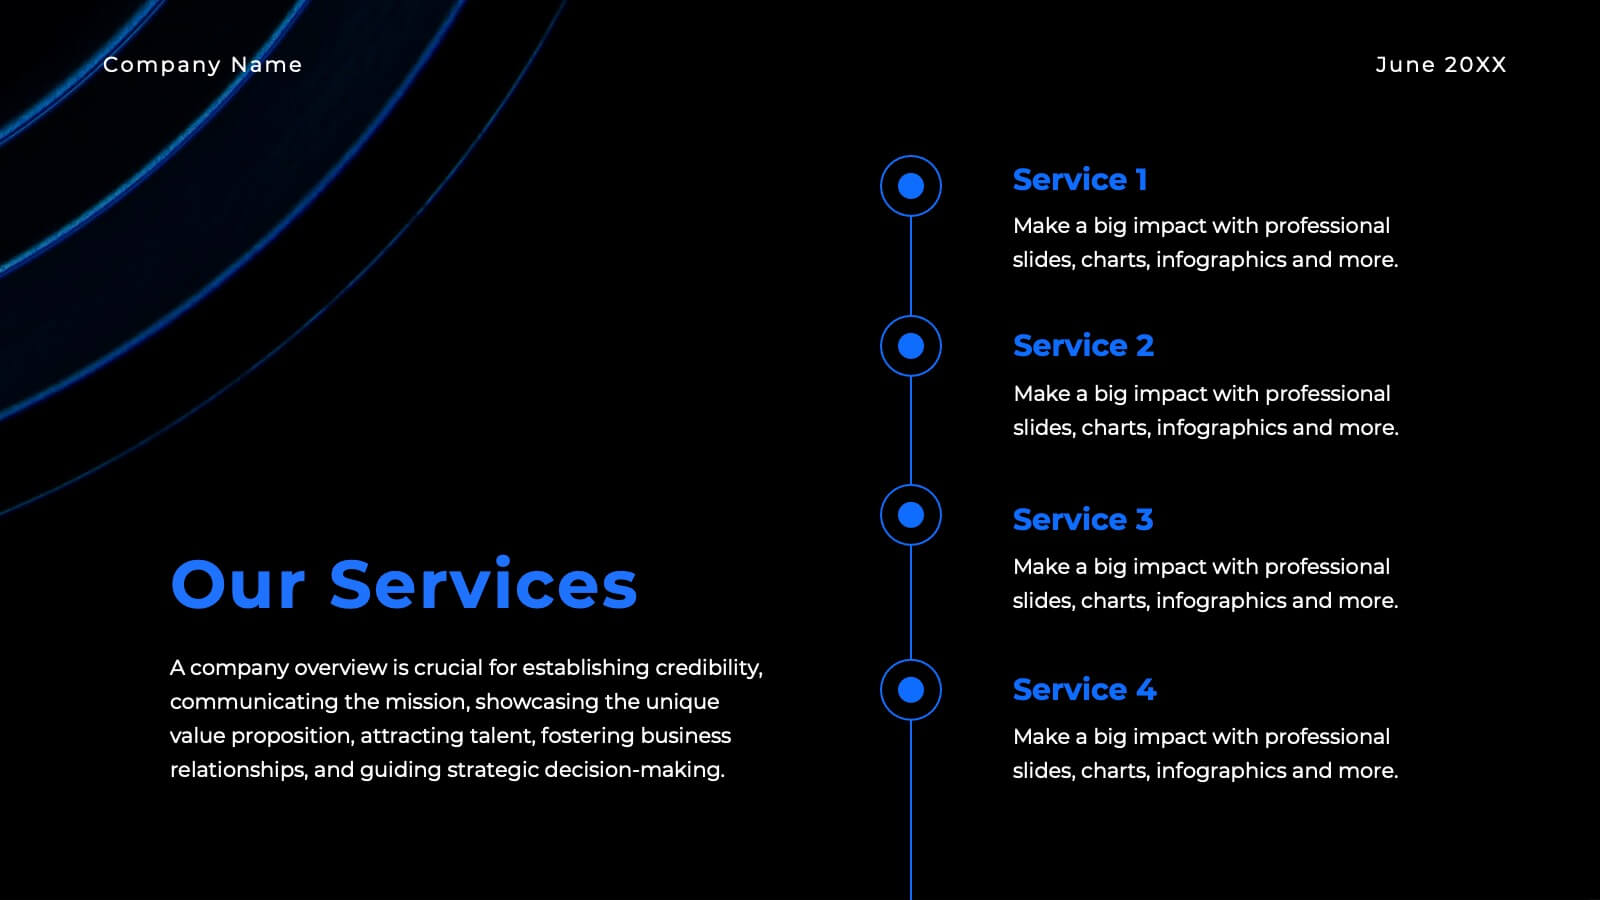
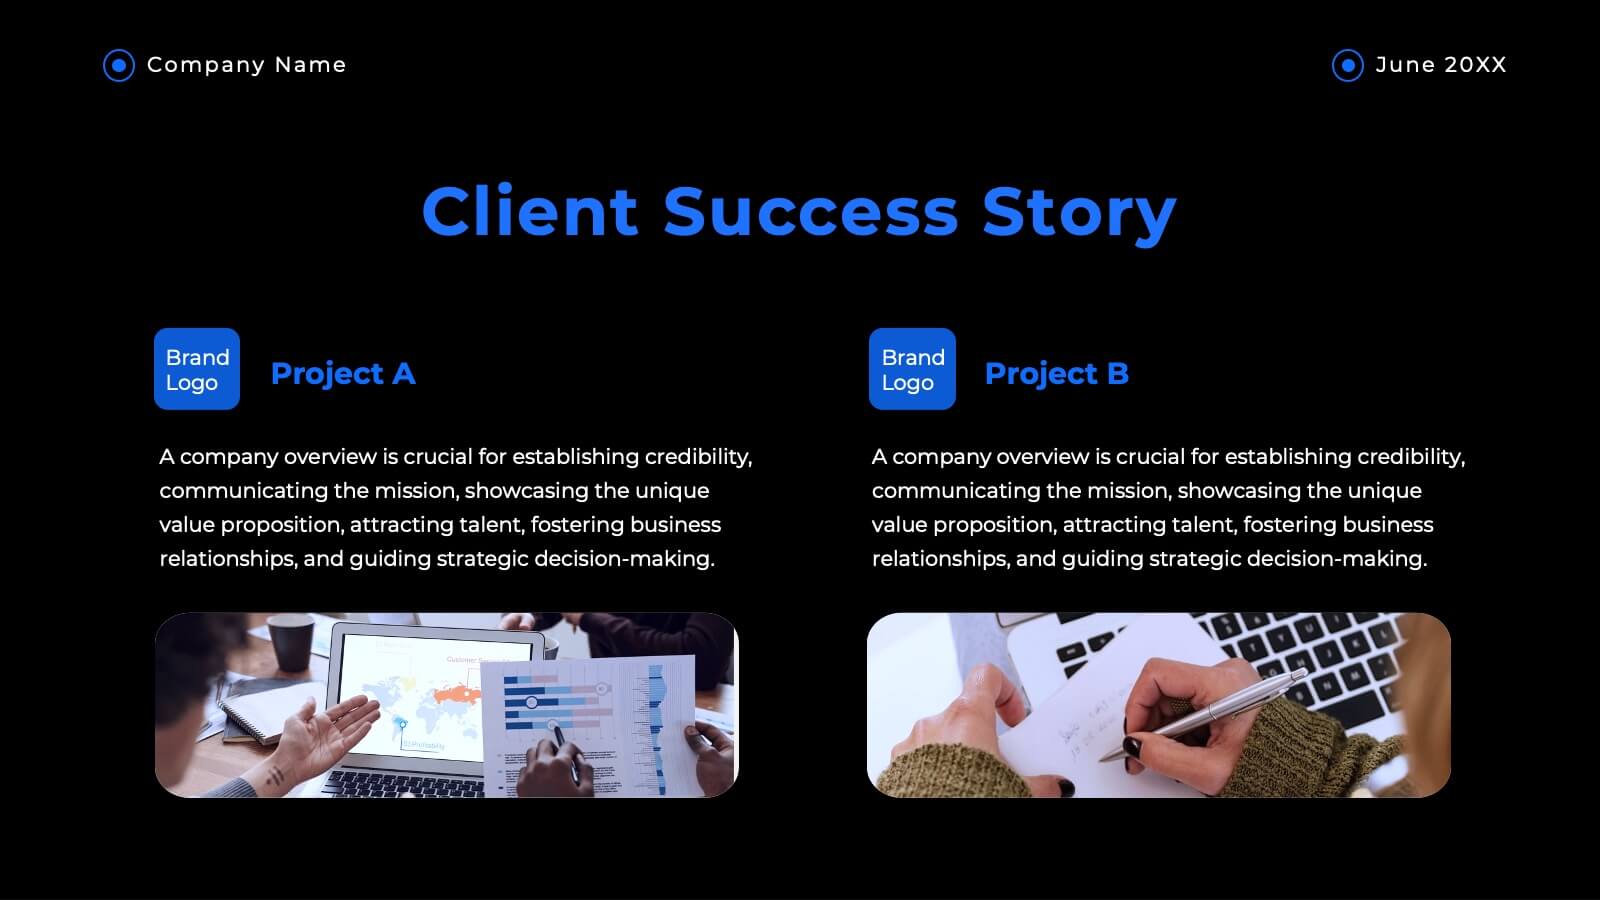
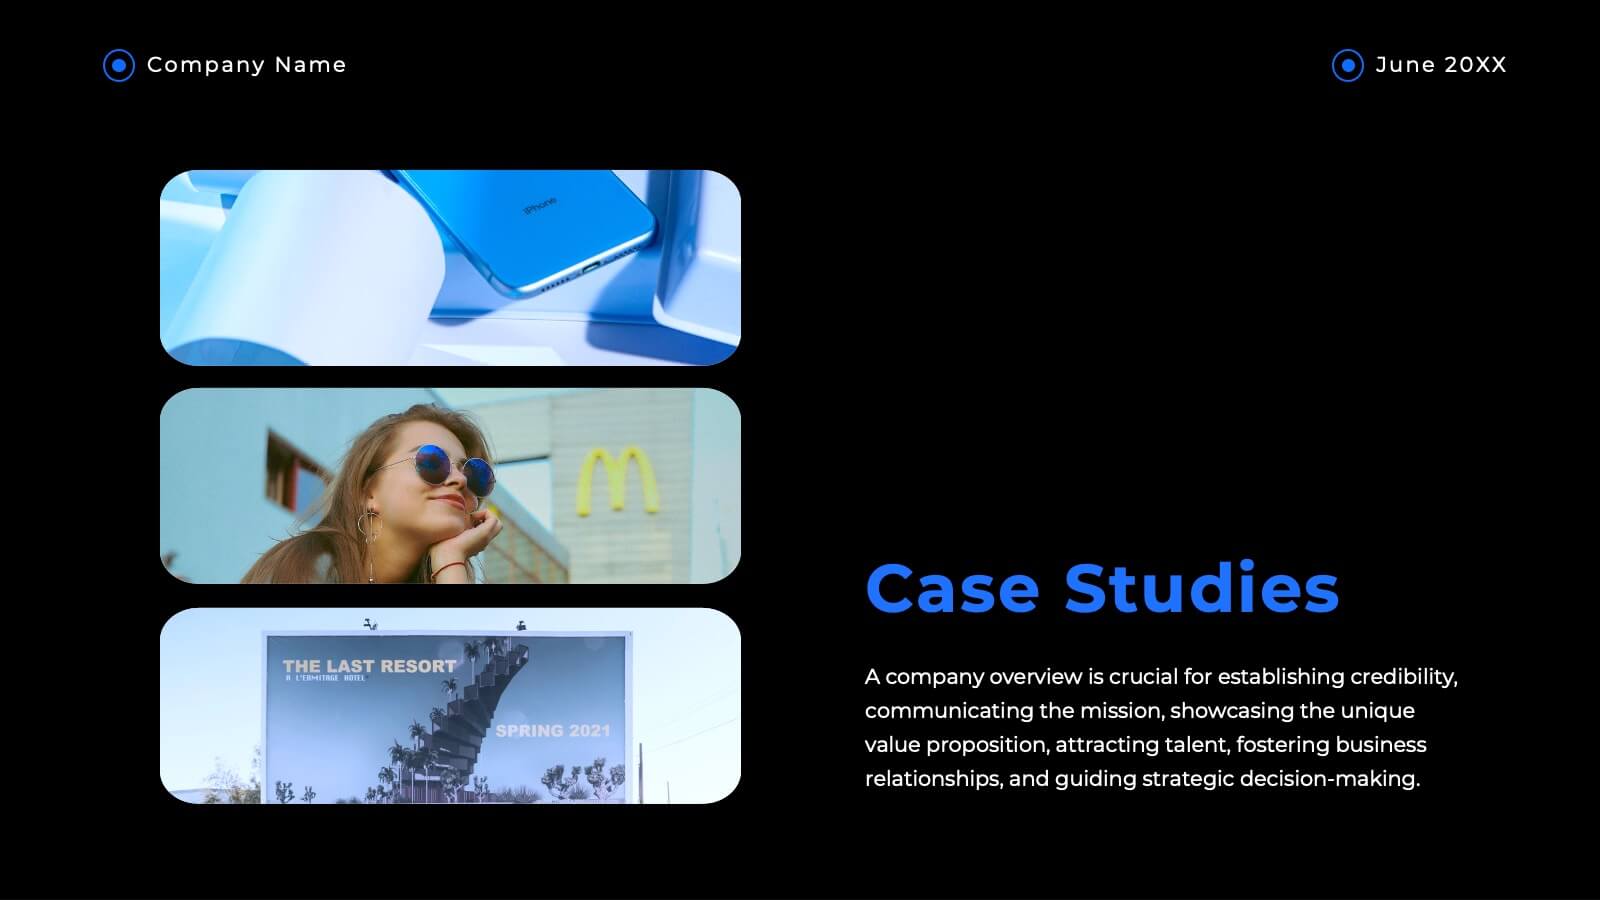
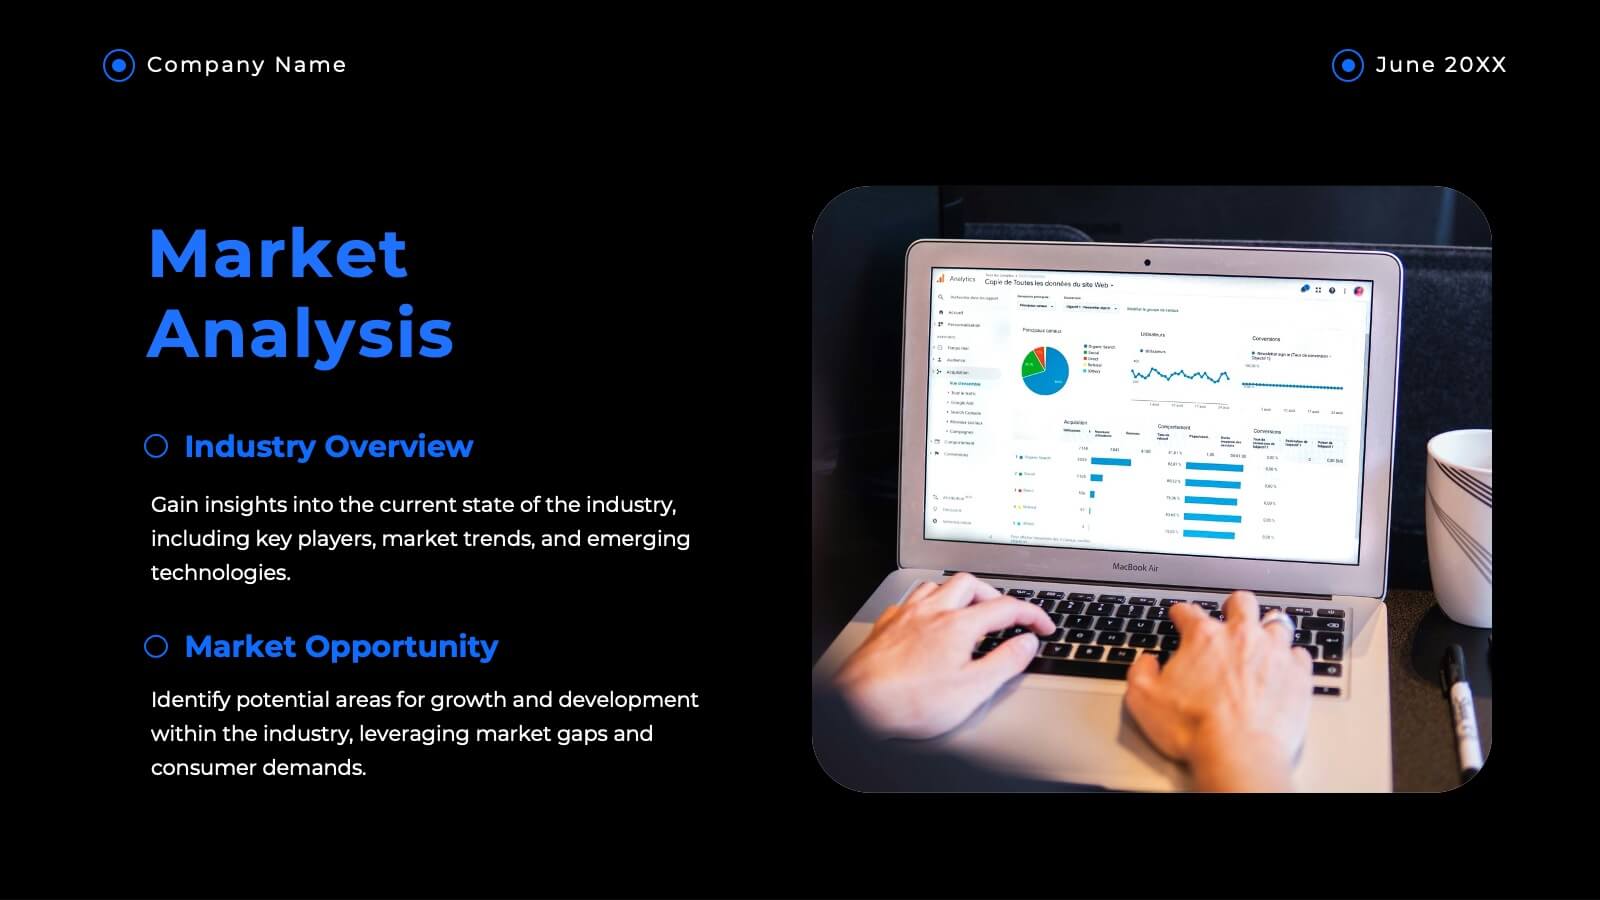
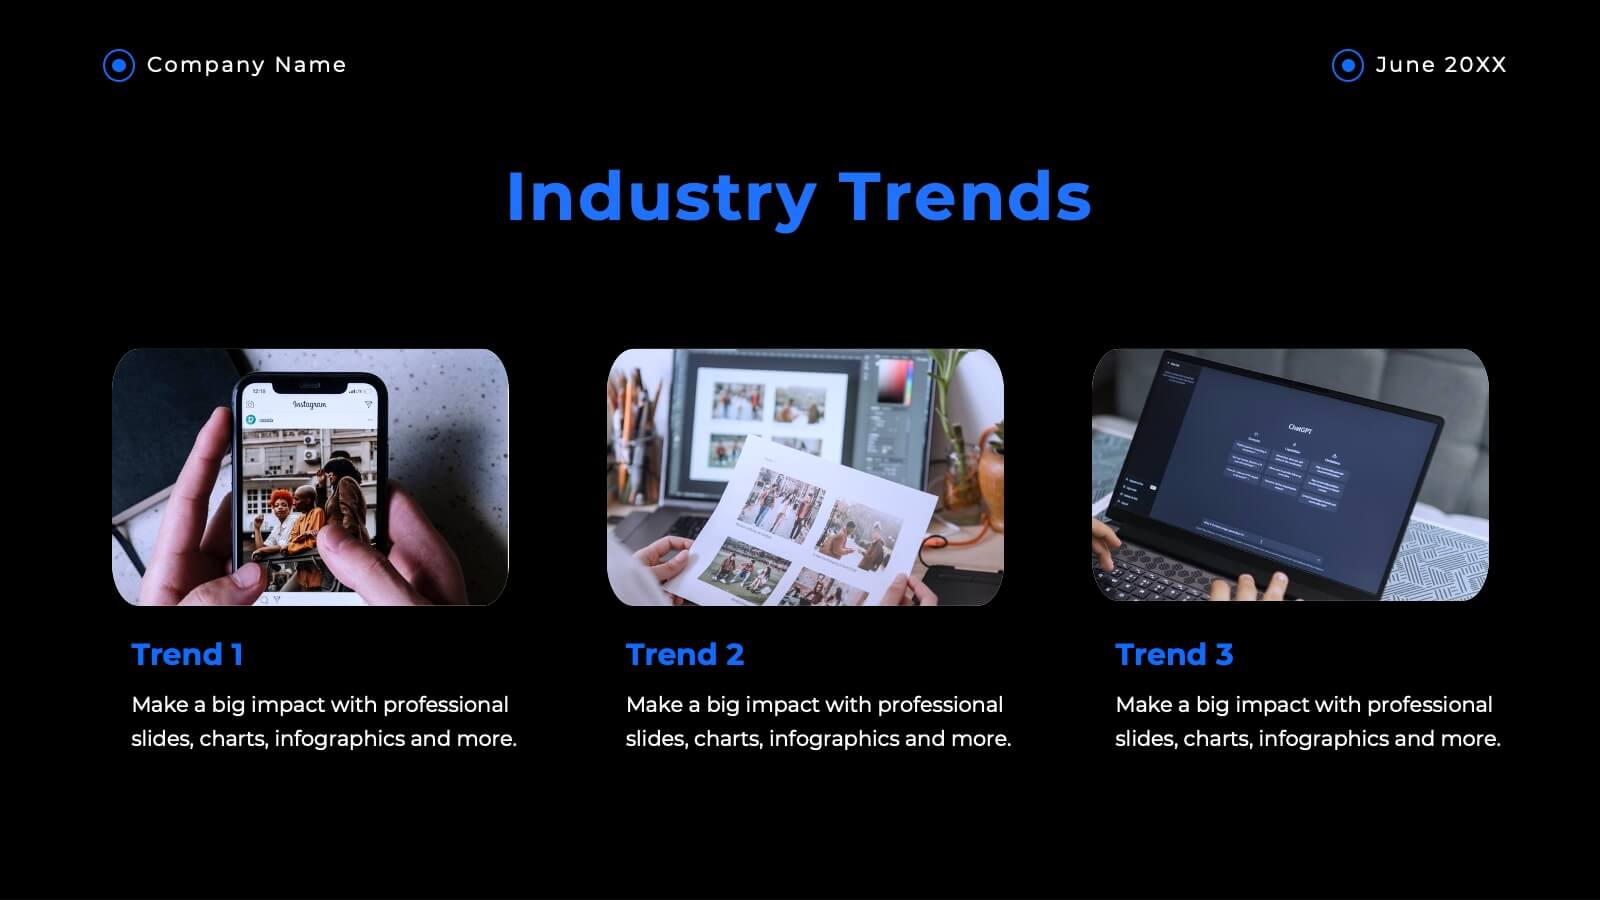
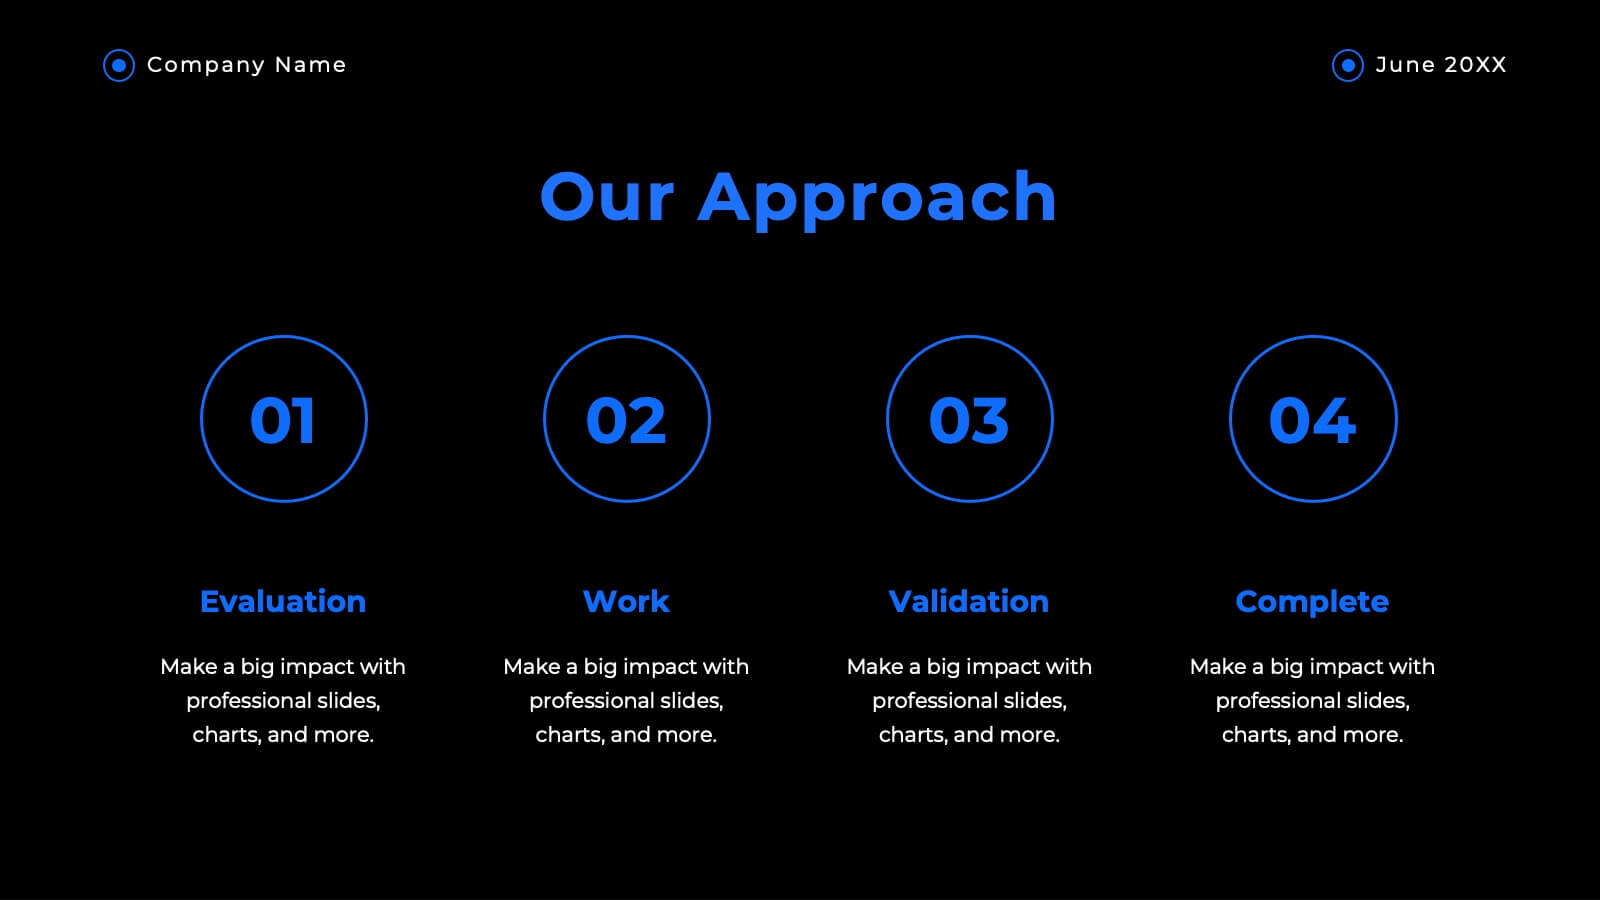
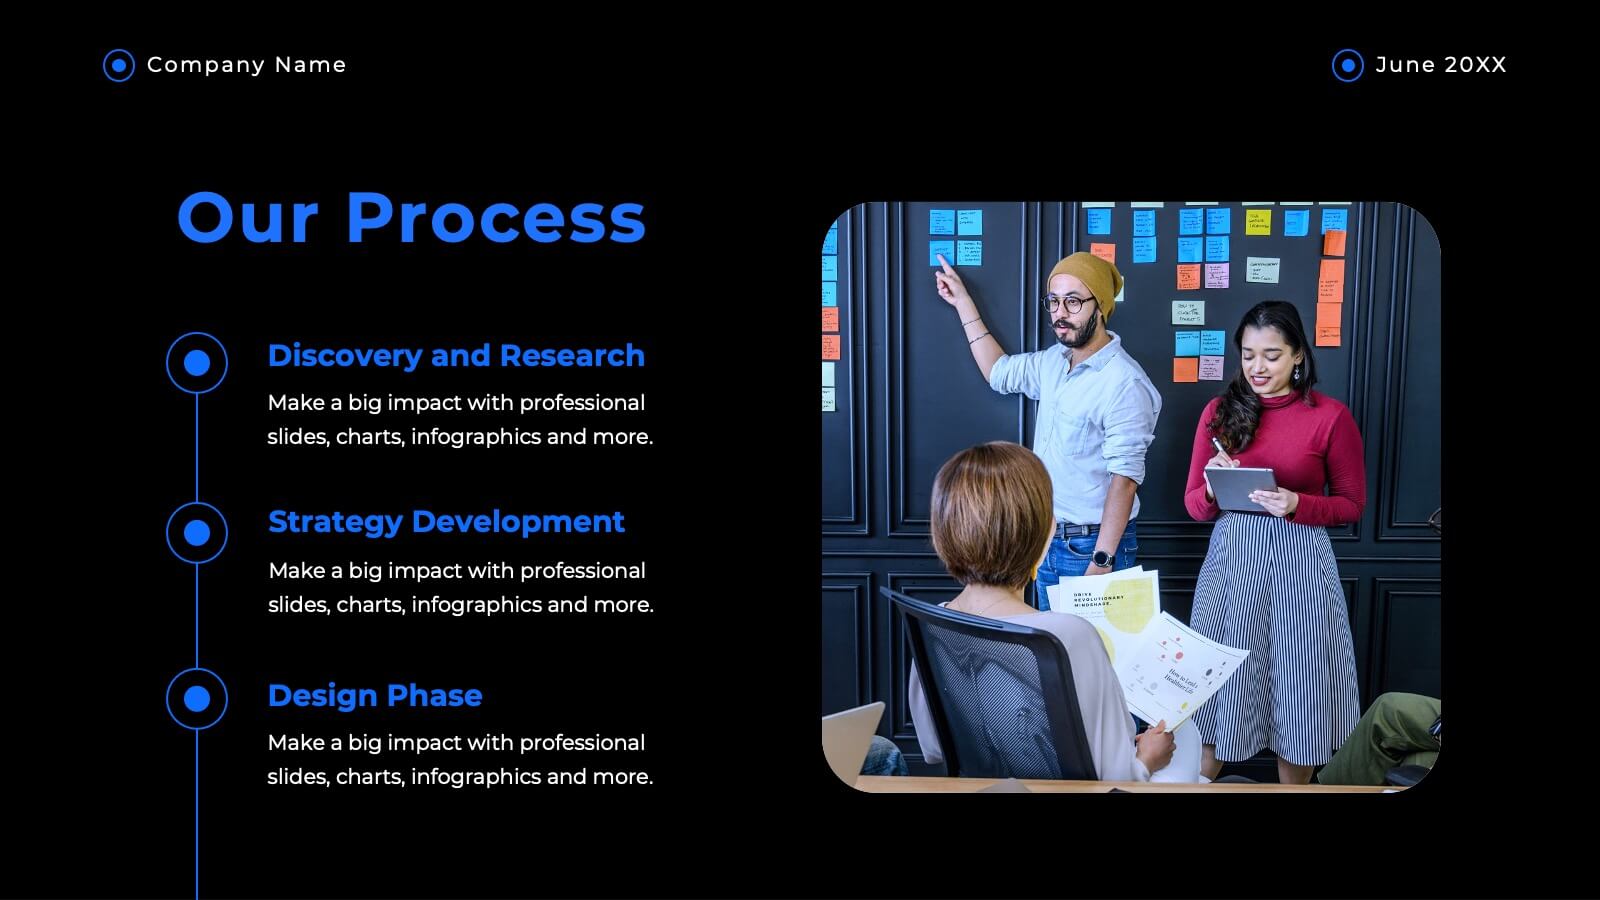
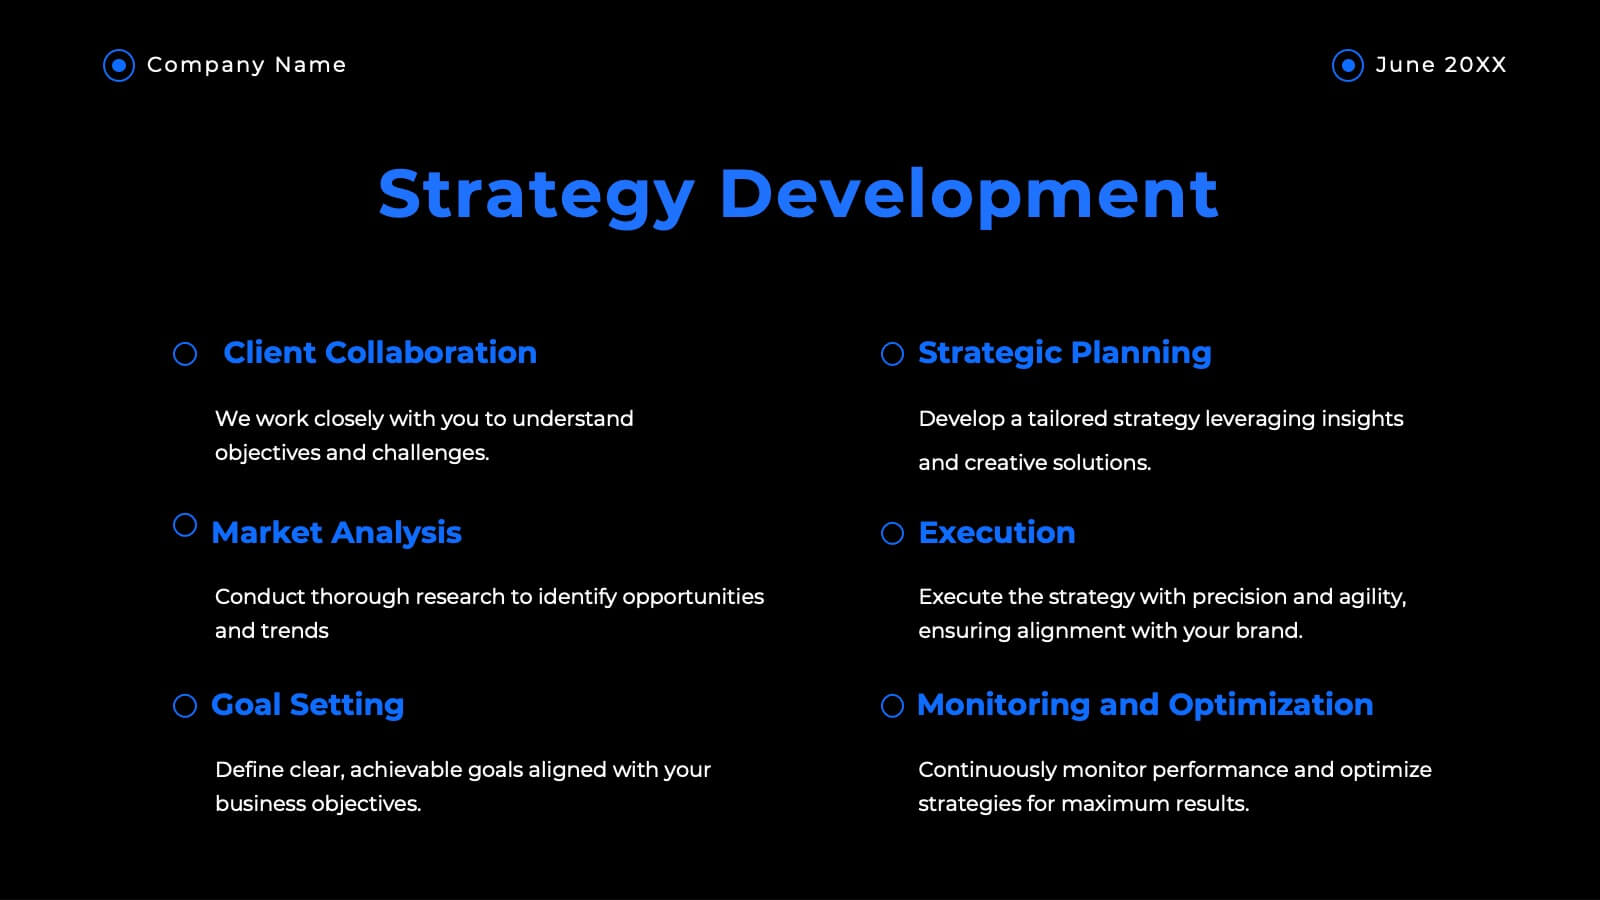
Haven Advertising Agency Proposal Presentation
Wow your clients with this sophisticated agency presentation template! Perfect for showcasing your services, client success stories, and market analysis. Ideal for agencies looking to impress and secure new business. Compatible with PowerPoint, Keynote, and Google Slides, this template ensures your proposals stand out with professional elegance. Perfect for any pitch or proposal.


6 diapositivas
Startup Investment Infographics
The "Startup Investment" infographic template is a sleek and persuasive tool, perfectly crafted for PowerPoint, Keynote, and Google Slides. This template is a crucial asset for entrepreneurs, investors, and business consultants who are keen on presenting the essentials of startup financing, investment strategies, and growth opportunities in an impactful way. This template efficiently encapsulates the startup investment landscape, highlighting key areas like funding stages, investor types, valuation methods, and return on investment. It's designed to articulate the dynamics of startup funding, making it an invaluable tool for pitch presentations, investor meetings, and financial planning discussions. The design is as dynamic as the startup ecosystem itself, with a color scheme that is both vibrant and professional. This not only makes the presentation visually compelling but also signifies the energy, innovation, and potential associated with startup investments. Whether used in a boardroom, a startup incubator, or an investment seminar, this template ensures that your insights into "Startup Investment" are communicated with clarity, confidence, and visual appeal.


6 diapositivas
Business Cloud Transformation Strategy Presentation
Streamline your cloud transition with this Business Cloud Transformation Strategy template. Perfect for IT leaders, cloud architects, and business executives, this slide provides a visual roadmap for migrating, integrating, and optimizing cloud solutions. With a modern, data-driven layout, it highlights key transformation phases, challenges, and benefits. Fully customizable and compatible with PowerPoint, Keynote, and Google Slides for professional presentations.


5 diapositivas
Hierarchical Pyramid Diagram Presentation
The "Hierarchical Pyramid Diagram Presentation" template is designed to effectively represent organizational structures, data hierarchies, or step-by-step processes. This versatile template features a layered pyramid structure, enabling clear visualization of relationships and dependencies between different levels or components within a system. Ideal for business presentations, strategy discussions, and educational materials, this template aids in conveying complex information in a straightforward and visually appealing manner. The use of distinct colors for each level enhances readability, making it easier to identify and discuss each segment in detail during presentations.


6 diapositivas
Business Process Checklist Overview Presentation
Simplify your workflow presentations with the Business Process Checklist Overview Presentation. This circular layout is ideal for outlining five sequential or cyclical steps in a business process, featuring icon-labeled checkpoints and editable titles. Each step is visually marked with subtle checkmarks, making it perfect for status tracking, task progression, or implementation plans. Clean, professional, and fully customizable in PowerPoint, Keynote, and Google Slides.


5 diapositivas
KPI Dashboard Metrics Presentation
Make your performance story stand out with a clean, modern dashboard that turns complex data into easy-to-read visuals. This presentation helps you track progress, highlight key metrics, and showcase insights with clarity and confidence. Fully editable and compatible with PowerPoint, Keynote, and Google Slides.


5 diapositivas
USA Resources Map Infographics
A USA resources map is a visual representation of the natural resources found in different regions of the United States. This presentation template showcases the diverse natural resources found across the United States. It provides an overview of different types of resources, including minerals, energy sources, agricultural products, and more, allowing viewers to understand the richness and distribution of resources in the country. This can provide valuable information for industries, researchers, and students to understand the distribution and utilization of natural resources across the country.


24 diapositivas
Gamma UX Design Presentation
Present your user experience design process with a sleek and modern template tailored for UX professionals. This template offers a cohesive flow of slides designed to illustrate your design journey, from user research to prototyping and final implementation. Highlight key aspects of your project with slides dedicated to user personas, wireframes, usability testing, and accessibility considerations. Showcase your team’s expertise and present project outcomes effectively with a clean and engaging layout. Visual elements and icons ensure your content is both informative and aesthetically pleasing. Compatible with PowerPoint, Google Slides, and Keynote, this fully customizable template allows you to personalize fonts, colors, and images to match your project’s branding. Impress stakeholders with a well-structured presentation that communicates your UX vision and expertise.


7 diapositivas
Food Infographic Presentation Template
A Food Infographic is a visual representation of information and data related to food. It can be used to educate people on various aspects of food such as its nutritional value, cooking methods, and recipes. This template can be presented in a variety of ways, including charts, graphs, illustrations, and images you can customize with your information. The goal of this Food Infographic is to make complex information about food more accessible and easy to understand for the general public. This template works with Powerpoint, Keynote, and Google Slides, so you can use it on any device.


26 diapositivas
Roaster Presentation Template
Are you interested in knowing about the best coffee in town? Roaster is a fresh and bold template perfect for marketing. This template will be sure to make your services and products stand out. The background stays in theme with coffee tone colors and many pictures. Overall Roaster can help you make any kind of presentation you need and help you create a professional online presence. This template is a great starting point for creating an impressive sales page. You'll be able to quickly add in your information and customize this template to display a captivating presentation.


6 diapositivas
Market Differentiation with Blue Ocean Strategy
Position your brand uniquely with this Market Differentiation slide based on Blue Ocean Strategy principles. Featuring a clean, strategic layout with a blend of visuals and text, this template is ideal for competitive analysis, innovation roadmaps, and strategic marketing plans. Fully customizable in PowerPoint, Keynote, and Google Slides.


26 diapositivas
Cassanra Presentation Template
Cassanra is a bold, professional template with a retro look. Its ravishing, modern aesthetic will stand out and grab your attention, while detailed design elements keep it readable. Packed with features like charts, timelines, and easy to edit text blocks, Cassanra is perfect for businesses as well as personal use. A mixture of bold colors are used to help keep the look appealing and easy to read. This template comes with a large amount of features from charts, timelines and an easy to edit text this template is perfect for businesses seeking to make an impression on their audience.


6 diapositivas
Demographic and Behavioral Customer Profile Presentation
Understand your audience better with the Demographic and Behavioral Customer Profile Presentation. This visually engaging template separates key demographic details from behavior-based insights to help you build more effective marketing strategies. Fully customizable in Canva, PowerPoint, or Google Slides—perfect for marketers, strategists, and sales teams targeting customer segmentation.


6 diapositivas
Targeted Segment Analysis and Mapping Presentation
Highlight your market focus with the Targeted Segment Analysis and Mapping Presentation. This circular layout is perfect for breaking down five audience segments, using subtle icons and visual emphasis for clarity. Ideal for marketers, strategists, and business analysts presenting niche targeting. Fully editable in Canva, PowerPoint, Keynote, and Google Slides.


7 diapositivas
Money Infographic Presentation Template
Our Money Infographic is a great way to make an infographic that is visually appealing using shapes, objects and more. Create your own template style with this tool that you can use for presenting data on financial aspects in an interesting way. This template is a great tool to present your company's statics and figures. It features a clean and professional design that will stand out. With our Infographic template, you can create a professional presentation with all the information you need. This design is completely customizable so that you can add text and images, change colors, and more!


21 diapositivas
Phantomwood Product Roadmap Presentation
A comprehensive presentation template designed to outline product strategies and roadmaps. Covers key aspects like target market, competitive analysis, pricing, and technical specifications. Highlight marketing approaches, production processes, and support information effectively. Fully editable, this template is compatible with PowerPoint, Keynote, and Google Slides for seamless collaboration and professional delivery.


3 diapositivas
Comprehensive Business Roadmap Strategy Presentation
Plan ahead with confidence using the Comprehensive Business Roadmap Strategy Presentation. This timeline-based slide is perfect for mapping out multi-quarter goals, initiatives, or project phases. Use the horizontal arrows to show overlapping tasks and strategic priorities by quarter. Ideal for project managers, team leads, and business strategists. Fully editable in PowerPoint, Keynote, Google Slides, and Canva.