


Características


¿Tienes alguna pregunta?
Recomendar


4 diapositivas
Social Campaign Planning Presentation
Bring clarity to your outreach goals with a bold, funnel-style layout that makes every campaign step easy to visualize. This presentation helps you outline stages, objectives, and audience actions in a clean, structured format ideal for marketing teams. Fully editable and compatible with PowerPoint, Keynote, and Google Slides.


7 diapositivas
Digital Business Strategy Infographic
Navigate the complex landscape of digital business strategy with this comprehensive infographic template, which is meticulously designed to aid business strategists, entrepreneurs, and students in understanding and developing effective business plans. This resource breaks down the core components of a successful business strategy into digestible, visually engaging segments. The template spans several key areas of strategic planning including execution, governance, planning, marketing, and innovation. Each section is clearly delineated with vibrant colors and icons that correspond to different aspects of business strategy, such as venture, capital, and brand positioning. The layout is thoughtfully organized to guide the viewer through the process step-by-step, making complex concepts accessible and straightforward. Utilizing a clean and professional design, this template is ideal for presentations, educational materials, or as a visual aid during business meetings. It provides a clear roadmap for aligning digital tools and platforms with business objectives, highlighting the pathways to profitability and market expansion. Whether for internal strategy sessions, academic purposes, or entrepreneurial pitches, this infographic is an invaluable tool for conveying the essentials of digital business strategy effectively and efficiently.


21 diapositivas
Harpy Product Development Plan Presentation
Present your product development plan with precision using this comprehensive and visually engaging template! It covers essential sections like product features, target market, pricing strategy, competitive analysis, and production process to ensure every aspect is communicated effectively. Perfect for product teams or client pitches, it’s fully compatible with PowerPoint, Keynote, and Google Slides.


6 diapositivas
Strategic Project Proposal Overview
Present your project priorities with clarity using this bold and colorful Strategic Project Proposal slide. With five stacked segments, it’s ideal for outlining phases, features, or deliverables in a structured format. Fully editable in PowerPoint, Keynote, and Google Slides to suit any industry or workflow.


8 diapositivas
Cognitive Mapping and Brain Thinking
Visualize complex ideas clearly with the Cognitive Mapping and Brain Thinking Presentation—a sleek, brain-themed layout designed to display four key concepts connected to a central idea. Each node uses a minimalist icon and color-coded bubble to guide your audience through thought patterns, processes, or strategic insights. Ideal for psychology, education, or innovation workshops. Fully editable in PowerPoint, Keynote, and Google Slides.
8 diapositivas
Directional Arrow Timeline Flow
Highlight key milestones or project phases with this smooth, flowing arrow timeline layout. Designed for project managers, team leads, and strategists to showcase sequential steps, launch plans, or performance stages. Fully customizable in PowerPoint, Keynote, and Google Slides—change icons, colors, and text to match your brand style.


21 diapositivas
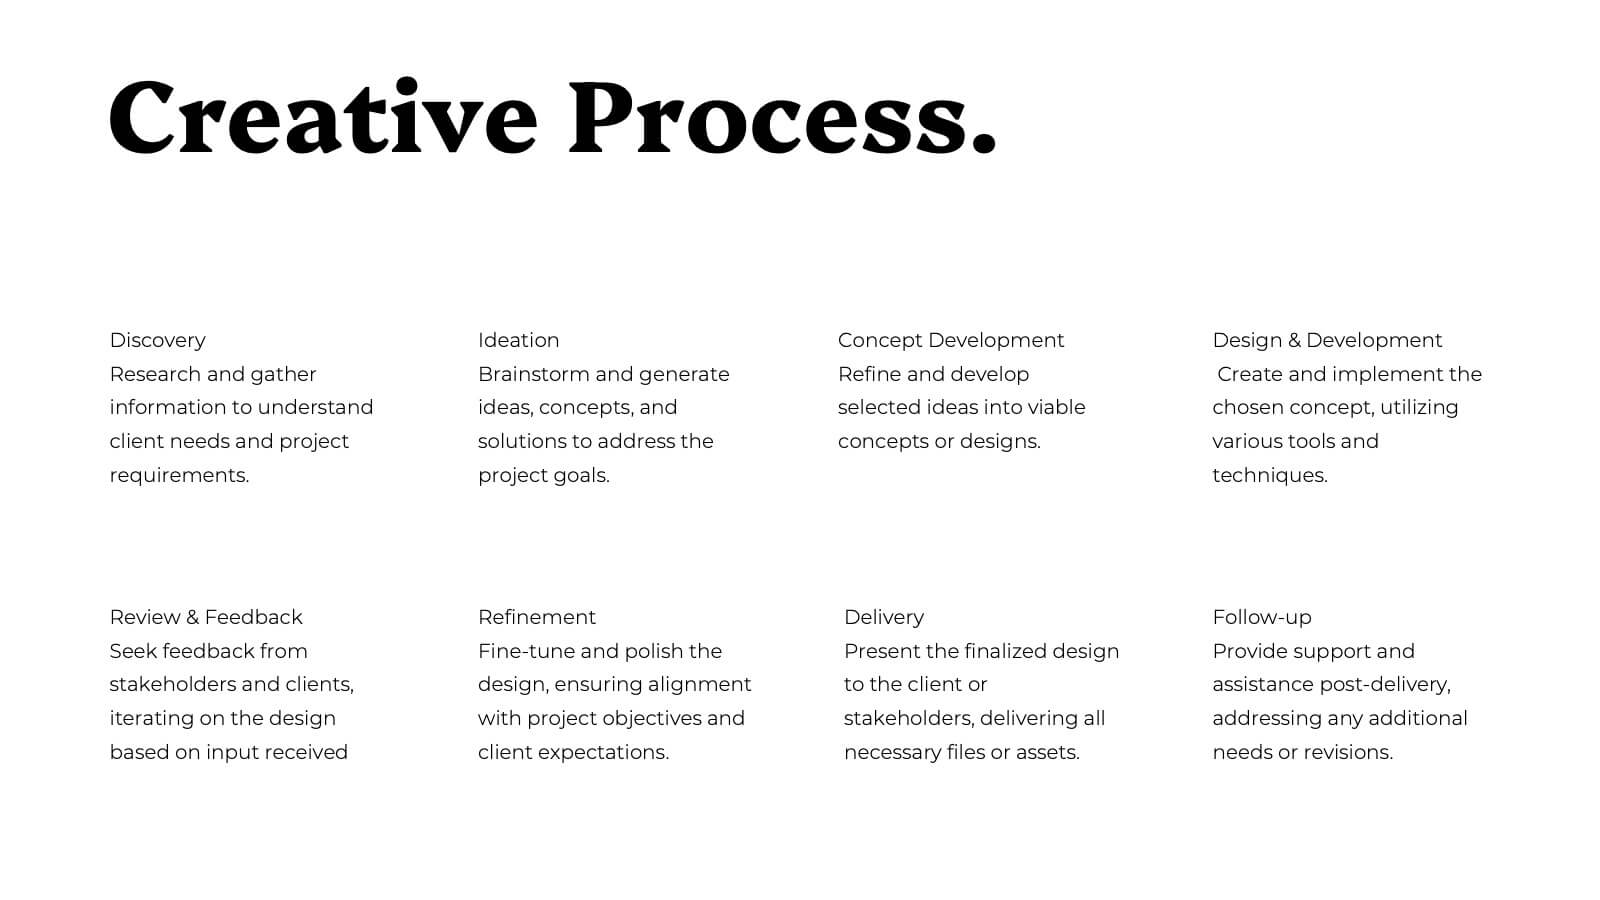
Arcadian Photography Portfolio Template Presentation
Showcase your best work with this sleek and stylish photography portfolio presentation template! It’s perfect for presenting your featured projects, creative process, and client testimonials in a visually stunning way. This template is fully customizable and offers a professional touch to your portfolio, making it ideal for both personal and client presentations. Compatible with PowerPoint, Keynote, and Google Slides.


7 diapositivas
Governance Structure Infographic
Governance structure refers to the framework, system, and processes that define how an organization's operations, strategies, and objectives are directed, controlled, and regulated. This infographic template serves as a clear roadmap, guiding you through the key pillars that establish a strong foundation for successful governance. Compatible with Powerpoint, keynote, and Google Slides. The checkpoints illustrate the importance of compliance and effective risk management at various stages of your governance journey. This illuminating template empowers you to communicate the principles that steer an organization toward its objectives.


10 diapositivas
Strategic Business Action Plan Presentation
Create a roadmap for success with the Strategic Business Action Plan presentation. This well-structured template provides a clear, step-by-step framework for executing business strategies, making it ideal for corporate teams, entrepreneurs, and business consultants. Its modern design ensures effective communication of key goals and objectives. Fully customizable and compatible with PowerPoint, Keynote, and Google Slides.


2 diapositivas
Designer Portfolio for Client Showcase Presentation
Showcase your creative work with the Designer Portfolio for Client Showcase Presentation. This sleek layout emphasizes visual storytelling, making it ideal for graphic designers, illustrators, and creatives presenting to potential clients. Highlight your projects in a clean, modern format. Compatible with Canva, PowerPoint, Keynote, and Google Slides for full customization.


5 diapositivas
Medical Systems and Drug Research Overview Presentation
Present critical insights with this heart-themed infographic, ideal for showcasing medical systems, drug development stages, or treatment data. The visual layout supports four key points with a clear, engaging style. Fully customizable in PowerPoint, Keynote, and Google Slides—perfect for researchers, healthcare analysts, and pharmaceutical presentations.


4 diapositivas
User Experience Flow Presentation
Bring clarity and color to every stage of your user experience process with this clean, structured presentation. It helps you outline steps, explain interactions, and highlight key insights in a visually intuitive flow. Easy to customize and fully compatible with PowerPoint, Keynote, and Google Slides.


5 diapositivas
Editable Circular Flow Presentation
Streamline your presentations with this Editable Circular Flow template. Ideal for processes, workflows, and strategic planning, this diagram visually represents key steps in a structured format. Fully customizable and compatible with PowerPoint, Keynote, and Google Slides, it ensures clarity and professionalism for engaging, data-driven presentations.


7 diapositivas
Business Funnel Infographic Presentation
A Funnel Infographic is used to help communicate the stages of a sales funnel in a transparent and visually appealing way. This is a marketing model that is used to track the journey from project to profit. This template includes a series of funnel-shaped graphics that represent the different stages of the sales funnel. You can customize this template with your own content, colors, and fonts to suit your specific needs. Add your own text to each stage of the funnel, and use the additional icons to represent each stage in more detail. Convey your marketing message with this Infographic!


5 diapositivas
RAPID Decision-Making Model Presentation
The RAPID Decision-Making Model template simplifies complex decision processes, laying out steps from recommending to deciding in an easily digestible format. It's ideal for team leaders and managers who want to streamline decision-making. The template is designed for seamless use across PowerPoint, Keynote, and Google Slides, ensuring broad compatibility and user-friendly presentations.


6 diapositivas
Achievements and Goals Milestone Presentation
Celebrate every step toward success with a bold visual that climbs to the top. This infographic template is designed to highlight key goals, project milestones, or achievements using a mountain-inspired layout that’s both symbolic and practical. Perfect for roadmaps, team highlights, or quarterly wins—works seamlessly with PowerPoint, Keynote, and Google Slides.


4 diapositivas
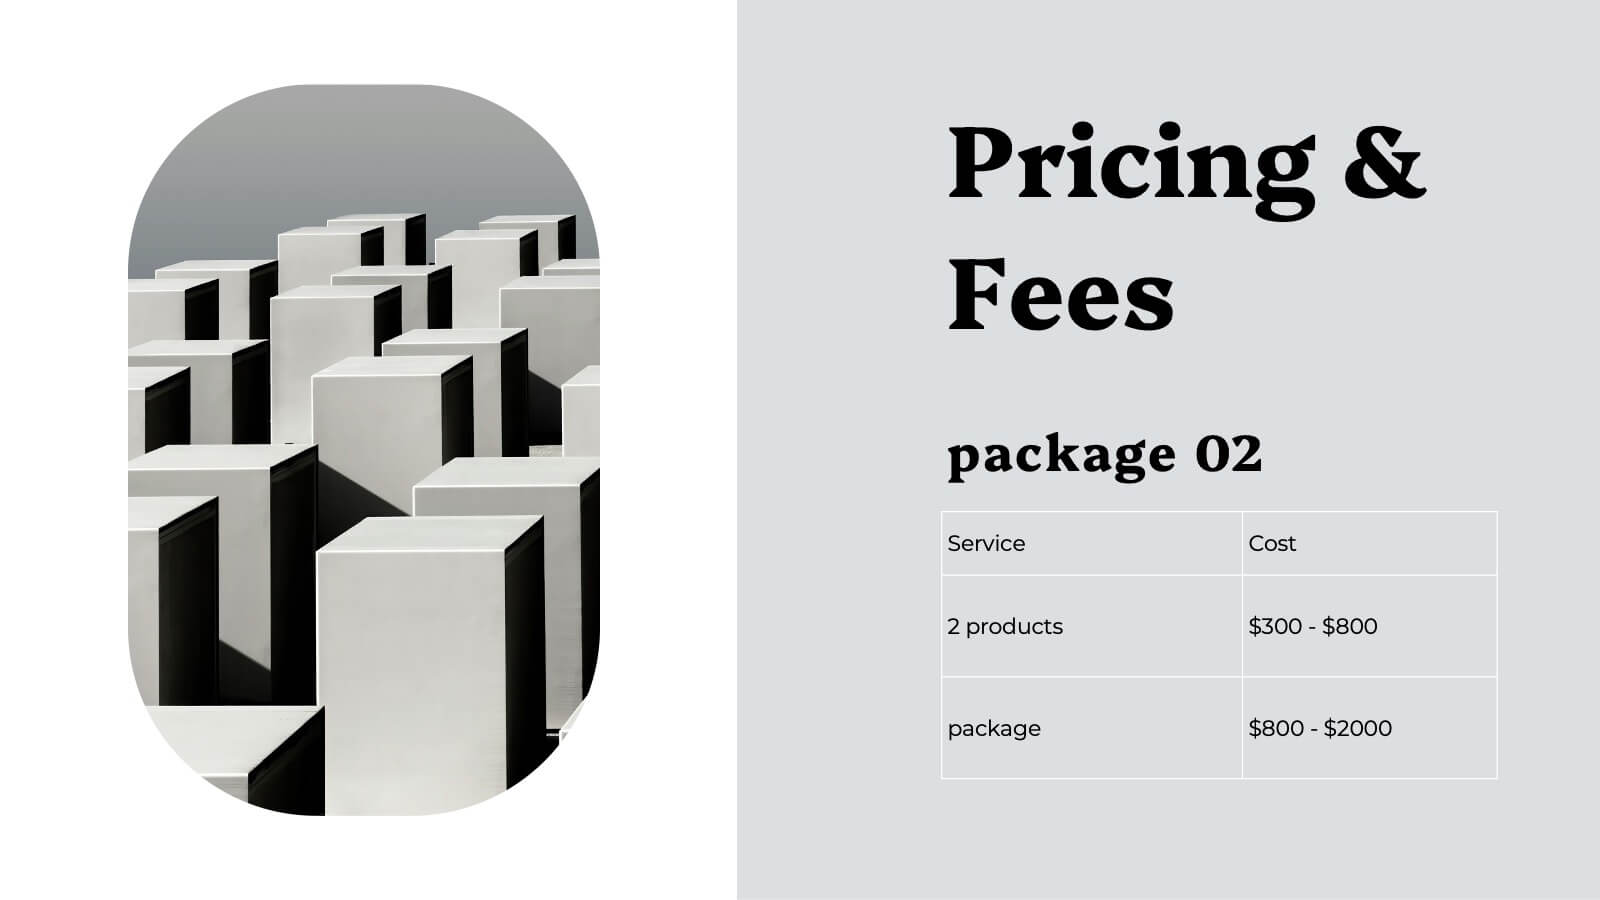
Financial Cost Management Strategies Presentation
Effectively plan and monitor financial performance with the Financial Cost Management Strategies Presentation template. This slide provides a clear roadmap for cost optimization, budget allocation, and financial efficiency improvements. Ideal for finance teams, business strategists, and executives aiming for streamlined cost control. Fully editable in PowerPoint, Keynote, and Google Slides for easy customization.