


Características


¿Tienes alguna pregunta?
Recomendar


20 diapositivas
Astral UX UI Design Pitch Deck Presentation
Present your UX/UI design with flair! This template covers everything from design briefs and process steps to mood boards and final presentations. Perfect for showcasing design elements, wireframes, and project timelines. Ideal for impressing stakeholders and clients. Compatible with PowerPoint, Keynote, and Google Slides. Make your design pitch unforgettable!


7 diapositivas
Mission and Vision Infographic
Enhance your organizational presentations with this collection of professionally designed slide templates, perfect for detailing your foundational principles and strategic vision. Each template is crafted to effectively convey essential information, combining aesthetic appeal with functional design to ensure your message has a lasting impact. The slides feature a sophisticated and clean layout, emphasizing the importance of your organizational goals. They are ideally suited for use in corporate presentations, stakeholder meetings, or team workshops. With various styles available, each template can be selected and customized to align with your organization's branding and ethos. These slides are fully customizable, allowing adjustments in colors, fonts, and imagery to perfectly represent your core messages. They provide a valuable tool for inspiring your team, impressing stakeholders, and clearly communicating the driving purpose and values behind your initiatives.


25 diapositivas
Luminous Qualitative Research Findings Presentation
Elevate your qualitative research findings with this sleek and professional template. It covers research objectives, methodology, data collection, and key findings. Ideal for clear and compelling presentations. Fully compatible with PowerPoint, Keynote, and Google Slides for seamless integration.


8 diapositivas
Legal Framework for Corporations
Visualize corporate compliance and governance structures with this balanced legal framework slide. Featuring a scale diagram with adjustable sections, it’s perfect for explaining regulations, policies, and corporate ethics. Ideal for law firms, corporate teams, and compliance officers. Fully editable and compatible with PowerPoint, Keynote, and Google Slides.


5 diapositivas
Vaccine Myths Infographic
Vaccine Myths are false or misleading claims about vaccines that can contribute to vaccine hesitancy and misinformation. These infographic templates are designed to debunk common misconceptions and myths surrounding vaccines. These visually appealing and informative templates are ideal for healthcare professionals, educators, and organizations aiming to promote accurate information about vaccines and combat vaccine hesitancy. These infographics aim to educate and empower individuals to make informed decisions about vaccination and contribute to public health efforts. Compatible with Powerpoint, Keynote, and Google Slides.


5 diapositivas
Company Hierarchical Structure
Easily map out your company's reporting lines and team organization with this clean, photo-friendly hierarchy slide. Perfect for presenting departments, roles, or leadership structures. Fully editable in PowerPoint, Keynote, and Google Slides for effortless customization.


16 diapositivas
Professional Presentation
Streamline your project presentations with our Professional Template, meticulously designed to bring your content to life. This template is ideal for professionals looking to present a structured and detailed overview of their projects. Starting with a compelling cover slide, it guides you through defining your problem statement, setting clear objectives, and laying out comprehensive strategies and recommendations. The slides are curated to facilitate a logical flow from an introduction of your project to a detailed implementation plan, visual graphics, and outcome analysis. The key objectives slide is engineered to present your goals with impact, while the strategies and implementation plan slides help articulate the steps towards achieving success. The template concludes with a neat summary slide, a cordial 'Thank You' slide with contact information, and a credits section for source attribution. Fully compatible with PowerPoint, Keynote, and Google Slides, this template is a reliable choice for professionals seeking to convey their message with clarity and confidence.


5 diapositivas
Editable Asia Region Map Slide Presentation
Explore data across countries with a sleek regional map designed to visualize insights and connections in a clear, professional way. Perfect for presenting market trends, business reach, or project highlights across Asia, this editable layout is fully compatible with PowerPoint, Keynote, and Google Slides for easy customization.


8 diapositivas
South America Business Development Map Presentation
Unlock market potential with the South America Business Development Map template, an essential tool for professionals showcasing key insights and growth opportunities across the region. It features a customizable map and percentage indicators for various metrics, ideal for presenting business development opportunities in a visually engaging format. This template is perfect for creating dynamic and informative presentations tailored to regional analysis and development strategies.


7 diapositivas
One-Page Startup Model Canvas
Launch and refine your business idea with clarity using the One-Page Startup Model Canvas Presentation. This slide presents all key startup elements—Partners, Activities, Value Propositions, Customer Segments, Revenue Streams, and more—in a smart puzzle-piece layout that simplifies complex planning. Perfect for founders and pitch decks. Fully customizable in PowerPoint, Keynote, and Google Slides.


6 diapositivas
Business Decision Venn Diagram Presentation
Make complex decision-making simple and visually impactful with this Business Decision Venn Diagram Presentation. Featuring a bold triangular layout with six segmented areas, this slide is ideal for presenting overlapping factors, interconnected strategies, or priority zones. Perfect for business planning, competitive analysis, or project evaluation. Fully editable in PowerPoint, Keynote, and Google Slides for seamless integration into your presentations.


6 diapositivas
Innovative Idea Pitching Guide Presentation
Present your ideas with clarity using the Innovative Idea Pitching Guide Presentation. This dynamic five-step circular flow design is perfect for showcasing pitch stages, idea development, or startup concepts. Each section includes icons and text blocks to clearly explain key points, keeping your message organized and impactful. Fully editable in Canva, PowerPoint, Keynote, and Google Slides.
22 diapositivas
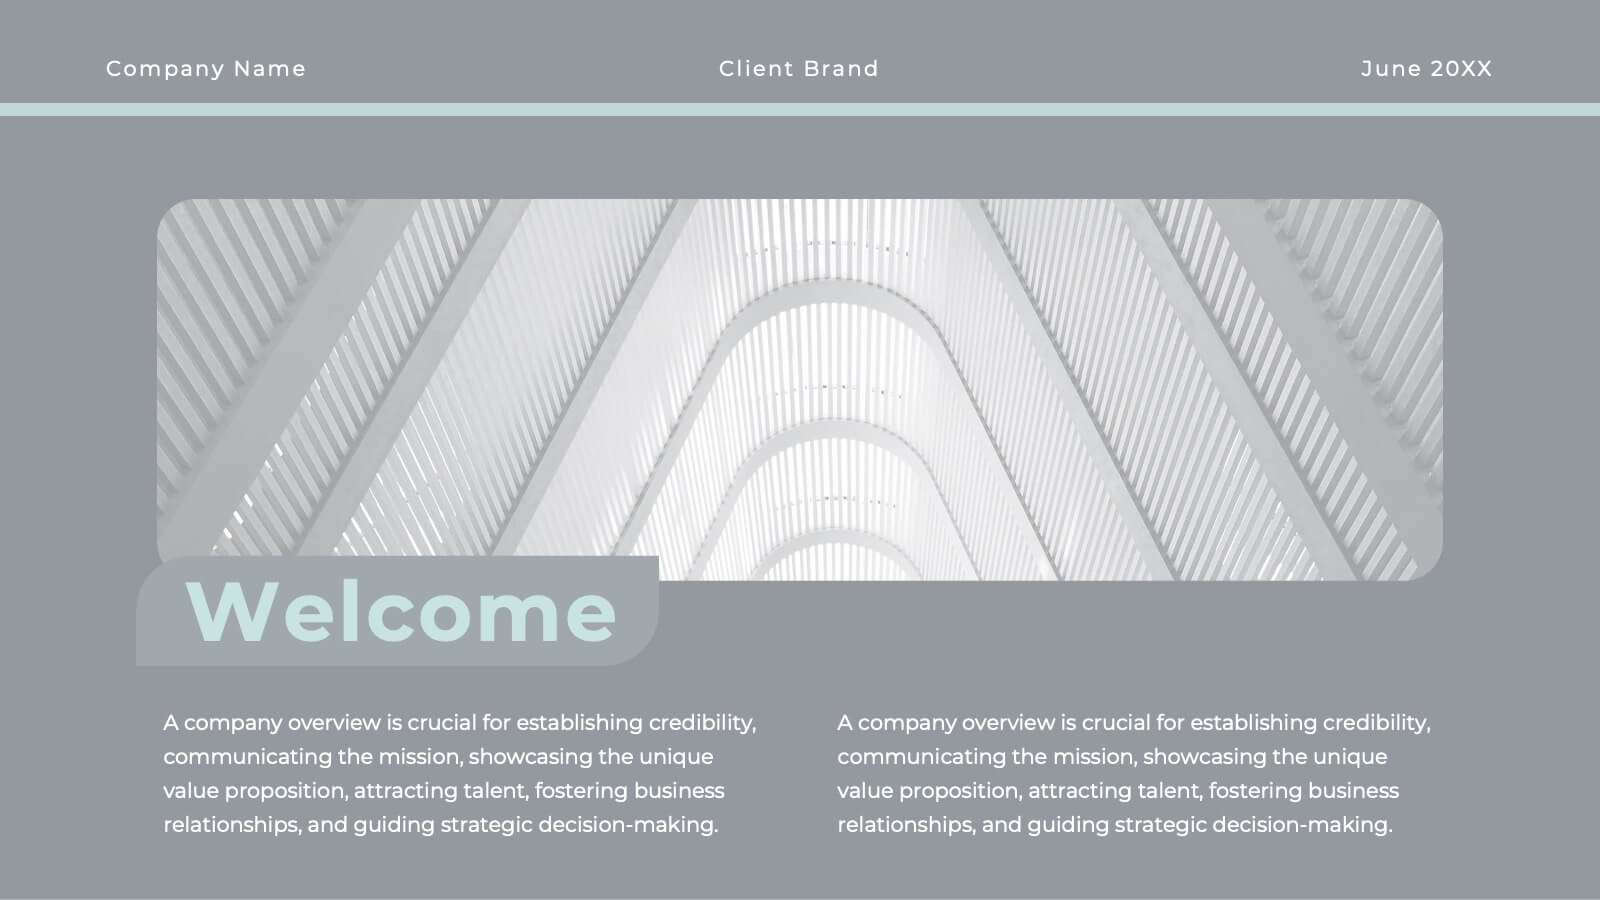
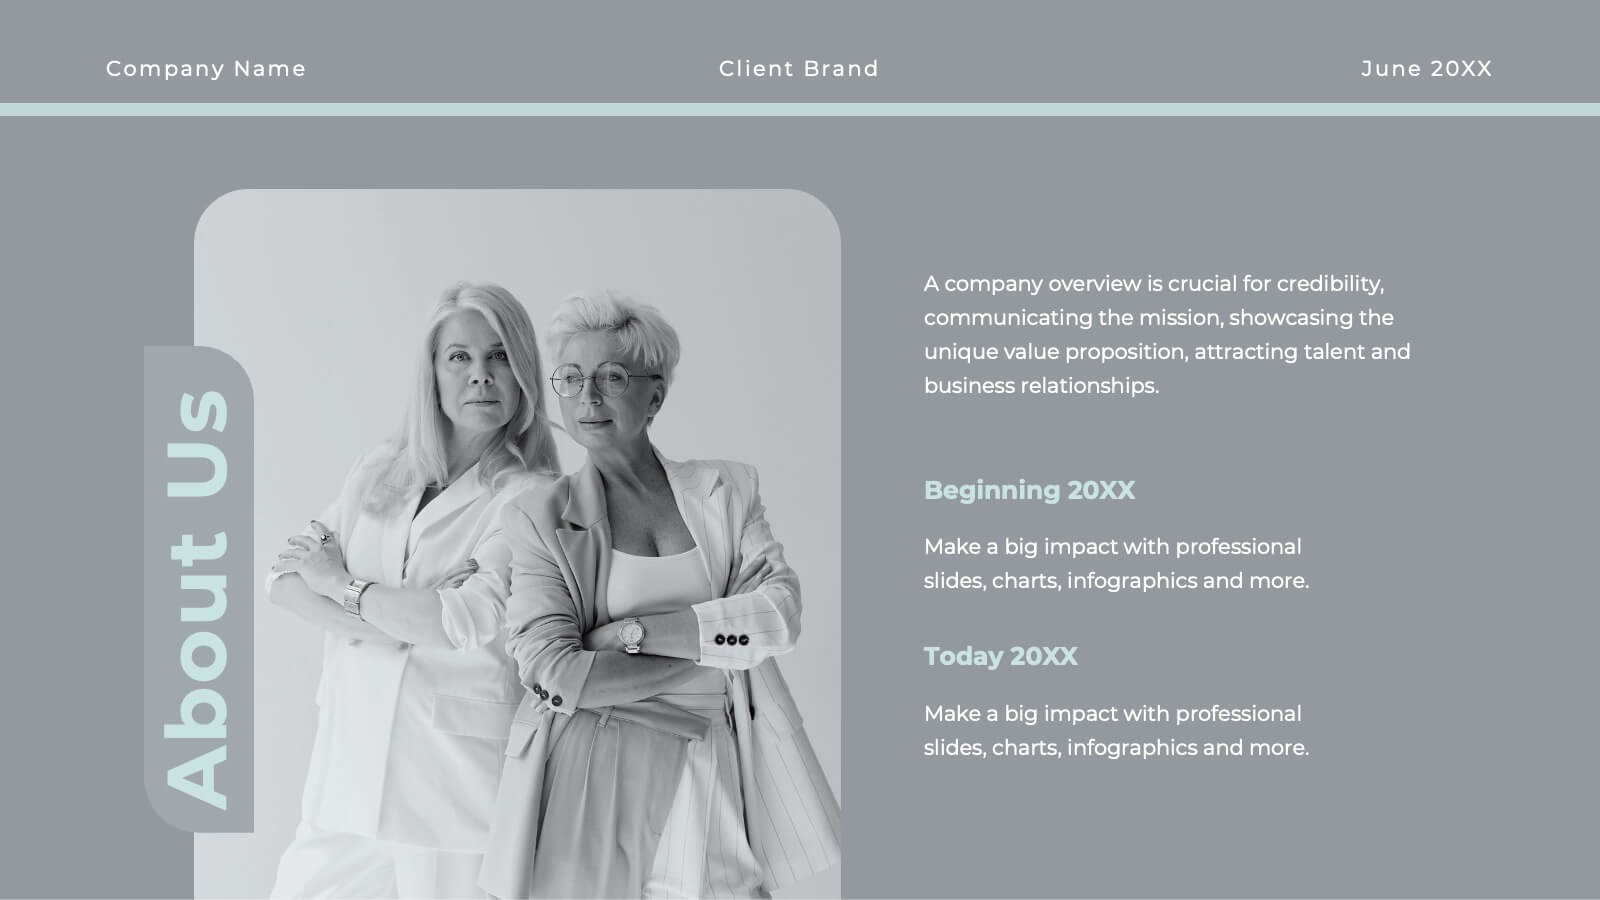
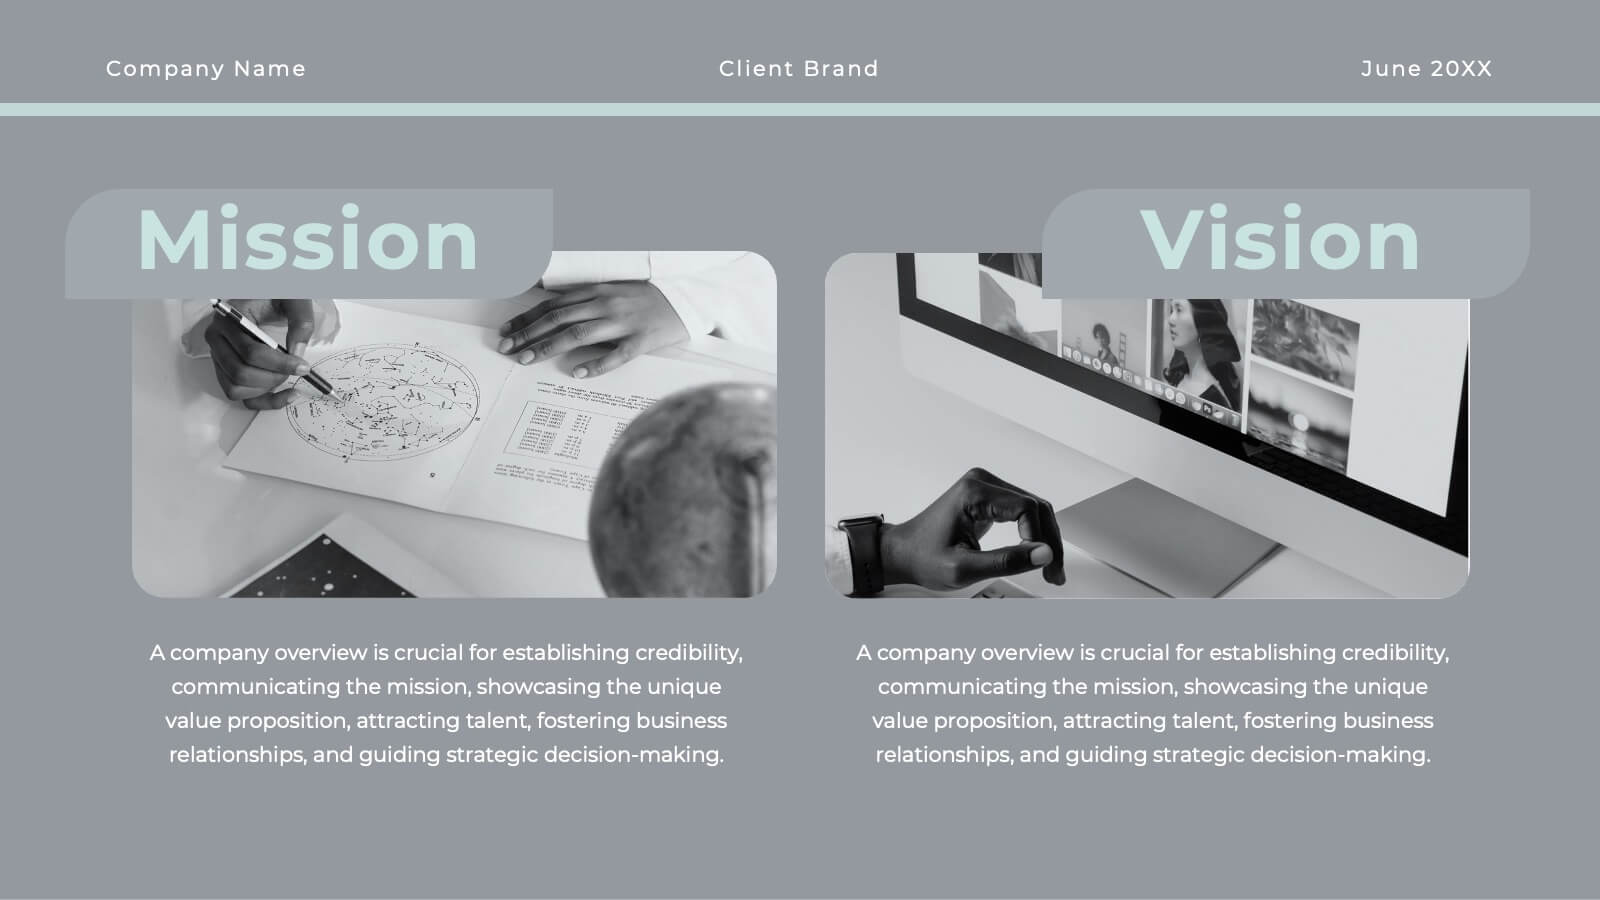
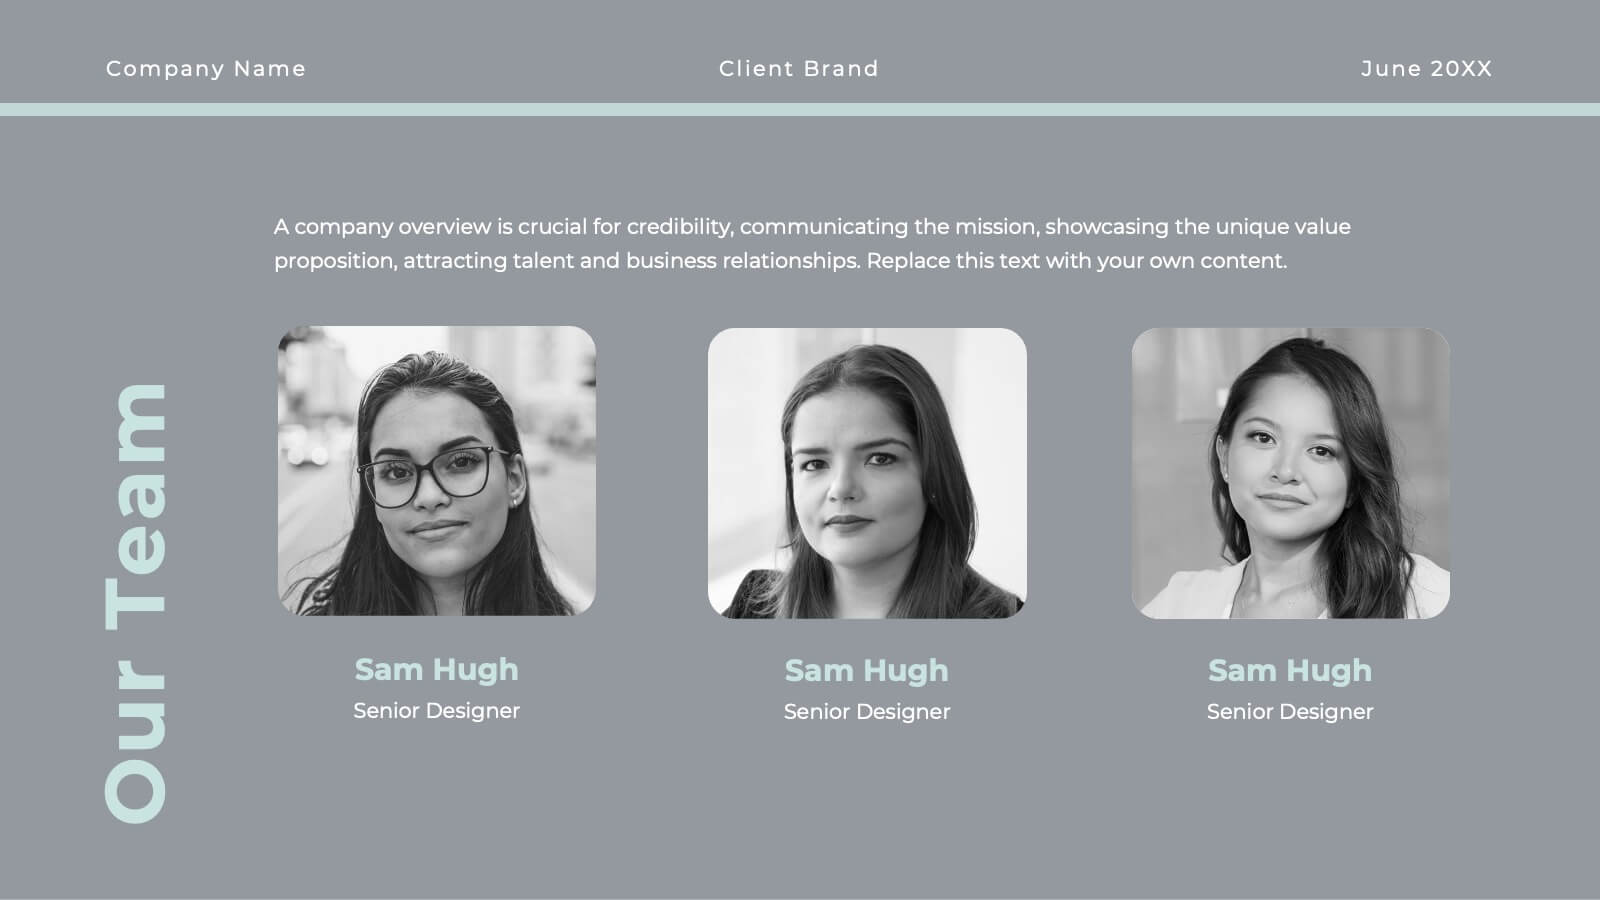
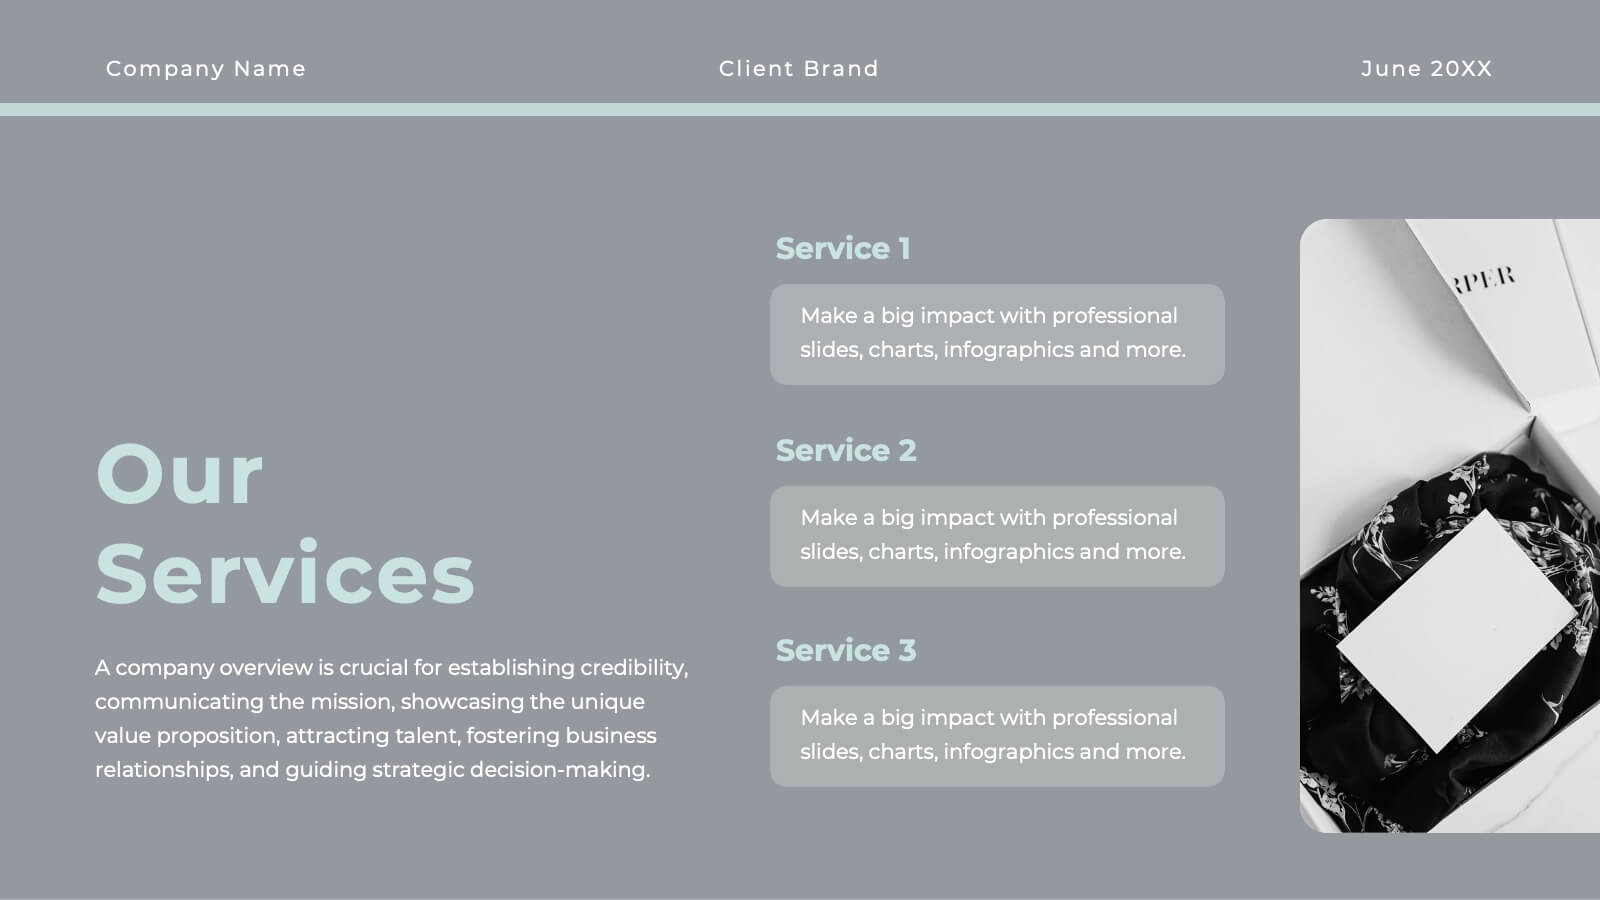
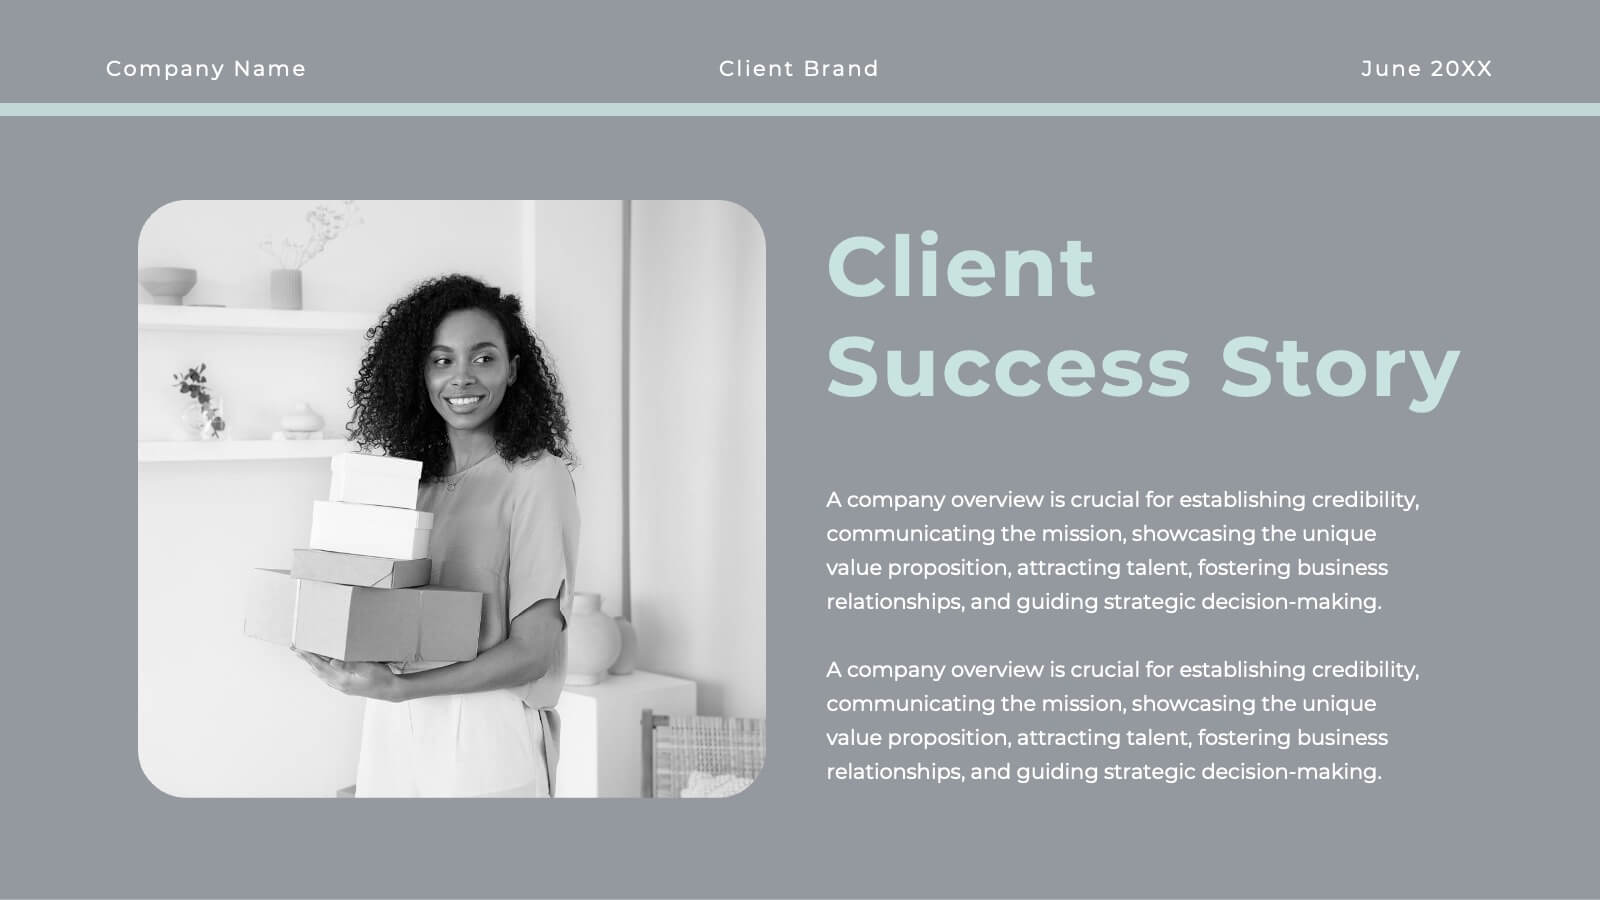
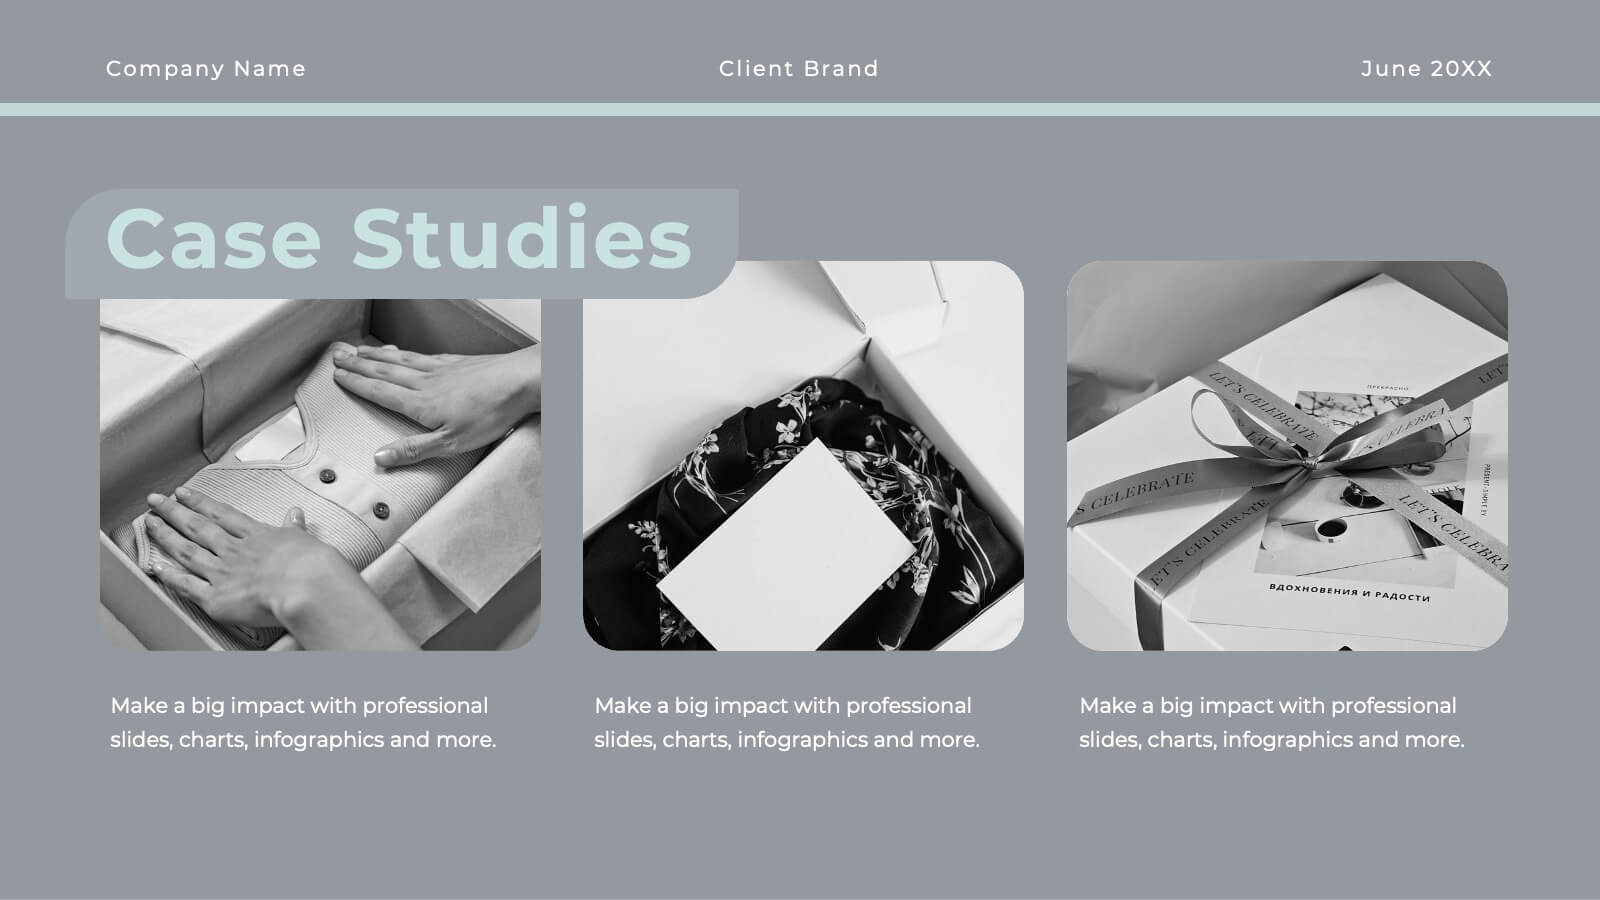
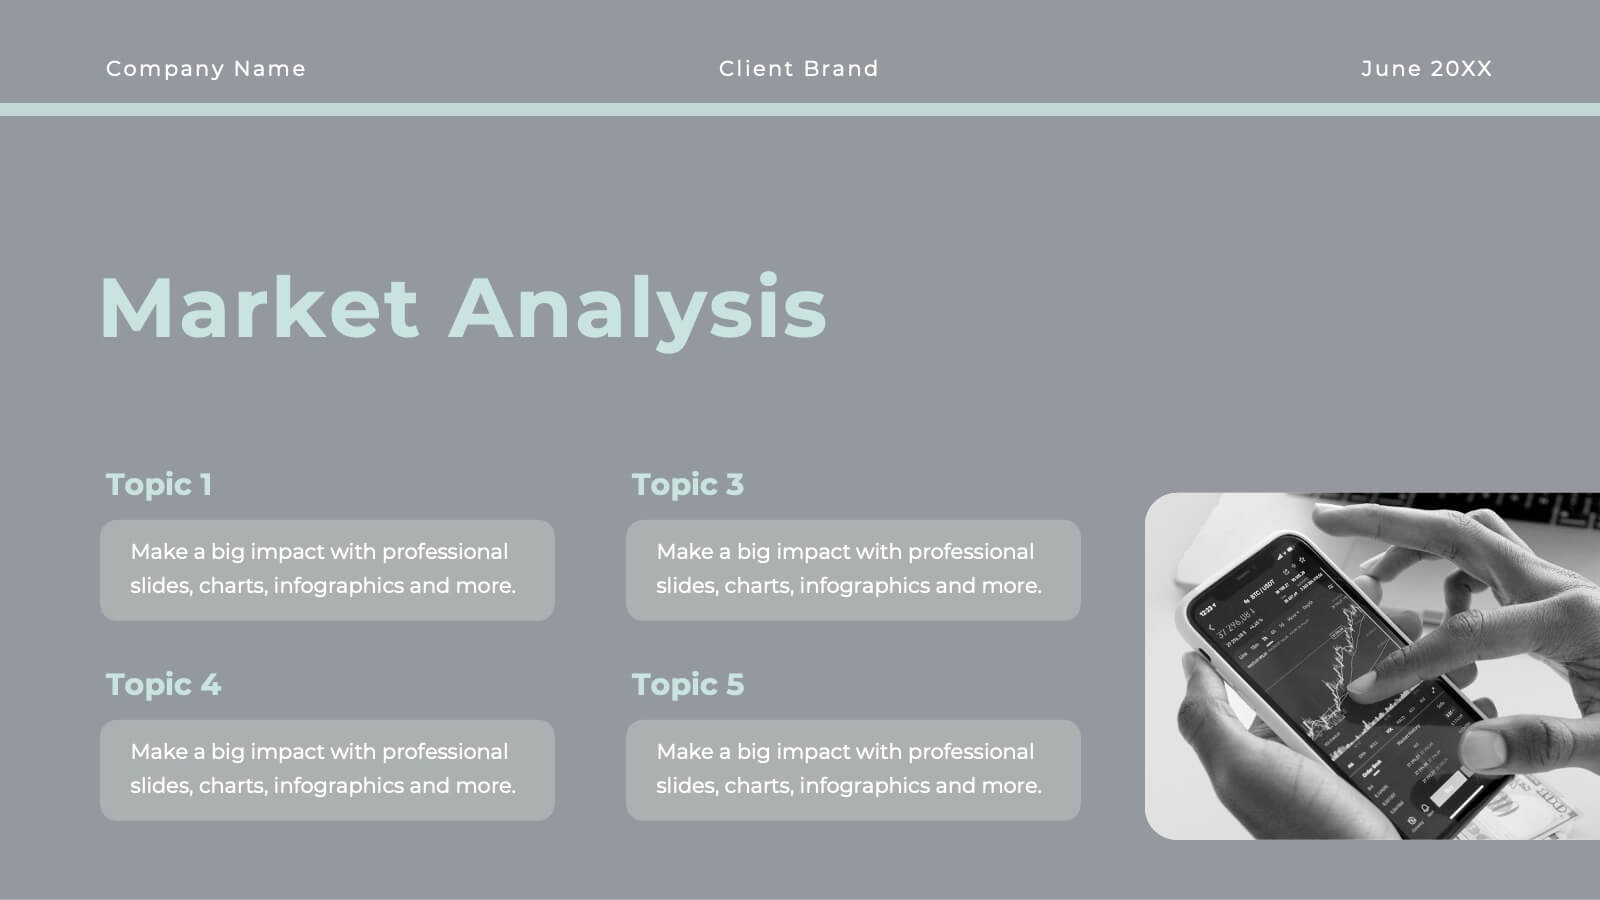
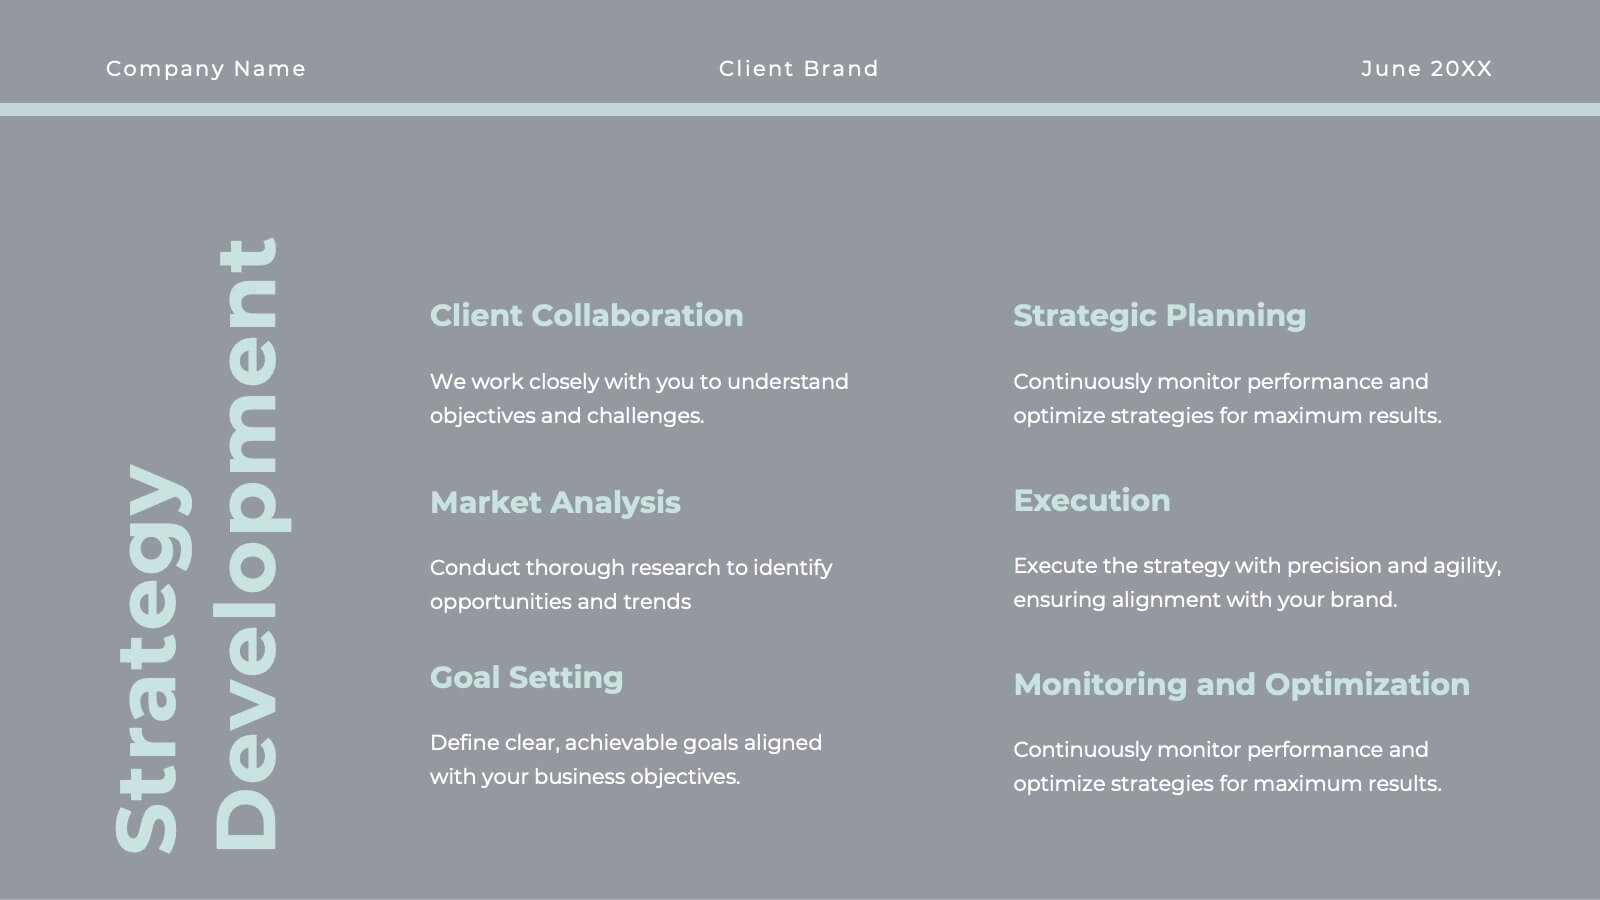
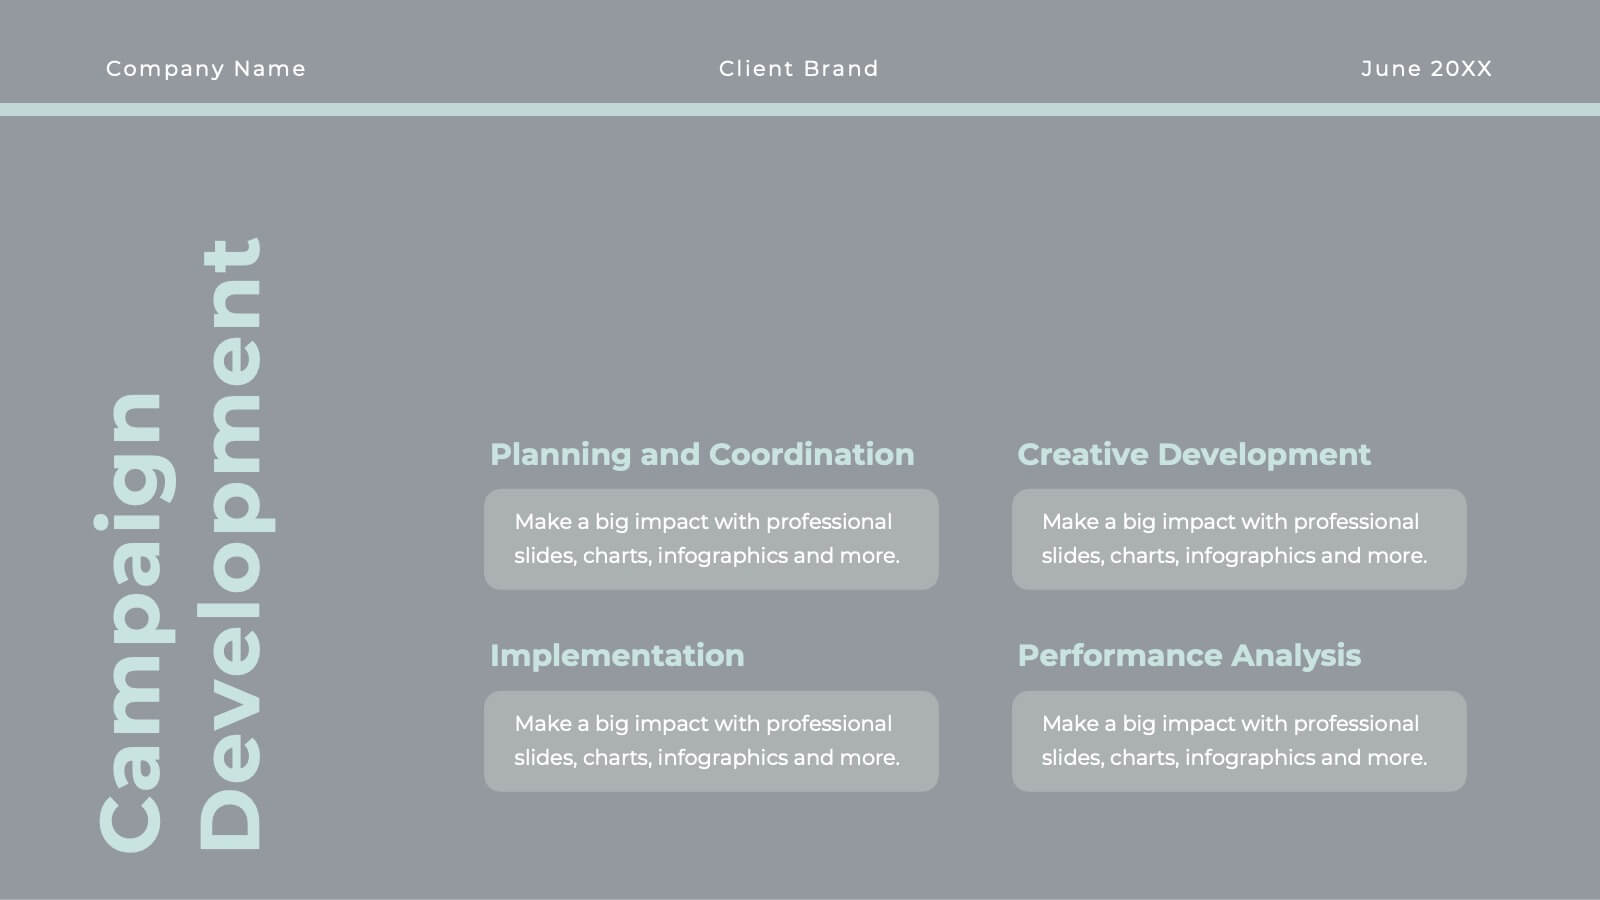
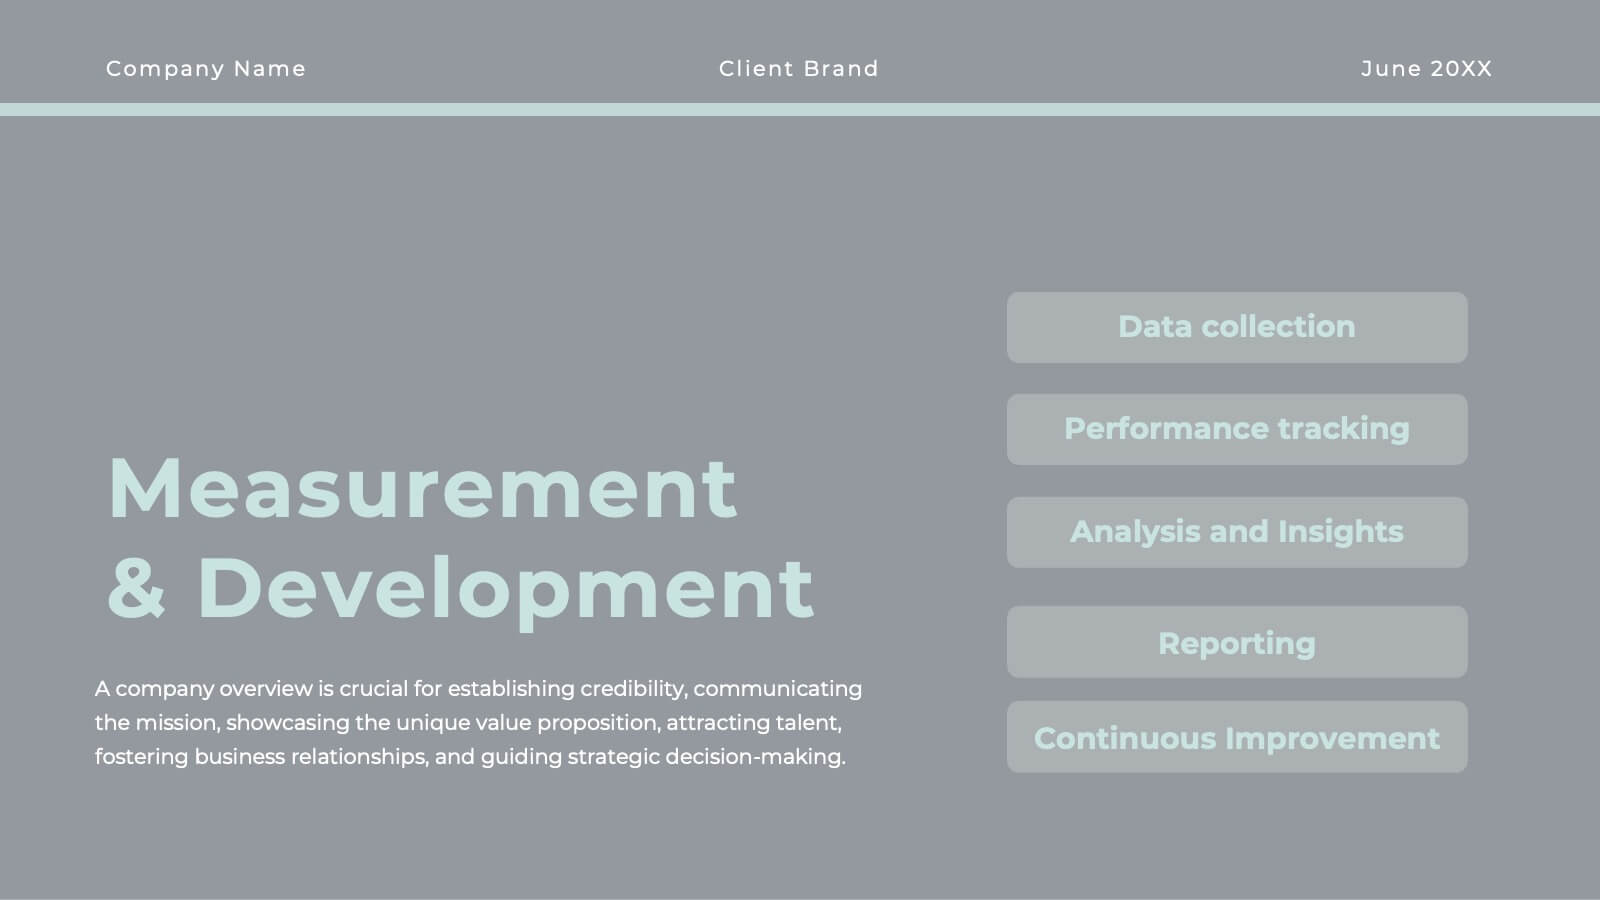
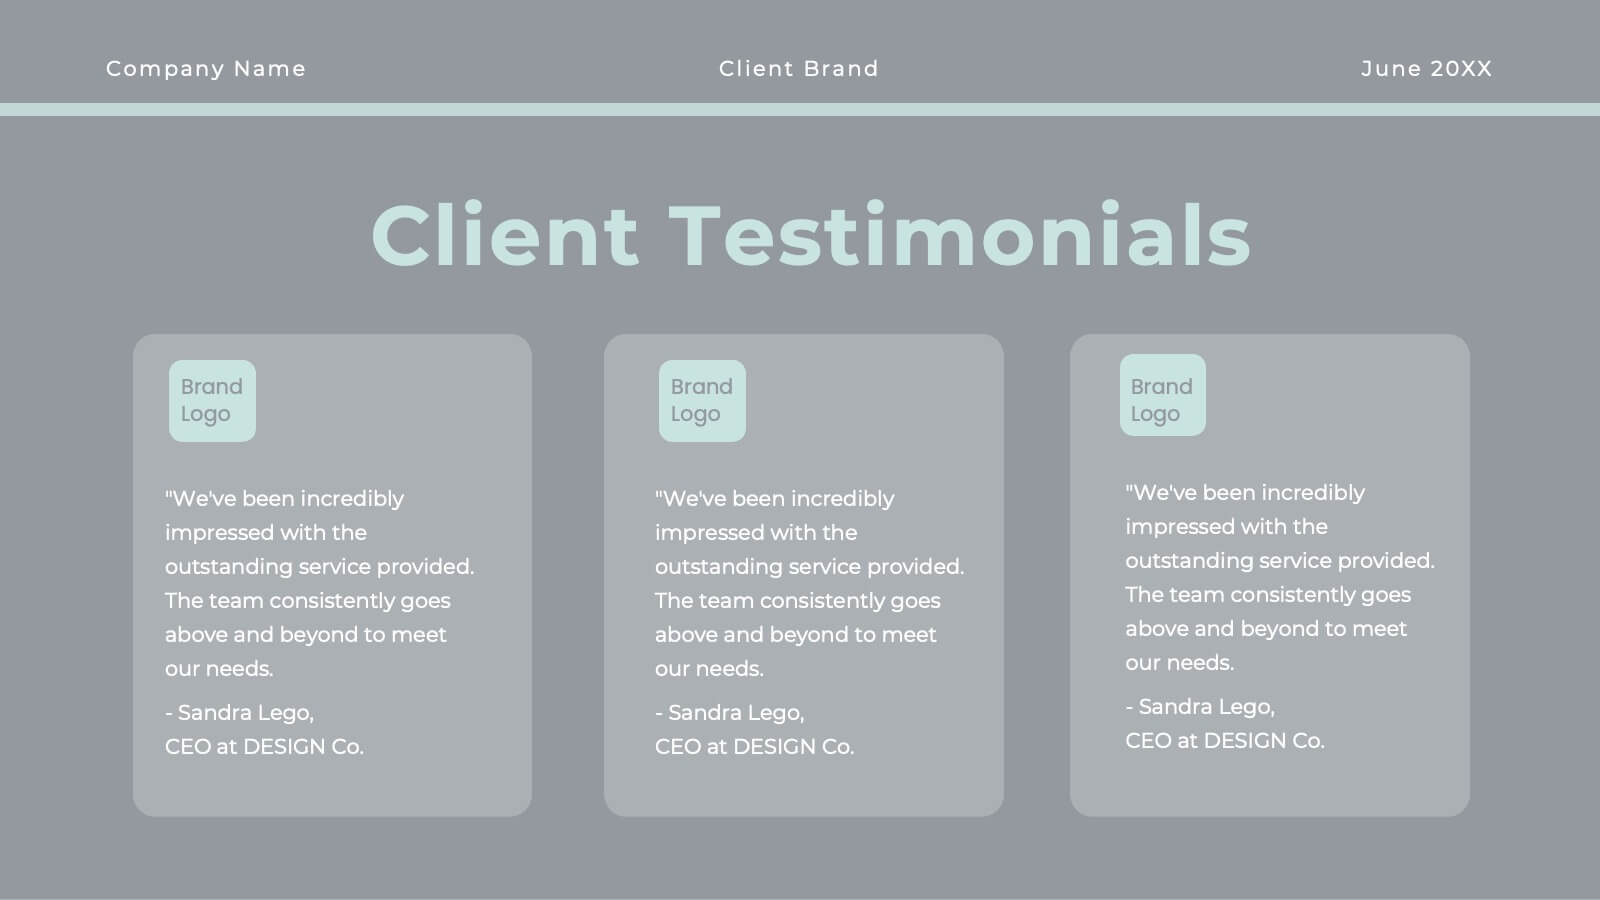
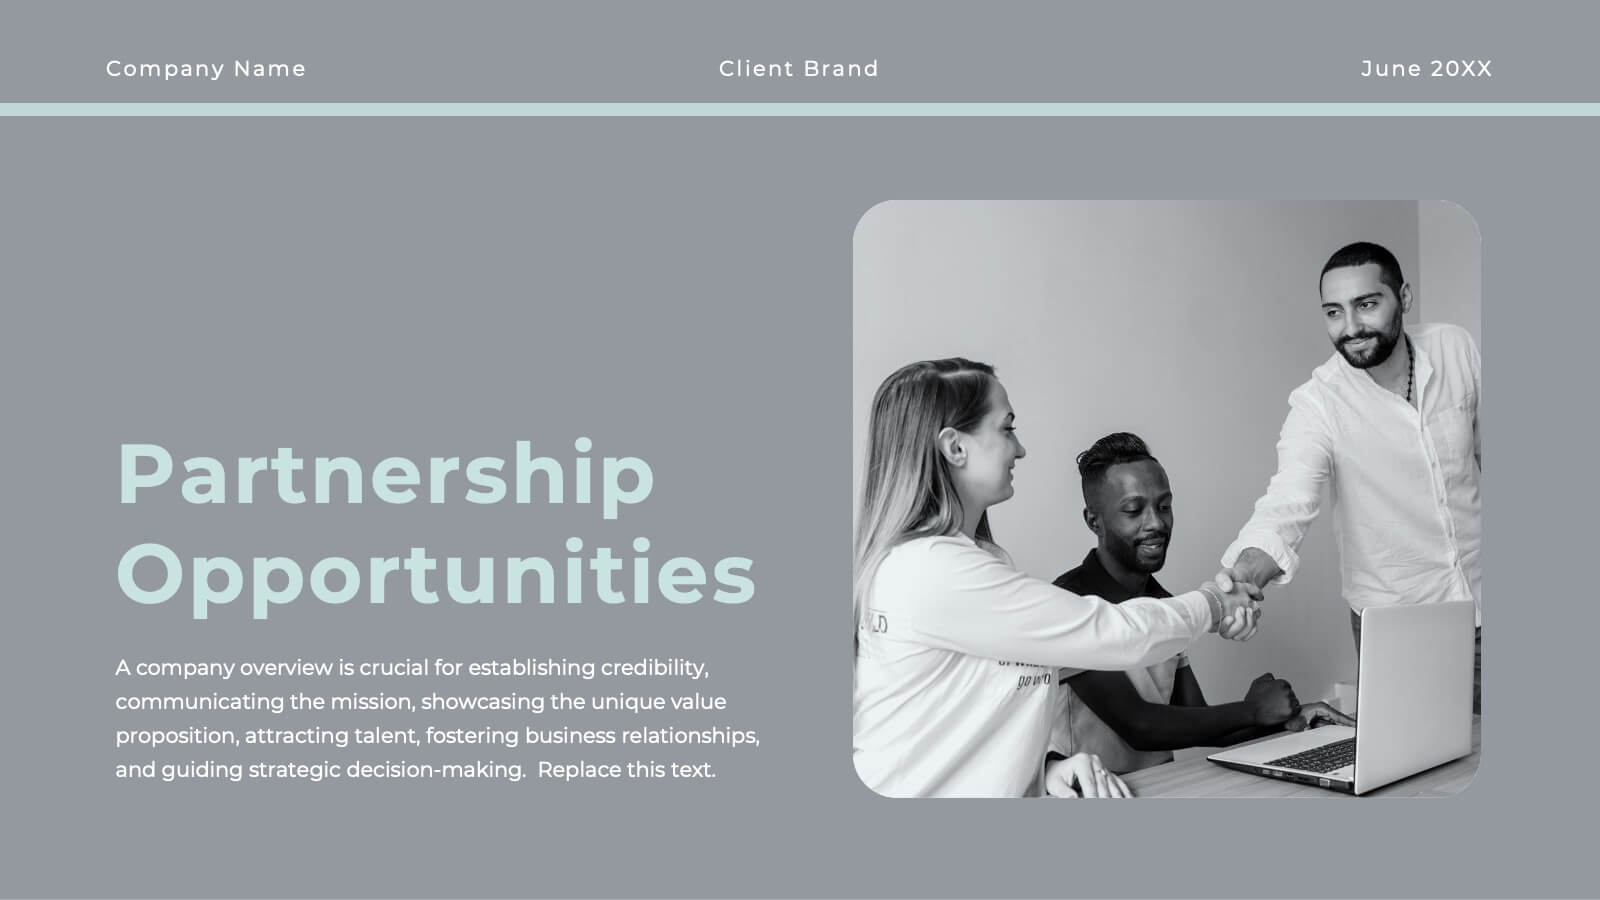
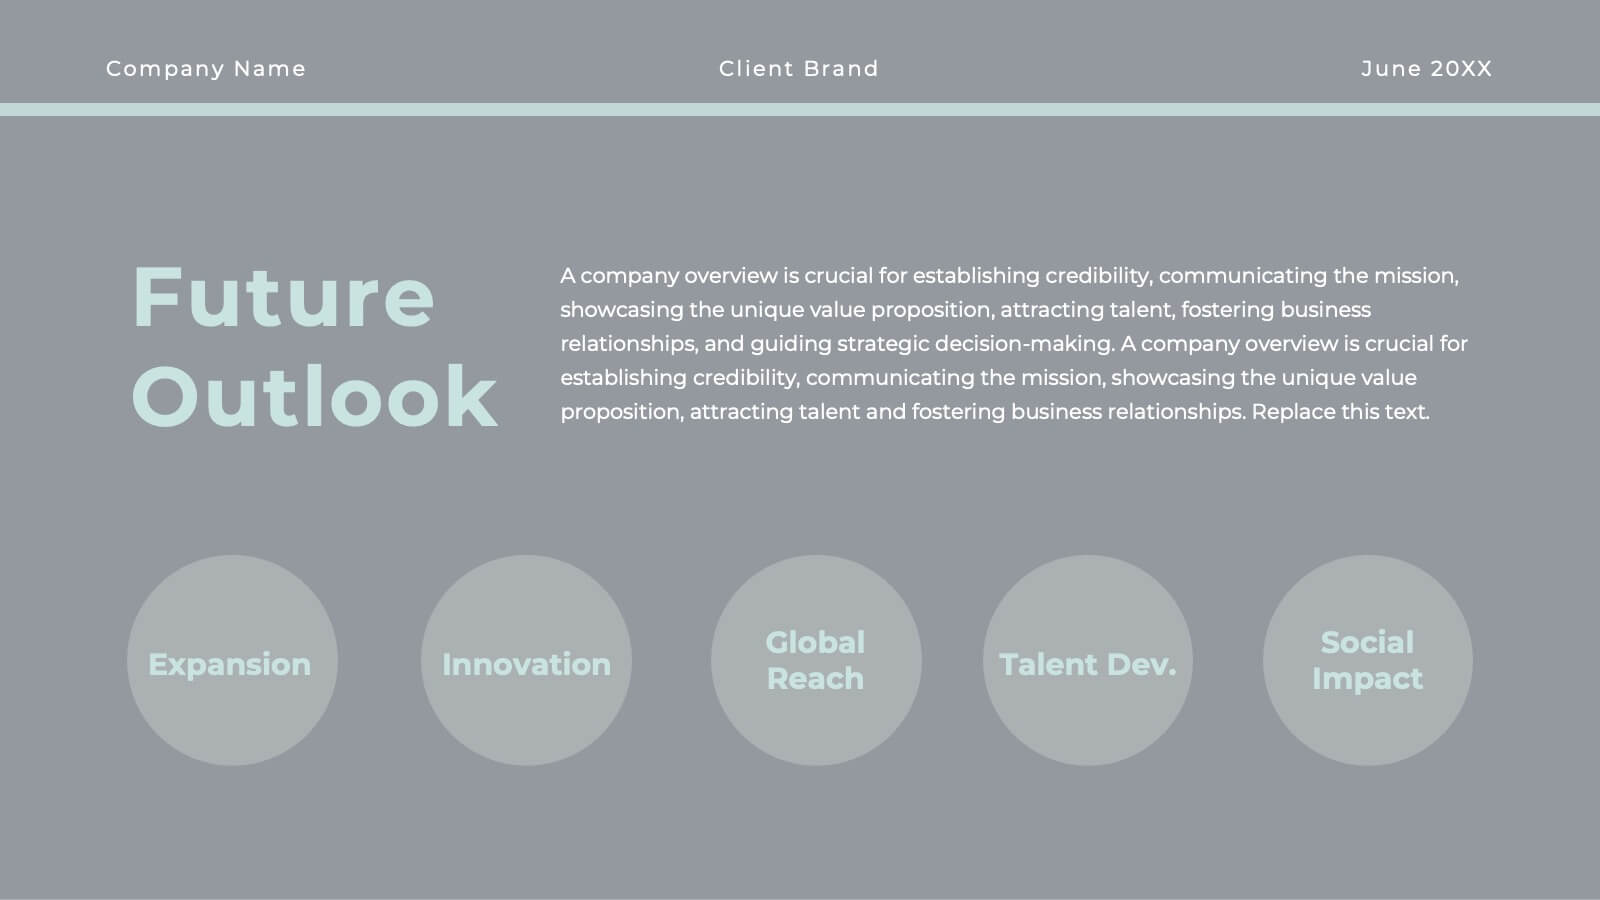
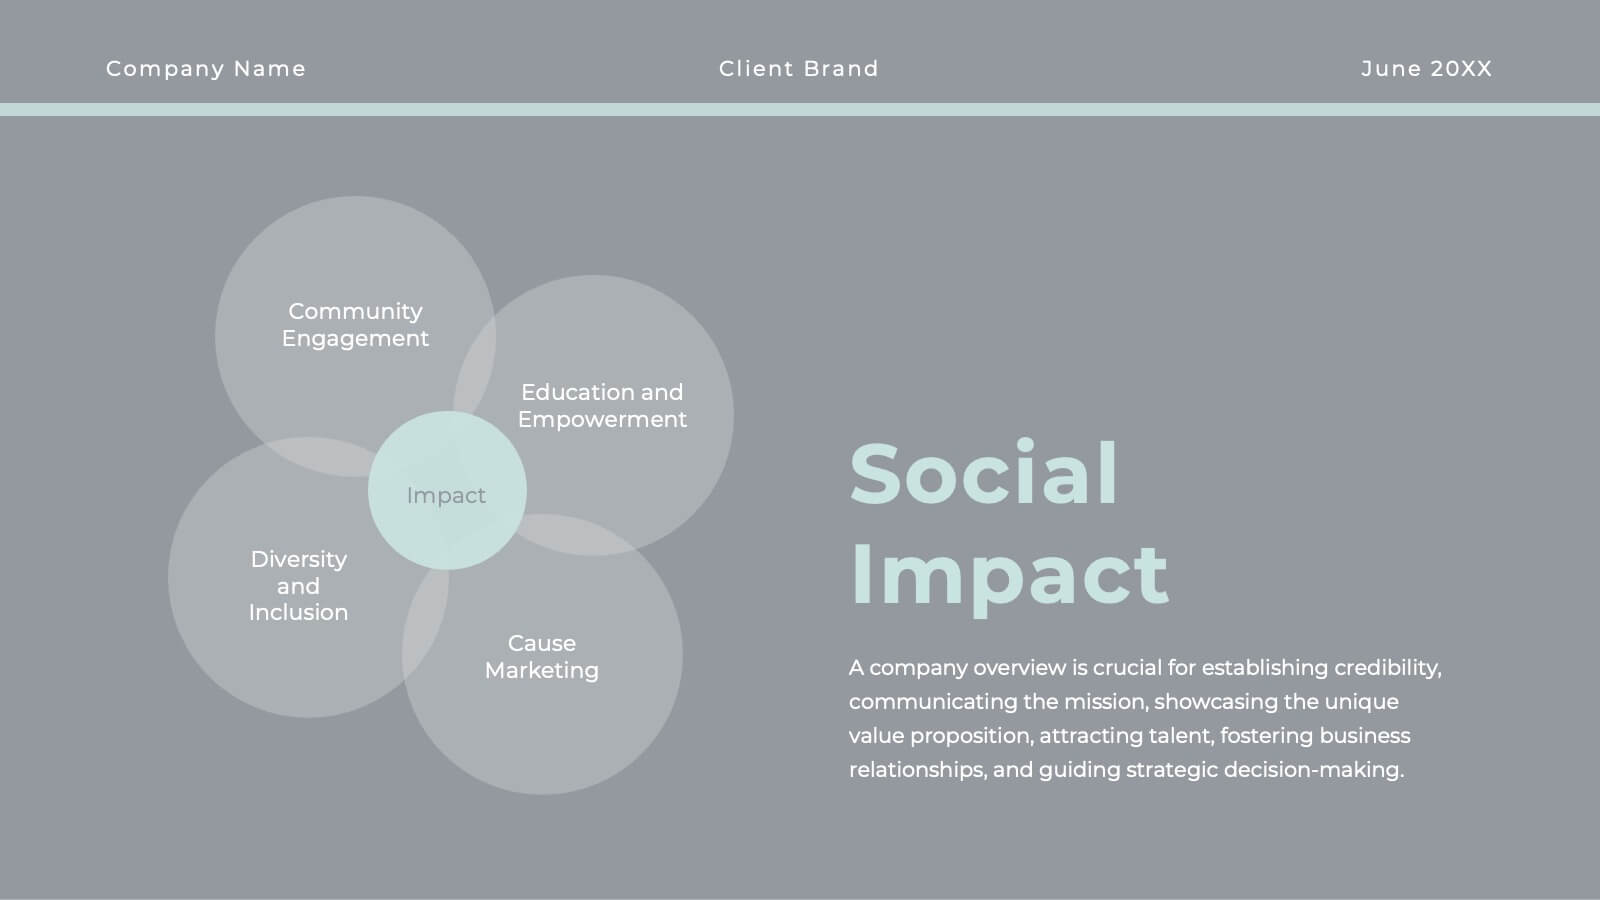
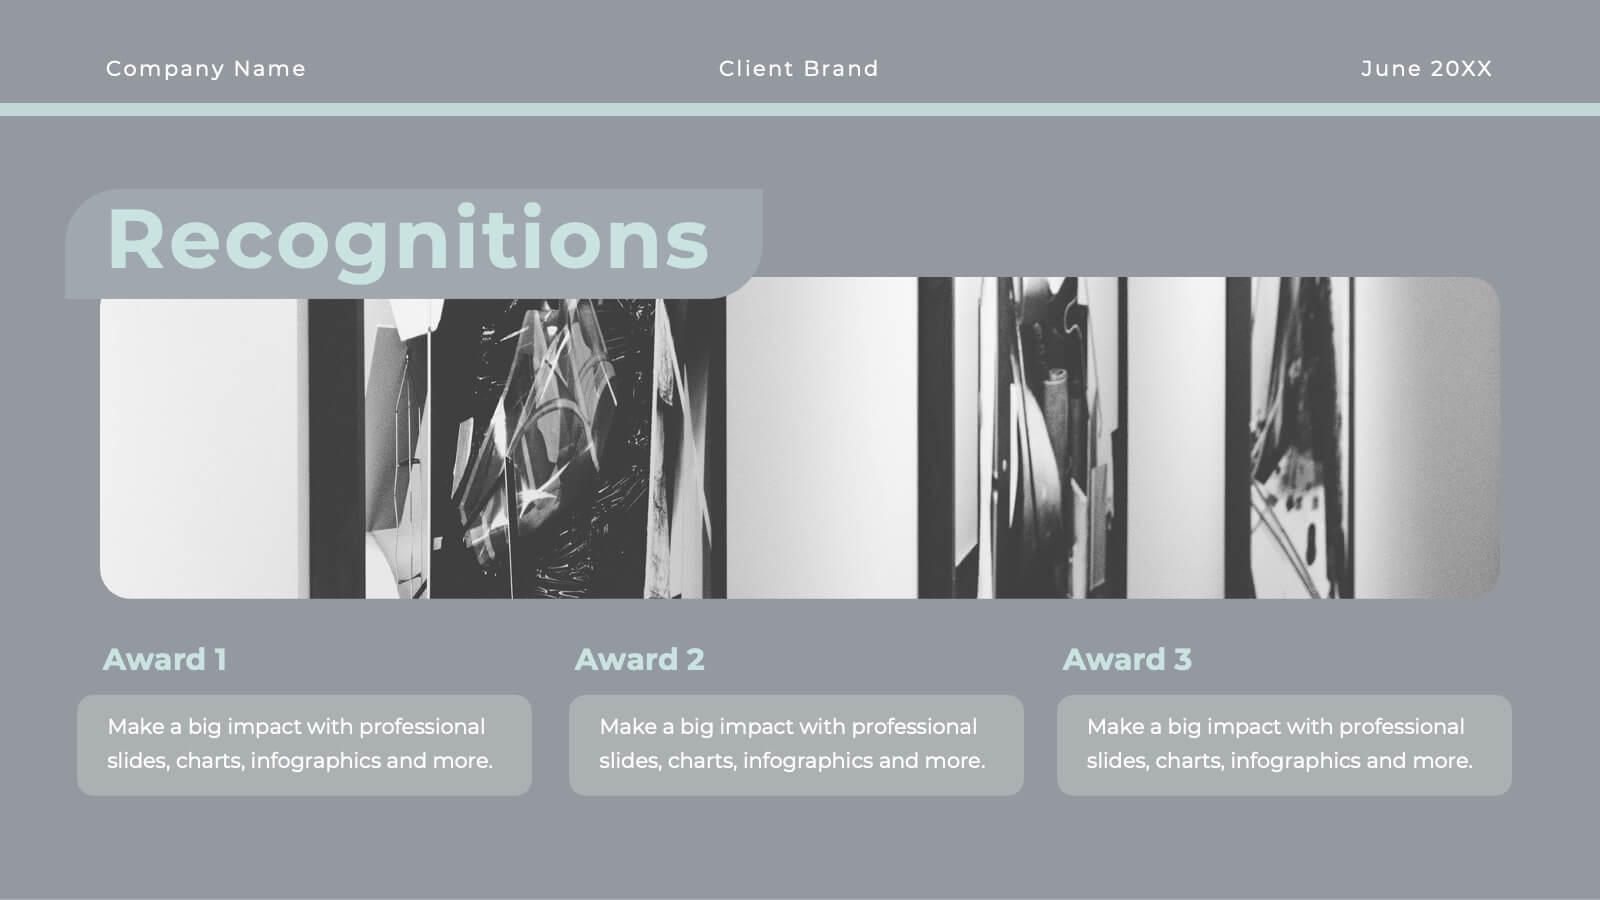
Whirlwind Advertising Agency Proposal Presentation
Get ready to elevate your agency’s game with a proposal template that’s as polished as your services! This sleek and sophisticated design is crafted to make a lasting impression on your clients and partners. From introducing your team’s expertise to showcasing successful case studies, every slide is meticulously designed to reflect professionalism and creativity. The clean, modern layout helps you present your market analysis, industry trends, and strategic approach with clarity and impact. With dedicated sections for client testimonials, campaign development, and partnership opportunities, this template ensures your agency’s value proposition is communicated with confidence and style. Perfectly adaptable to PowerPoint, Keynote, and Google Slides, this proposal template is your go-to tool for sealing deals and building lasting relationships. Your agency’s vision and mission will shine through in a presentation that’s both powerful and persuasive, making your proposals truly unforgettable!


7 diapositivas
Work From Home Infographic Presentation Template
A Work From Home Infographic is a visual representation of data related to working from home. This infographic can be used as a guide to get you through some of the best opportunities available. Use this template to get the necessary tools to start working from home. Use this infographic to show your audience how many people work from home by adding statistics, tips and interesting facts. This template is designed to effectively communicate complex information in a simple format, making it great for exploring the topic of working from home. This is a perfect way to promote your business!


6 diapositivas
IT System Design and Architecture Strategy
Present your IT blueprint with the IT System Design and Architecture Strategy Presentation. This modern pentagon layout helps map out five essential components of your system strategy clearly and efficiently. Fully editable in PowerPoint, Keynote, and Google Slides—perfect for IT leaders, consultants, and infrastructure teams.


4 diapositivas
OKRs Alignment for Performance Goals Presentation
Visualize and align your objectives with precision using the OKRs Alignment for Performance Goals Presentation. This template illustrates how Objectives, Key Activities, and Results converge toward a shared target, helping you communicate goals clearly to teams and stakeholders. Perfect for quarterly planning, team alignment, and executive reviews. Fully editable in Canva, PowerPoint, Keynote, and Google Slides.


4 diapositivas
Organizational Hierarchy Diagram Presentation
Clearly map out your company’s structure with this modern organizational hierarchy slide. Designed for clarity, it displays multiple team roles and reporting lines using intuitive icons and connector lines. Ideal for onboarding, strategy, or HR decks. Fully customizable in Canva, PowerPoint, or Google Slides for seamless integration into any presentation.