


Características


¿Tienes alguna pregunta?
Recomendar


7 diapositivas
Demographic Traits Infographic
Dive deep into the world of demographics with our demographic traits infographic. Painted in hues of white, yellow, and blue, this infographic expertly visualizes population data within a map layout, ensuring a cohesive understanding of varied traits across regions. Tailored for market researchers, sociologists, business analysts, and educators, this tool is designed to make complex demographic data comprehensible and engaging. Whether you're using PowerPoint, Keynote, or Google Slides, our infographic will seamlessly fit, elevating the quality and clarity of your presentation.


7 diapositivas
Gap Analysis Skills Infographic
Gap analysis in a skills context is a process of evaluating the difference or "gap" between the current skills and competencies of an individual or a team and the desired or required skills for a particular role, project, or goal. This infographic template is a crucial tool for personal and professional development, talent management, and strategic planning within organizations. This captivating visual is designed to help individuals and organizations bridge the skills gap effectively. This infographic serves as a compass, guiding you through the essential steps needed to identify, analyze, and close the skills gaps within your organization.


7 diapositivas
Strategy Investment Wheel Infographic
The Strategy Wheel is a visual tool and framework used in strategic management to help organizations align their strategies, goals, and initiatives. This infographic template is designed to act as your compass, guiding you through the intricate pathways of investment strategies. This template brings forth the core concepts and strategic directions, ensuring you're well-equipped to steer your investment journey effectively. Compatible with Powerpoint, Keynote, and Google Slides. This infographic is depicted as a circular diagram divided into segments, each representing a key aspect of the organization's strategy.


7 diapositivas
Simple Schedule Infographic
Effortlessly structure your time with our simple schedule infographic. Rendered in a clean white canvas, enhanced with dependable blue tones and anchored with timeless black, our template is the epitome of clarity and organization. Equipped with streamlined infographics, universal icons, and adaptable image placeholders, it facilitates easy time management and daily planning. Seamlessly tailored for Powerpoint, Keynote, or Google Slides. A fundamental tool for project managers, event planners, educators, or any professional aiming to efficiently allocate their time. Plan with ease; let every slide bring order to your daily chaos.
4 diapositivas
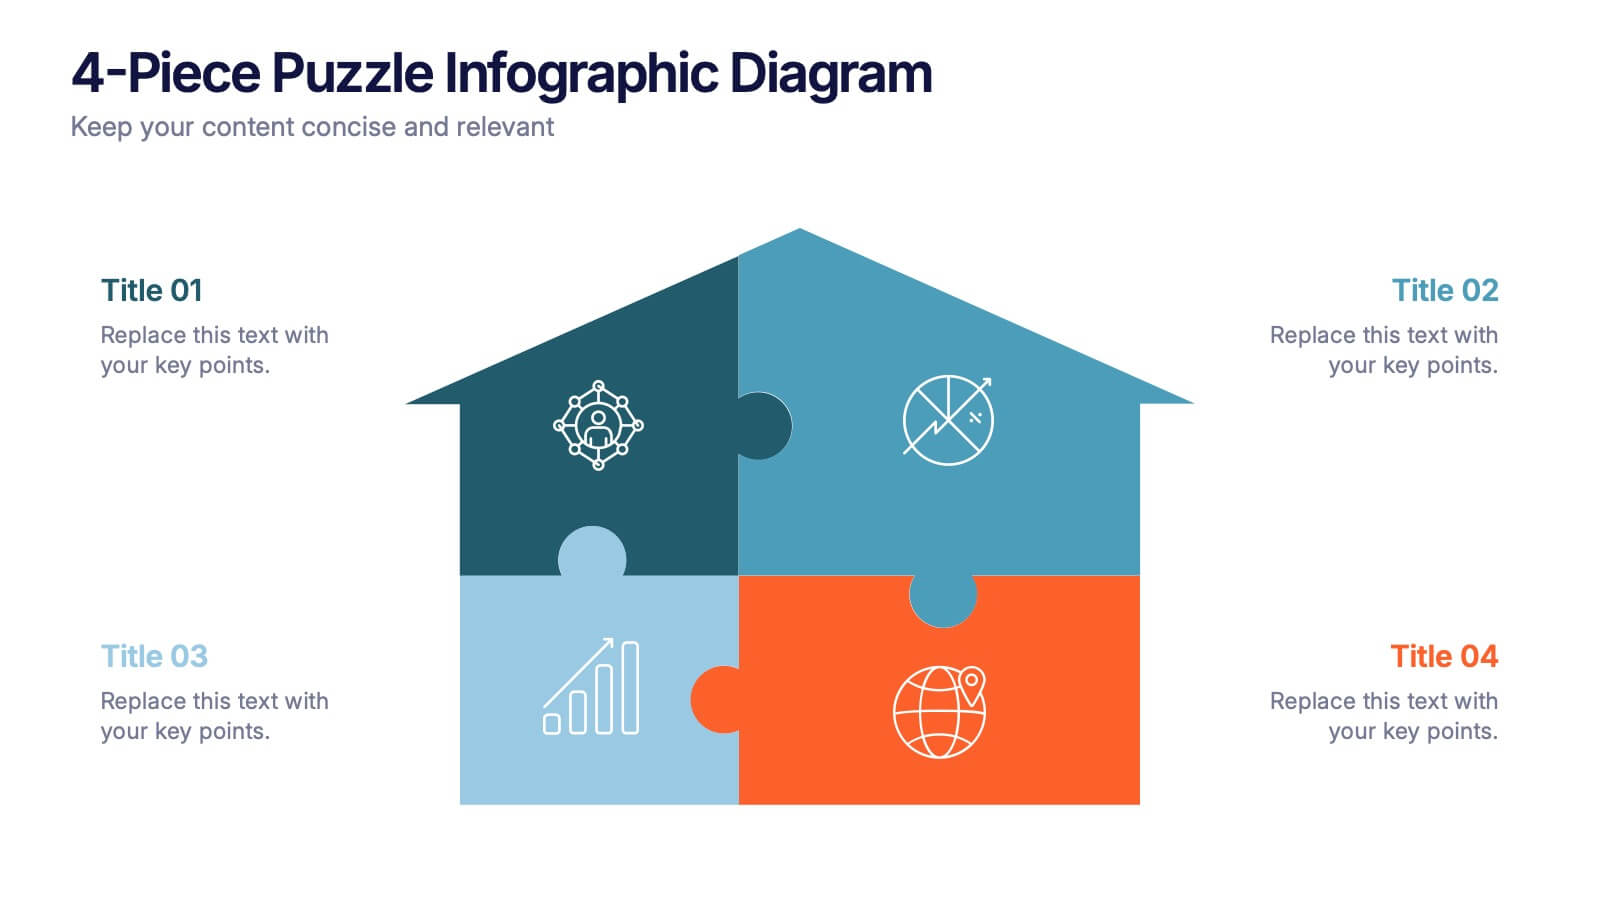
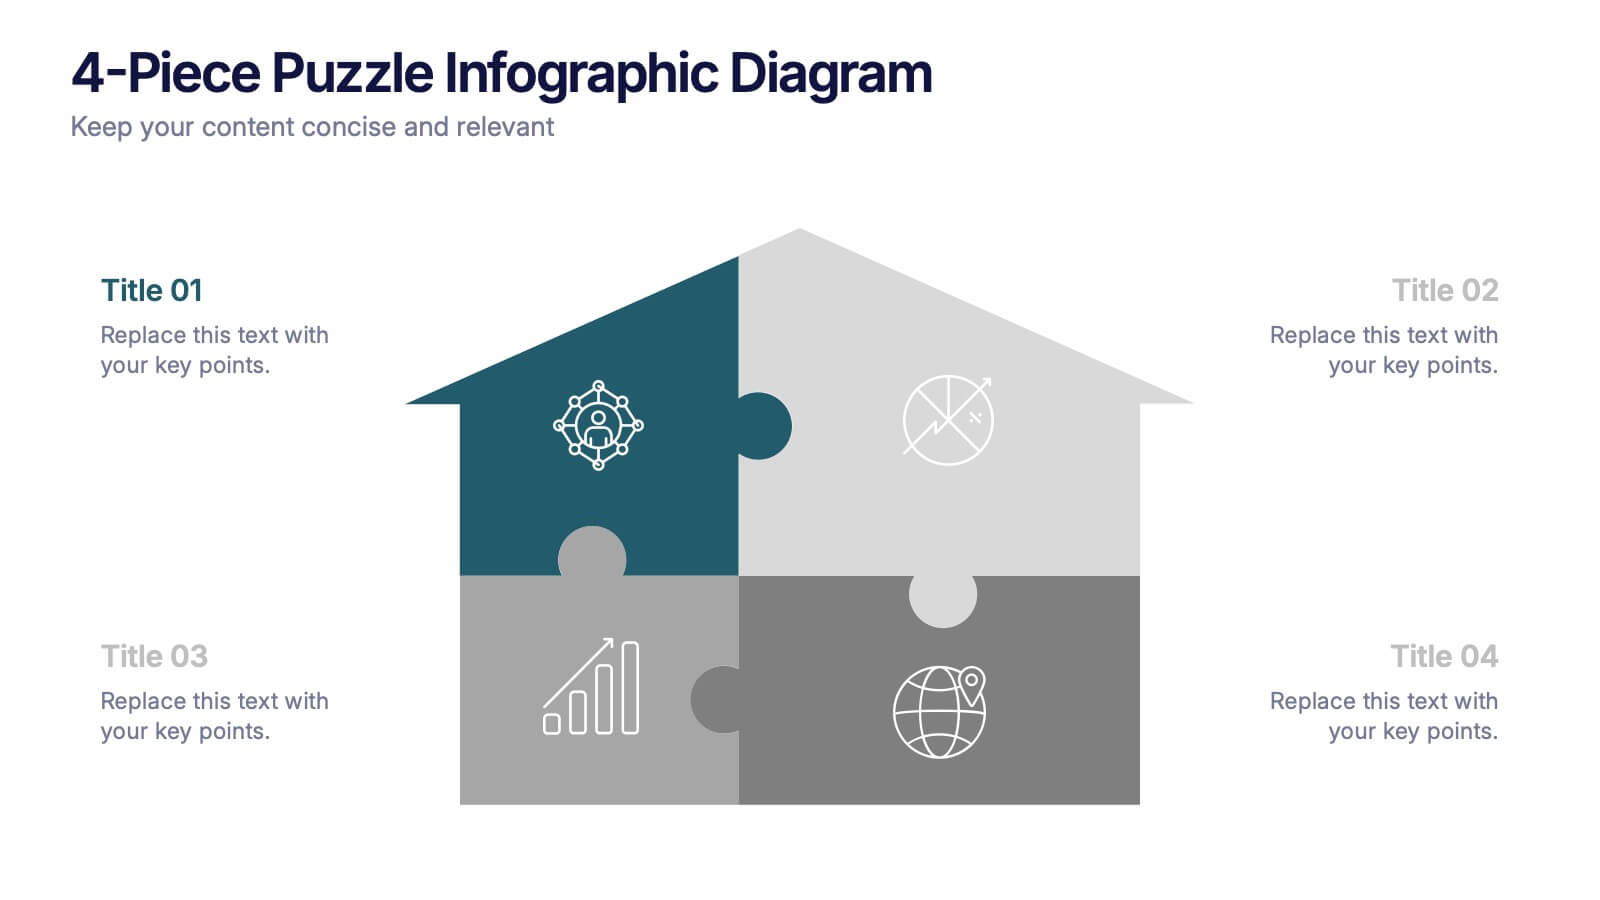
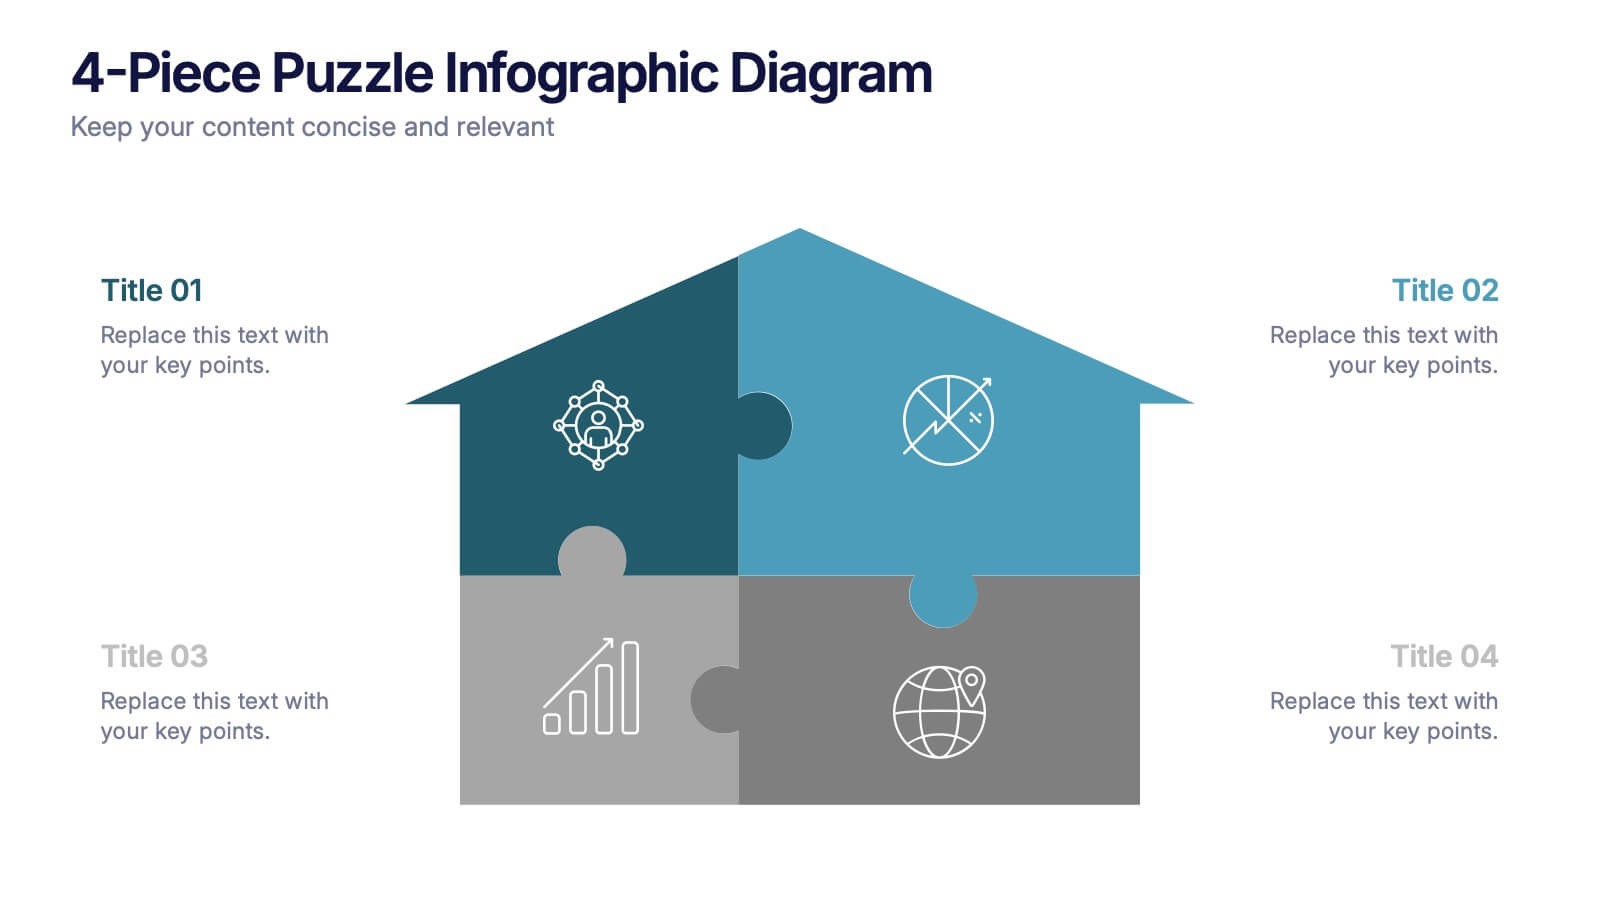
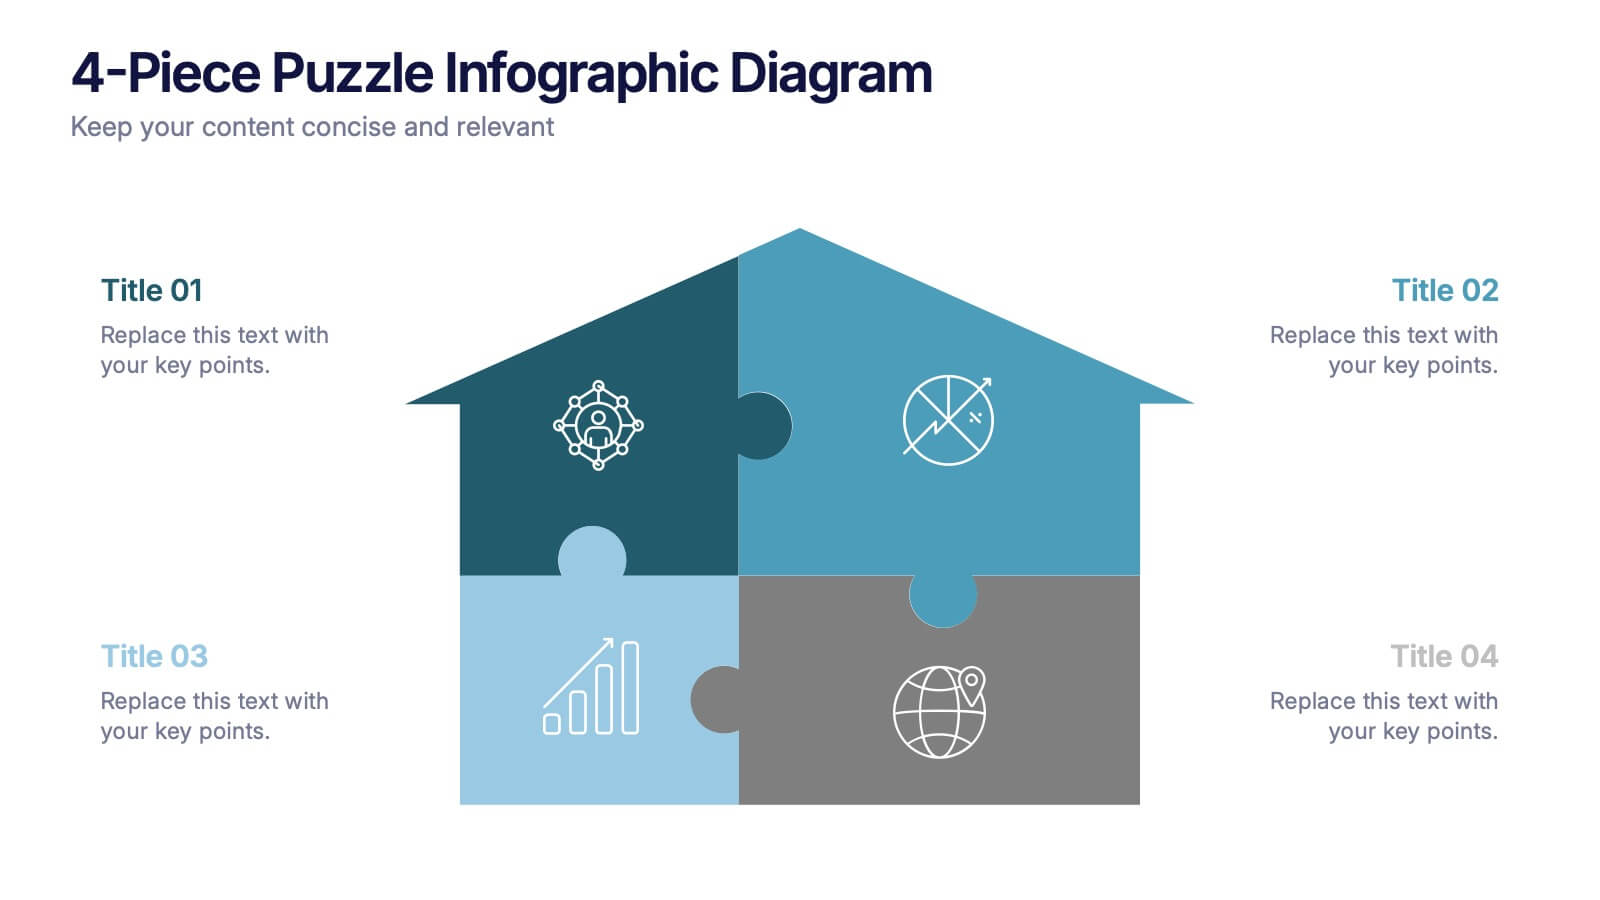
4-Piece Puzzle Infographic Diagram Presentation
Bring clarity and impact to your message with a visual layout that snaps big ideas together like a puzzle. This presentation helps you break complex concepts into four connected sections, making explanations easier and more engaging for any audience. Ideal for planning, insights, or strategy sessions. Fully compatible with PowerPoint, Keynote, and Google Slides.


8 diapositivas
Customer Targeting and Persona Creation Presentation
Hook your audience with a clean, modern layout that zooms in on what really matters—your ideal customer. This customer persona template helps visualize traits, behaviors, and key targets for effective marketing. Perfect for campaign planning, branding, or audience research. Fully compatible with PowerPoint, Keynote, and Google Slides.


6 diapositivas
Project Timeline Infographic
A project timeline is a visual representation of the planned schedule and key milestones of a project. This infographic is designed to outline the sequence of activities, tasks, and events that need to be completed within a specific timeframe to achieve your project goals. This allows you to showcase the timeline of a project, from its inception to completion. It provides a clear and concise overview of the project's major milestones, tasks, and deadlines, enabling viewers to understand the project's progress at a glance. Compatible with Powerpoint, Keynote, and Google Slides.


6 diapositivas
Green Innovation and Eco Impact Presentation
Present your sustainability initiatives with this circular eco infographic. Ideal for showcasing six stages of environmental impact, green innovation, or lifecycle analysis. Features clean, modern icons and color-coded segments. Fully editable in PowerPoint, Keynote, and Google Slides—perfect for corporate ESG updates, eco campaigns, or environmental project planning.


2 diapositivas
Closing Thank You Message Presentation
Make your final message feel warm, polished, and memorable with a clean, modern layout that blends bold color and imagery. This presentation slide helps you wrap up your content, share final notes, or encourage next steps with clarity and style. Fully editable and compatible with PowerPoint, Keynote, and Google Slides.


5 diapositivas
Visual Mind Connections Bubble Chart
Present interconnected ideas with clarity using the Visual Mind Connections Bubble Chart Presentation. This diagram helps map key points around a central concept, making it perfect for brainstorming, strategy sessions, or educational content. Easy to customize in PowerPoint, Keynote, or Google Slides. Ideal for teams, coaches, and presenters.


6 diapositivas
Travel Insurance Infographics
Our "Travel Insurance" infographic template, compatible with PowerPoint, Keynote, and Google Slides, is crafted for insurance companies, travel agencies, and financial advisors. This template is an excellent tool for explaining the benefits and details of travel insurance to clients and customers. The template comprehensively covers vital elements such as coverage options, emergency assistance services, and claim procedures. Its clear and organized layout makes it easy to convey complex insurance information in a manner that is both accessible and engaging. This is particularly useful for presentations aimed at educating travelers about the importance and benefits of travel insurance. Designed with a bright and inviting travel-themed color scheme, the template incorporates elements that reflect global travel and security. This not only makes the presentation visually appealing but also resonates with the theme of travel and protection. Whether used in client consultations, marketing materials, or informational workshops, this template ensures that the key aspects of travel insurance are presented clearly and attractively.


6 diapositivas
Team Vision Infographic
Explore our collection of Slide Templates tailored to showcase your team's vision and future ambitions. These templates offer a blend of modern and professional designs that are perfect for laying out your team's objectives and strategies. Each slide is crafted to facilitate clear communication of your vision, ensuring every team member is aligned and motivated. These visually appealing templates are ideal for team meetings, strategic planning sessions, and leadership presentations. They are fully customizable, allowing you to adapt the colors, text, and graphics to match your team's identity and goals. Optimize your team's presentations with these versatile templates, designed to promote understanding and enthusiasm for your collective vision.


5 diapositivas
New Hire Employee Onboarding Flow Presentation
Make a lasting first impression with a clear, engaging flow that guides new hires through every step of their onboarding journey. Perfect for HR teams and managers, this presentation simplifies complex processes with visual structure and clarity. Fully compatible with PowerPoint, Keynote, and Google Slides for easy customization and use.


5 diapositivas
HIV Awareness Programs Infographics
HIV awareness programs are initiatives aimed at educating individuals and communities about HIV (human immunodeficiency virus), it’s transmission, prevention, and the importance of testing and treatment. These vertical infographics are designed to raise awareness about HIV/AIDS and promote education about prevention, testing, and support. This presentation is suitable for organizations, healthcare professionals, educators, or anyone interested in spreading awareness about HIV and its impact on individuals and communities. This incorporates visually engaging infographics and statistics to present key information and data related to HIV/AIDS.


7 diapositivas
SEO Infographic Presentation Template
SEO stands for “search engine optimization.” In simple terms, it's the process of improving your site to increase its visibility when people search for products or services related to your business in Google and other search engines. Learn more about SEO with this clean template, including how to optimize your pages and how search engines work. This template will inform you how keywords and phrases drive search engine results, how they affect rankings, and what steps to take to achieve higher rankings. This template comes packed with fun illustrations, and can be used as a great presentation.


5 diapositivas
Workplace Safety Guidelines and Protocols Presentation
Prioritize health and hazard awareness with the Workplace Safety Guidelines and Protocols presentation. Featuring a clean visual of a segmented fire extinguisher, this design clearly breaks down safety measures into five customizable steps. Ideal for internal training, HR onboarding, or compliance meetings, each section is paired with editable titles and descriptive placeholders. Communicate procedures like emergency response, equipment use, or safety checklists effectively. Compatible with PowerPoint, Keynote, and Google Slides, this template ensures your team stays informed and aligned.


5 diapositivas
Corporate Networking Structure Diagram Presentation
Showcase your internal collaboration and stakeholder relationships with this Corporate Networking Structure Diagram. Designed to visualize team interactions, departmental roles, and key connections, this template is perfect for corporate overviews or internal strategy meetings. Fully editable in PowerPoint, Keynote, and Google Slides for seamless integration into your business presentations.