


Características


¿Tienes alguna pregunta?
Recomendar


7 diapositivas
Food Infographic Presentation Template
A Food Infographic is a visual representation of information and data related to food. It can be used to educate people on various aspects of food such as its nutritional value, cooking methods, and recipes. This template can be presented in a variety of ways, including charts, graphs, illustrations, and images you can customize with your information. The goal of this Food Infographic is to make complex information about food more accessible and easy to understand for the general public. This template works with Powerpoint, Keynote, and Google Slides, so you can use it on any device.


6 diapositivas
Effective Time Management Strategies
Master your productivity with this time-focused infographic template. Featuring a central clock illustration and six surrounding sections, it's perfect for showcasing time-blocking techniques, task prioritization, or team scheduling strategies. Customize each segment with your own insights in PowerPoint, Keynote, or Google Slides. Fully editable for any business use.


4 diapositivas
Project Workflow Steps and Flowchart Presentation
Map out each phase of your project with clarity using the Project Workflow Steps and Flowchart Presentation. This detailed template offers a visual grid layout for illustrating task sequences, decision points, and team responsibilities. Ideal for project managers, analysts, and operations teams. Fully editable and compatible with PowerPoint, Keynote, and Google Slides.


20 diapositivas
Vitrumin Photography Portfolio Presentation
Showcase your creative work with this elegant and modern photography portfolio presentation template. Featuring essential slides such as an introduction, project highlights, creative process, awards, and client testimonials, this template is perfect for presenting your work professionally. Fully customizable and easy to edit, it's compatible with PowerPoint, Keynote, and Google Slides.


20 diapositivas
Bravo Creative Portfolio Presentation
Showcase your creative prowess with this sleek, modern portfolio presentation template. Perfect for highlighting featured projects, client testimonials, and your creative process, this template ensures your work shines. Its stylish design and professional layout make it ideal for impressing potential clients and collaborators. Compatible with PowerPoint, Keynote, and Google Slides, it's versatile for any platform.


5 diapositivas
Quality Control with Six Sigma Strategy Presentation
Showcase your quality control framework using the Quality Control with Six Sigma Strategy Presentation. This modern layout highlights each stage of the DMAIC process in a visually engaging format, ideal for Lean Six Sigma teams and continuous improvement professionals. Fully customizable in PowerPoint, Keynote, Canva, and Google Slides.


20 diapositivas
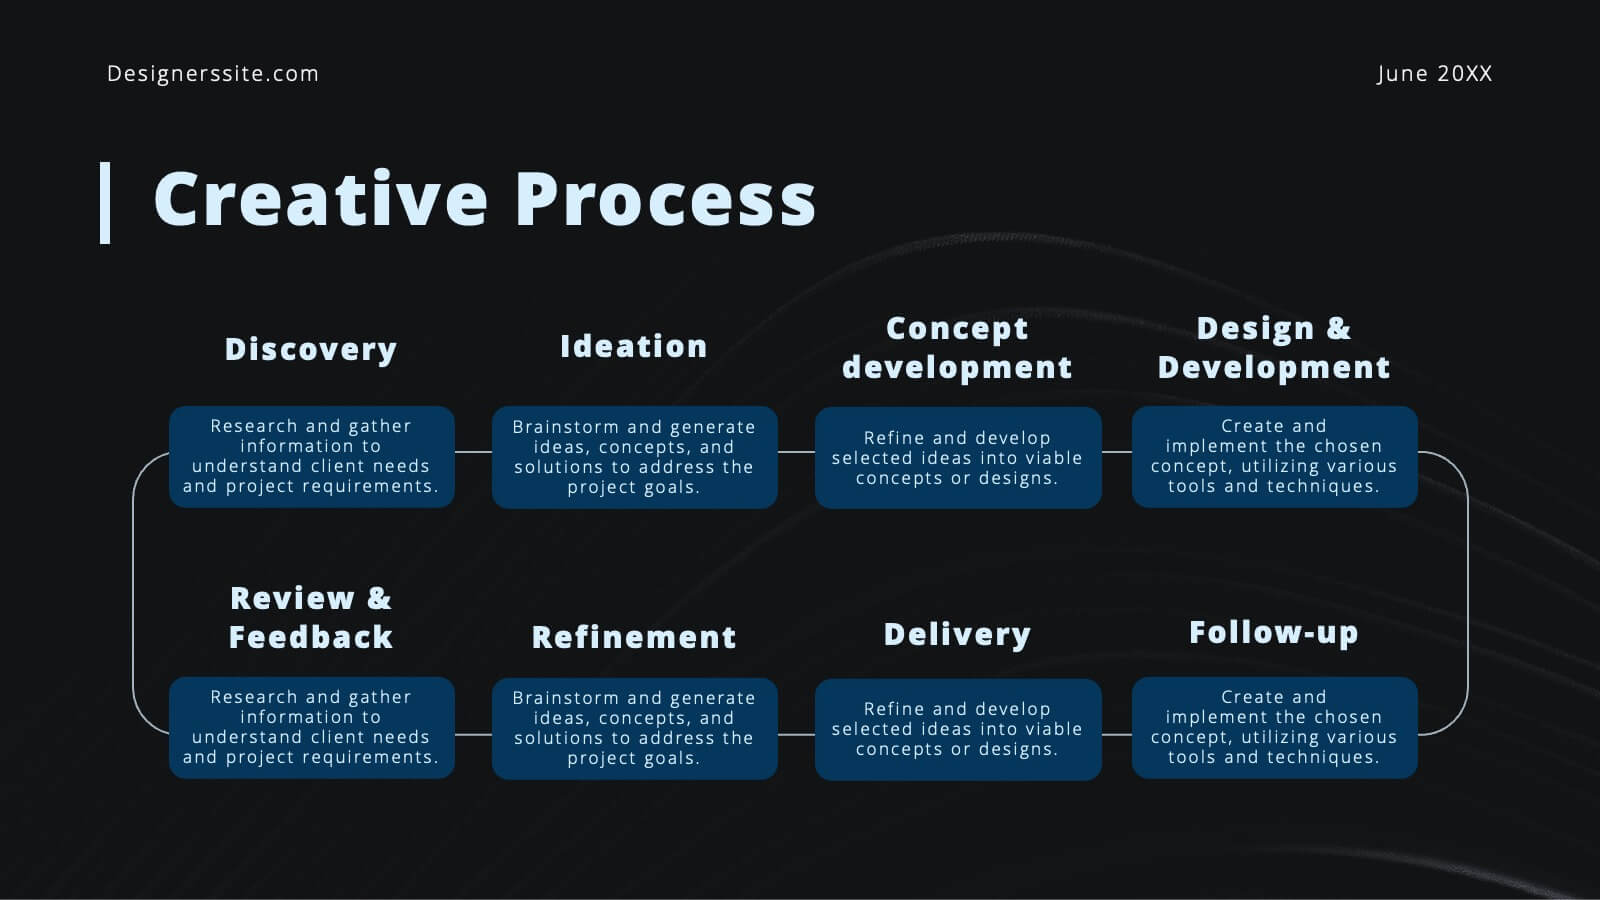
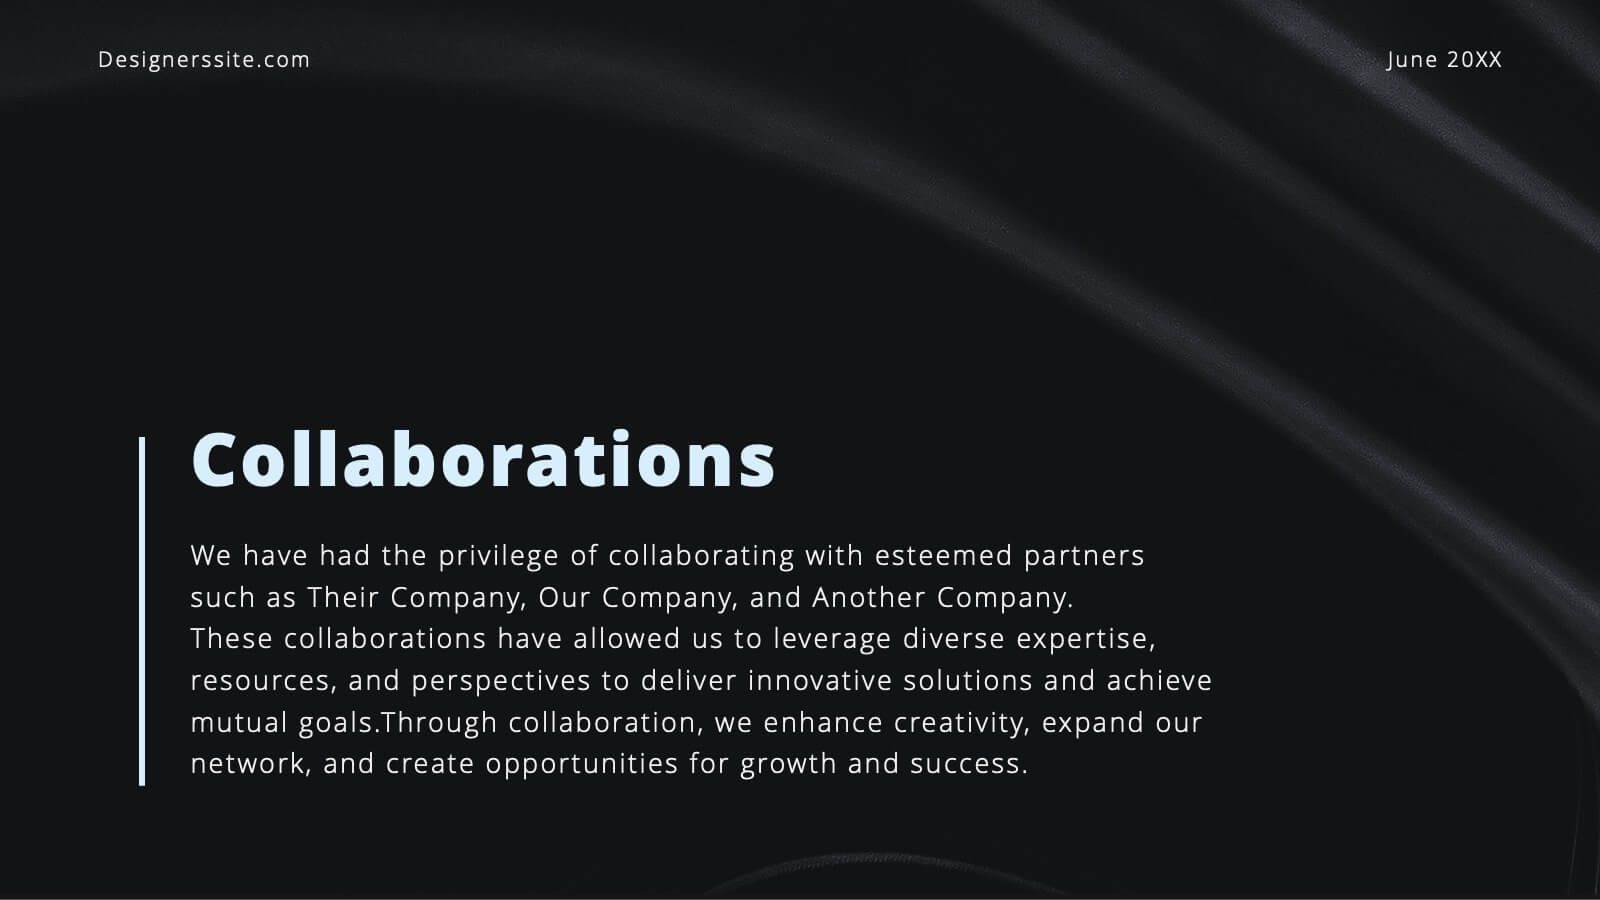
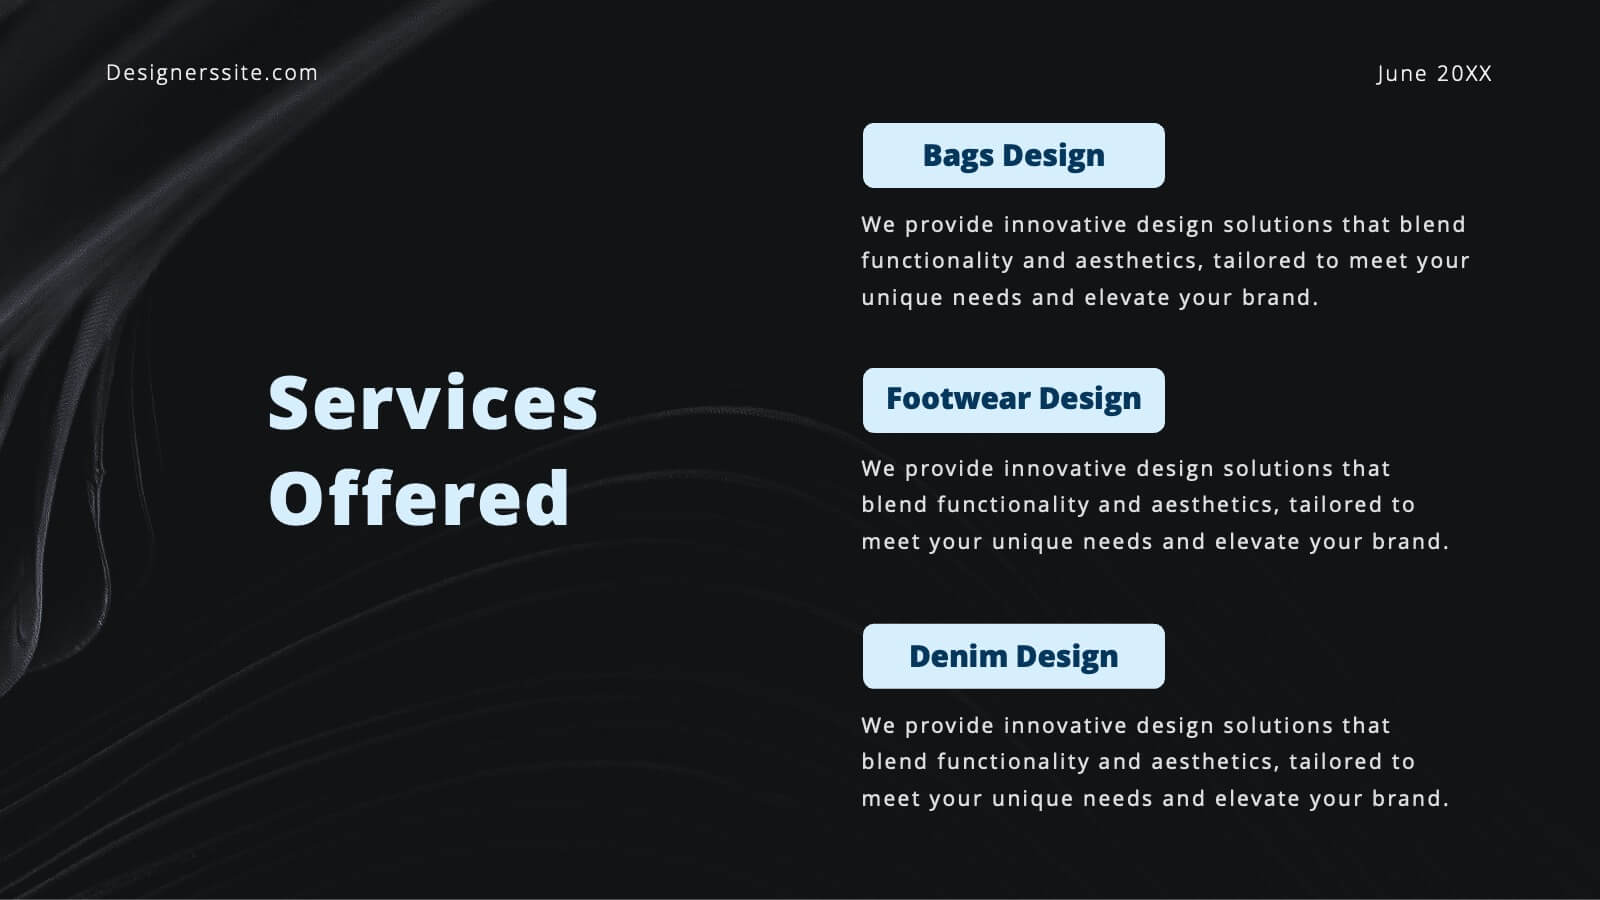
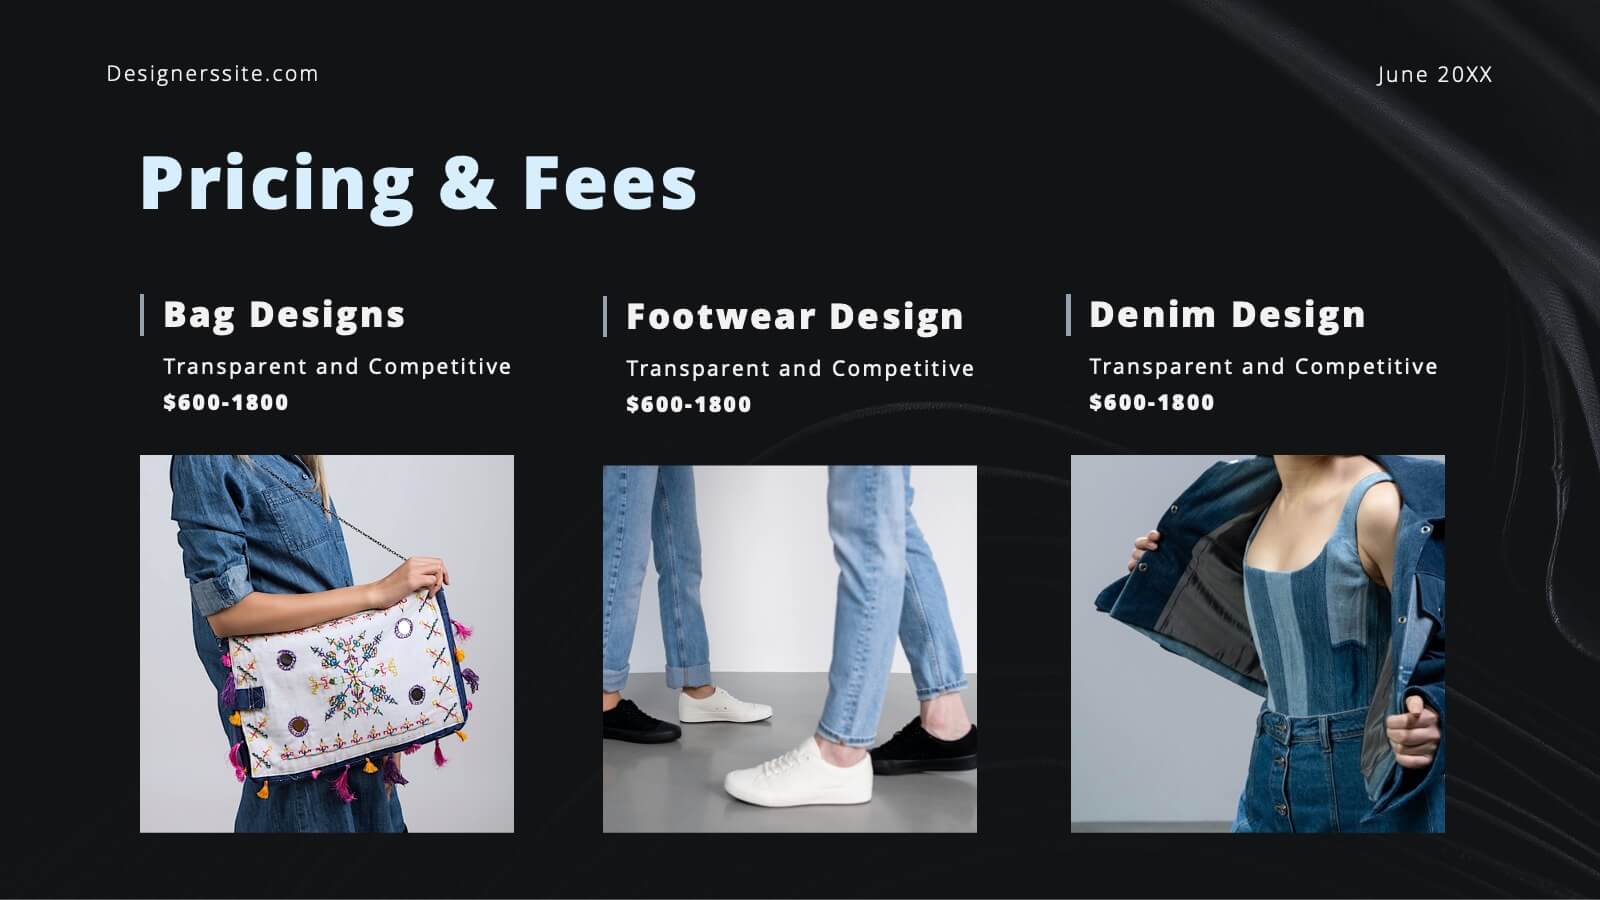
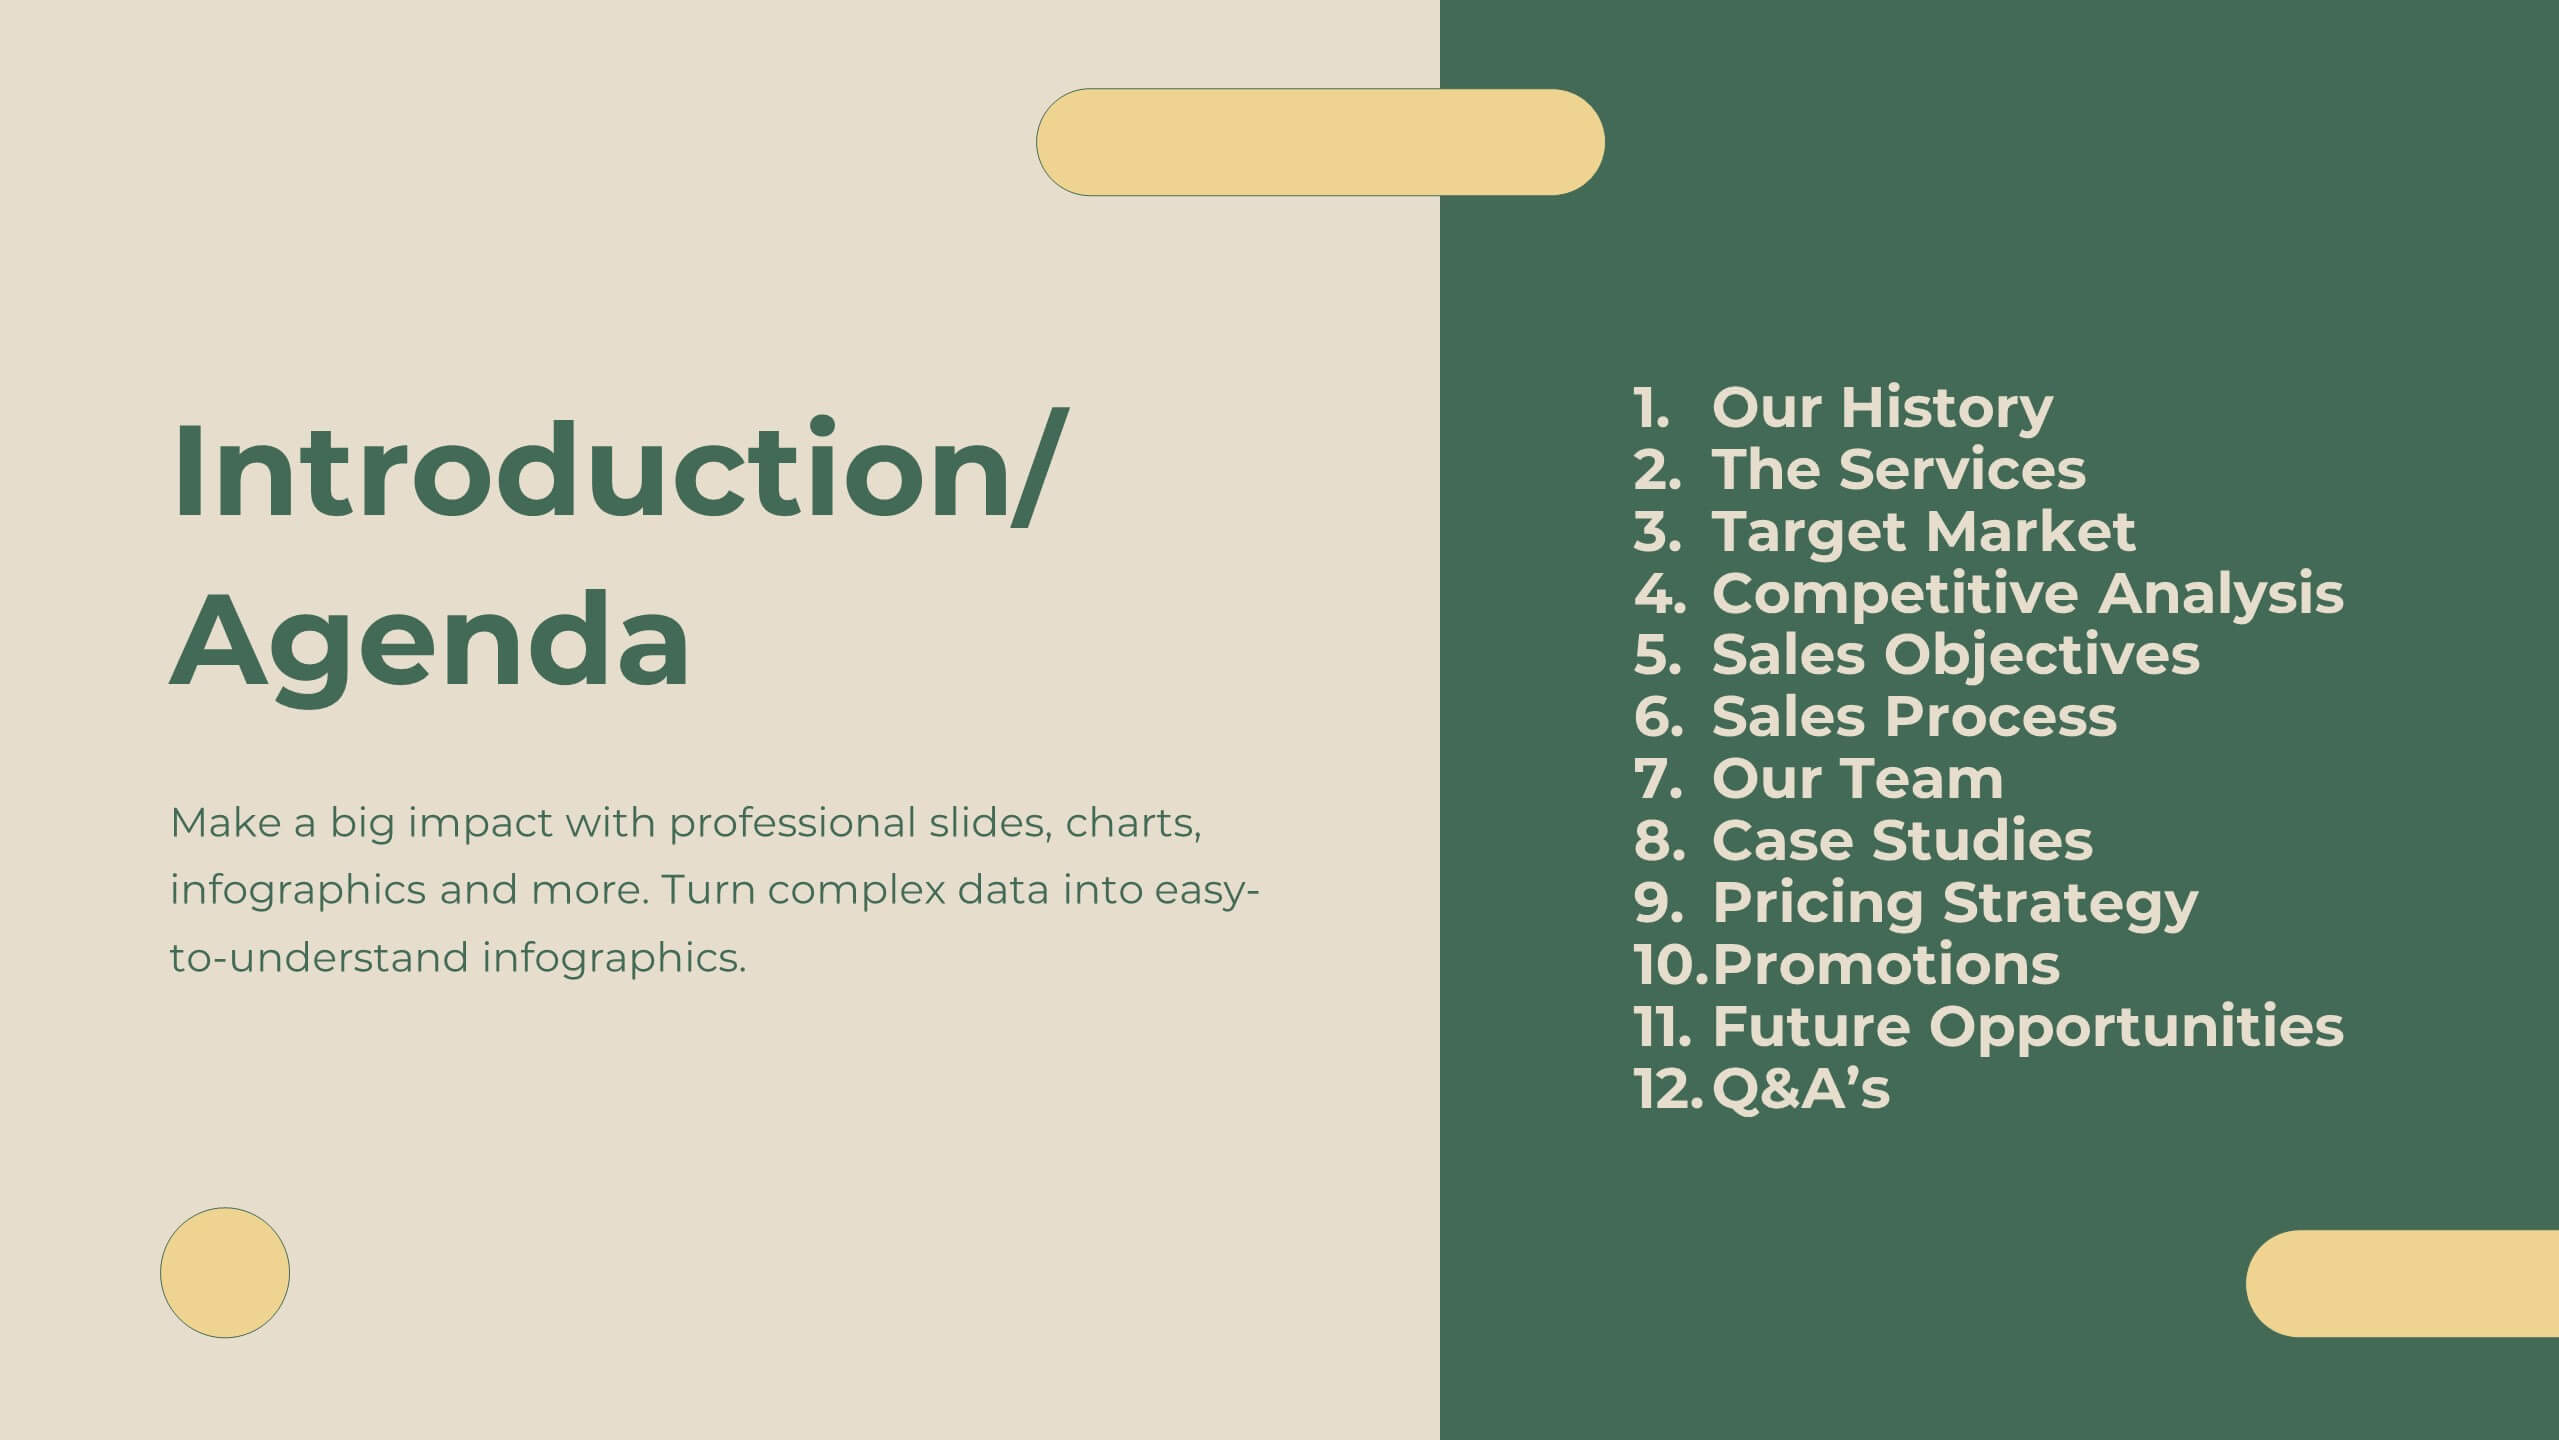
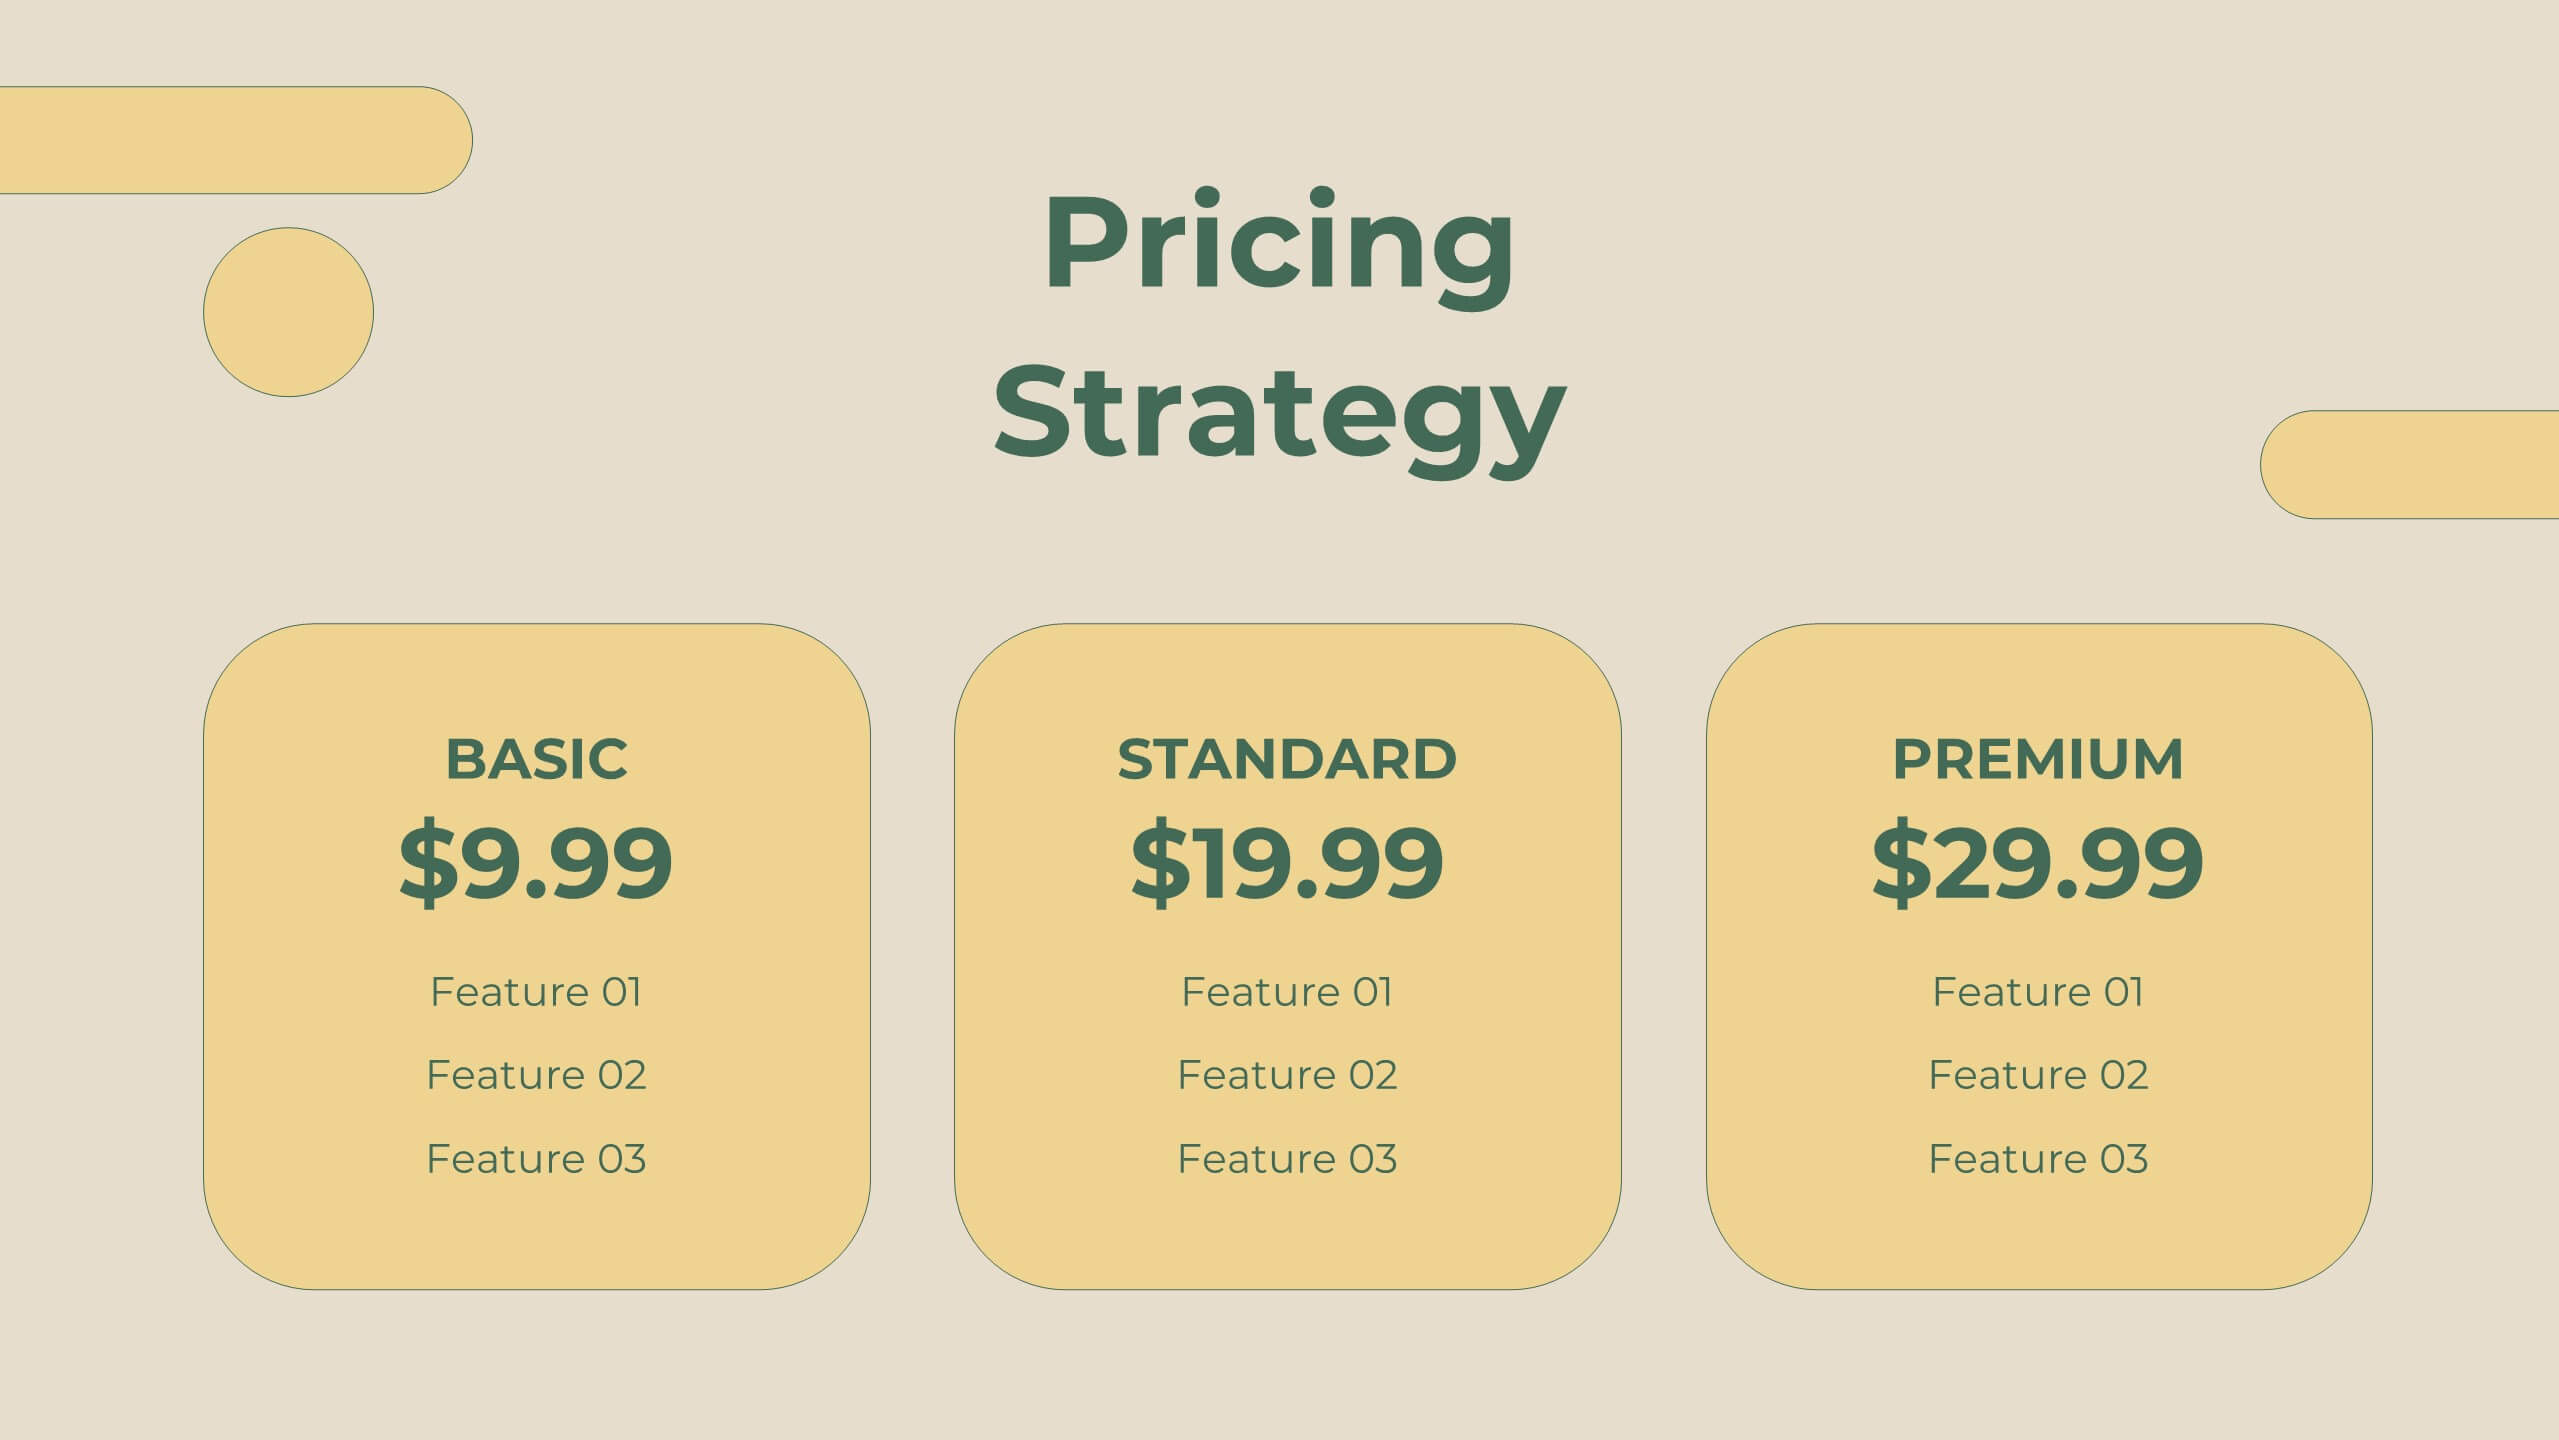
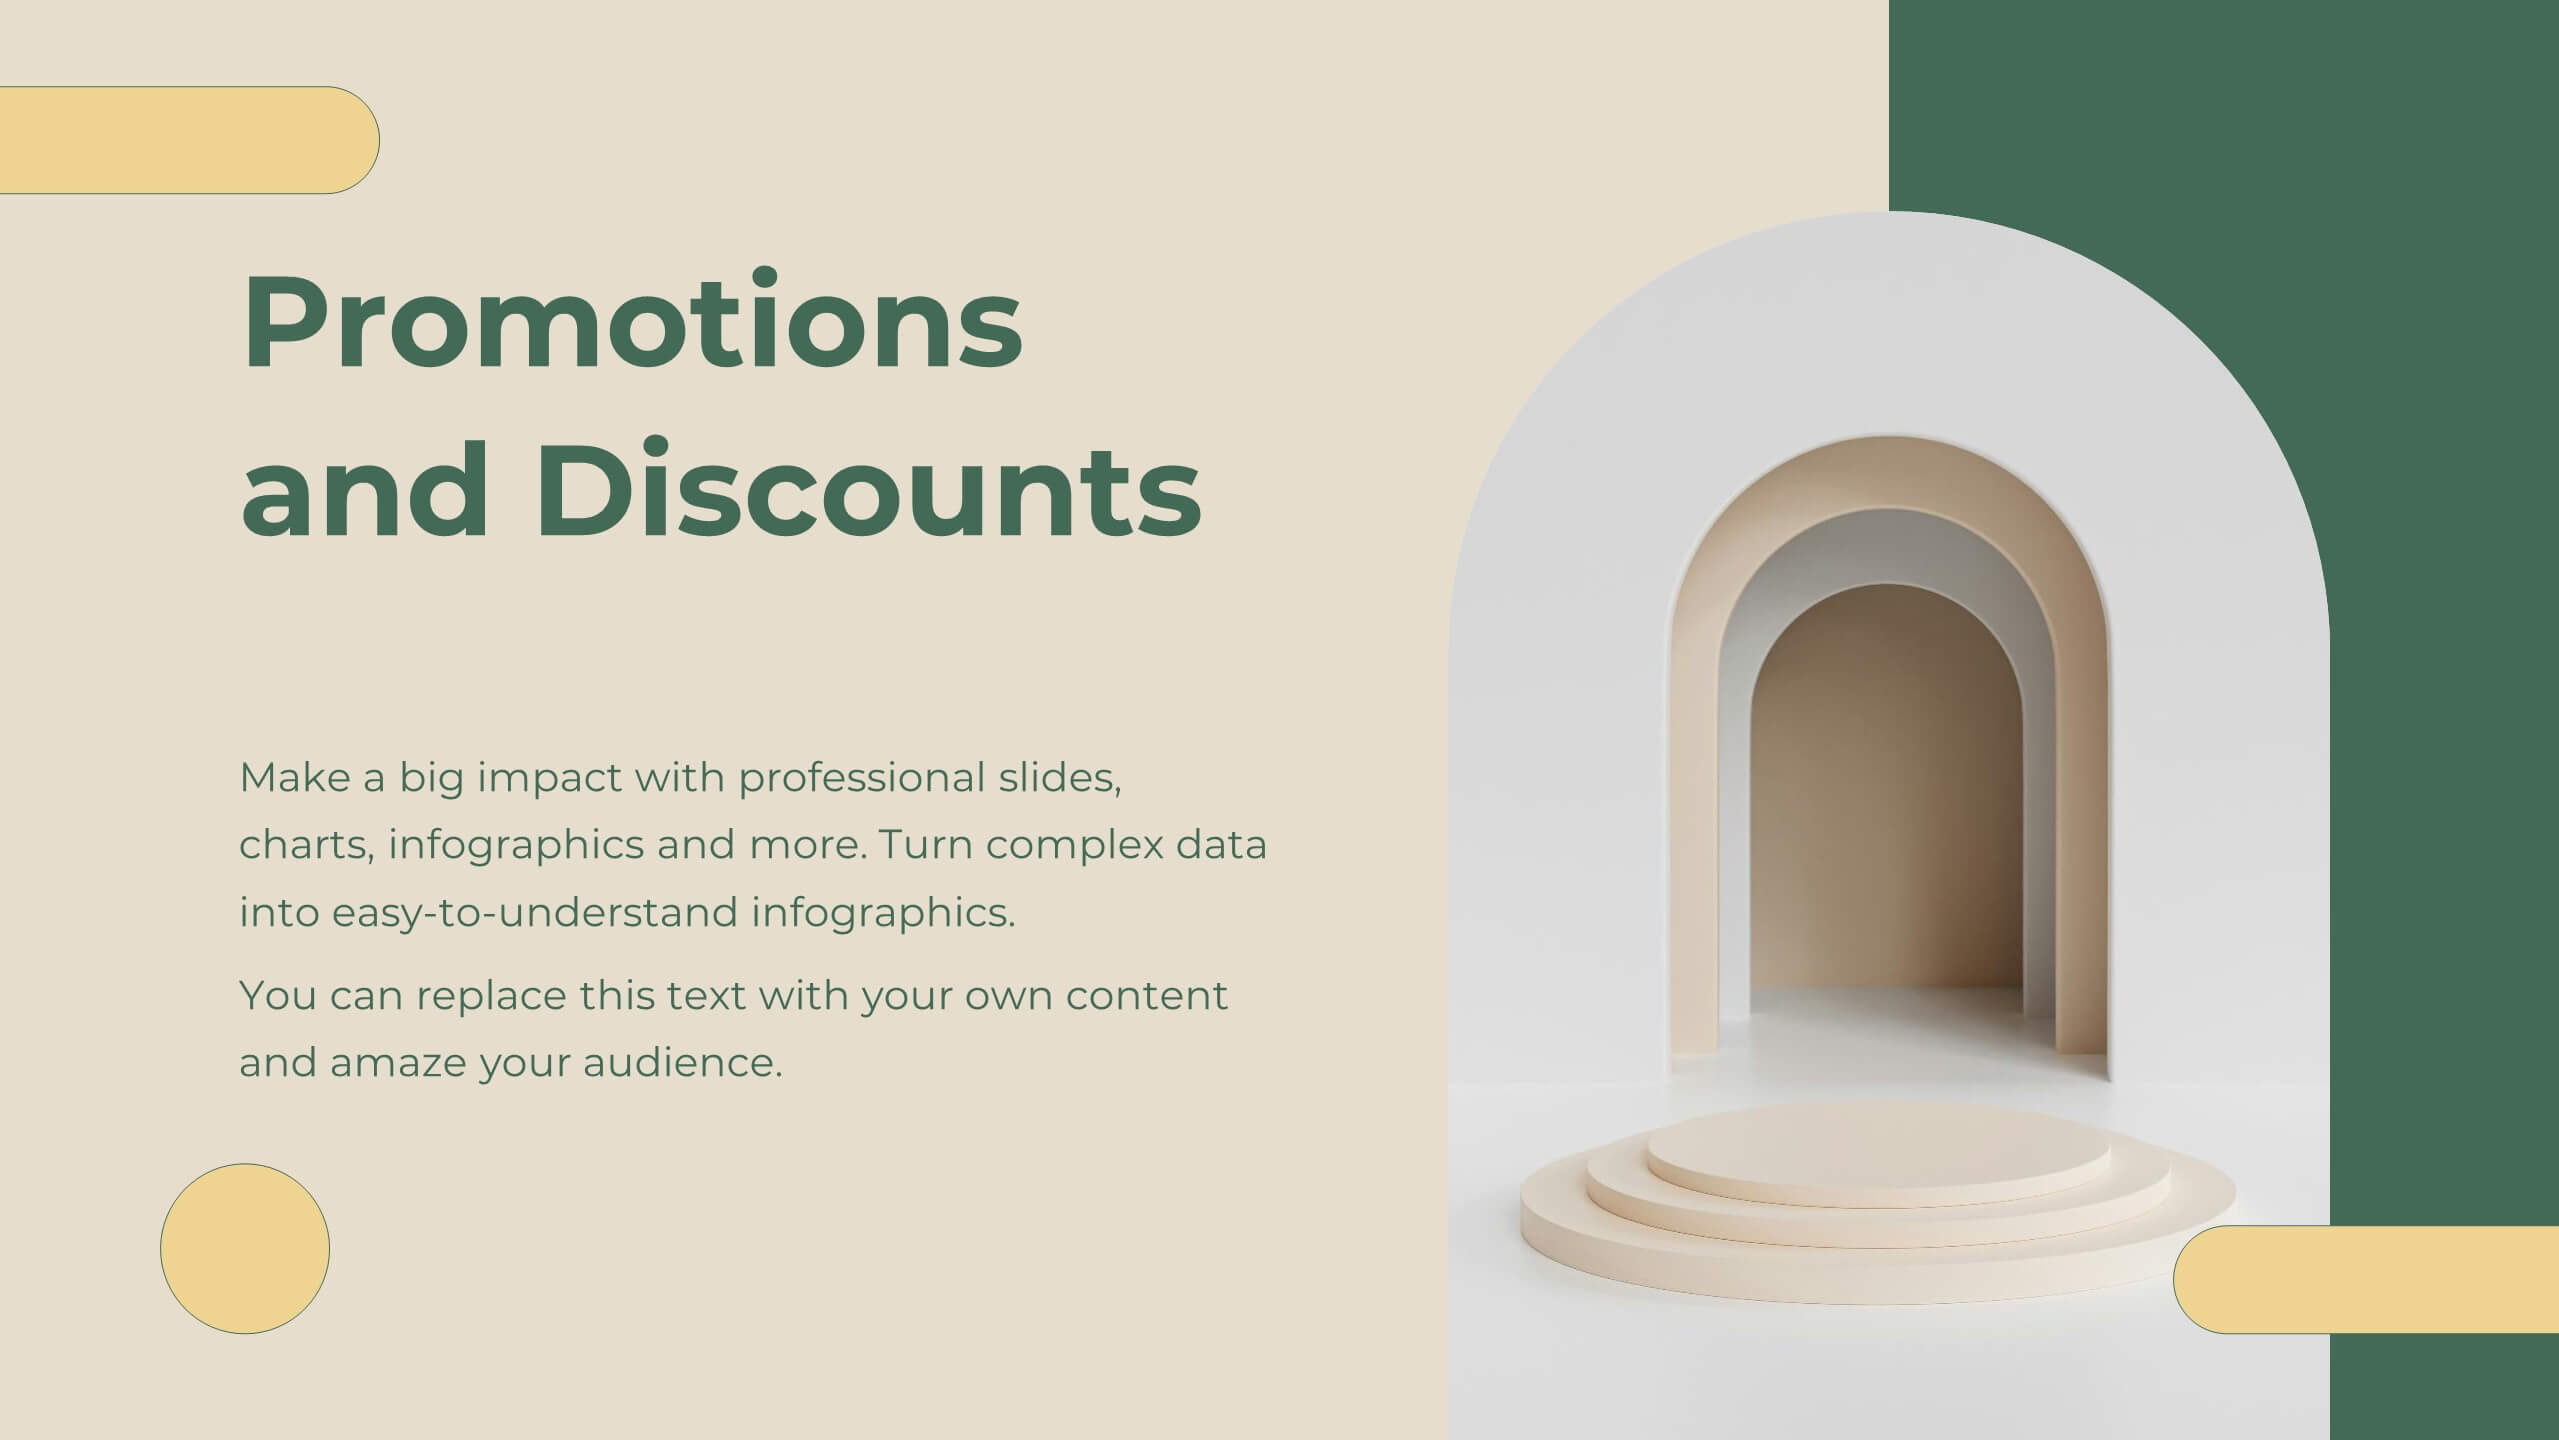
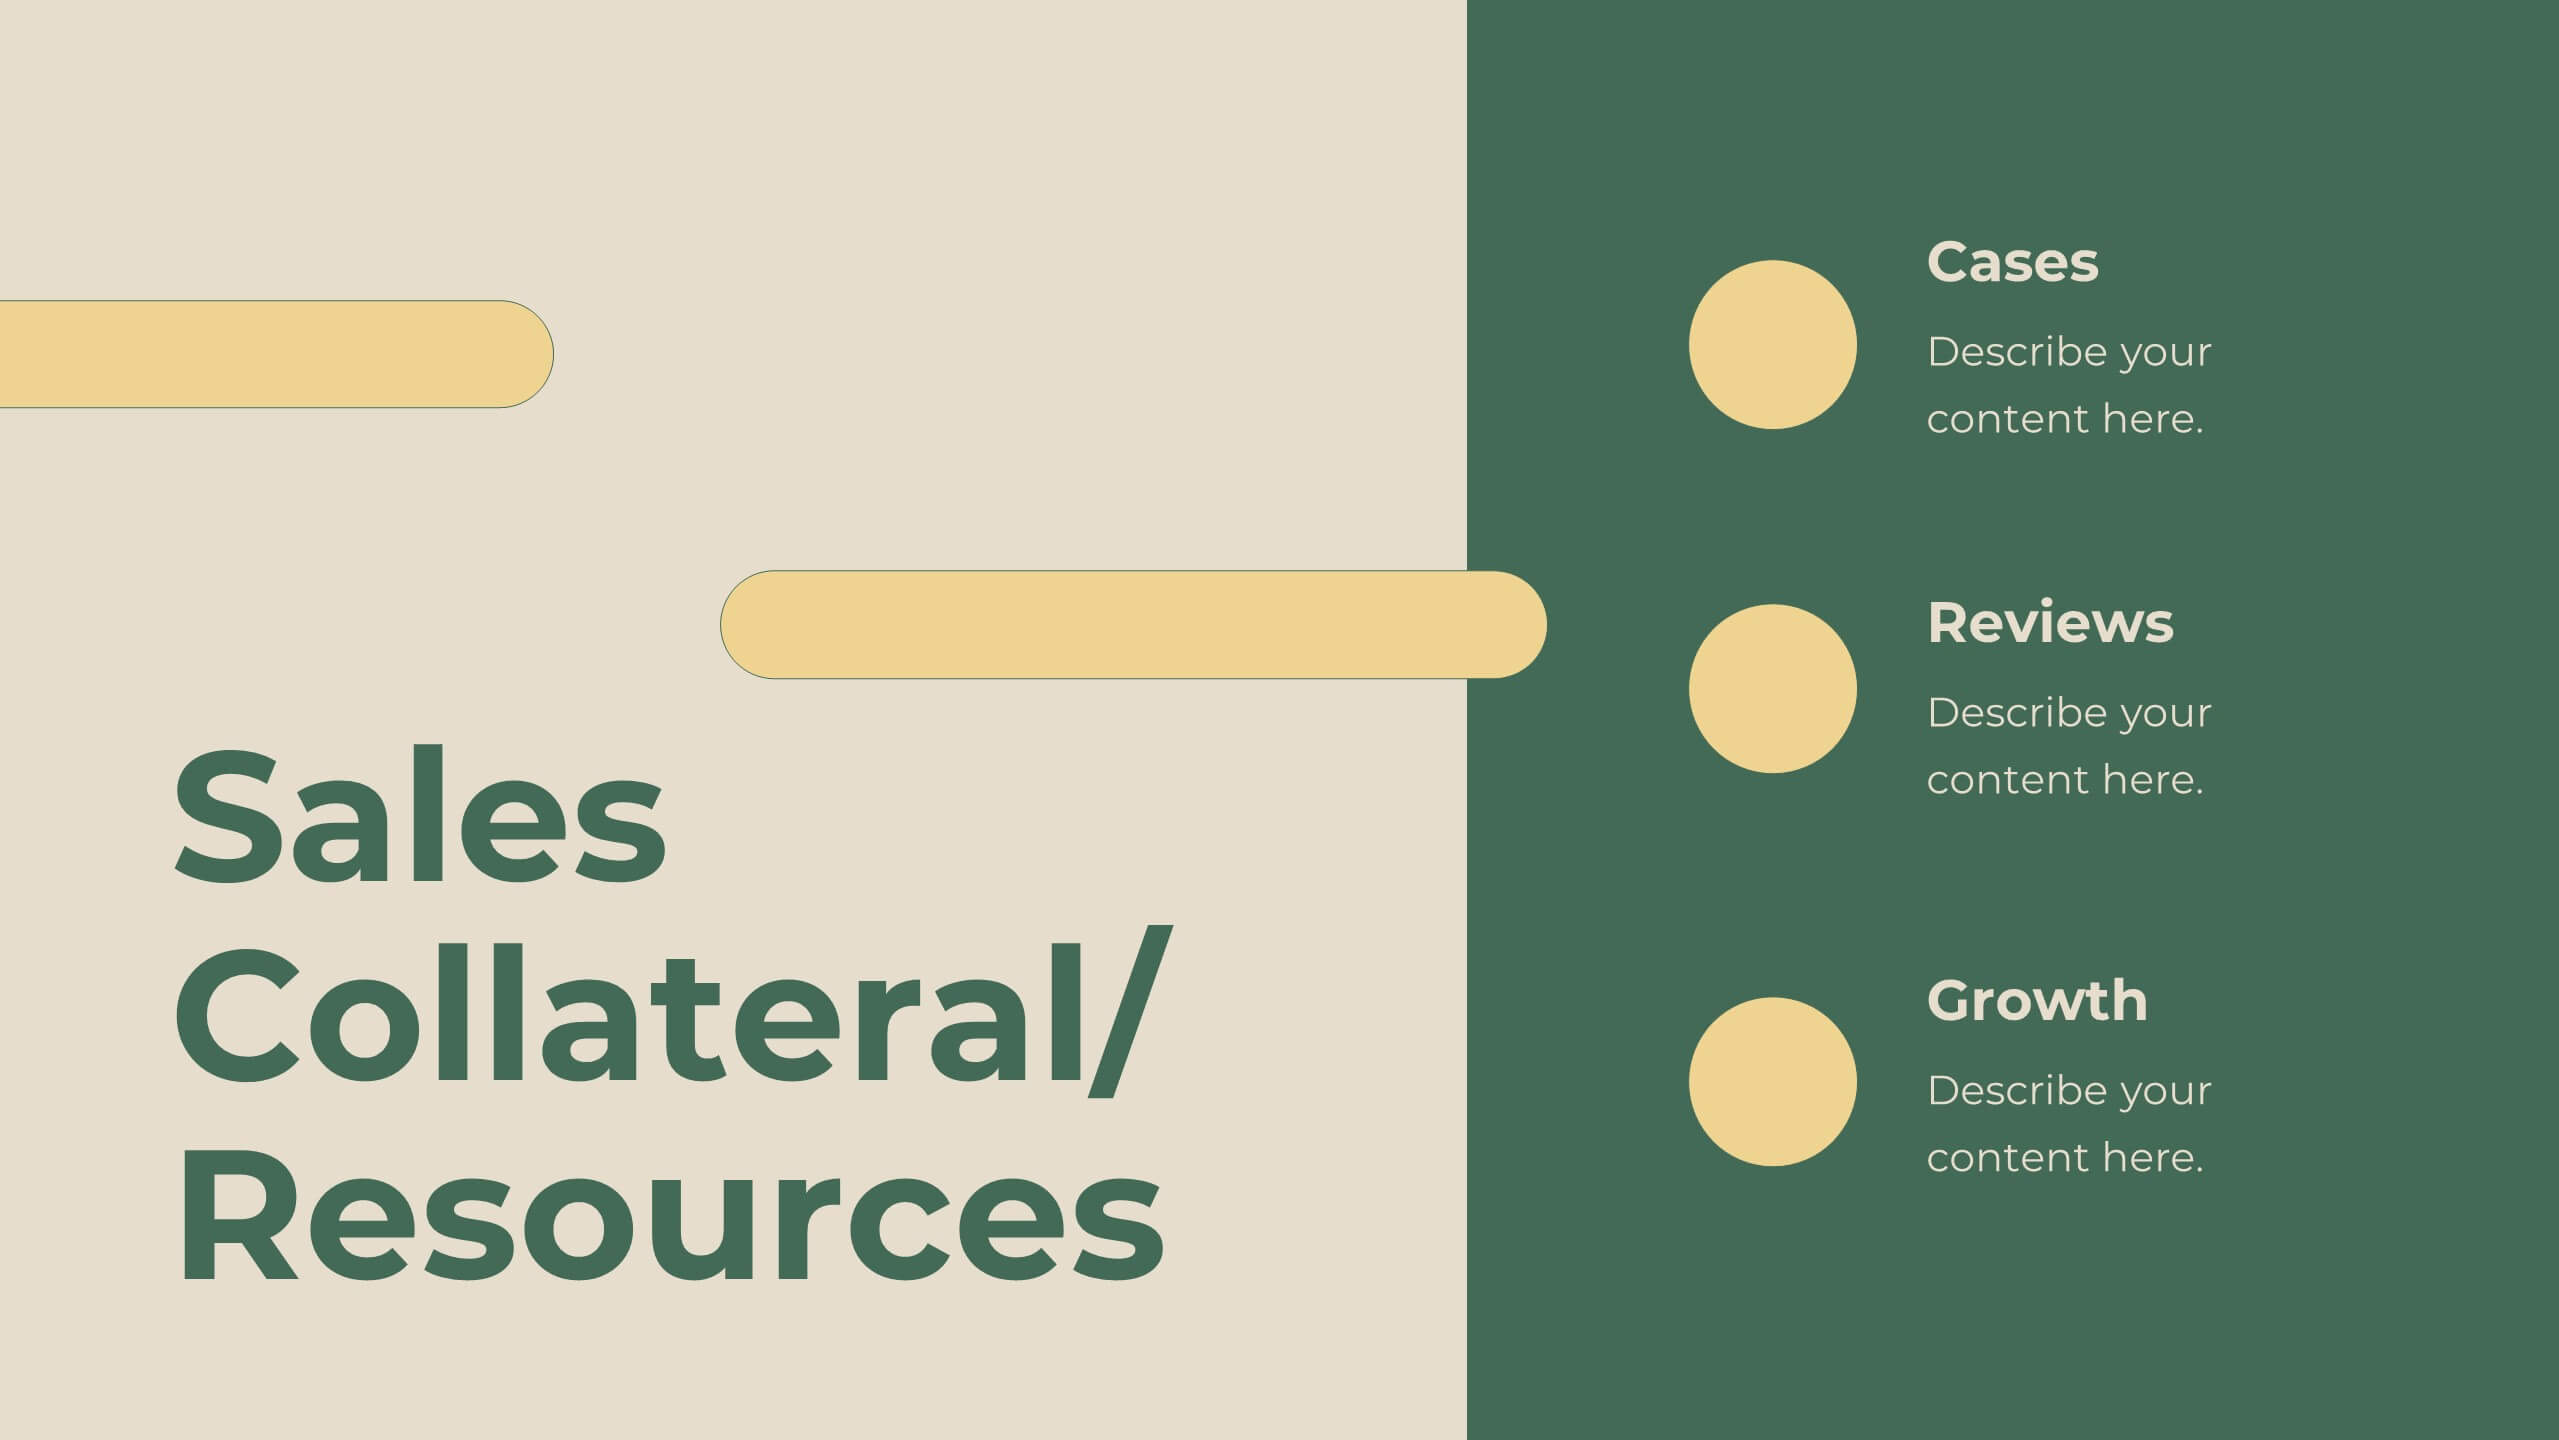
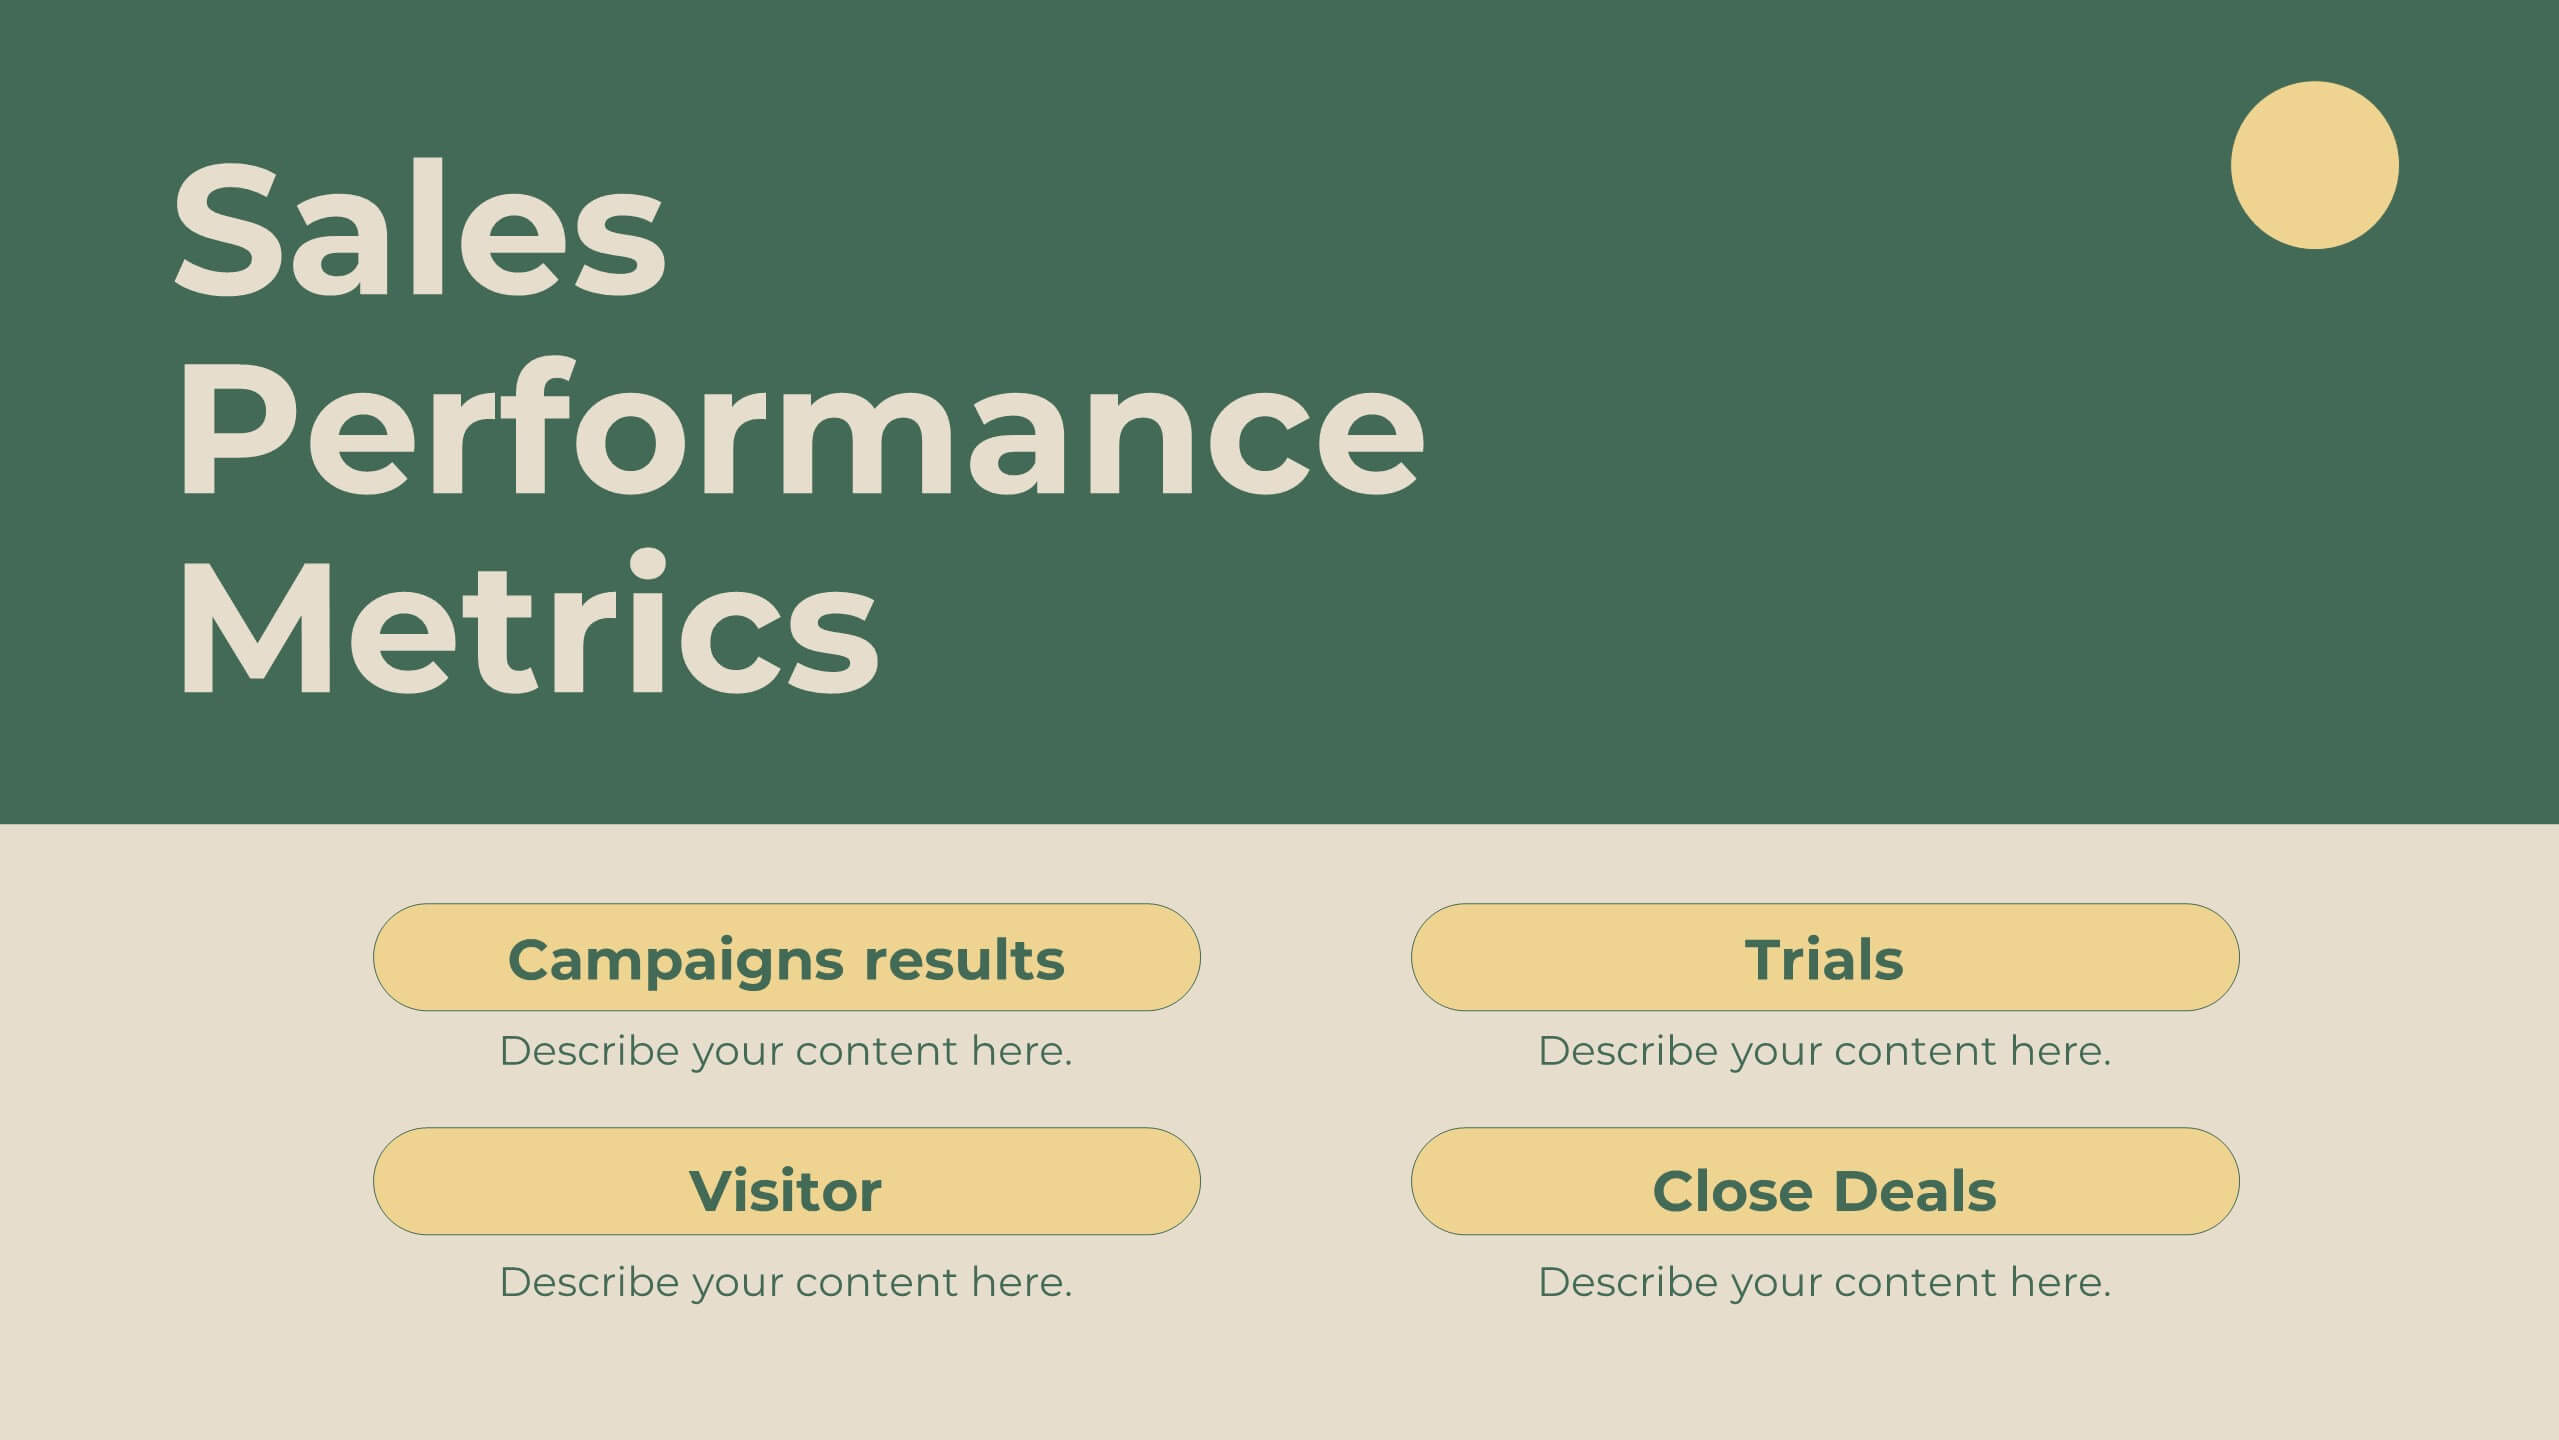
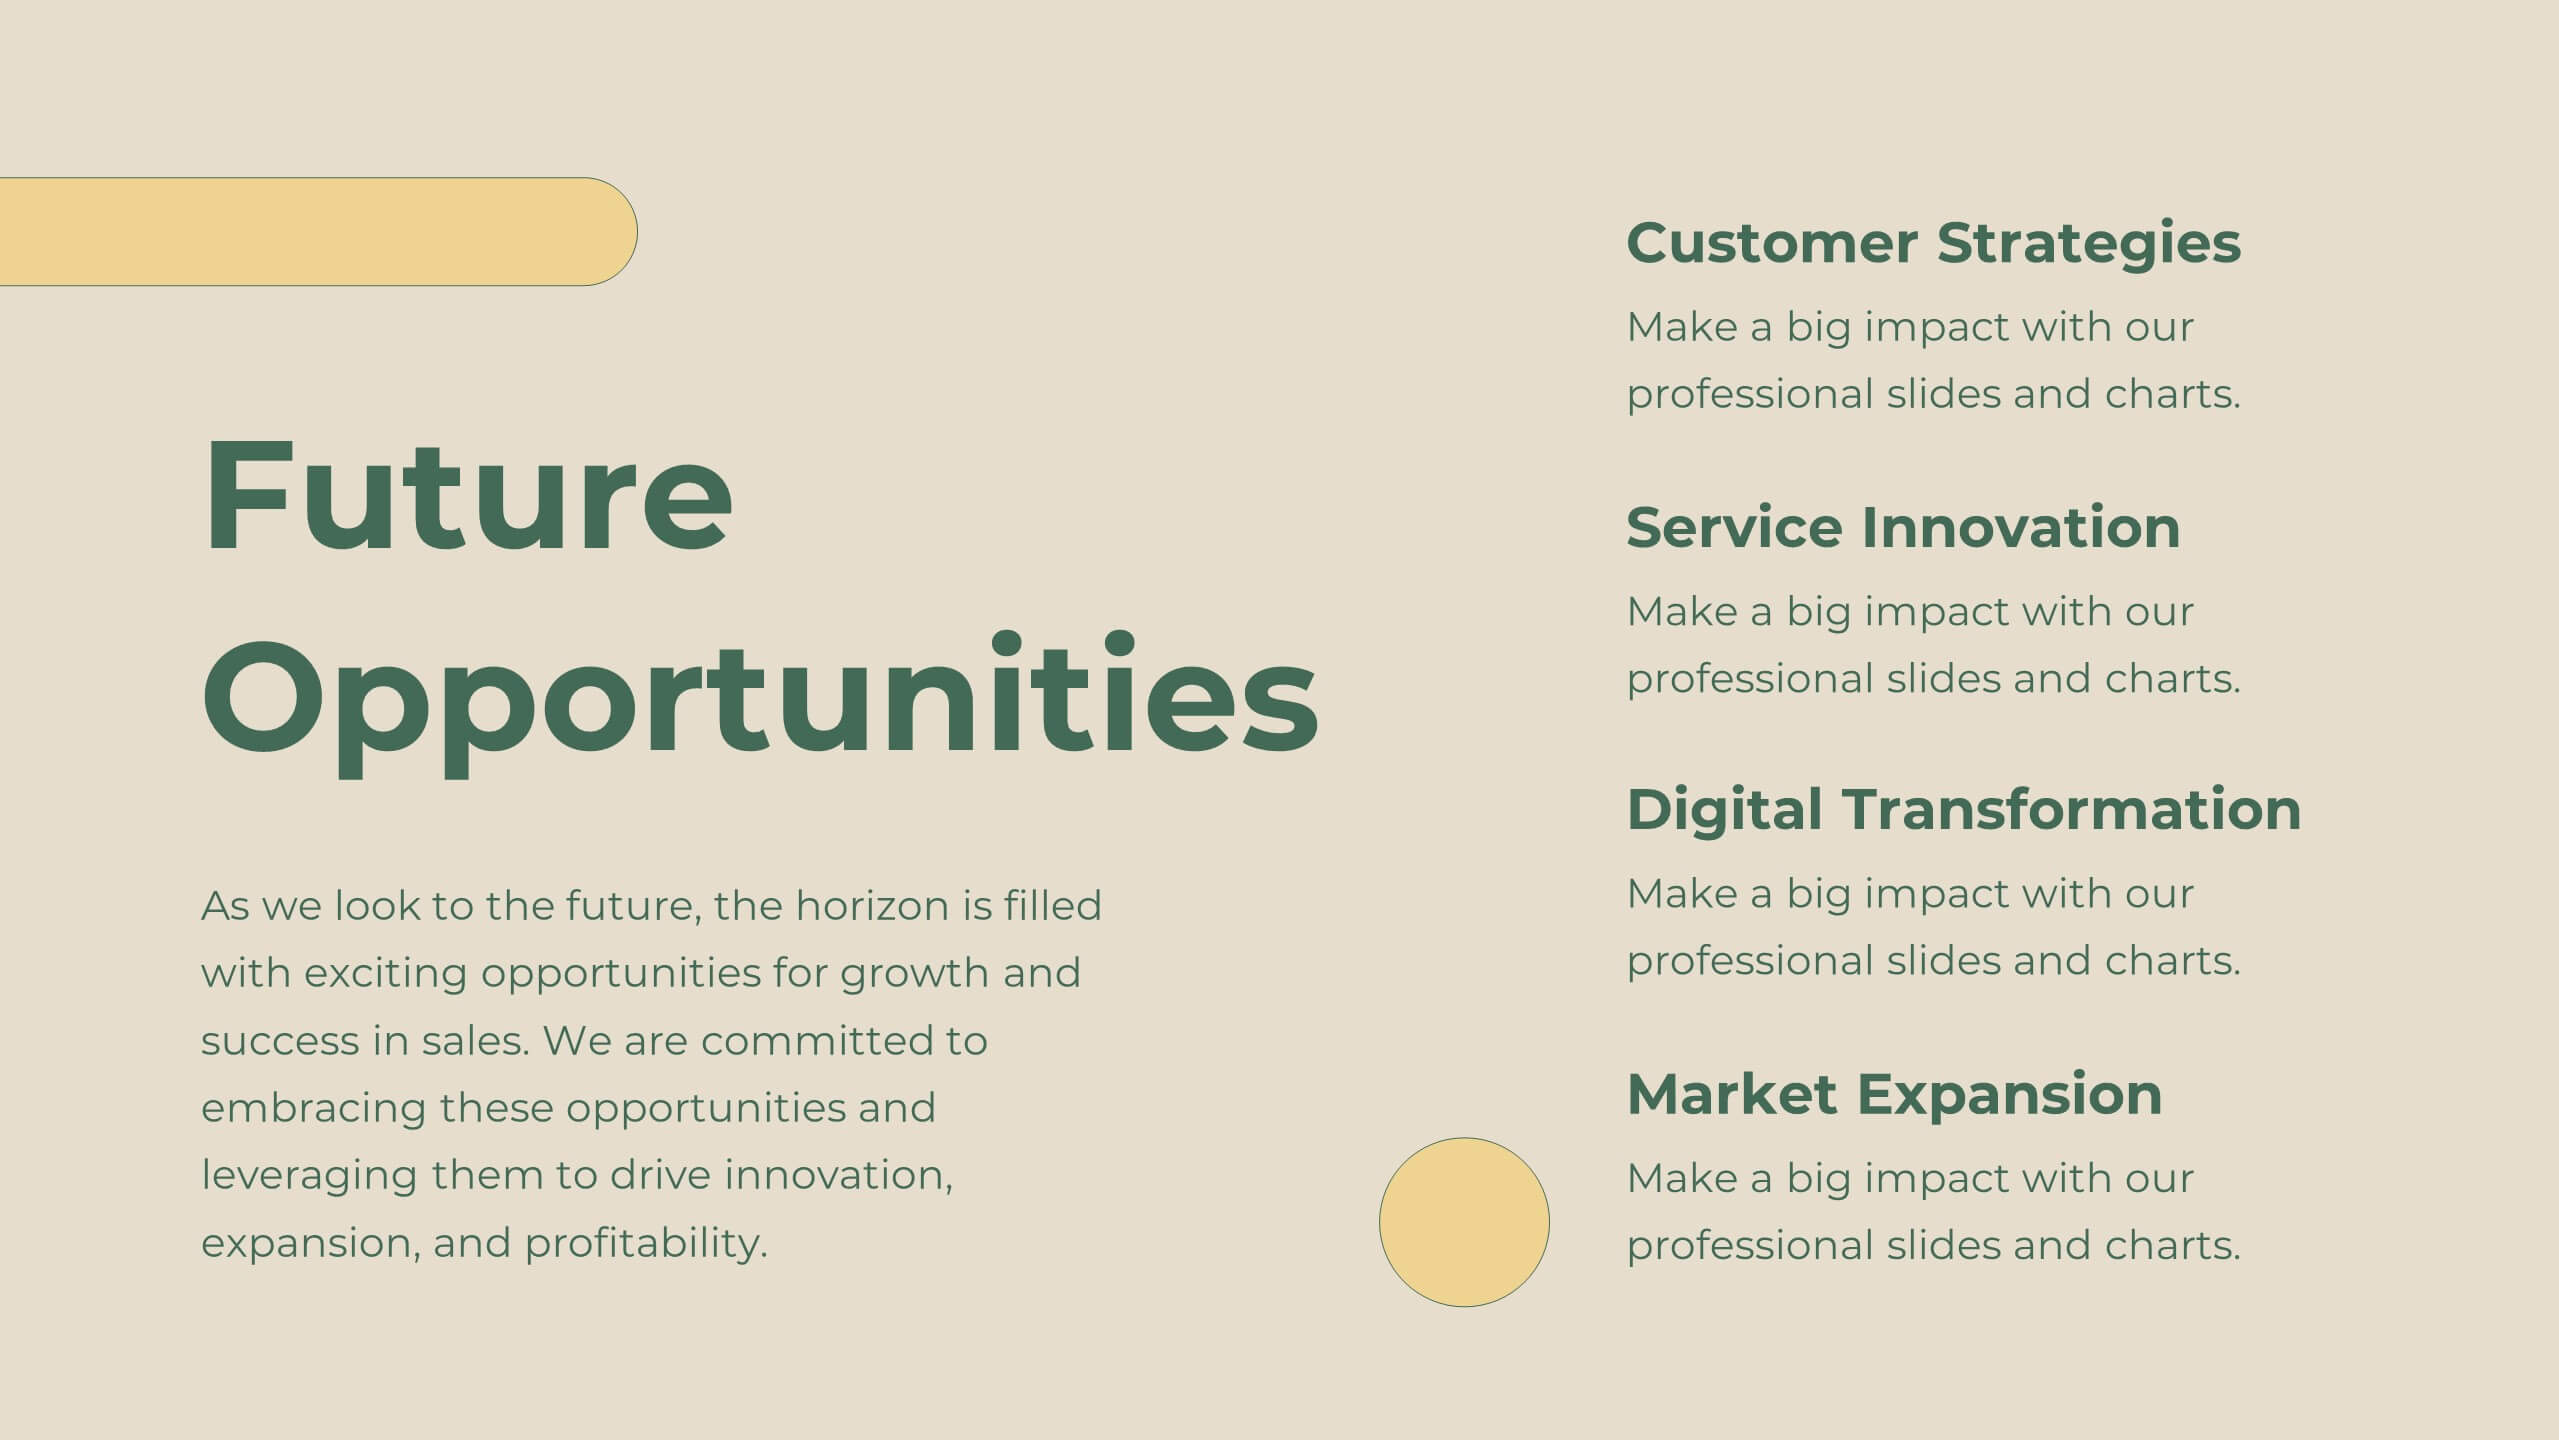
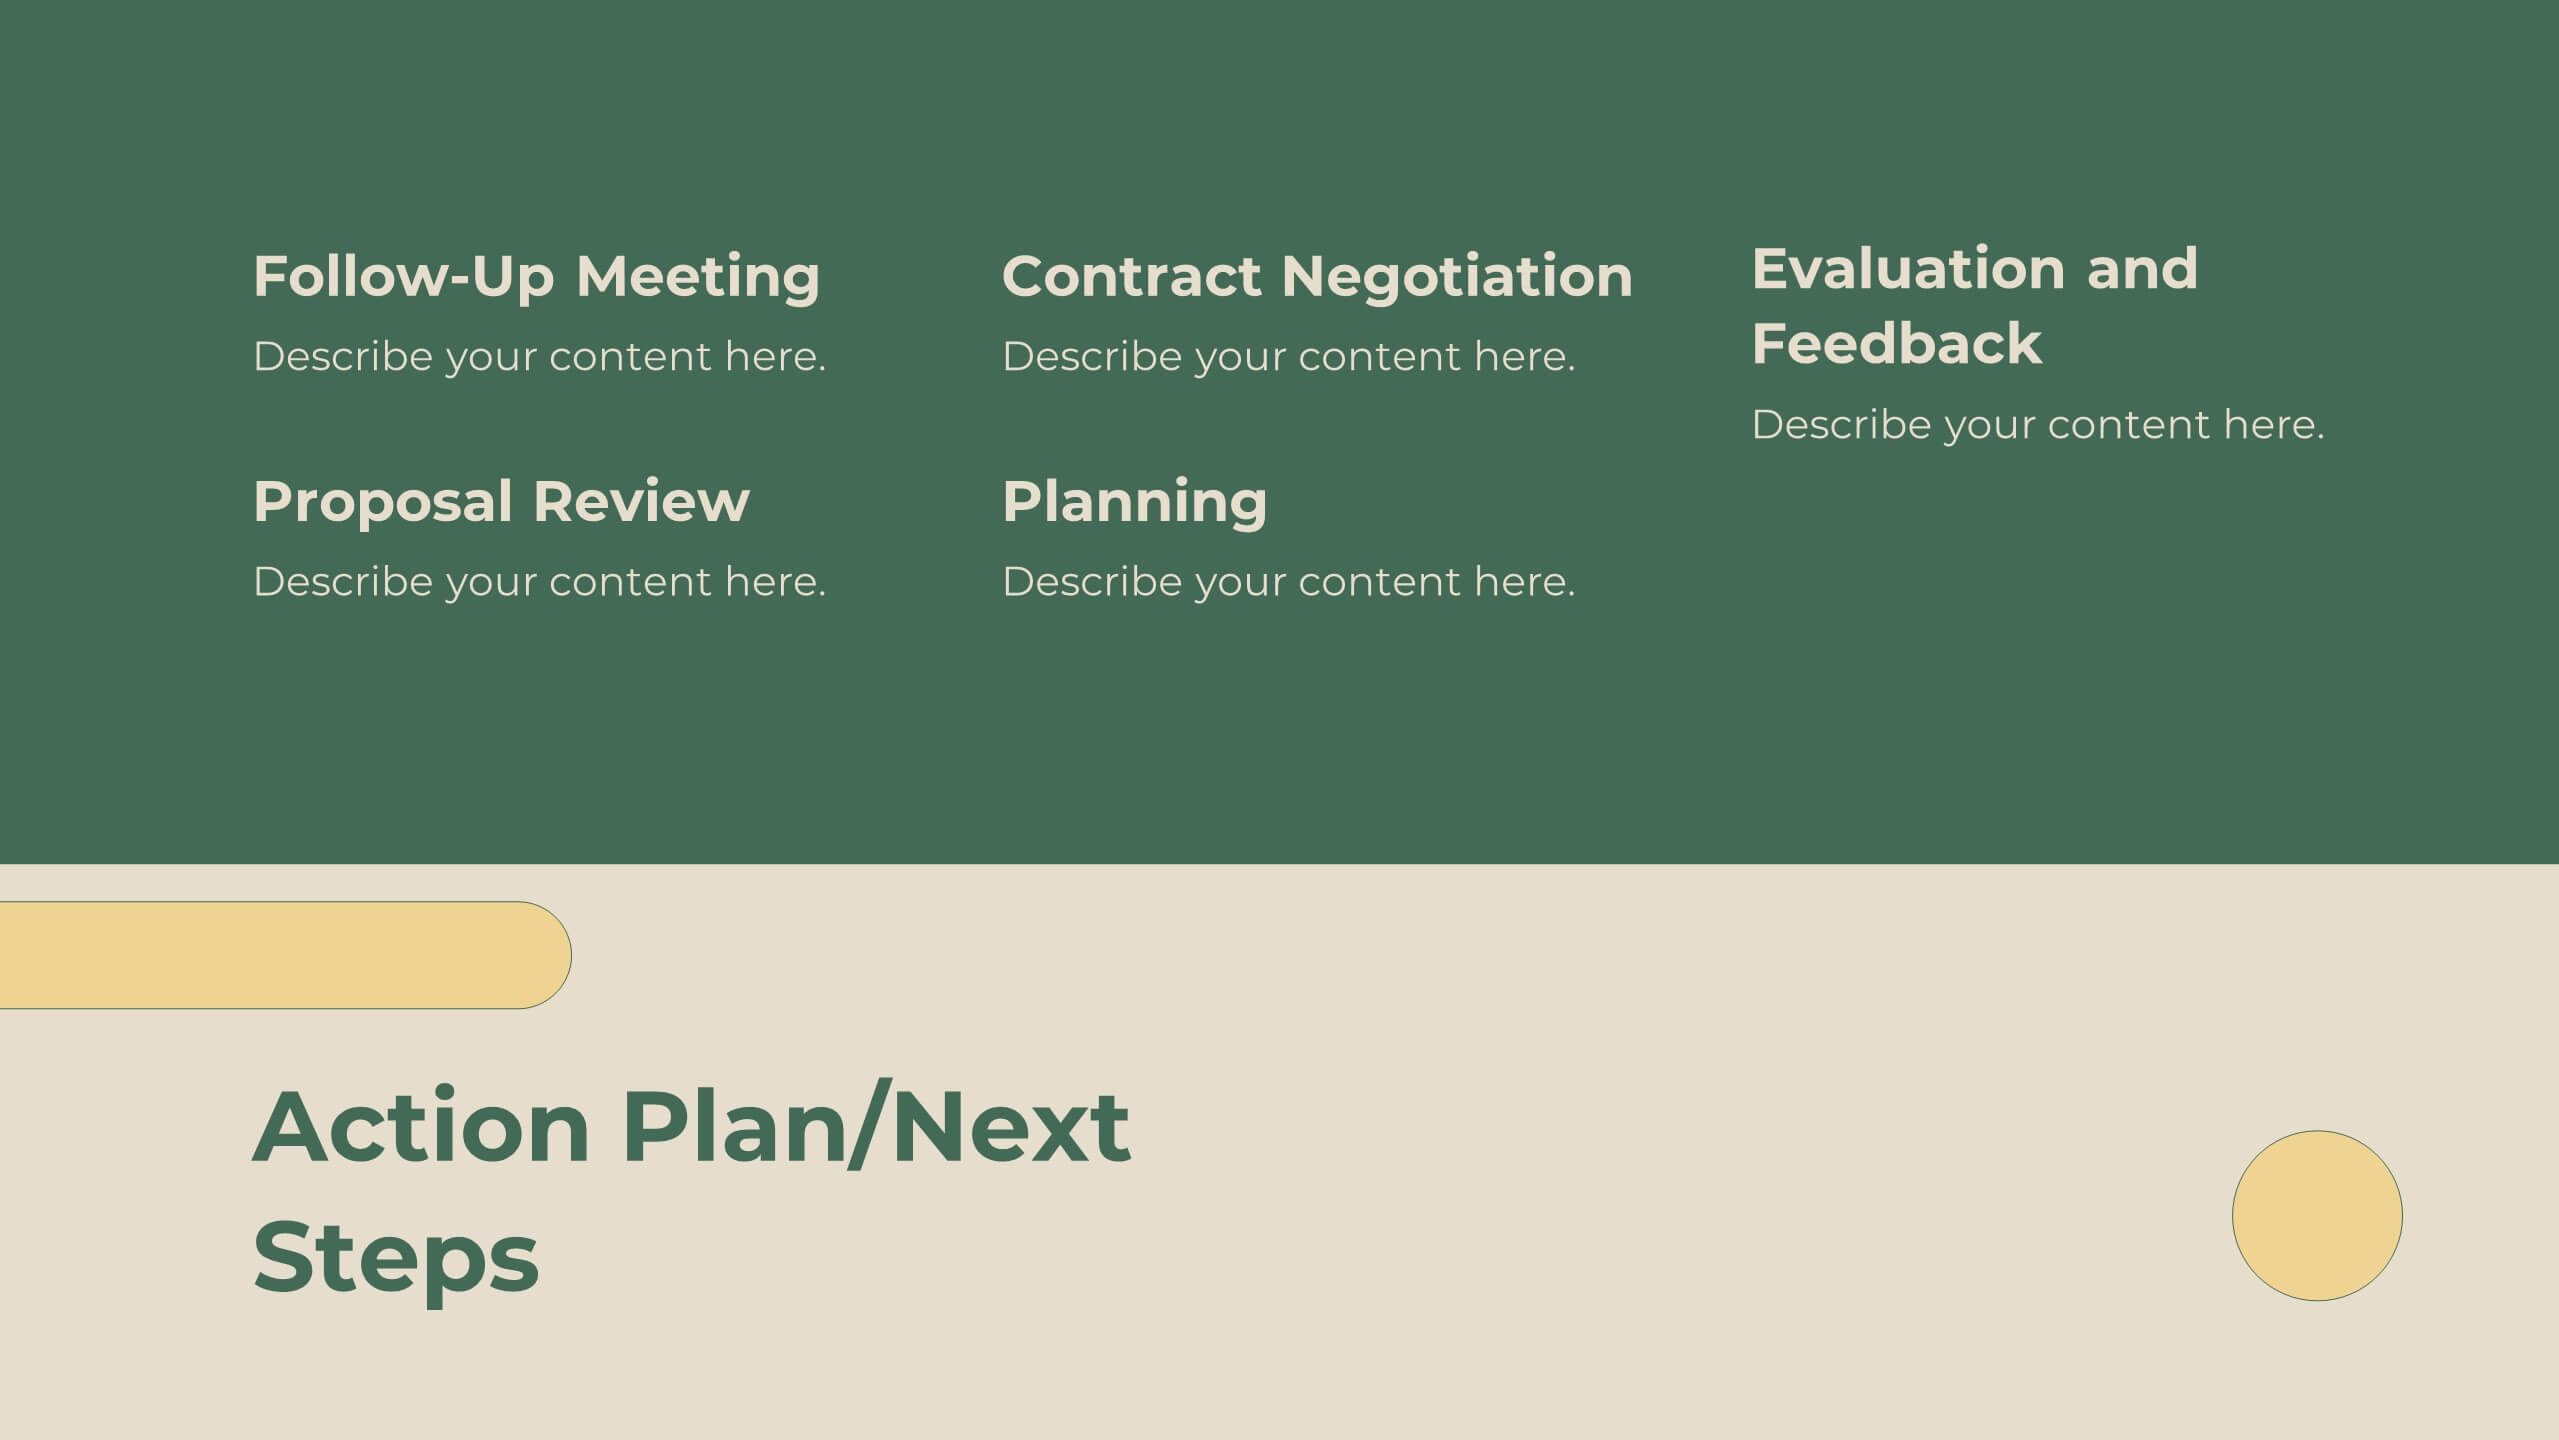
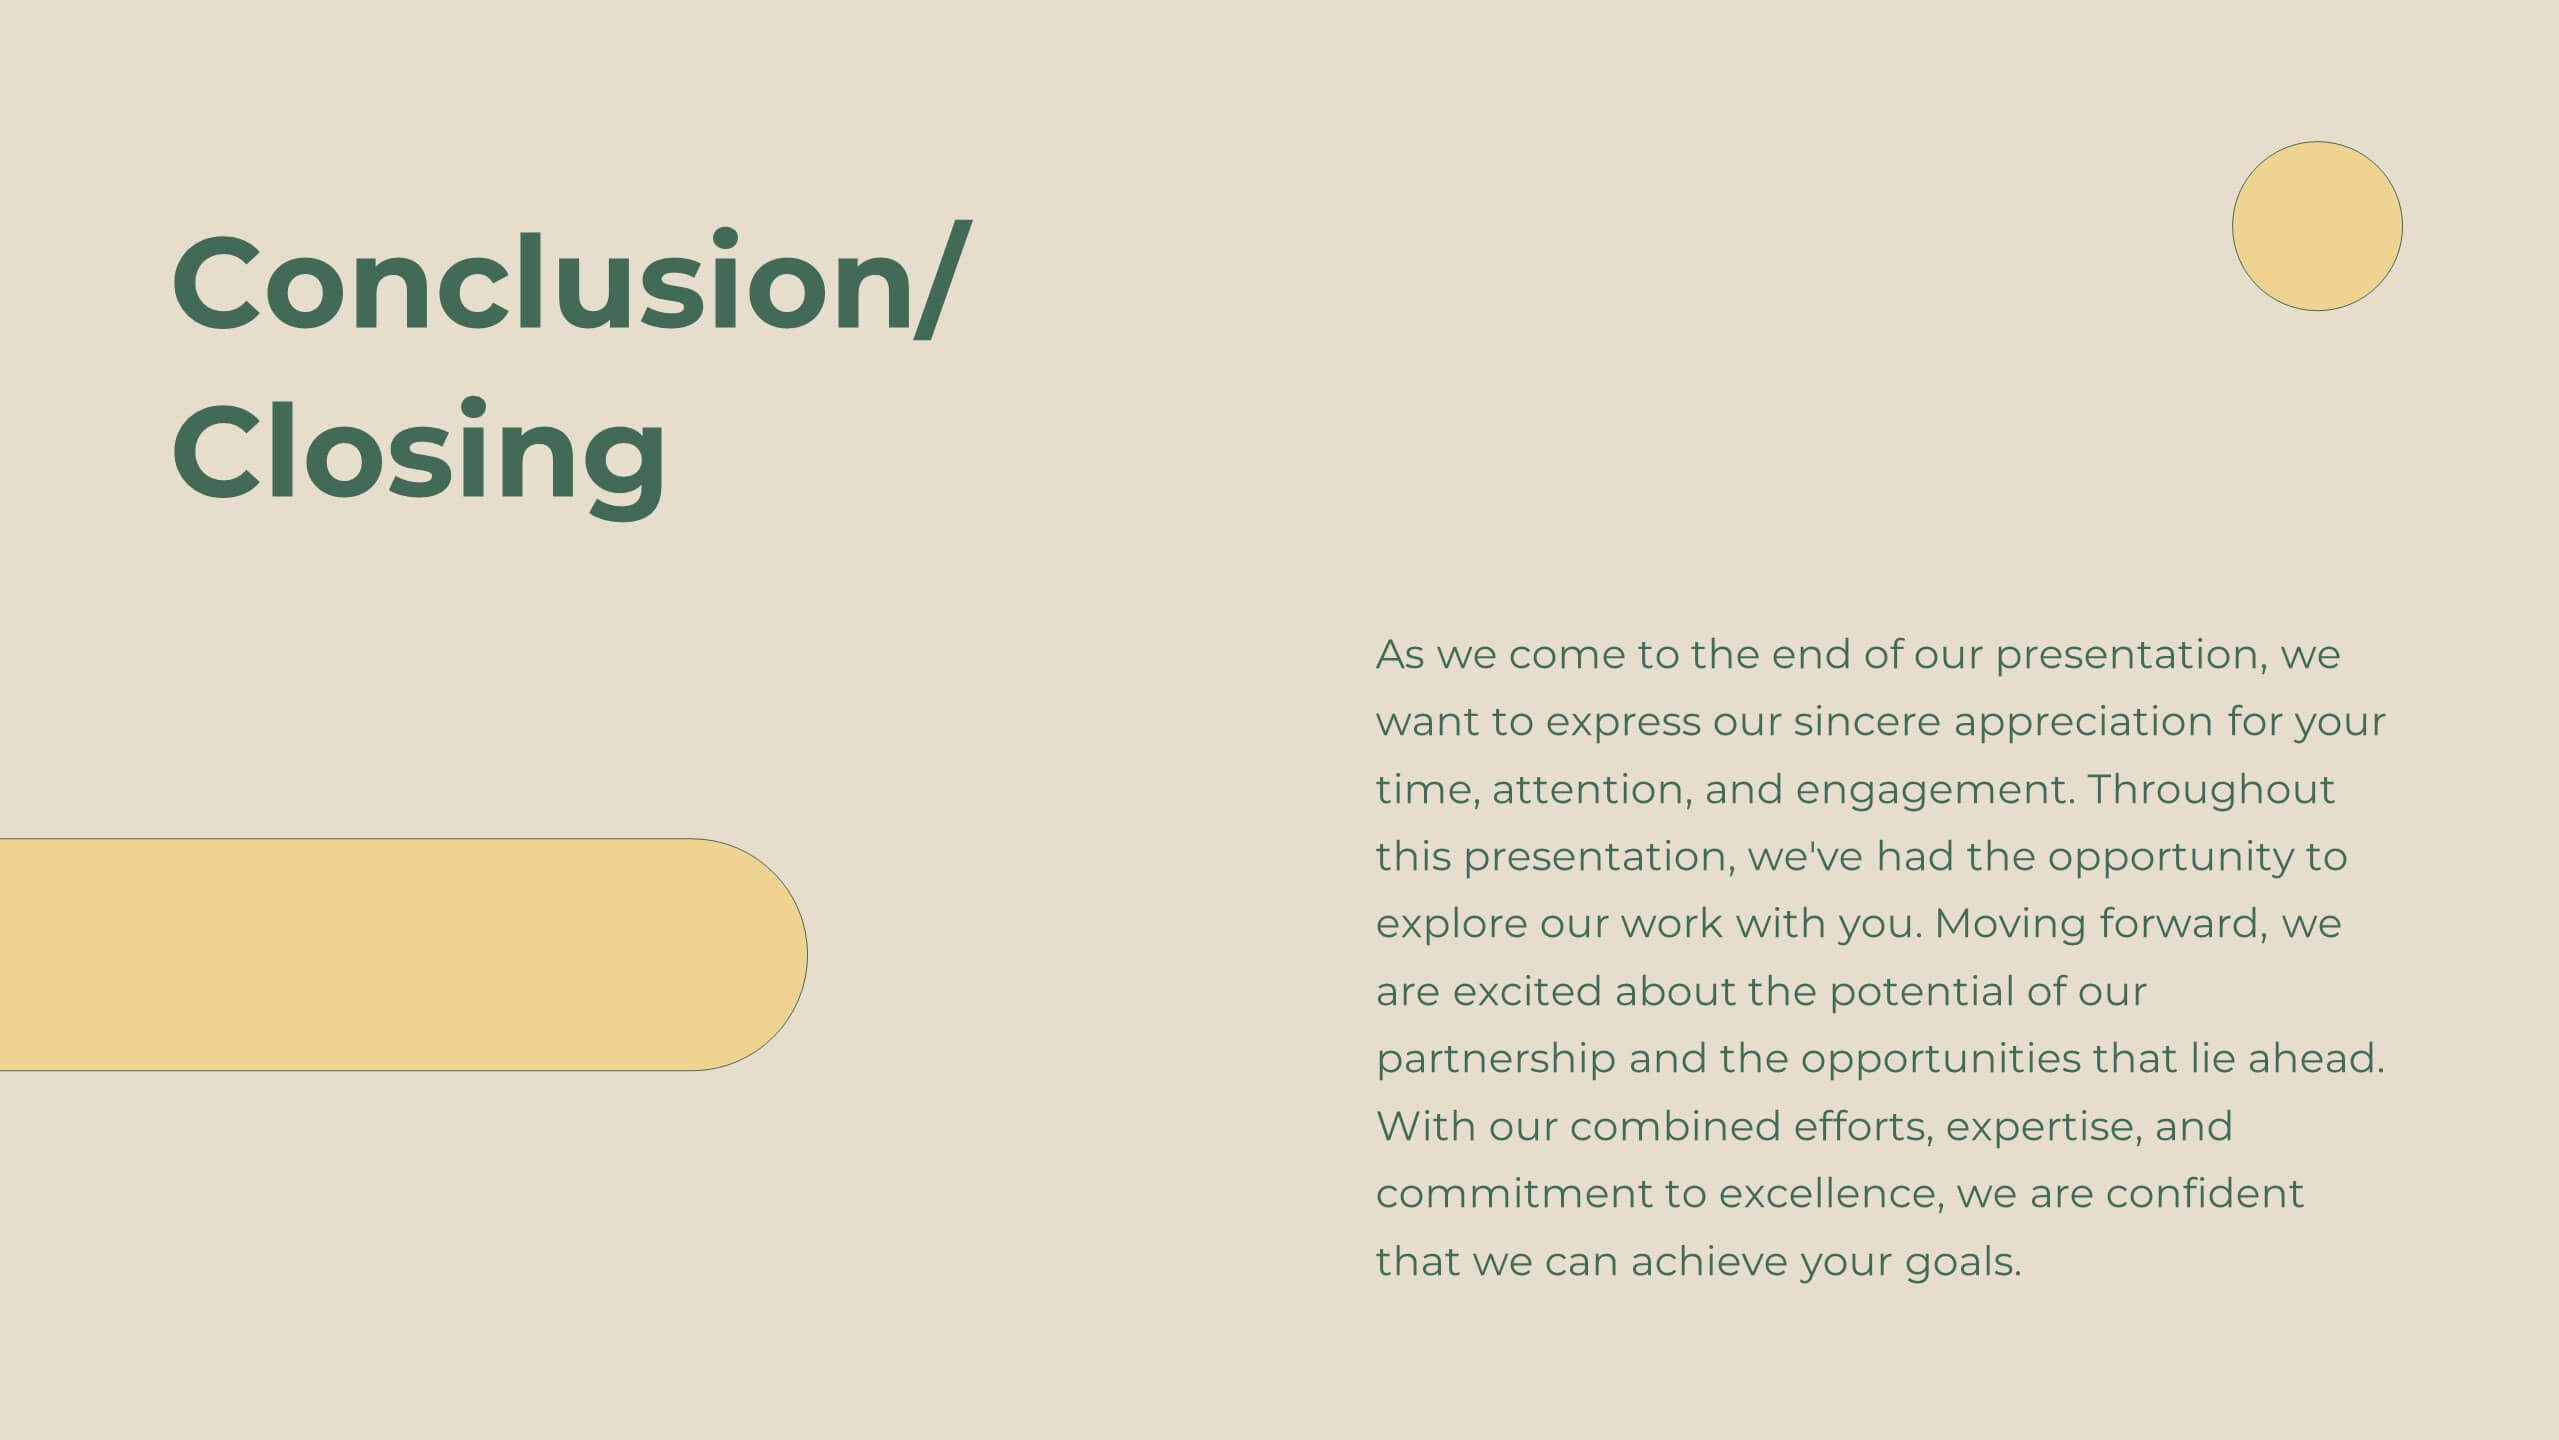
Legacy Sales Strategy Presentation
Boost your sales presentations with this modern template! It features sections for objectives, process, team introduction, customer testimonials, and performance metrics. Ideal for outlining strategies, opportunities, and pricing. Engage your audience with a professional, clean design. Compatible with PowerPoint, Keynote, and Google Slides for seamless integration. Make your sales strategy stand out!


5 diapositivas
Editable Mind Mapping Presentation
Clarify complex thoughts with the Editable Mind Mapping Presentation. This sleek template features a central profile design with five branching points to visualize ideas, processes, or strategies. It's perfect for brainstorming sessions, team collaboration, or project planning. Fully customizable and compatible with PowerPoint, Keynote, and Google Slides.


7 diapositivas
Bowtie Chart for Threat Mitigation Presentation
Visualize and mitigate threats with precision using the Bowtie Chart for Threat Mitigation Presentation. This structured layout highlights risks, controls, and consequences in a mirrored bowtie format—perfect for safety planning, compliance, and risk assessment. Fully customizable in Canva, PowerPoint, Google Slides, and Keynote for seamless integration into your workflow.


4 diapositivas
Simple and Effective Steps Presentation
Guide your audience through a seamless workflow with this "Simple and Effective Steps" template. Designed for clarity and impact, this layout breaks down processes into four distinct steps, making it ideal for project planning, decision-making, and strategy execution. Fully customizable and compatible with PowerPoint, Keynote, and Google Slides.


8 diapositivas
Business Data Analytics Dashboard
Monitor performance with clarity using this Business Data Analytics Dashboard. Featuring data bars, numeric highlights, and color-coded insights, this slide is perfect for quarterly updates, data reviews, or executive summaries. Clean and professional, it's fully editable in PowerPoint, Keynote, and Google Slides.


26 diapositivas
Transportation and Logistics Company Profile Presentation
Delve into the fast-paced realm of Transportation and Logistics, the backbone of global commerce. Our vibrant template captures this essence with a lively mix of yellow, blue, orange, and purple. Precision-crafted, it comes alive with industry-specific graphics, adaptable icons, and purpose-built image placeholders. Seamless compatibility ensures smooth sailing whether you're on Powerpoint, Keynote, or Google Slides. Tailored for businesses, it's the go-to choice for presenting company profiles within the transportation sector. Don't just inform; captivate and inspire your audience. Elevate your presentation game today!


6 diapositivas
Timeline Planning with Gantt Layout Presentation
Organize your schedules clearly with this Timeline Planning with Gantt Layout presentation. Designed for efficient project tracking, this template breaks down tasks across phases and months, using a clean horizontal bar layout. Perfect for teams, planners, and managers. Fully editable in Canva, PowerPoint, and Google Slides to suit any workflow.


7 diapositivas
RAPID Matrix Infographic Presentation Template
RAPID stands for Recommend, Agree, Perform, Input and Decide. The RAPID Matrix is a popular tool used to determine project planning and decision-making responsibilities. It helps ensure that the right people are involved at the right time, with the right knowledge and skills. This template makes it easy for anyone to efficiently take notes. Use it to share information on your company, business plan or vision, or for a brainstorming session with your team. Take your presentation to the next level with this easy-to-personalize template and eye catching infographic with tips for using it.


6 diapositivas
App Design Mockup
Showcase your app UI in a bold, creative way with this vibrant slide layout. Featuring dynamic smartphone mockups and modern graphic accents, it's ideal for app demos, portfolio highlights, or feature walkthroughs. Fully editable in PowerPoint, Keynote, and Google Slides—customize fonts, colors, and layouts to suit your brand.


6 diapositivas
Cryptocurrency Analysis Infographics
Analyze cryptocurrency effectively with our Cryptocurrency Analysis infographic template. This template is fully compatible with popular presentation software like PowerPoint, Keynote, and Google Slides, allowing you to easily customize it to illustrate and communicate various aspects of cryptocurrency analysis. The Cryptocurrency Analysis infographic template offers a visually engaging platform to explore and explain the key elements of analyzing cryptocurrencies, including market trends, technical analysis, fundamental analysis, and investment strategies. Whether you're a cryptocurrency enthusiast, trader, or investor, this template provides a user-friendly canvas to create informative presentations and educational materials. Enhance your cryptocurrency knowledge and analysis skills with this SEO-optimized Cryptocurrency Analysis infographic template, thoughtfully designed for clarity and ease of use. Customize it to showcase cryptocurrency charts, indicators, risk management techniques, and insights into the volatile world of digital assets, ensuring that your audience gains valuable insights into this evolving field. Start crafting your personalized infographic today to become a more proficient cryptocurrency analyst.


6 diapositivas
Business People Services Infographic
"Business People Services" refers to a range of professional services and solutions offered to individuals and organizations to help them succeed in the business world. This infographic template is a visual representation of various services tailored to meet the needs of business professionals. This template aims to provide a quick overview of these services and their benefits. The purpose of this infographic is to convey important information in an engaging format. Use concise text, relevant visuals, and a logical structure to make it easy for business professionals to understand and benefit from your data presented.