


Características


¿Tienes alguna pregunta?
Recomendar


8 diapositivas
Product Development and Innovation
Break down your product journey with this modern step-by-step infographic. Ideal for startups, product managers, and innovation teams, this slide illustrates four stages—perfect for visualizing design thinking, MVP rollouts, or feature planning. Easily editable in PowerPoint, Keynote, and Google Slides.


22 diapositivas
Simple Pitch Deck Presentation
Streamline your pitch process with this no-frills Pitch Deck template, designed for clear communication and powerful impact. From the get-go, the cover slide clearly announces your purpose, inviting audiences into your business narrative. The template smoothly transitions from one slide to the next, each one a stepping stone in building your case — from problem to solution. It includes a neatly organized table of contents, thought-provoking mission and vision statements, and data-rich slides for a deep dive into your business metrics. Each section, marked with bold, numbered headers, keeps your presentation on track and your audience engaged. A final 'Thank You' slide adds a touch of professionalism, and the credits section ensures that your sources are transparently acknowledged. This pitch deck is ideal for startups and businesses looking to capture attention and convey their story succinctly.


7 diapositivas
Organizational Analysis McKinsey 7S Presentation
Explore the core of organizational alignment with our McKinsey 7S Model presentation template. Perfectly crafted for analyzing and optimizing business structures, this template guides you through the seven essential elements: Strategy, Structure, Systems, Shared Values, Skills, Staff, and Style. Its intuitive design ensures effective communication and clarity in your presentations. Optimized for PowerPoint, Keynote, and Google Slides, it's an invaluable tool for consultants and business strategists aiming to enhance internal coherence and performance.


7 diapositivas
Company Profile Infographic
This collection of company profile templates is designed to meet the diverse needs of various businesses, providing an efficient and polished method for presenting a company's identity, accomplishments, and offerings. Each template is meticulously crafted to cater to different professional contexts, making them suitable for annual reports, investment summaries, or internal briefings. Structured for clarity, these templates enable businesses to effectively communicate essential details such as company history, objectives, and the breadth of services or products offered. They are also equipped to showcase crucial statistics like employee numbers, significant achievements, and organizational hierarchy, enhancing the overall presentation. The design blends modern aesthetics with functionality, incorporating a professional color palette and clean layout that holds viewer interest and enhances readability. Customization is straightforward, allowing for easy adjustments in colors, fonts, and design elements to align with specific brand identities. Ideal for corporations looking to convey their market stance and engage potential clients, investors, or prospective employees, these templates serve as a vital tool in creating impactful and informative company profiles.


21 diapositivas
Terraflare Project Status Report Presentation
Keep stakeholders updated with this comprehensive project status report template, featuring agenda, key highlights, performance metrics, project progress, risk assessments, and goals. Easily track progress, strategic initiatives, and team productivity. Perfect for PowerPoint, Keynote, and Google Slides, ensuring clear communication of project updates and priorities.


8 diapositivas
Sustainable Operation & Ethical Practice Presentation
Illustrate your ethical initiatives and operational sustainability with this water drop flow diagram. Ideal for outlining four key actions or principles, it features a faucet visual and icon-based content drops. Fully customizable in PowerPoint, Keynote, and Google Slides—perfect for ESG reporting, CSR updates, and eco-conscious business presentations.

23 diapositivas
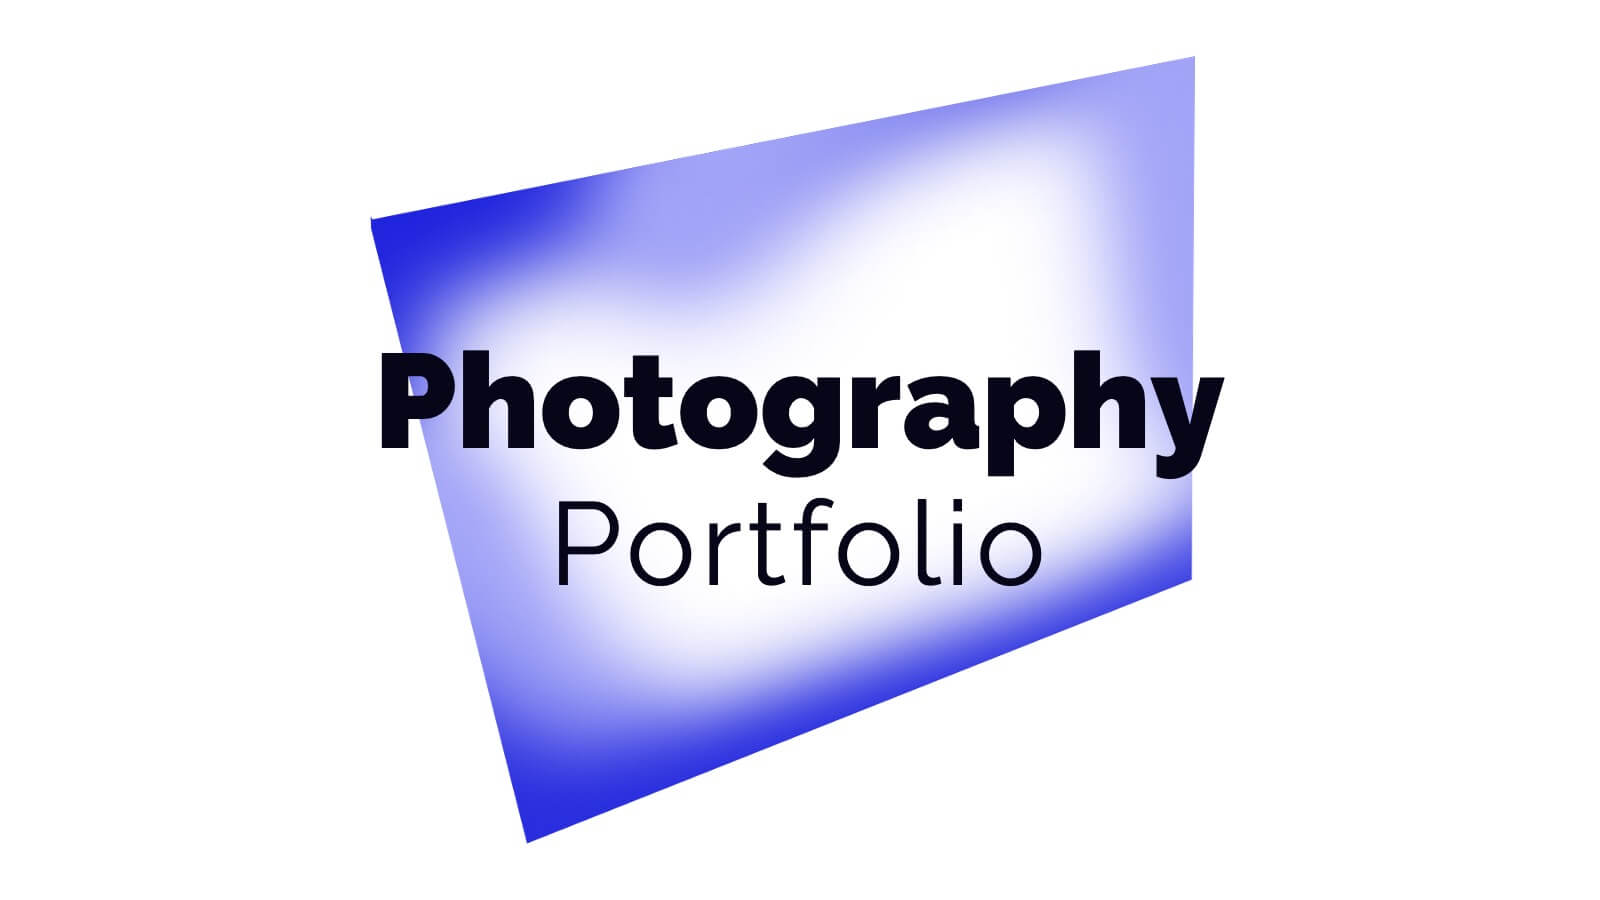
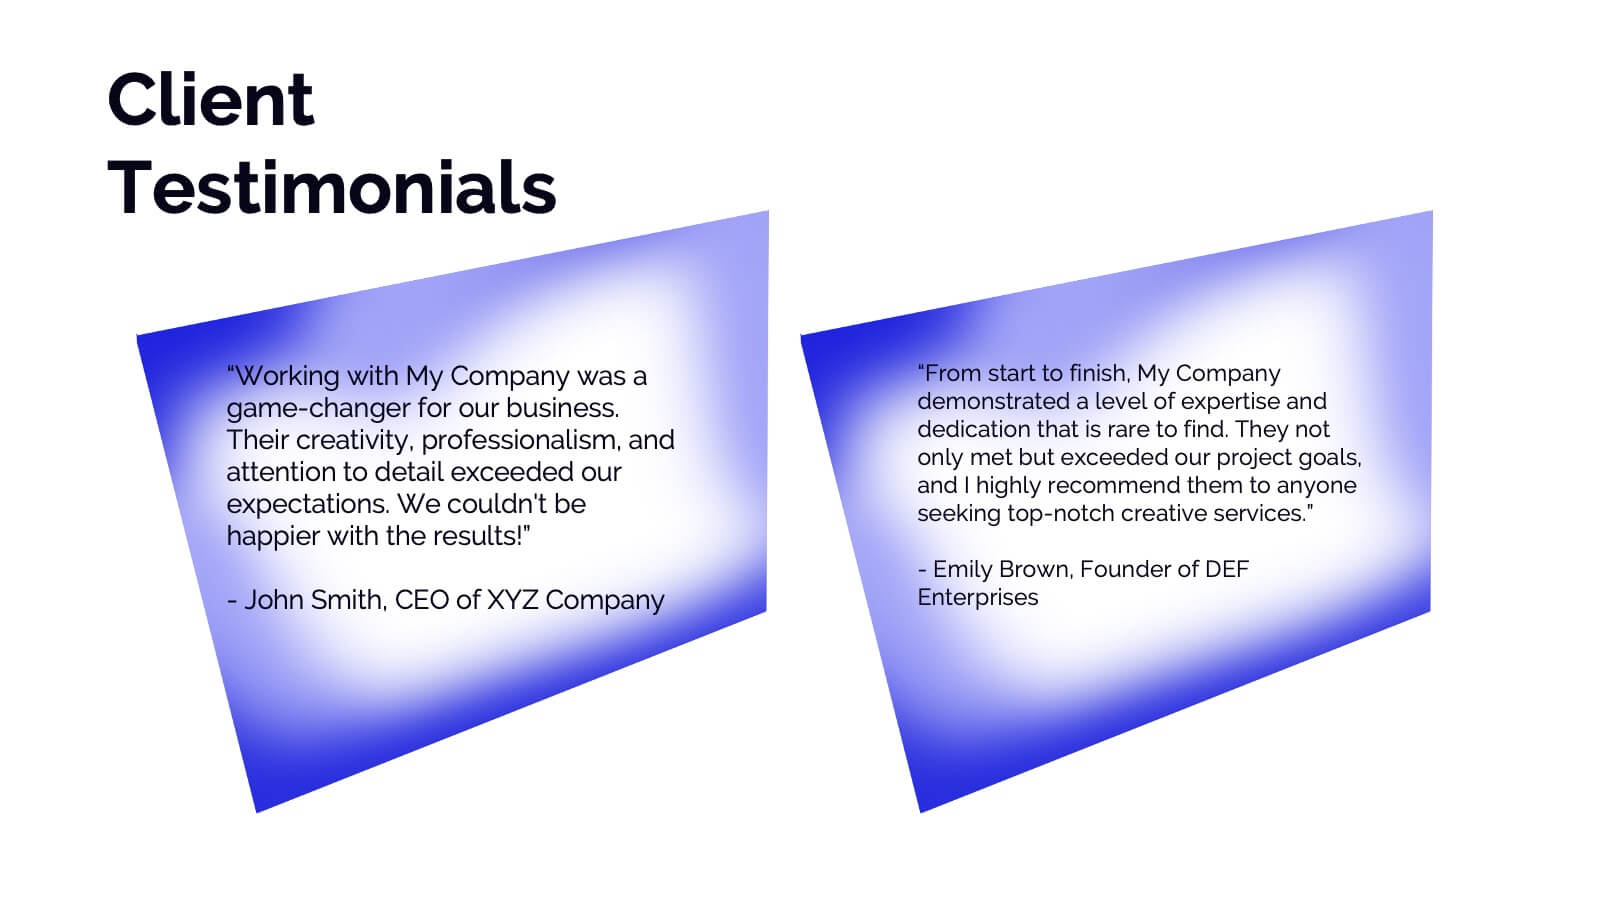
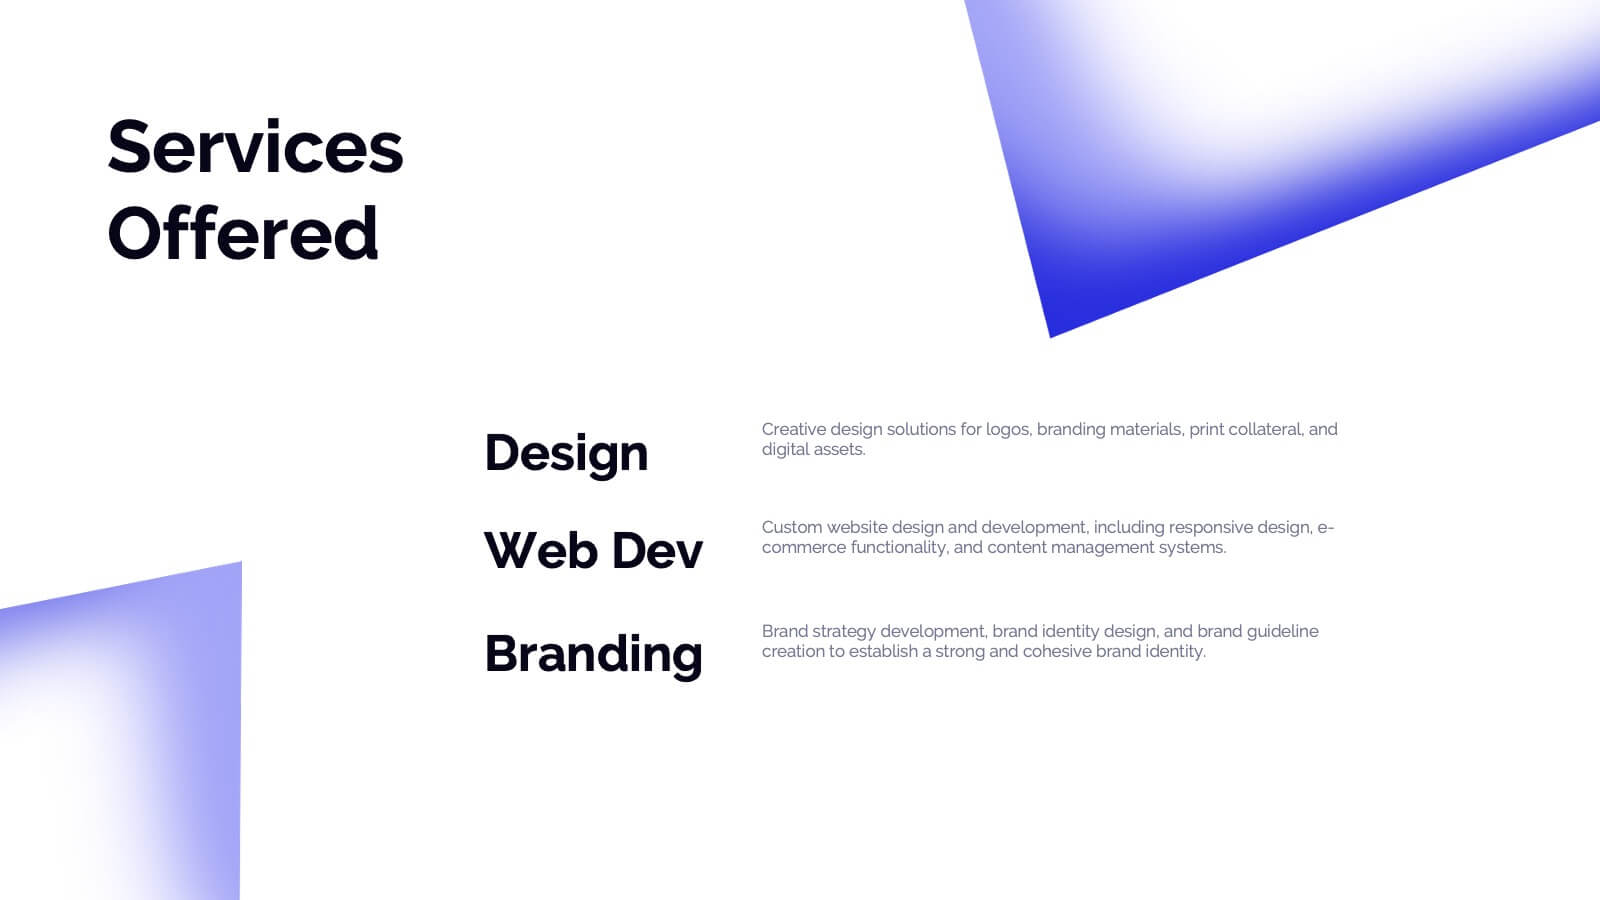
Dryad Photography Portfolio Template Presentation
Showcase your photography skills with this elegant and professional portfolio presentation template! Perfect for highlighting your projects, style, and creative process, this template covers everything from client testimonials to pricing and services offered. It’s ideal for photographers wanting to present their work with style and clarity. Compatible with PowerPoint, Keynote, and Google Slides for effortless sharing and presentations.


5 diapositivas
5G Technology Utilities Infographics
5G is the fifth generation of wireless technology that provides faster internet speeds, lower latency, and more reliable connectivity for connected devices. These Infographics are visual representation of the benefits and uses of 5G technology. They can be used to provide detailed explanations and highlight the benefits of 5G technology, such as faster speeds and lower latency. You can also use this template to explain how 5G technology works, including the use of small cells and beamforming. These are designed using modern and visually appealing graphics, icons, and colors to make the information easy to understand.


5 diapositivas
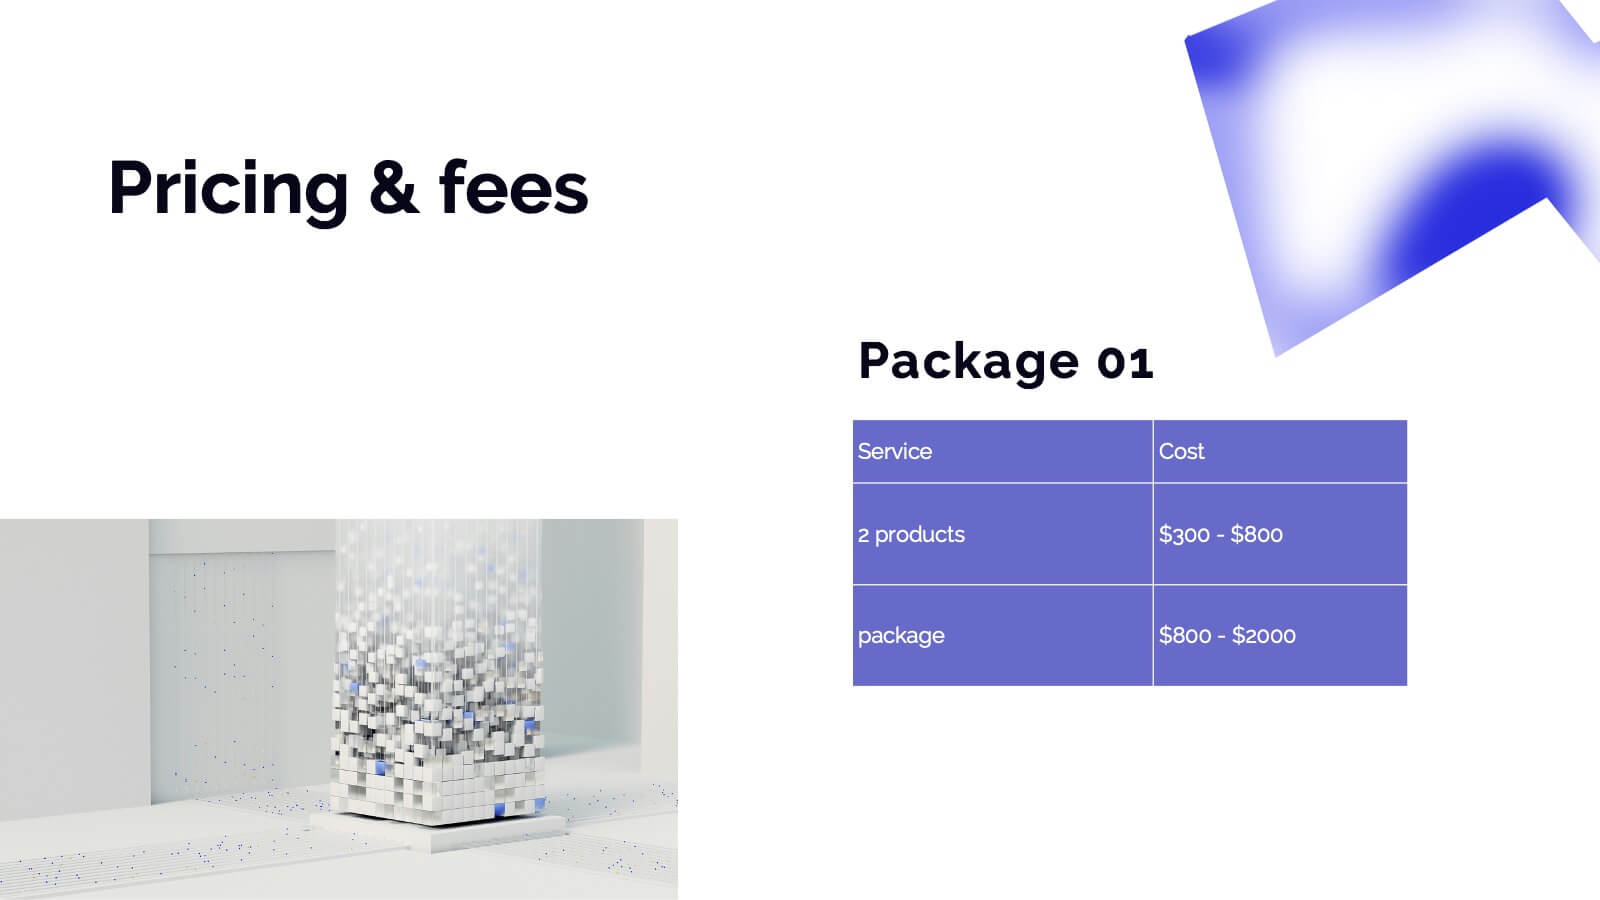
Financial Investment Portfolio Presentation
Visualize portfolio distribution like never before. This presentation features glass dome-protected coin stacks to represent diverse asset categories, risk levels, or growth stages. Ideal for financial advisors, investors, or business analysts presenting asset management plans. Fully editable in PowerPoint, Keynote, and Google Slides.


23 diapositivas
Sunstone Investor Pitch Presentation
Captivate investors with this professionally crafted pitch deck, showcasing sections for company overview, problem and solution, market opportunity, revenue model, competitive landscape, and growth projections. Present your team, financials, milestones, and funding requirements effectively. Ideal for securing investment and support. Fully customizable for PowerPoint, Keynote, and Google Slides.


4 diapositivas
Neuroscience-Inspired Concept Mapping Presentation
Visualize abstract ideas with clarity using the Neuroscience-Inspired Concept Mapping Presentation. Featuring a head silhouette and four labeled concept nodes, this layout is perfect for connecting ideas, frameworks, or steps in a thought process. Fully editable in PowerPoint, Canva, and Google Slides for seamless customization and presentation.


5 diapositivas
Visual Data Representation Bubble Map
Display complex data in a clean, engaging format with this Visual Data Representation Bubble Map. Ideal for highlighting key points, data clusters, or relationships, each bubble can be customized to match your topic. Perfect for presentations in business, research, or strategy—fully editable in PowerPoint, Keynote, and Google Slides.


5 diapositivas
Market Growth Strategy
Break down your strategic growth roadmap with this layered Market Growth Strategy template. Each stack represents a phase in your market expansion journey—ideal for illustrating plans, KPIs, or product scaling. Fully editable and compatible with PowerPoint, Keynote, and Google Slides for seamless use across platforms.


6 diapositivas
Financial Report and Charts Presentation
Deliver financial insights with impact using this Financial Report and Charts Presentation Template. Featuring a clean layout with a money bag visual and percentage breakdowns, it’s perfect for showcasing profit distribution, investment categories, or budget summaries. Fully customizable in PowerPoint, Keynote, and Google Slides.


26 diapositivas
Becka Presentation Template
Becka is a modern and powerful template for people who want to present themselves in a professional but bold way. Perfect for the CEO or company executive who wants to have a strong presence on screen. Made with clear and crisp typography, with added bold colors that appeal to both men and women which can evoke powerful emotions and confidence. This template contains easy to edit maps, charts and image place holders that are ready to use. The dynamic slides make it quick and easy to create the perfect presentation.


5 diapositivas
Construction Sector and Careers Infographics
Construction Infographics provide information and data related to the construction industry. This template is a visually appealing and informative design that allows you to present key information about the construction industry and various career opportunities within it. This template provides a comprehensive platform to showcase the different aspects of the industry and the diverse career paths available. Compatible with Powerpoint, Keynote, and Google Slides, ensuring easy customization and flexibility. The infographics feature construction-themed illustrations and icons, to captures the attention of your audience and add visual interest.


7 diapositivas
Business Strategy with 7S Model
Clearly map out your organizational alignment using this Business Strategy with 7S Model template. Perfect for strategy consultants, leadership teams, and business educators, it illustrates the interconnectedness of structure, strategy, systems, style, staff, skills, and shared values. Fully customizable in PowerPoint, Keynote, and Google Slides.