


Características


¿Tienes alguna pregunta?
Recomendar


6 diapositivas
Circular Concept Diagram for Strategy Presentation
Visualize interconnected ideas with this circular concept diagram, ideal for showcasing six key strategic pillars or processes. Each segment is clearly labeled and icon-supported, creating an easy-to-follow layout. Perfect for business planning, marketing strategies, or organizational models. Compatible with PowerPoint, Keynote, and Google Slides for full customization.


3 diapositivas
Introduction to Cryptocurrency Presentation
Step into the future of finance with this sleek, modern template designed to explain digital currencies in a simple, engaging way. Perfect for educators, startups, and analysts, it transforms complex ideas into clear visuals. Fully compatible with PowerPoint, Keynote, and Google Slides for effortless editing and professional presentations.


5 diapositivas
Market Growth Strategy
Break down your strategic growth roadmap with this layered Market Growth Strategy template. Each stack represents a phase in your market expansion journey—ideal for illustrating plans, KPIs, or product scaling. Fully editable and compatible with PowerPoint, Keynote, and Google Slides for seamless use across platforms.


21 diapositivas
Stellar Content Marketing Pitch Deck Presentation
The Stellar Marketing Pitch Deck template is designed to make your marketing strategies shine like never before! This template is perfect for showcasing your business's potential and engaging your audience with sleek, modern designs that capture attention. Start with a powerful introduction, leading into an in-depth industry overview that highlights key trends and consumer behaviors. With dedicated sections for emerging technologies, content marketing trends, and data-driven marketing, you'll have everything you need to present your innovative approach. The template also includes slides for social media strategies, influencer marketing, and SEO trends, ensuring you're covering all the bases. Personalization trends and video marketing evolution are featured to show your forward-thinking approach, while the customer experience focus slide emphasizes your commitment to quality. Finish strong with insights into e-commerce trends, brand storytelling, and sustainability in marketing. This template is fully compatible with PowerPoint, Keynote, and Google Slides, making it versatile and easy to use for any marketing presentation.


23 diapositivas
Nightspire Strategic Planning Report Presentation
Streamline your strategic planning process with this professionally designed presentation template. Covering key areas such as market analysis, SWOT assessment, milestones, and resource allocation, this template is ideal for businesses and project teams. Fully editable and compatible with PowerPoint, Keynote, and Google Slides.


26 diapositivas
Human Resources Colorful Vectors
Dive into the dynamic realm of human resources, where talent thrives and organizations find their heartbeat. Radiating with a playful palette of sunny yellow, refreshing green, blush pink, and crisp white, our template captures the vibrancy and diversity of the HR world. Adorned with colorful graphics, relatable icons, and insightful image placeholders, it's a testament to the human touch in every organization. Expertly tailored for Powerpoint, Keynote, or Google Slides. An invaluable tool for HR professionals, recruitment agencies, corporate trainers, or anyone focused on building and nurturing talent. Engage, empower, and elevate; let your HR endeavors shine.


8 diapositivas
Geographic Heat Map Analysis Presentation
Bring your data to life with a vibrant map that instantly reveals regional patterns and performance differences. Ideal for presenting location-based insights, sales metrics, or demographic trends, this presentation combines clarity with visual impact. Fully compatible with PowerPoint, Keynote, and Google Slides for easy editing and professional results.


12 diapositivas
Corporate Sustainability Strategy Presentation
Achieve your sustainability goals with the Corporate Sustainability Strategy Presentation template. This modern, visually engaging layout helps businesses showcase their environmental, social, and governance (ESG) initiatives, sustainability roadmaps, and corporate responsibility plans. Featuring clear, structured sections, this fully customizable design is perfect for corporate leaders, consultants, and eco-conscious organizations. Compatible with PowerPoint, Keynote, and Google Slides for effortless editing and presentation.


5 diapositivas
Corporate Messaging Strategy Presentation
Clarify your company’s voice with this corporate messaging strategy slide. Designed to outline your core communication pillars, this layout helps you present messaging priorities across different channels or audiences. Perfect for marketing teams, branding sessions, or executive briefings. Fully editable in Canva, PowerPoint, and Google Slides for quick customization.


22 diapositivas
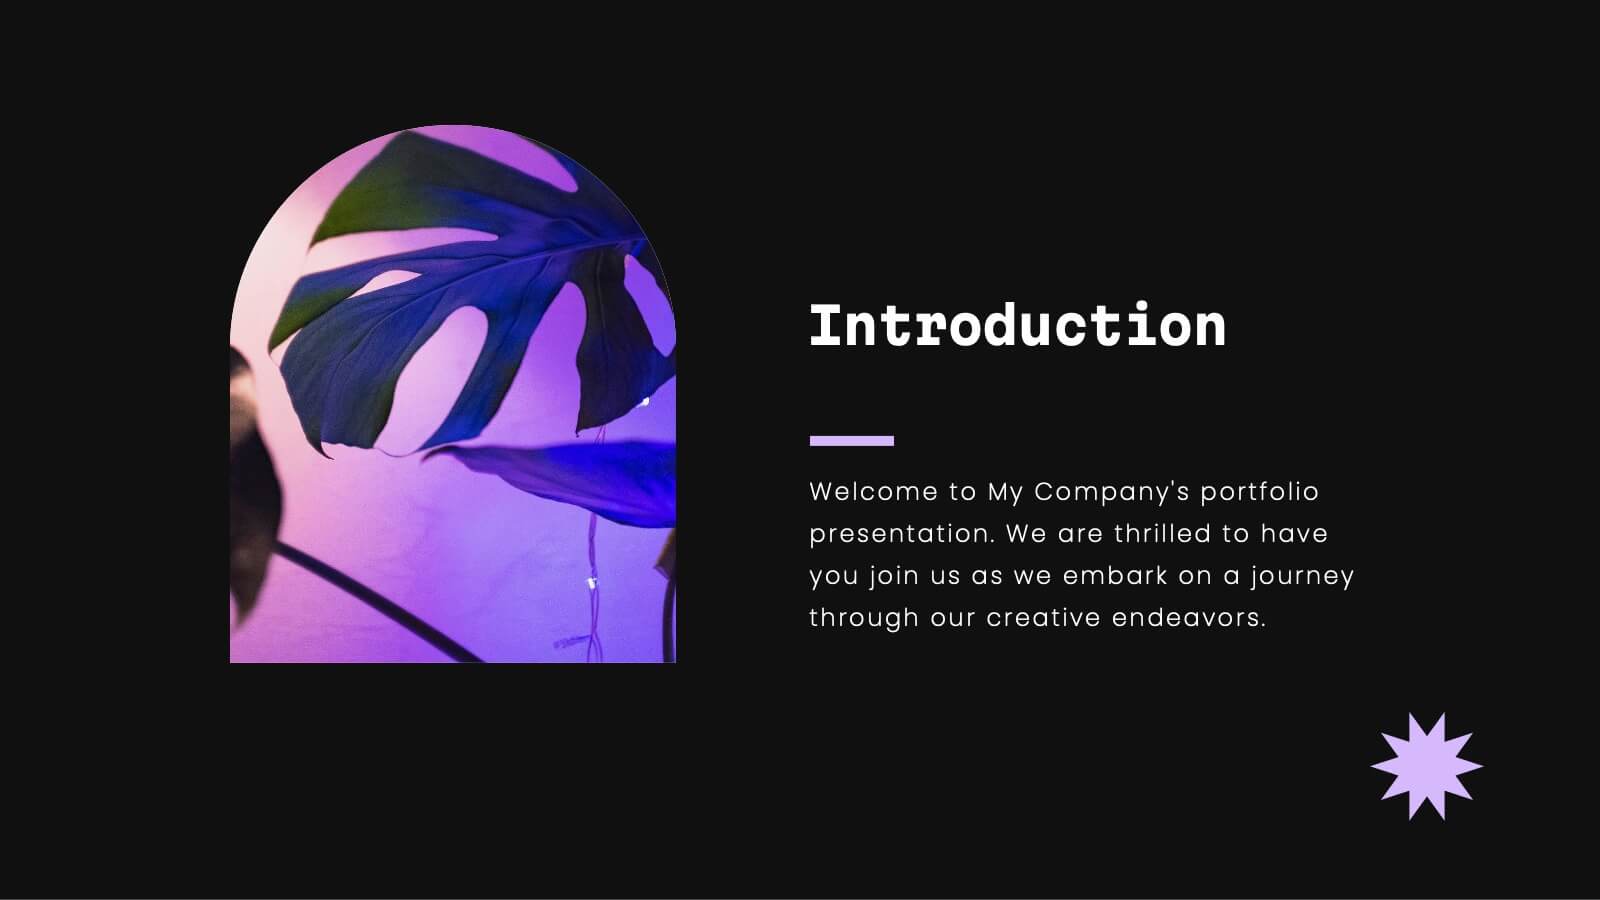
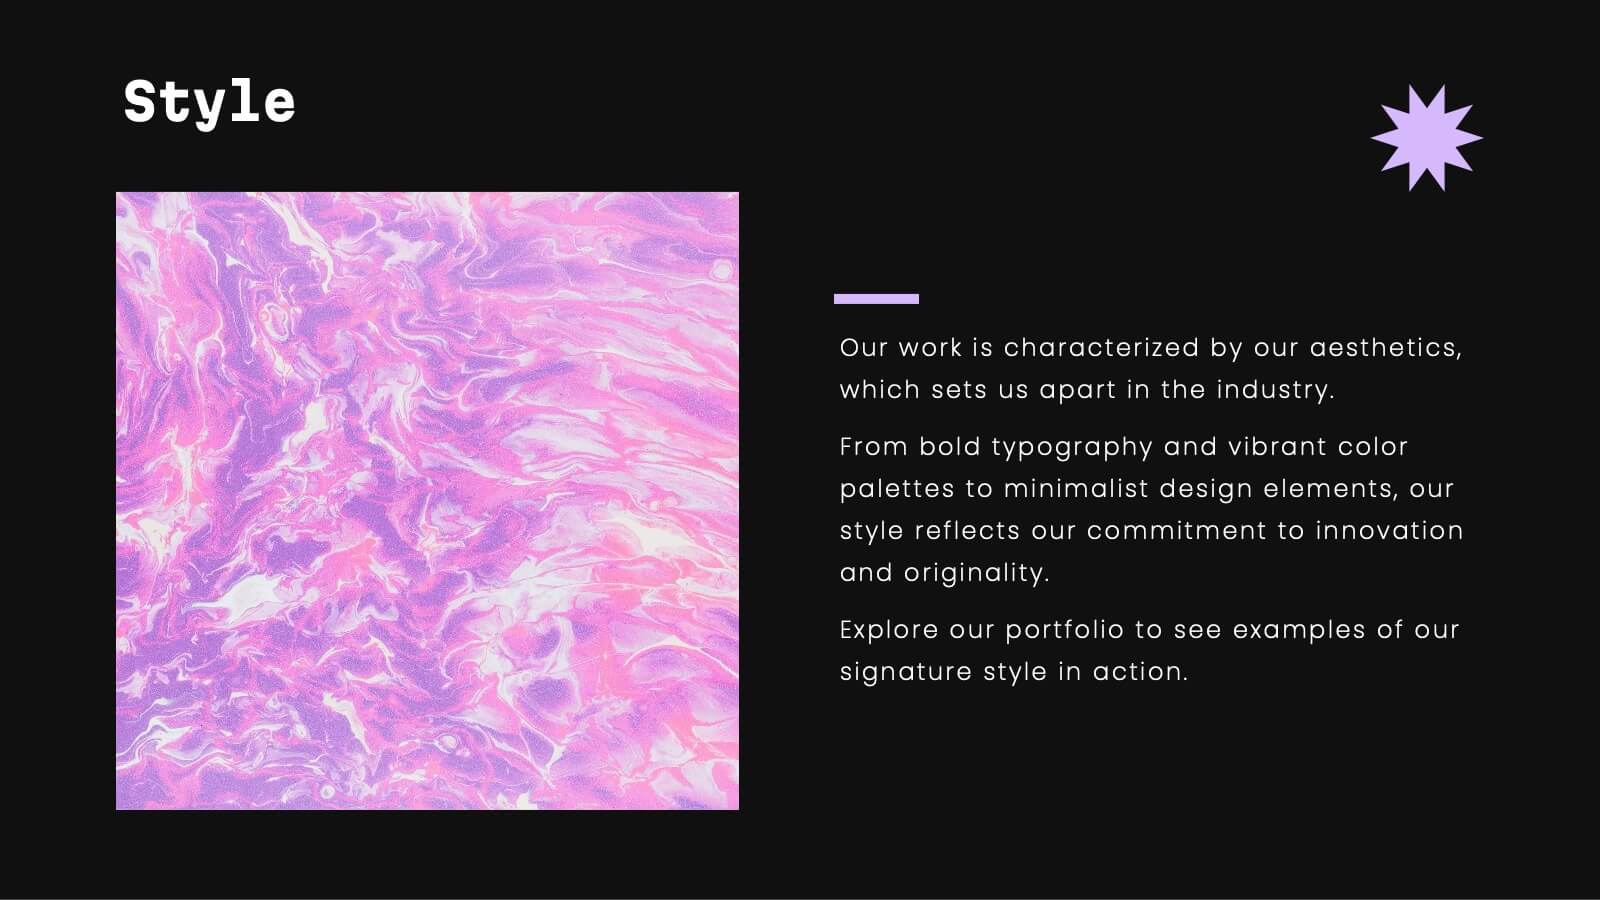
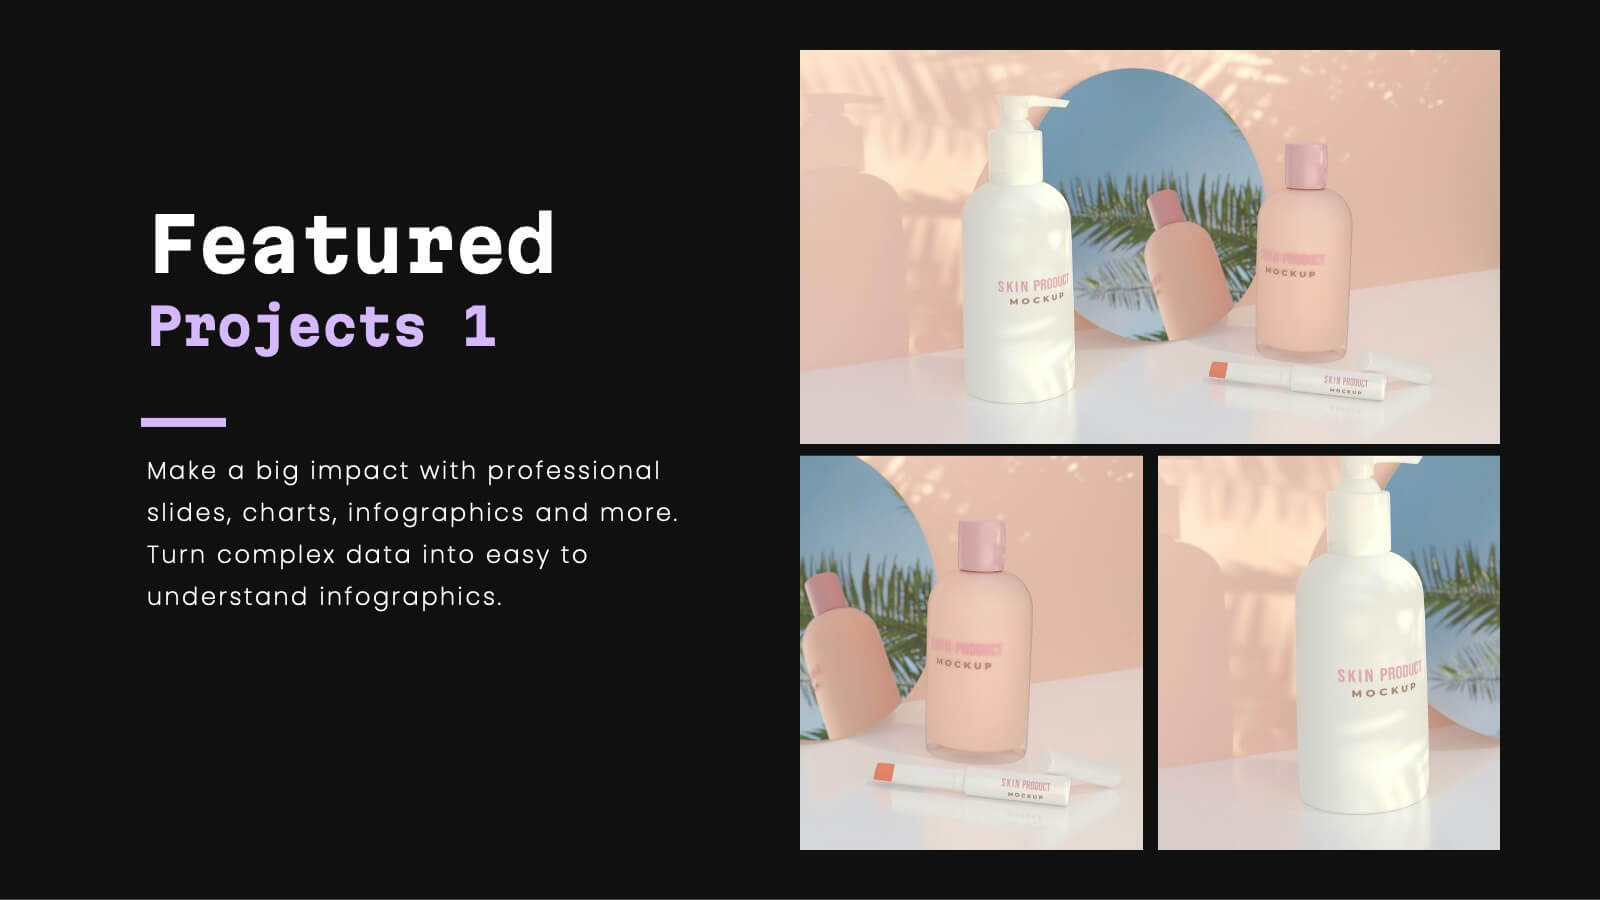
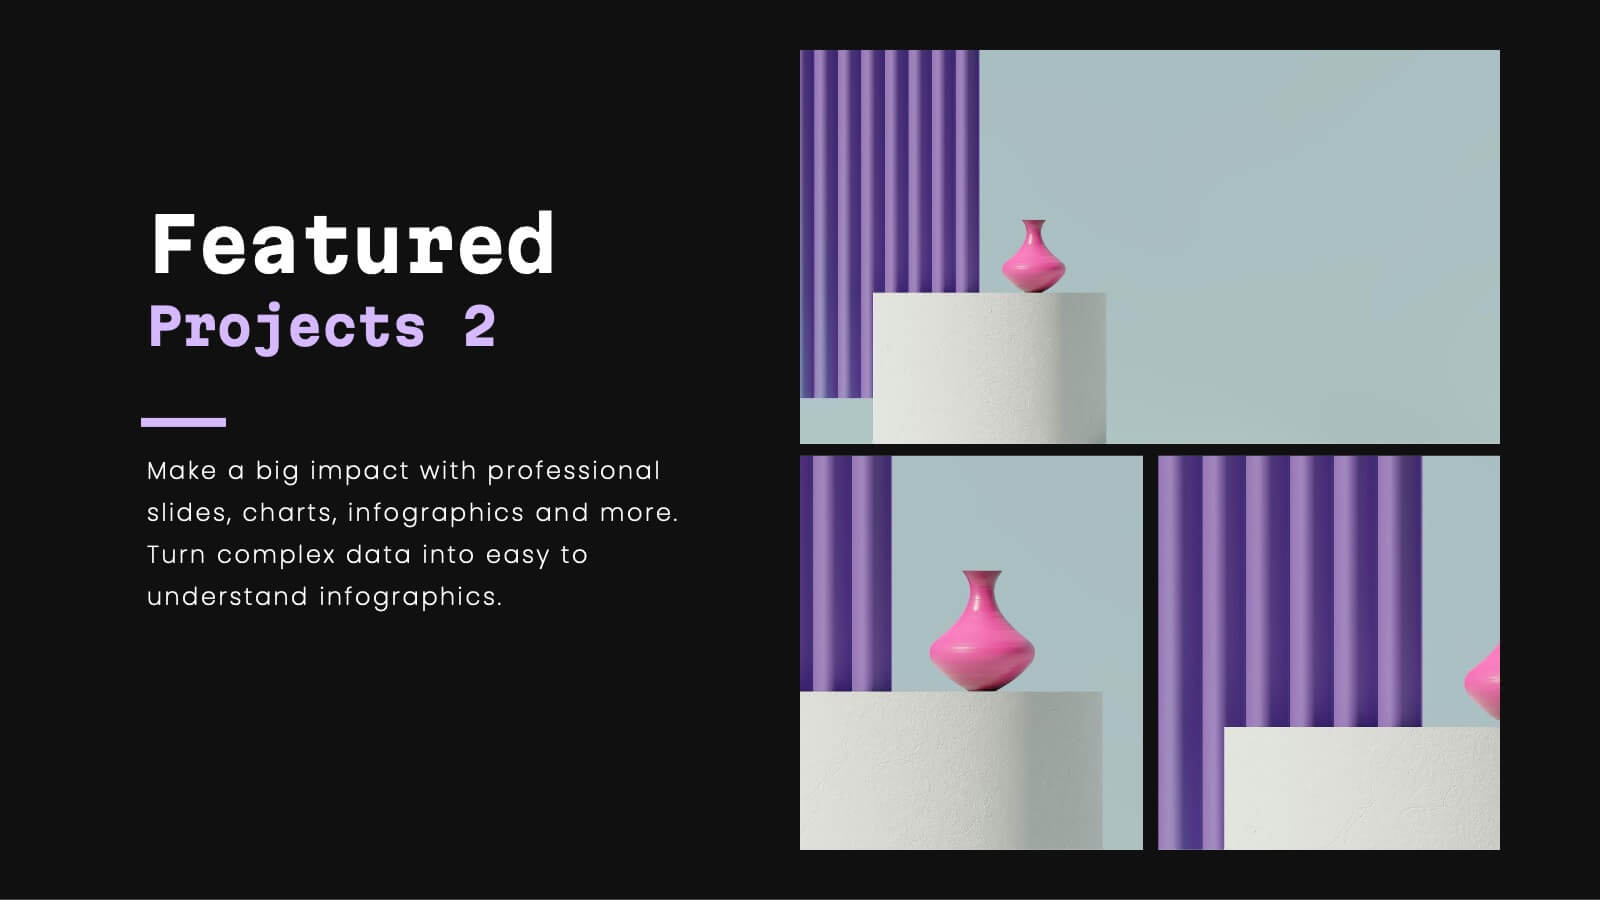
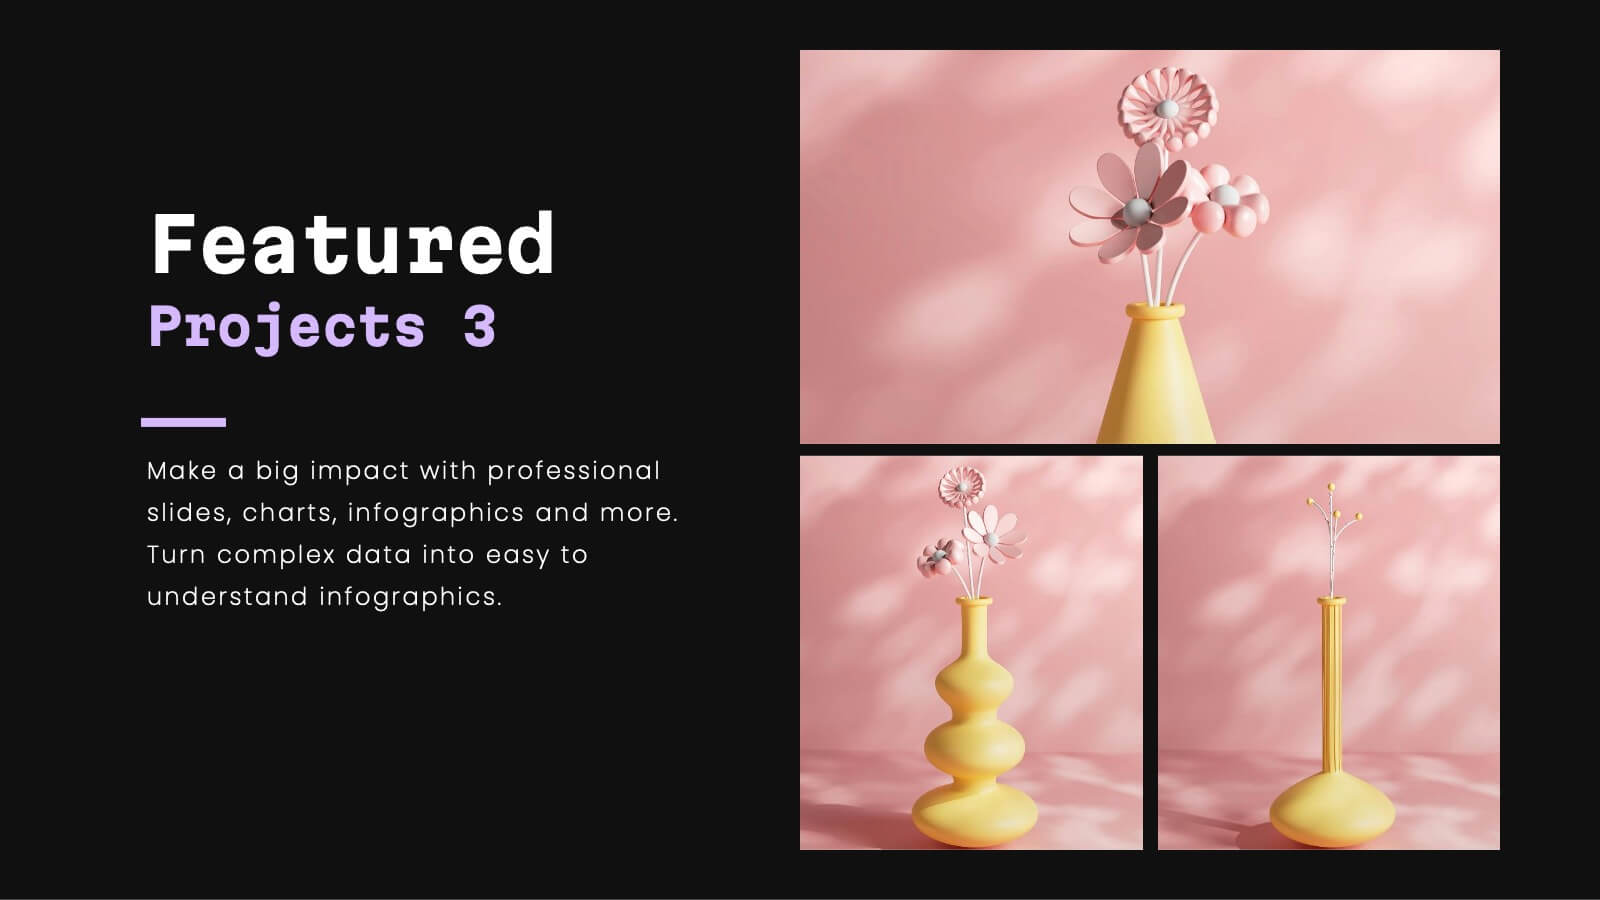
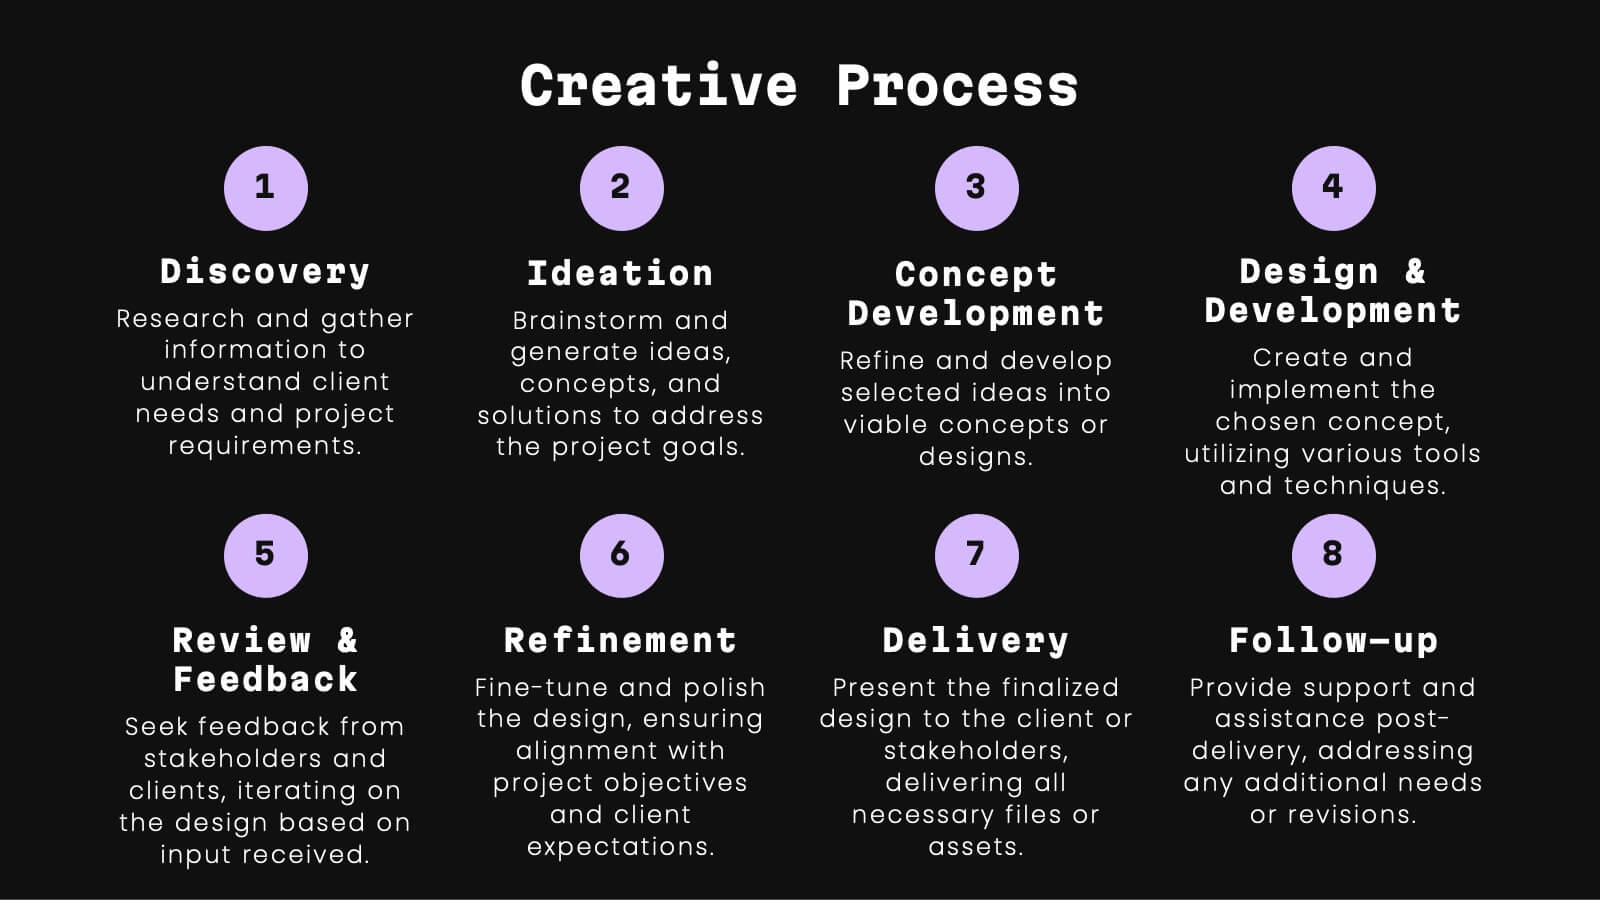
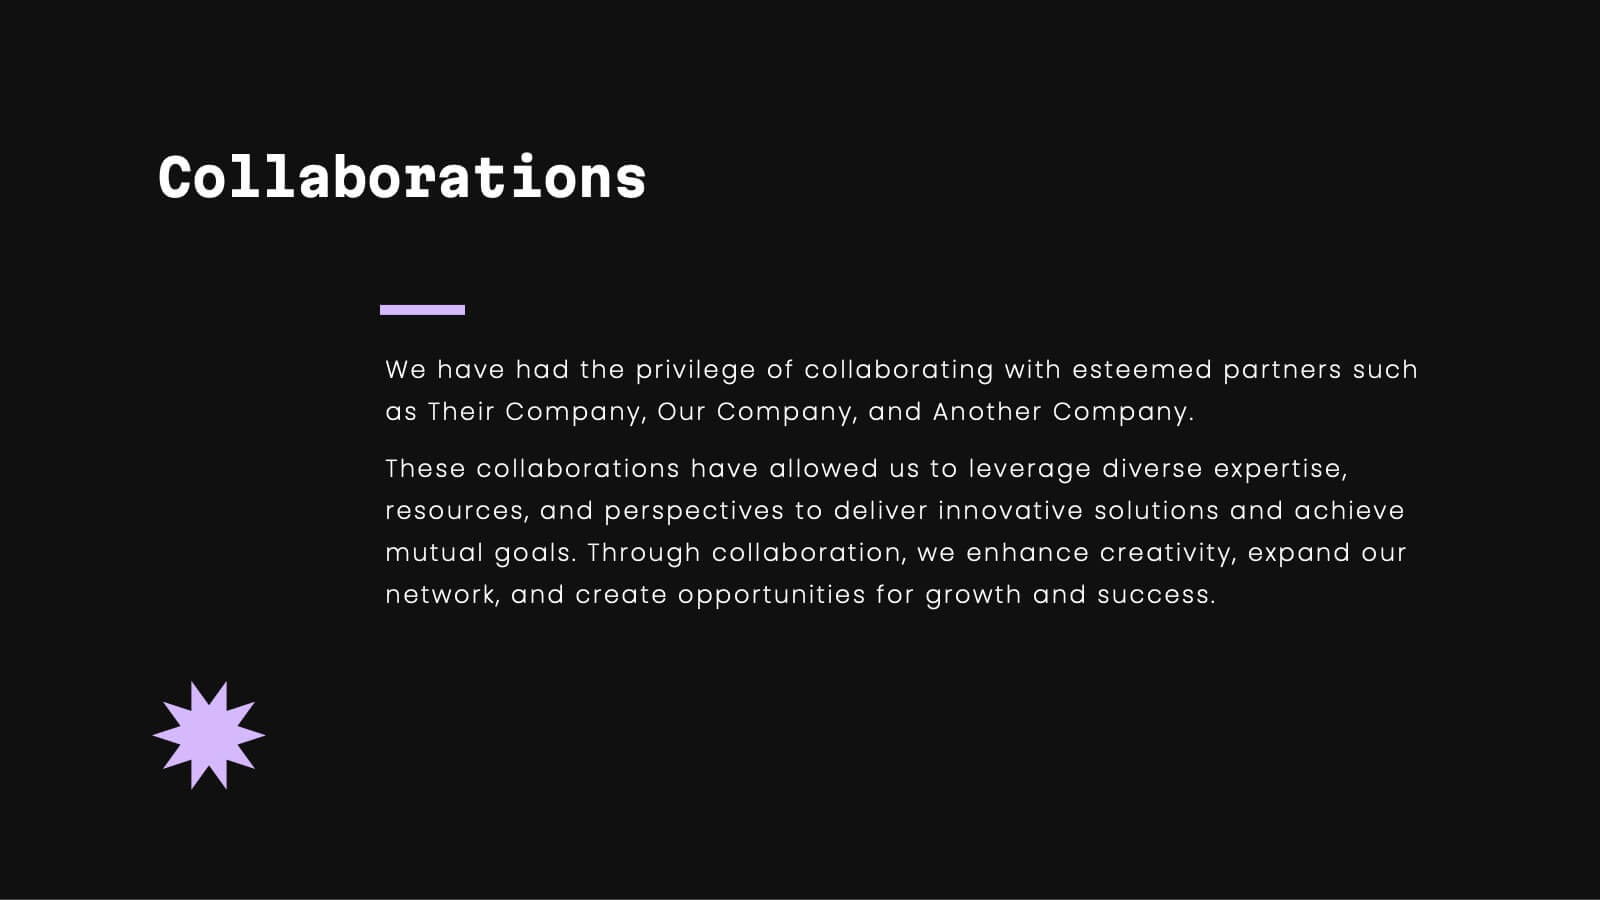
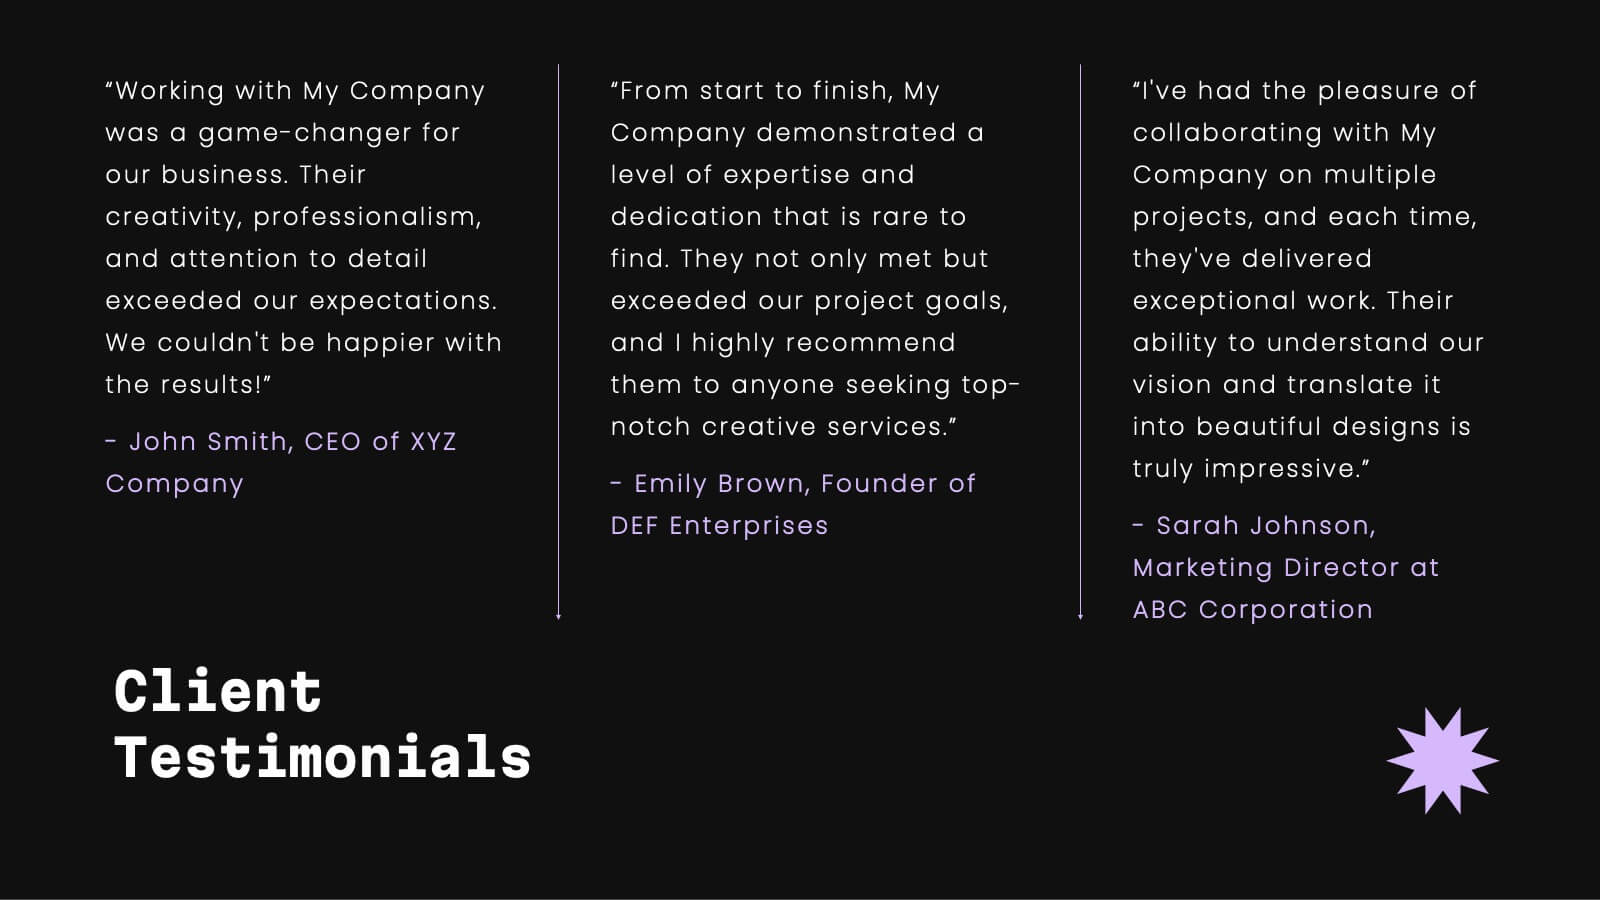
Celeste Professional Portfolio Showcase Presentation
Impress with style using this sophisticated portfolio presentation template. Perfect for showcasing featured projects, creative processes, and client testimonials, this template enhances the visual appeal of your work. Its modern, dark-themed design ensures your content stands out, making a lasting impression. Compatible with PowerPoint, Keynote, and Google Slides, it's versatile for any platform.


5 diapositivas
Process Improvement Cycle Mapping Presentation
Illustrate continuous growth and optimization with this modern process improvement cycle template. Featuring a dynamic circular flow design, it’s ideal for showcasing iterative strategies, workflow enhancements, or business development stages. Fully editable in Canva, PowerPoint, and Google Slides, it ensures clarity and professionalism in mapping each step toward better performance.


4 diapositivas
Organizational Hierarchy Chart Presentation
A clear, engaging way to map out team structure, this presentation highlights how roles connect and flow across an organization. It visually simplifies reporting lines, helping audiences quickly understand leadership levels and team responsibilities. Perfect for planning, onboarding, or strategy discussions, and fully compatible with PowerPoint, Keynote, and Google Slides.


8 diapositivas
Team OKRs Planning and Monitoring Presentation
Foster alignment across teams with the Team OKRs Planning and Monitoring Presentation. This creative hand-shaped visual helps illustrate collaboration between objectives, key results, and responsibilities. Ideal for performance check-ins, OKR workshops, and team planning meetings. Fully customizable in PowerPoint, Canva, Keynote, and Google Slides for seamless integration.


5 diapositivas
Retention and Loyalty Program Benefits Presentation
Showcase the value of your loyalty strategy with the Retention and Loyalty Program Benefits presentation. This template clearly communicates reward tiers, membership perks, and engagement incentives using a card-based visual structure. Perfect for marketing presentations, customer success teams, and subscription-based business models. Fully customizable in PowerPoint, Keynote, and Google Slides.


6 diapositivas
Six-Sided Strategy with Hexagon Infographic Presentation
Present your six-point plan with clarity using the Six-Sided Strategy with Hexagon Infographic Presentation. This geometric layout highlights each core element in a balanced, easy-to-follow format—ideal for frameworks, business models, or strategy steps. Fully customizable in Canva, PowerPoint, Keynote, and Google Slides for seamless integration.


4 diapositivas
Property Investment Pitch Deck Presentation
Impress investors with a sleek and confident presentation designed to highlight property opportunities and market growth. This professional layout helps you showcase financial insights, projections, and investment strategies with clarity and style. Fully customizable and compatible with PowerPoint, Keynote, and Google Slides for effortless editing and impactful delivery.


6 diapositivas
Business Risk Identification and Management Presentation
Identify, analyze, and mitigate business risks with ease. This Business Risk Identification and Management template helps teams visualize potential risks, assess their impact, and implement mitigation strategies. Perfect for corporate leaders, project managers, and financial analysts. Fully customizable and compatible with PowerPoint, Keynote, and Google Slides for seamless presentation use.