
Características


¿Tienes alguna pregunta?
Recomendar


6 diapositivas
Target Audience Segmentation Strategy
Break down your audience with clarity using the Target Audience Segmentation Strategy Presentation. This slide features a vibrant vertical funnel layout, ideal for displaying five customer segments or persona categories. Each layer is numbered and color-coded, with connected callout areas for detailed insights. Perfect for marketers, campaign strategists, or product teams presenting customer journey data, audience demographics, or behavioral insights. Fully customizable in PowerPoint, Keynote, and Google Slides—easily align the design with your brand colors and content structure.
5 diapositivas
Team Achievements and Output Tracking Presentation
Celebrate success and monitor progress with the Team Achievements and Output Tracking presentation template. Designed with visual medal icons and color-coded team figures, this layout is perfect for highlighting milestones, recognizing contributors, and tracking output performance. Fully editable and compatible with PowerPoint, Keynote, and Google Slides.


5 diapositivas
Hidden Risks Iceberg Model Diagram Presentation
Spotlight what lies beneath the surface with the Hidden Risks Iceberg Model Diagram Presentation. This slide helps you visually distinguish between visible issues and deeper, less obvious risks—perfect for risk assessments, compliance, safety briefings, and executive strategy discussions. Fully editable in PowerPoint, Keynote, and Google Slides for quick customization.


20 diapositivas
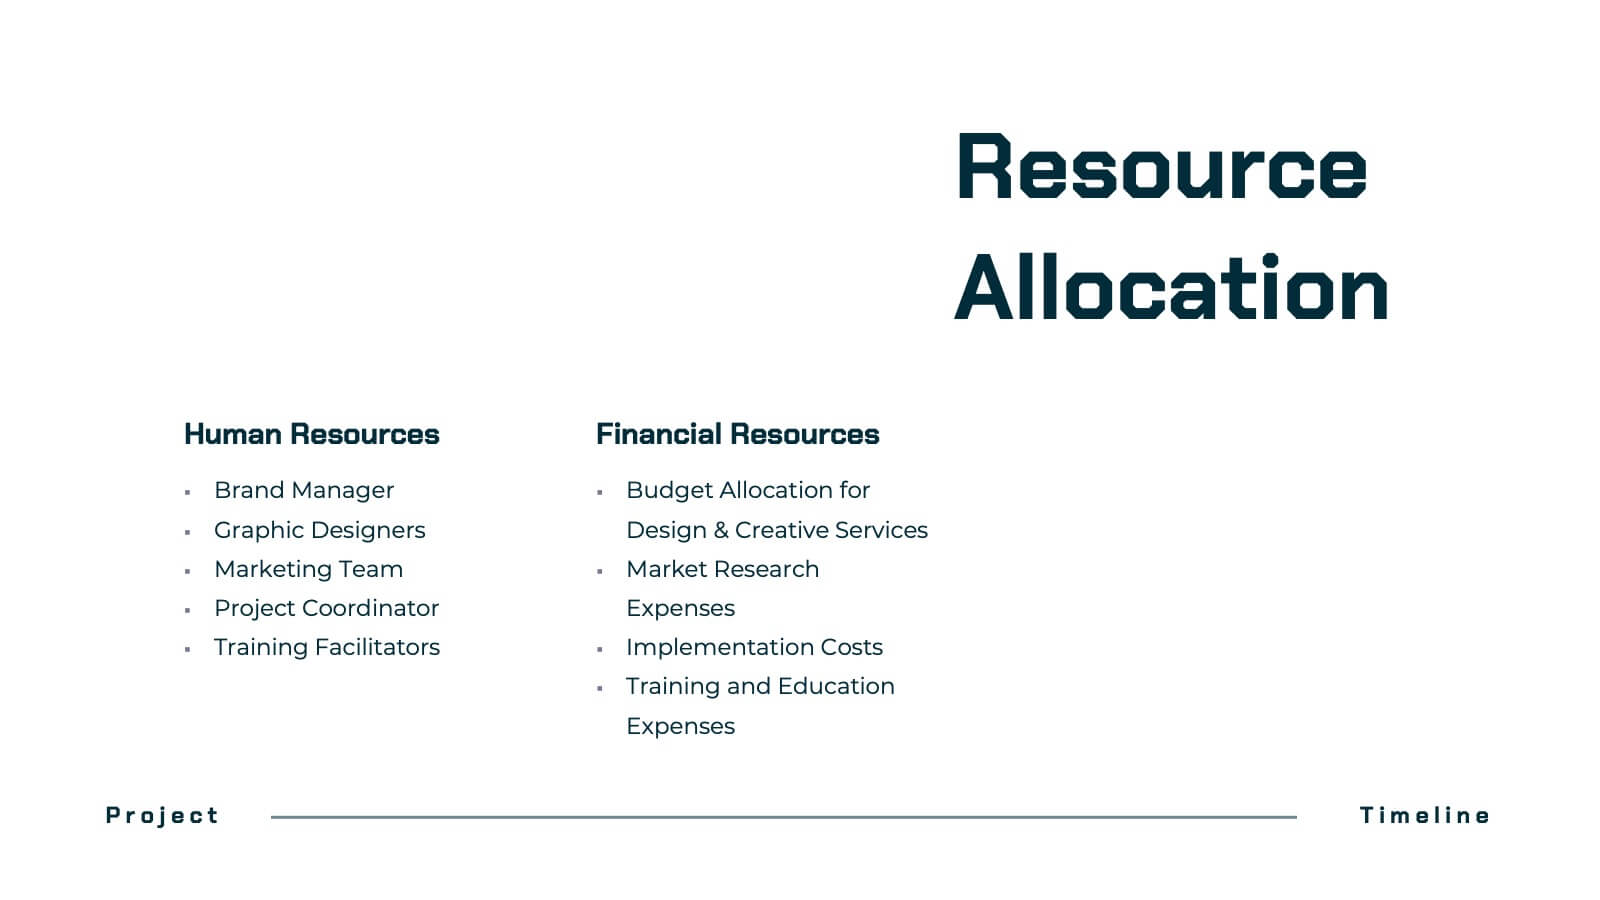
Dynastream Project Timeline Presentation
Stay on track with this detailed and well-organized project plan presentation designed for success! Covering essential areas like scope, objectives, timeline, budget breakdown, and risk management, it ensures every aspect of your project is clear and actionable. Perfect for team meetings or stakeholder updates, this template is fully compatible with PowerPoint, Keynote, and Google Slides.


6 diapositivas
Effective Team Structure Guide Presentation
Visualize your team's structure with clarity using this team guide presentation. Designed for highlighting roles, connections, and reporting lines, each slide helps communicate responsibilities and hierarchy efficiently. Ideal for HR, managers, and team leads. Fully editable in PowerPoint, Keynote, and Google Slides—customize colors, names, and positions with ease.


21 diapositivas
Ironveil Annual Report Presentation
A professional annual report template for showcasing performance metrics, key highlights, financial summaries, and strategic initiatives. Includes sections for customer feedback, competitor insights, and future priorities. Fully customizable and ideal for business reviews. Compatible with PowerPoint, Keynote, and Google Slides for seamless presentation delivery.


7 diapositivas
Team Leadership and Management Presentation
Unlock the secrets of effective team leadership and management with our detailed presentation template. Designed for training sessions and workshops, it provides clear guidance on key leadership principles and team management tactics through engaging graphics and strategic layouts. Ideal for enhancing team dynamics and leadership skills.


22 diapositivas
Tempest Product Strategy Report Presentation
Accelerate your product strategy with this bold presentation template! Ideal for outlining your product's market opportunity, unique selling proposition, and revenue model, it includes slides for competitive analysis, marketing strategy, and financials. Impress stakeholders with dynamic visuals and clear, structured content. Compatible with PowerPoint, Keynote, and Google Slides for seamless presentations on any platform.


6 diapositivas
5-Stage Circular Cycle Presentation
Energize your workflow with a clean, circular layout that turns five interconnected steps into a clear, engaging story. This presentation helps you explain any repeating process or continuous cycle with simplicity and flow, making complex ideas easier to follow. Compatible with PowerPoint, Keynote, and Google Slides.


5 diapositivas
Data Analytics Heat Map
Visualize data intensity and trends effortlessly using this heat map-style layout. Ideal for performance tracking, comparative analysis, and decision-making frameworks, this slide organizes information by low, medium, and high value ranges. Fully customizable in PowerPoint, Keynote, and Google Slides.


5 diapositivas
Data Entry Infographics
Dive into the intricate world of information management with our data entry infographics. Cast in shades of blue, warm orange, and an array of inviting colors, this vertically styled template is a boon for business analysts, administrative assistants, and database managers. The design, punctuated with relevant graphics, icons, and strategic image placeholders, simplifies complex data narratives. It serves as a visual anchor, ensuring information accuracy and efficiency. This essential tool is instrumental for professionals striving to maintain data integrity while elucidating critical entry processes, thereby fostering a streamlined workflow.


10 diapositivas
Healthcare Innovations in Medicine Presentation
Showcase groundbreaking advancements with the Healthcare Innovations in Medicine Presentation template. Designed to highlight medical breakthroughs, research developments, and technological advancements, this visually appealing layout is ideal for healthcare professionals, researchers, and medical institutions. Fully customizable and compatible with PowerPoint, Keynote, and Google Slides, this template ensures your presentation is clear, engaging, and impactful.


7 diapositivas
Digital Marketing Infographics Presentation Template
Digital marketing is essential for your business and brand awareness. From website design to social media advertising, learn about all the ways digital marketing can help grow your company with this template. Digital marketing can be a powerful and effective way to promote your business.


6 diapositivas
Governance Tools Infographics
Enhance your understanding of Governance Tools with our customizable infographic template. This template is fully compatible with popular presentation software like PowerPoint, Keynote, and Google Slides, allowing you to easily customize it to illustrate and communicate various governance tools and practices. The Governance Tools infographic template offers a visually engaging platform to explore and explain the tools, frameworks, and strategies used to facilitate effective governance within organizations. Whether you're a governance professional, business leader, or interested in corporate governance, this template provides a user-friendly canvas to create informative presentations and educational materials. Deepen your knowledge of Governance Tools with this SEO-optimized infographic template, thoughtfully designed for clarity and ease of use. Customize it to showcase governance frameworks, compliance mechanisms, risk management tools, and best practices, ensuring that your audience gains valuable insights into this critical field. Start crafting your personalized infographic today to delve into the world of Governance Tools.


5 diapositivas
Science Myths & Facts Infographics
Science myths are misconceptions or false beliefs that are widely circulated and often accepted by people, despite being contradicted by scientific evidence. These are engaging and educational infographic templates that aims to debunk common misconceptions and provide accurate information about various scientific topics. They present a collection of myths and their corresponding facts in a visually appealing and easy-to-understand format. The infographics utilizes eye-catching visuals, such as icons, illustrations, or images, to enhance the presentation and make the information more memorable.


6 diapositivas
Progress Monitoring Infographic
Progress monitoring provides insights into whether a project is on track, identifies any areas of concern or challenges, and informs decision-making. This infographic template is a visual representation of how to effectively monitor and track progress in various projects, tasks, or initiatives. This infographic aims to provide a clear overview of the steps and strategies involved in monitoring progress to ensure that goals are being met. This infographic is designed to provided insights into whether a project is on track, identifies any areas of concern or challenges, and informs decision-making to ensure successful project management.


3 diapositivas
Business Ethics and Legal Guidelines Presentation
Navigate the complexities of corporate governance with the "Business Ethics and Legal Guidelines" template, designed to simplify and clarify the presentation of legal standards and ethical expectations in business environments.This visually engaging layout helps emphasize the progression and importance of each principle, ensuring clarity in communication. Ideal for training modules, compliance meetings, or strategic planning sessions, it's compatible with PowerPoint, Keynote, and Google Slides.