


Características


¿Tienes alguna pregunta?
Recomendar


7 diapositivas
Governance Structure Infographic
Governance structure refers to the framework, system, and processes that define how an organization's operations, strategies, and objectives are directed, controlled, and regulated. This infographic template serves as a clear roadmap, guiding you through the key pillars that establish a strong foundation for successful governance. Compatible with Powerpoint, keynote, and Google Slides. The checkpoints illustrate the importance of compliance and effective risk management at various stages of your governance journey. This illuminating template empowers you to communicate the principles that steer an organization toward its objectives.


5 diapositivas
USA Regional Map Slide Presentation
Bring your data to life with a bold, colorful snapshot of regional insights across the United States. This presentation makes it easy to highlight state-level trends, compare demographics, and visualize performance using clean map graphics and simple icons. Fully compatible with PowerPoint, Keynote, and Google Slides.


4 diapositivas
Task Management Checklist Presentation
Stay organized and boost productivity with the Task Management Checklist template. This structured design helps you categorize tasks into Do’s and Don’ts, ensuring a clear workflow for efficient task execution. Fully editable and compatible with PowerPoint, Keynote, and Google Slides, making it perfect for teams and professionals alike.


7 diapositivas
Construction Jobs Infographic
Construction jobs refer to various roles and professions within the construction industry involved in planning, designing, building, and maintaining structures such as buildings, roads, bridges, dams, and other infrastructures. This infographic template sheds light on various career opportunities within the construction industry, offering a roadmap for aspiring professionals. Compatible with Powerpoint, Keynote, and Google Slides. With this infographic you're not just exploring careers; you're navigating a landscape of opportunities, ready to build a successful career in the dynamic world of construction.


9 diapositivas
Business Dashboard Infographics
A business dashboard, often referred to as a business intelligence dashboard, is a visual representation of an organization's key performance indicators and critical business metrics. Empower your business analysis and strategy with our Infographic. This dynamic template enables you to present key business metrics, performance indicators, and trends in a clear and impactful manner. Compatible with Powerpoint, Keynote, and Google Slides. This template is a powerful tool to visualize your business progress, identify opportunities, and communicate your success story to viewers, clients, or team members.


8 diapositivas
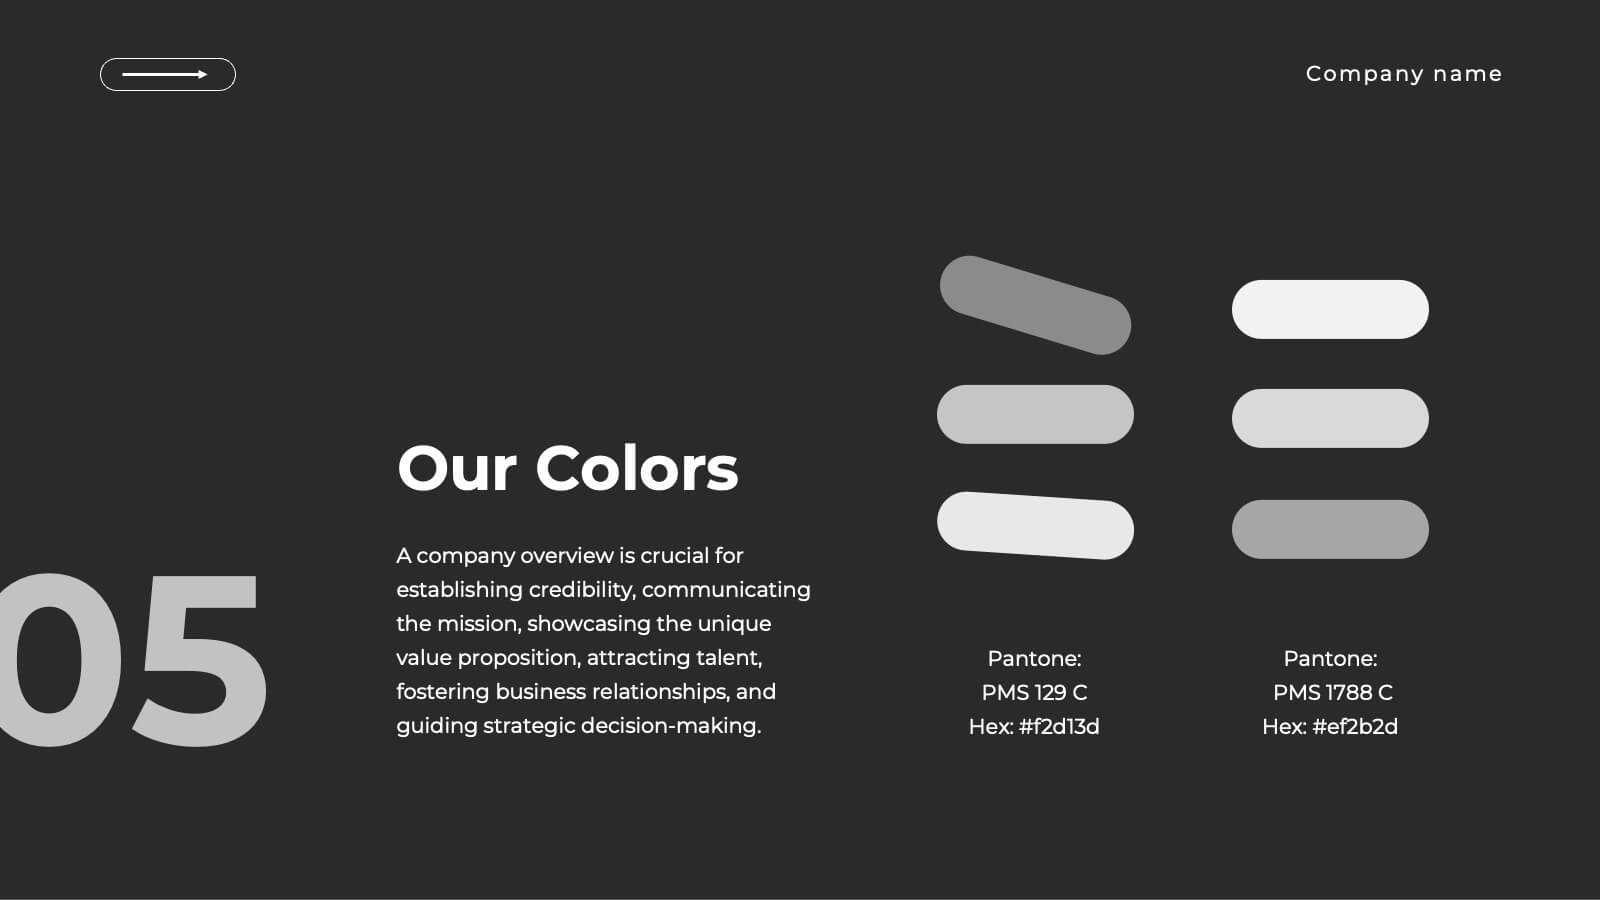
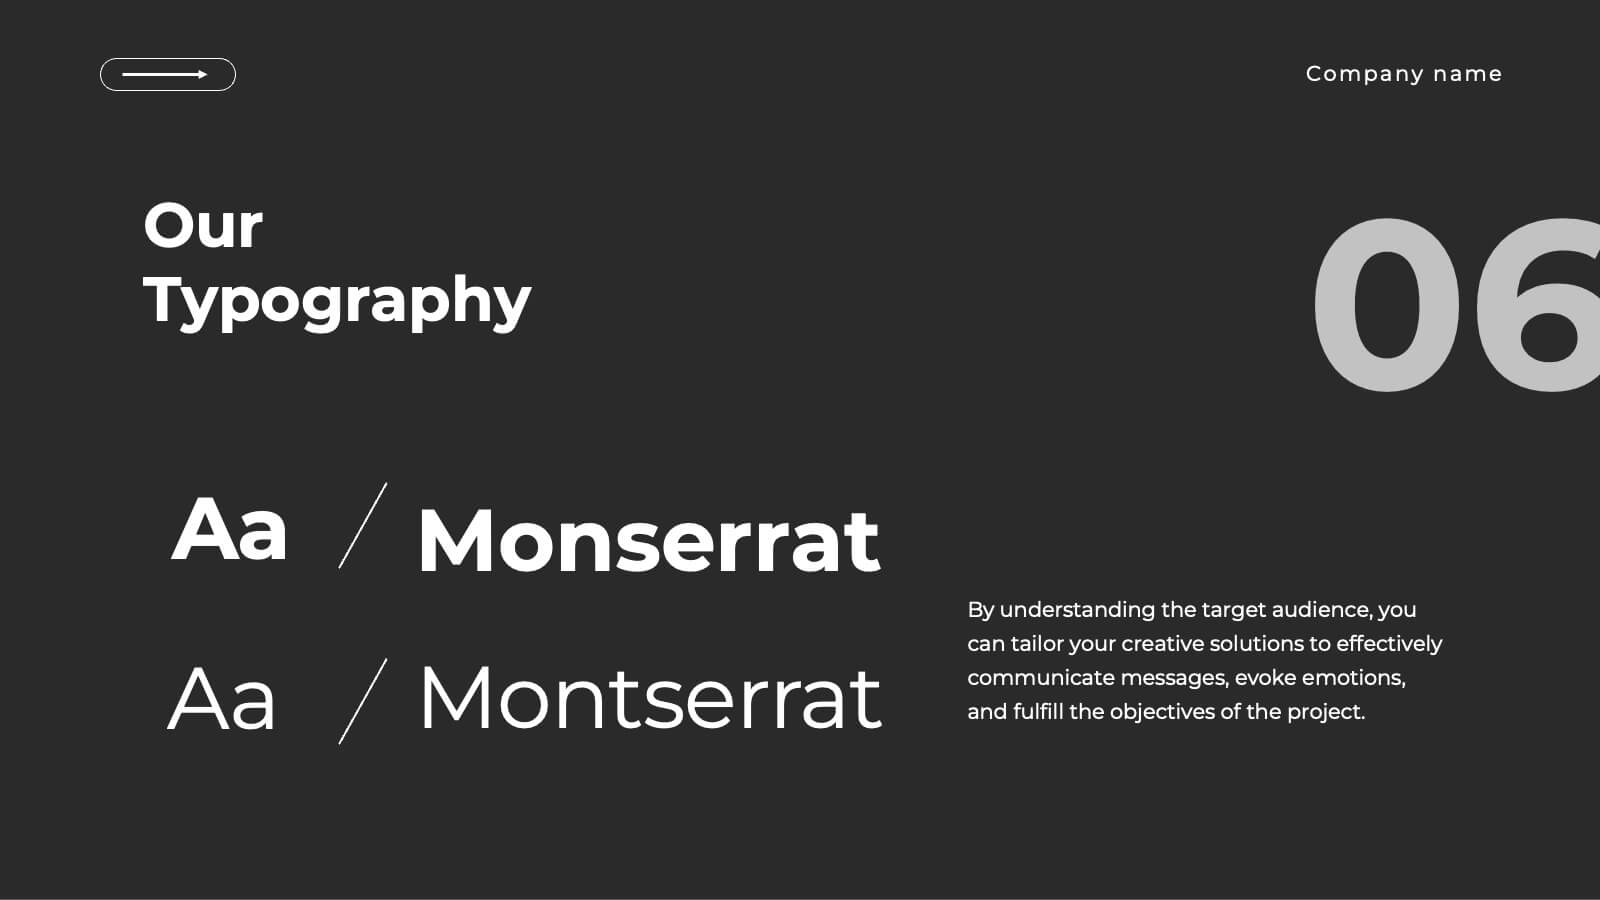
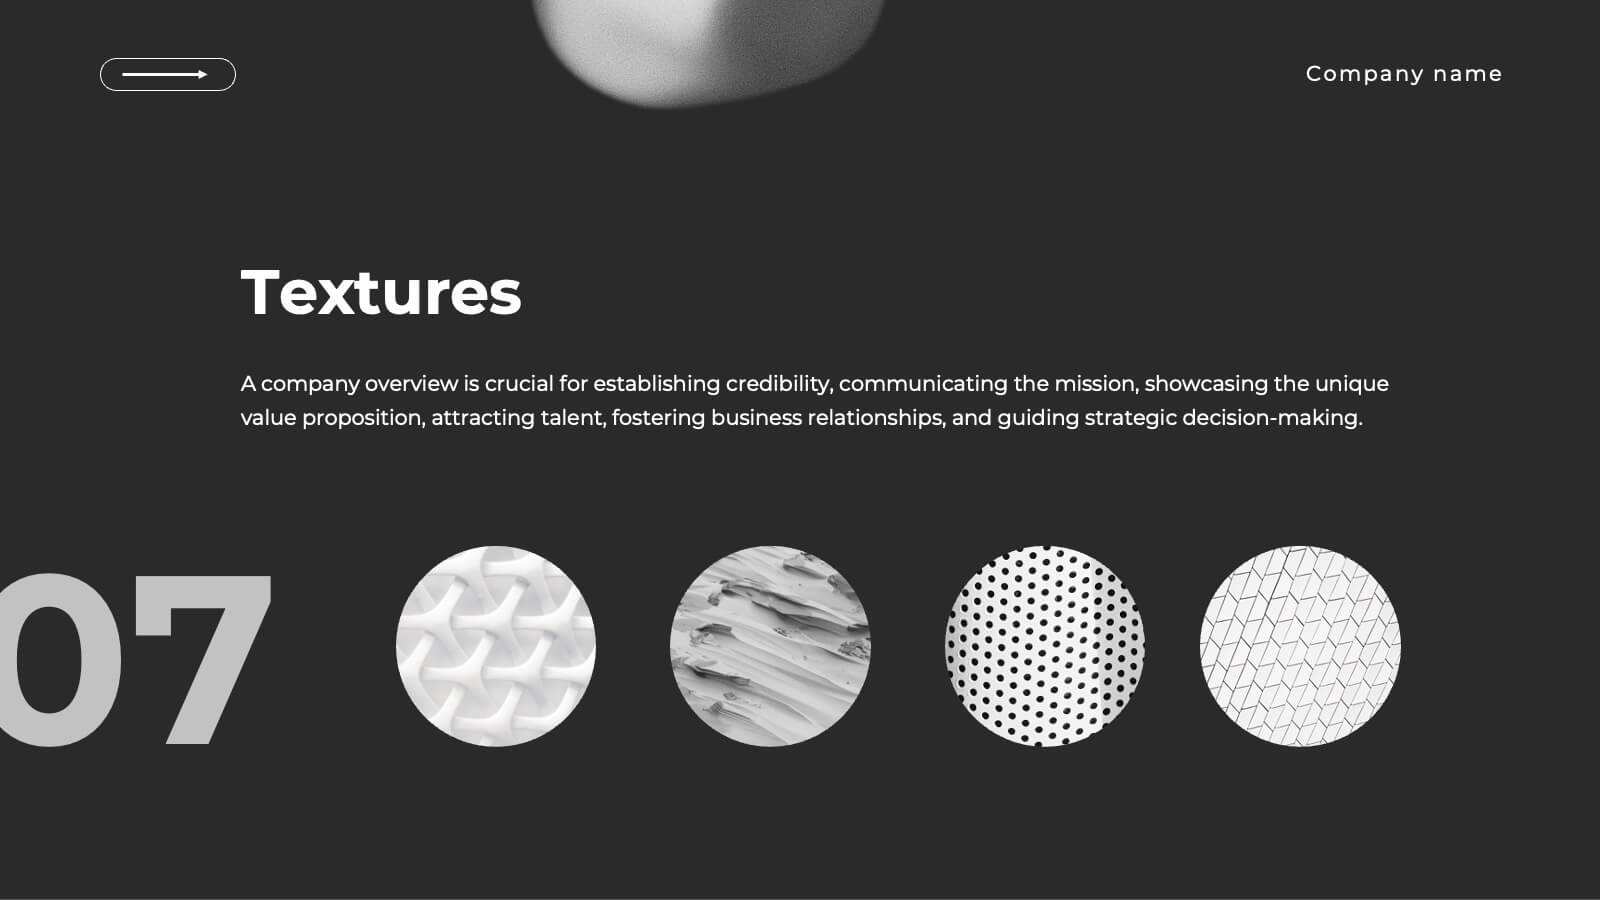
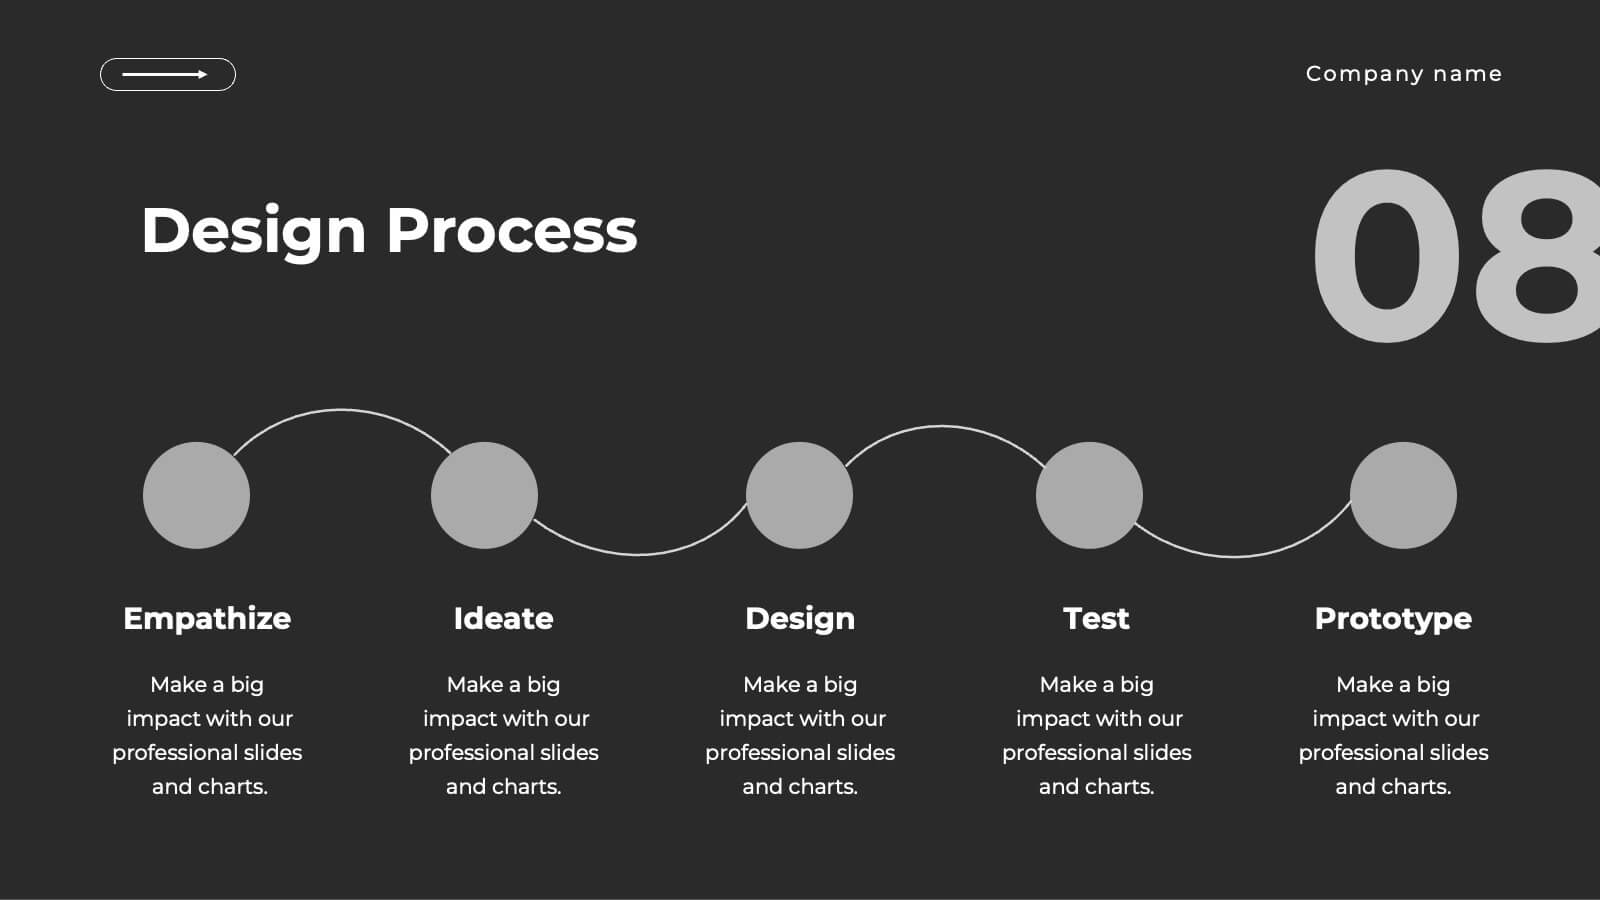
Geometric Design Elements Presentation
The "Geometric Design Elements" presentation template features a modern layout utilizing geometric shapes to organize and present data effectively. Each slide provides a unique configuration of circles or connected shapes, facilitating clear visualization of interconnected topics or categories. These design elements are ideal for displaying business insights, relationships between concepts, or summarizing key points in a visually appealing and easily digestible format. The use of varied colors helps to distinguish between different sections or ideas, enhancing the viewer's ability to follow and absorb the presented information efficiently. This template is suitable for business presentations that require a balance of aesthetic appeal and functional design to communicate complex information clearly.


5 diapositivas
Business Process Cycle Presentation
Energize your message with a clean, visual journey that turns complex workflows into an easy-to-follow cycle. This presentation helps you explain stages, roles, and transitions with clarity while keeping your audience focused on what matters. Designed for business process overviews and strategy talks, it works seamlessly in PowerPoint, Keynote, and Google Slides.


5 diapositivas
Purpose-Driven Mission and Values Presentation
Present your organization’s core purpose and guiding principles with this Purpose-Driven Mission and Values presentation. This clean, flag-style layout is perfect for showcasing five key pillars such as integrity, collaboration, or innovation. Easily customizable in Canva, PowerPoint, or Google Slides to align with your brand.


20 diapositivas
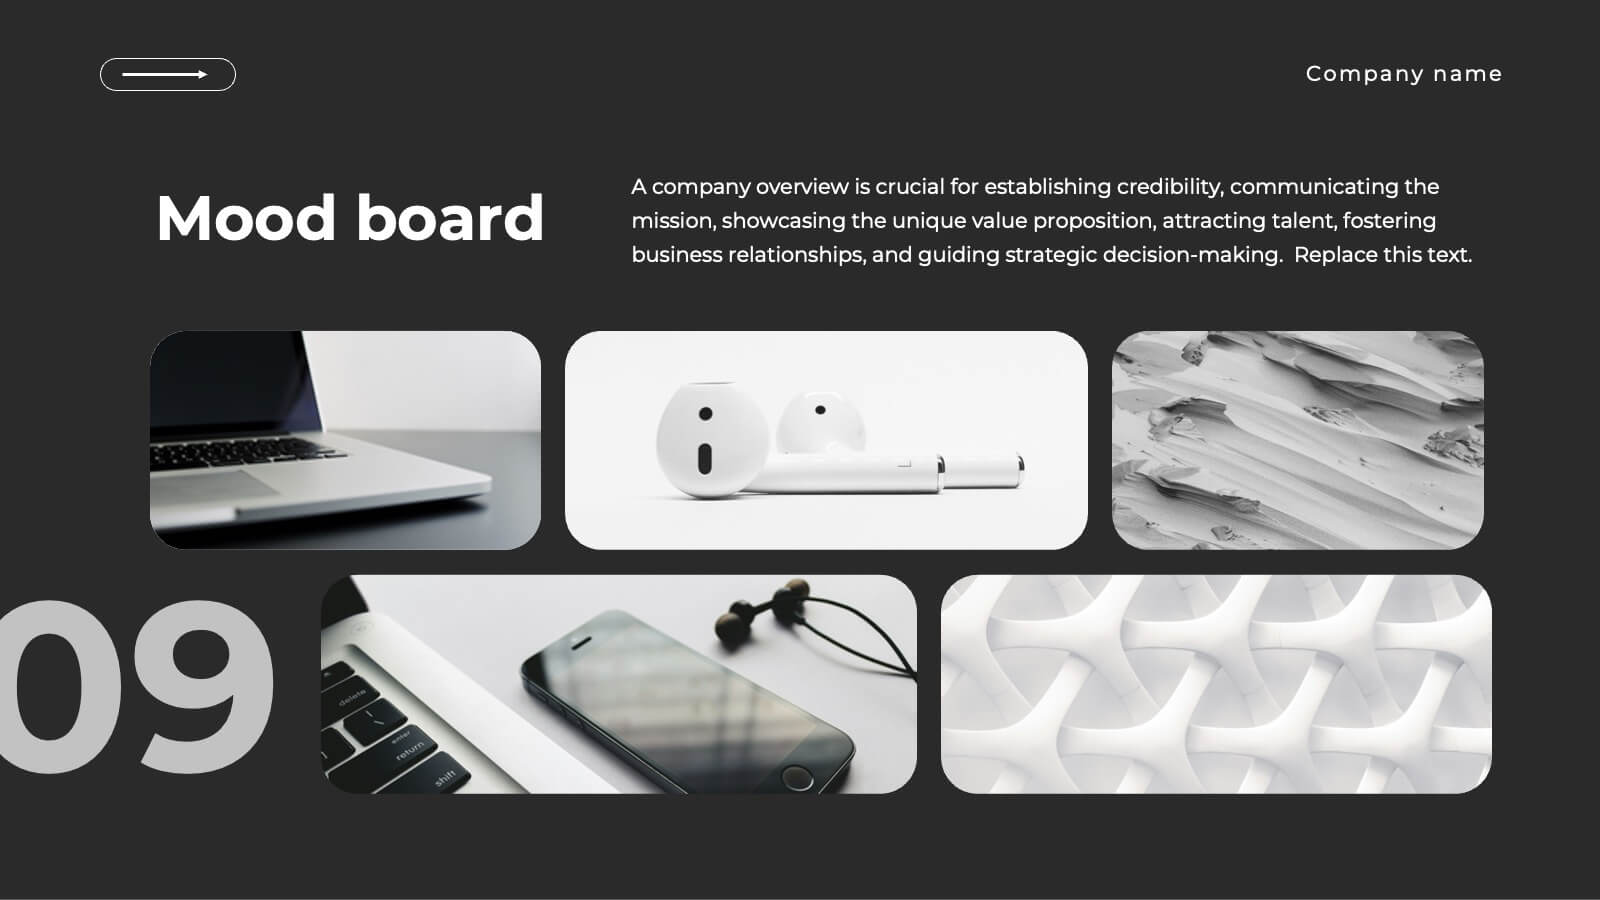
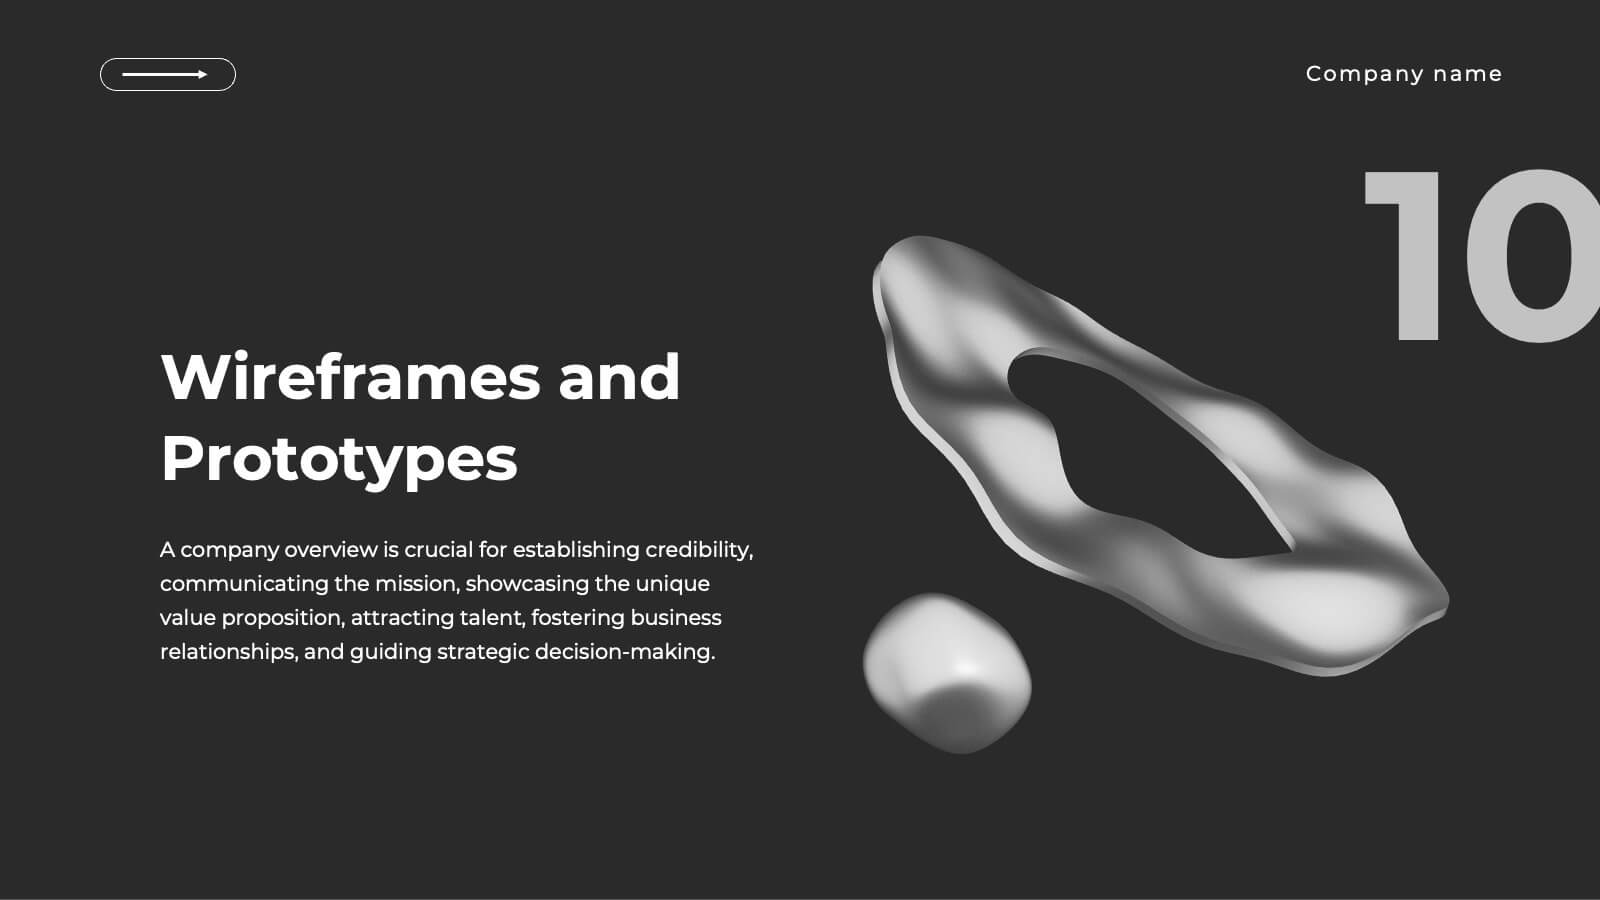
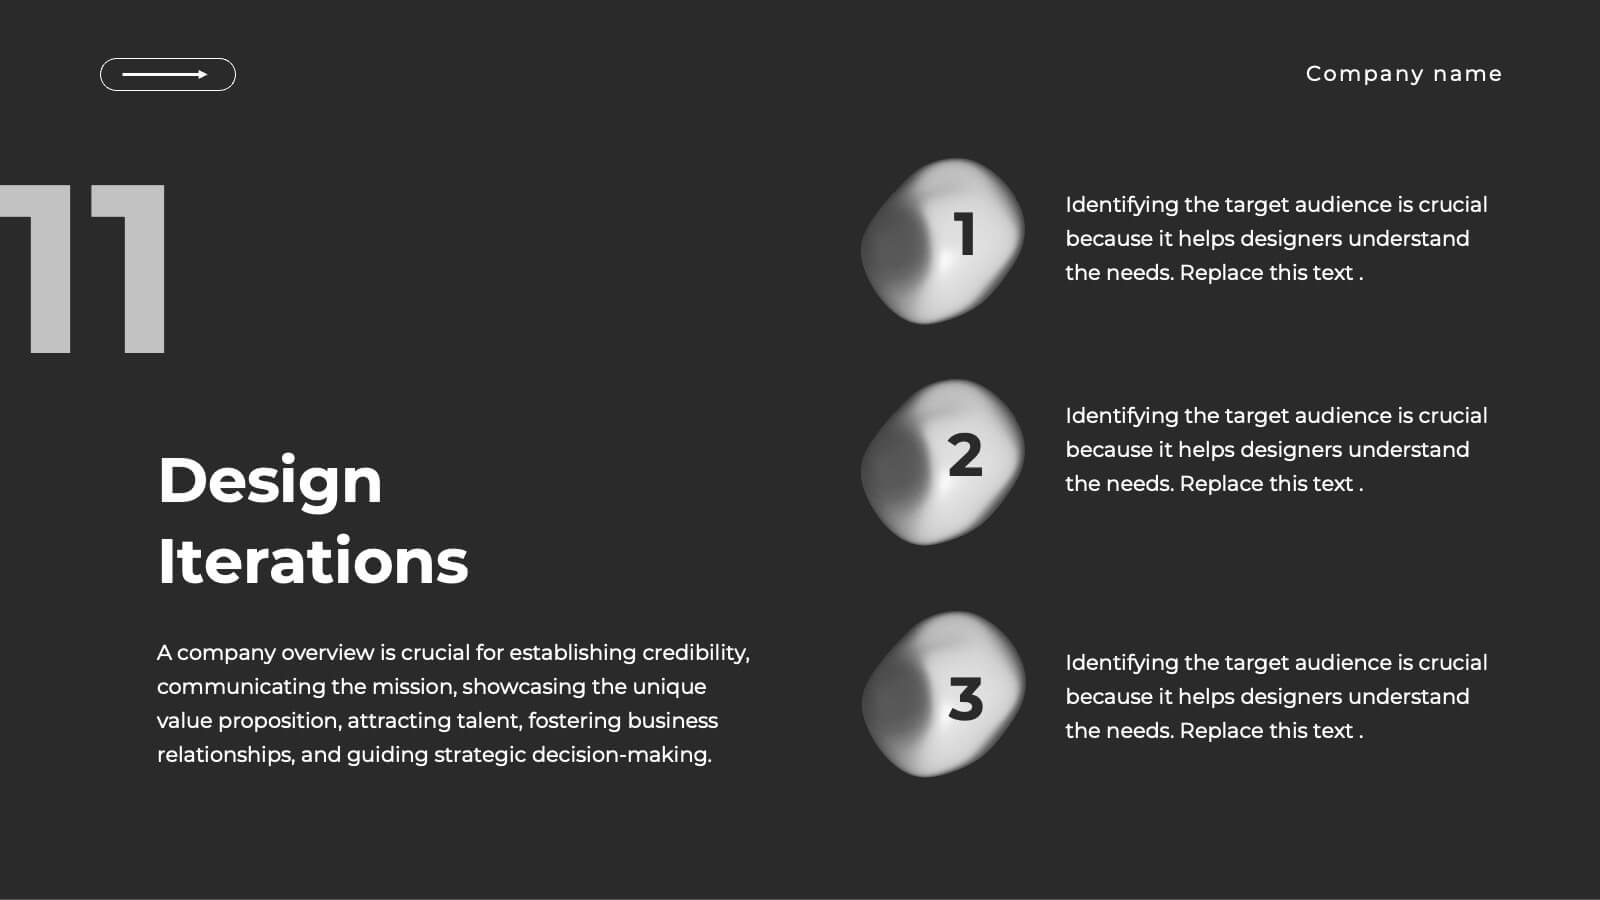
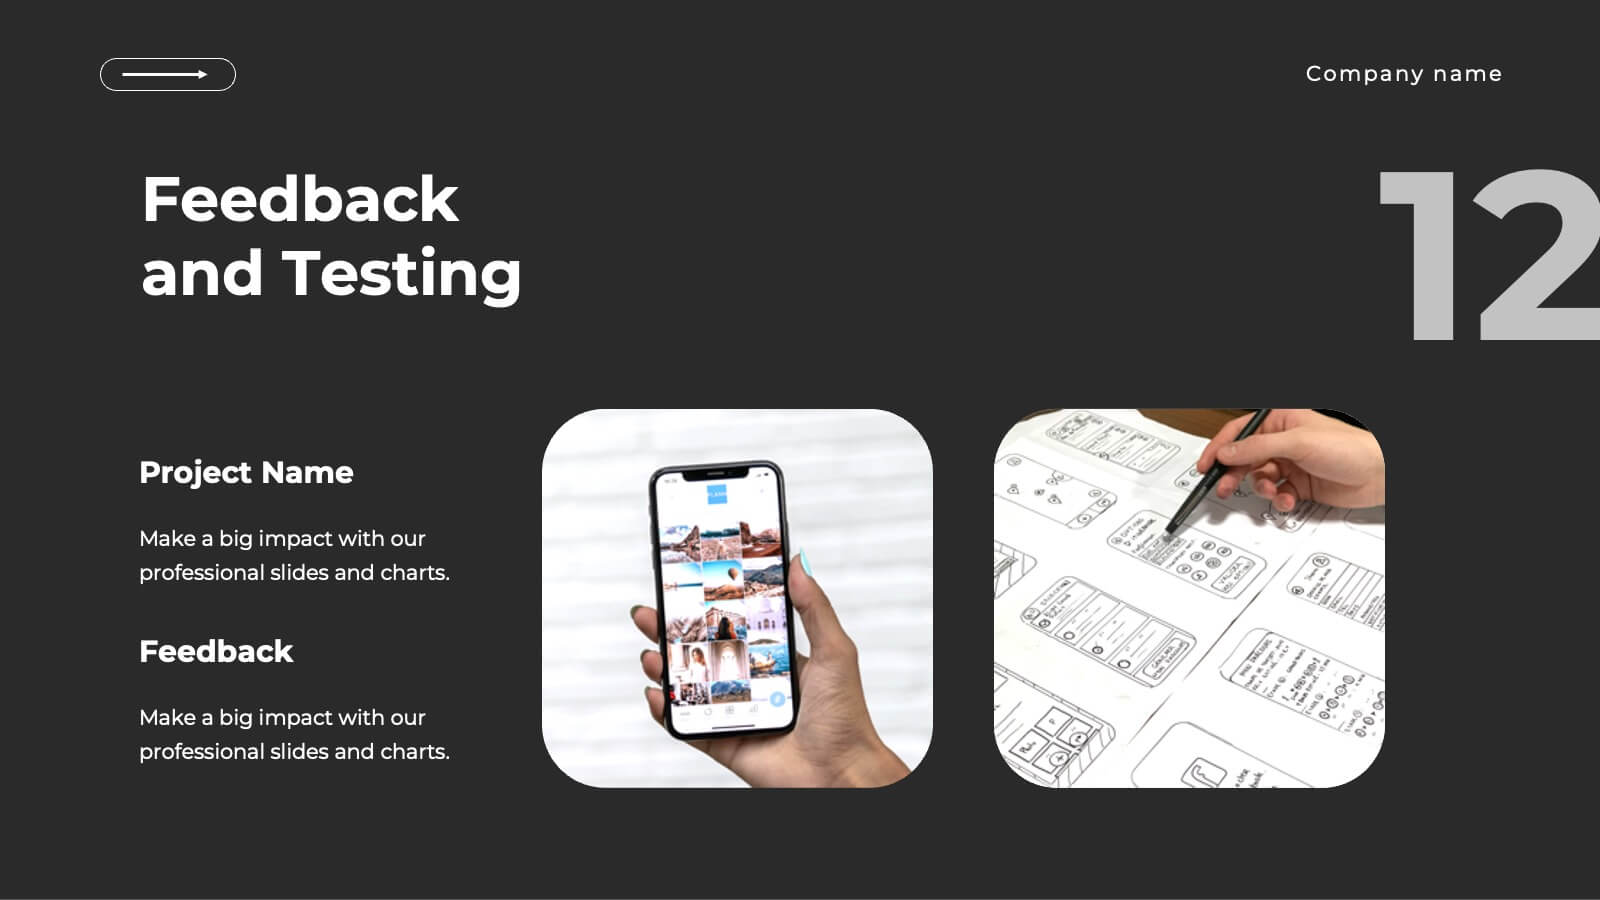
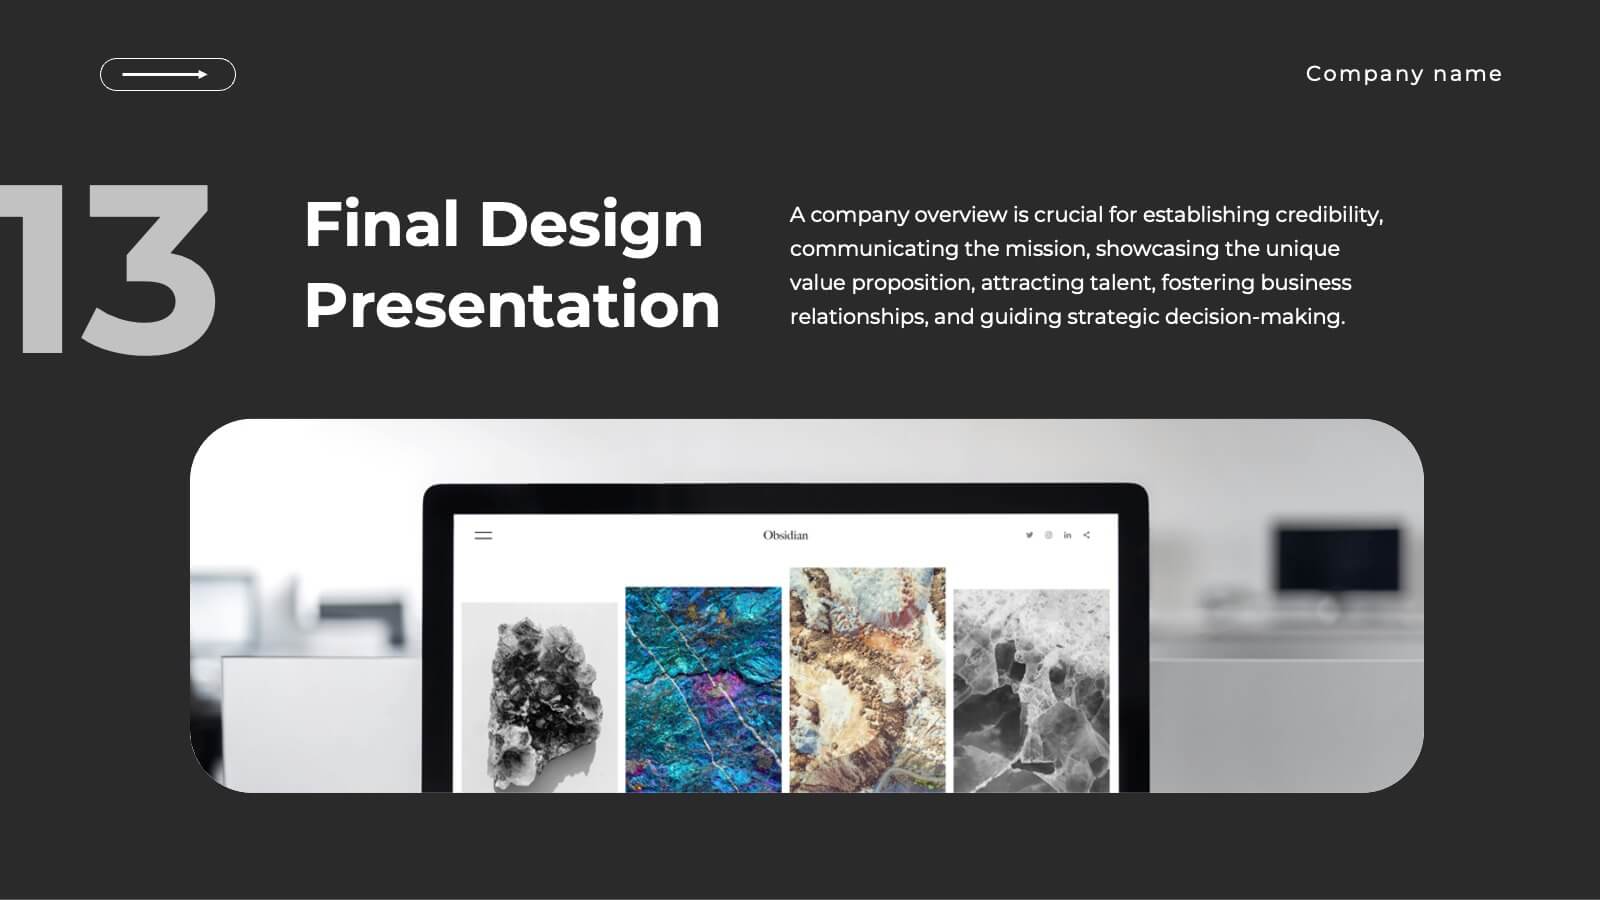
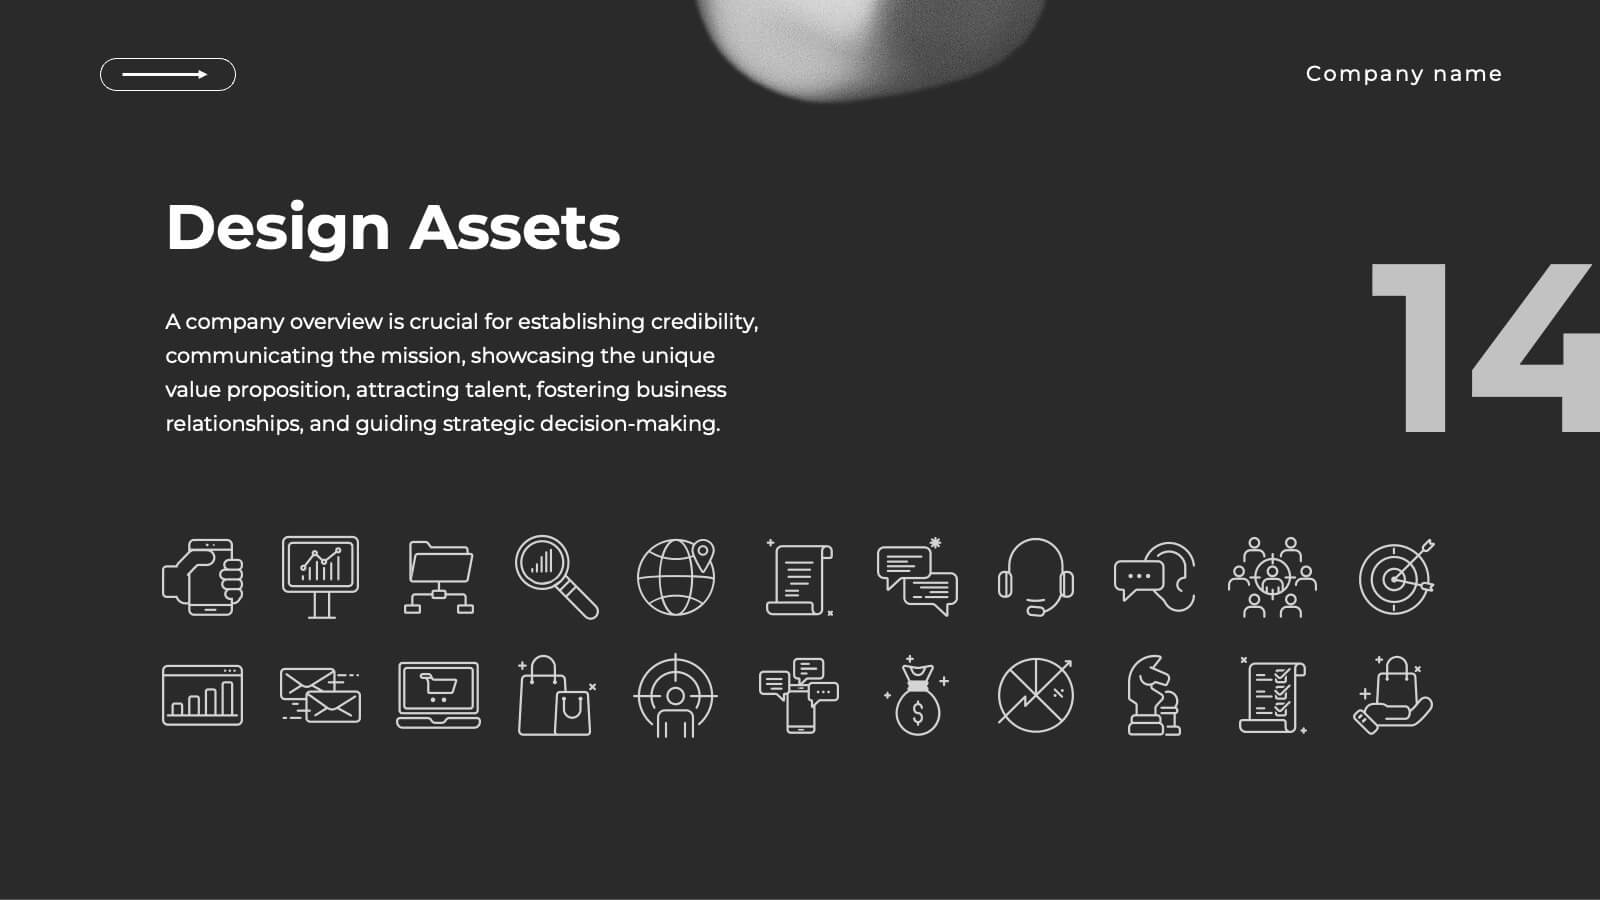
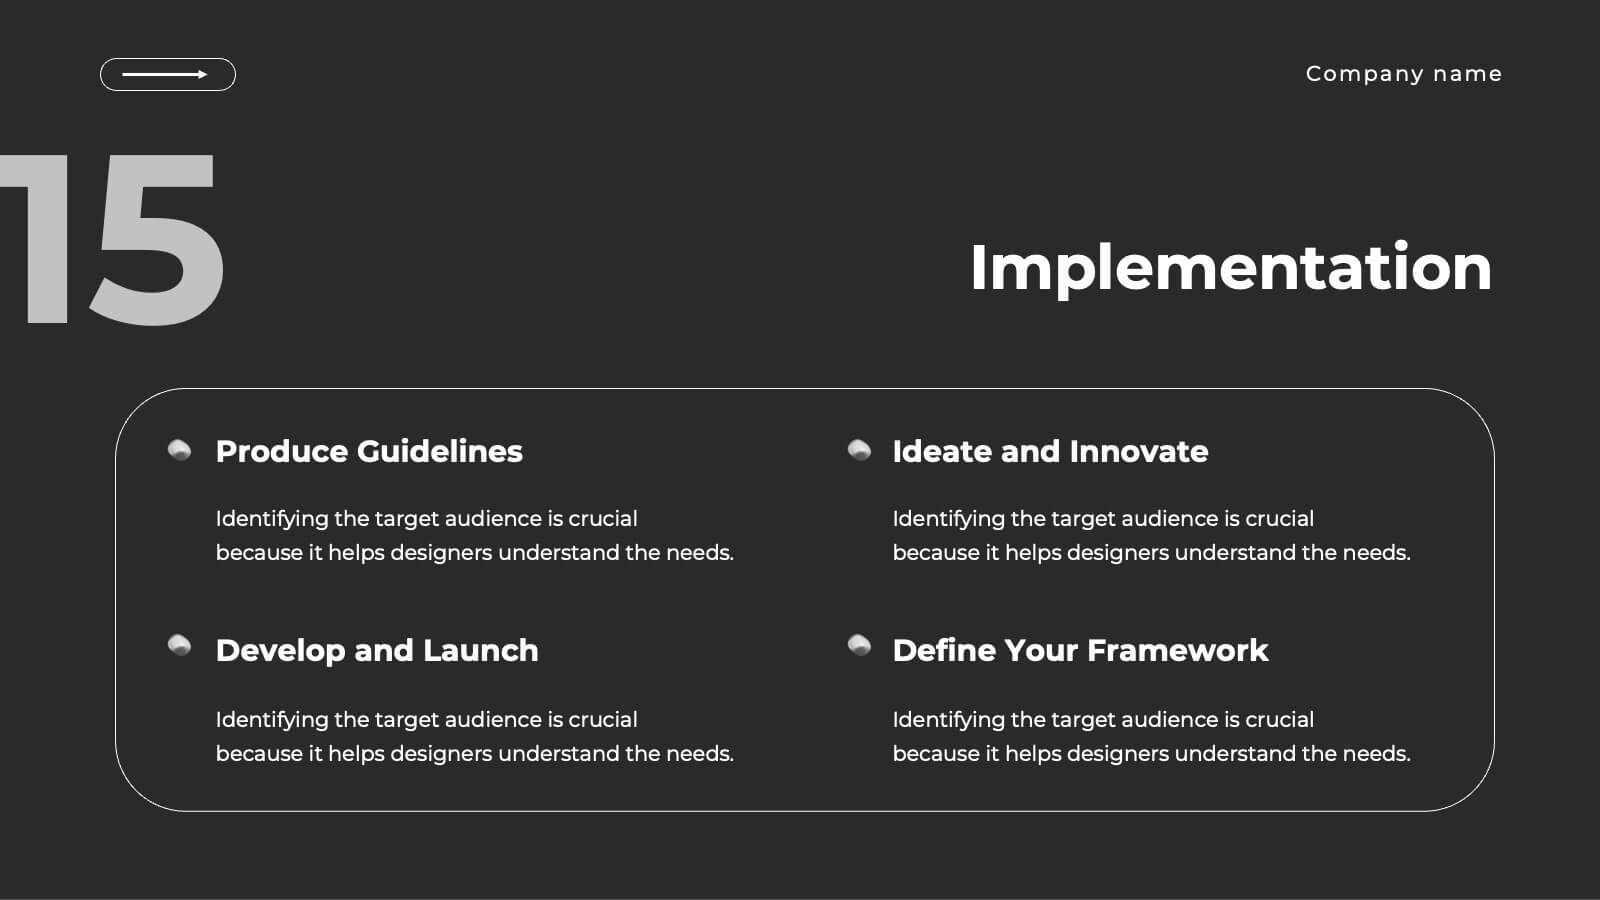
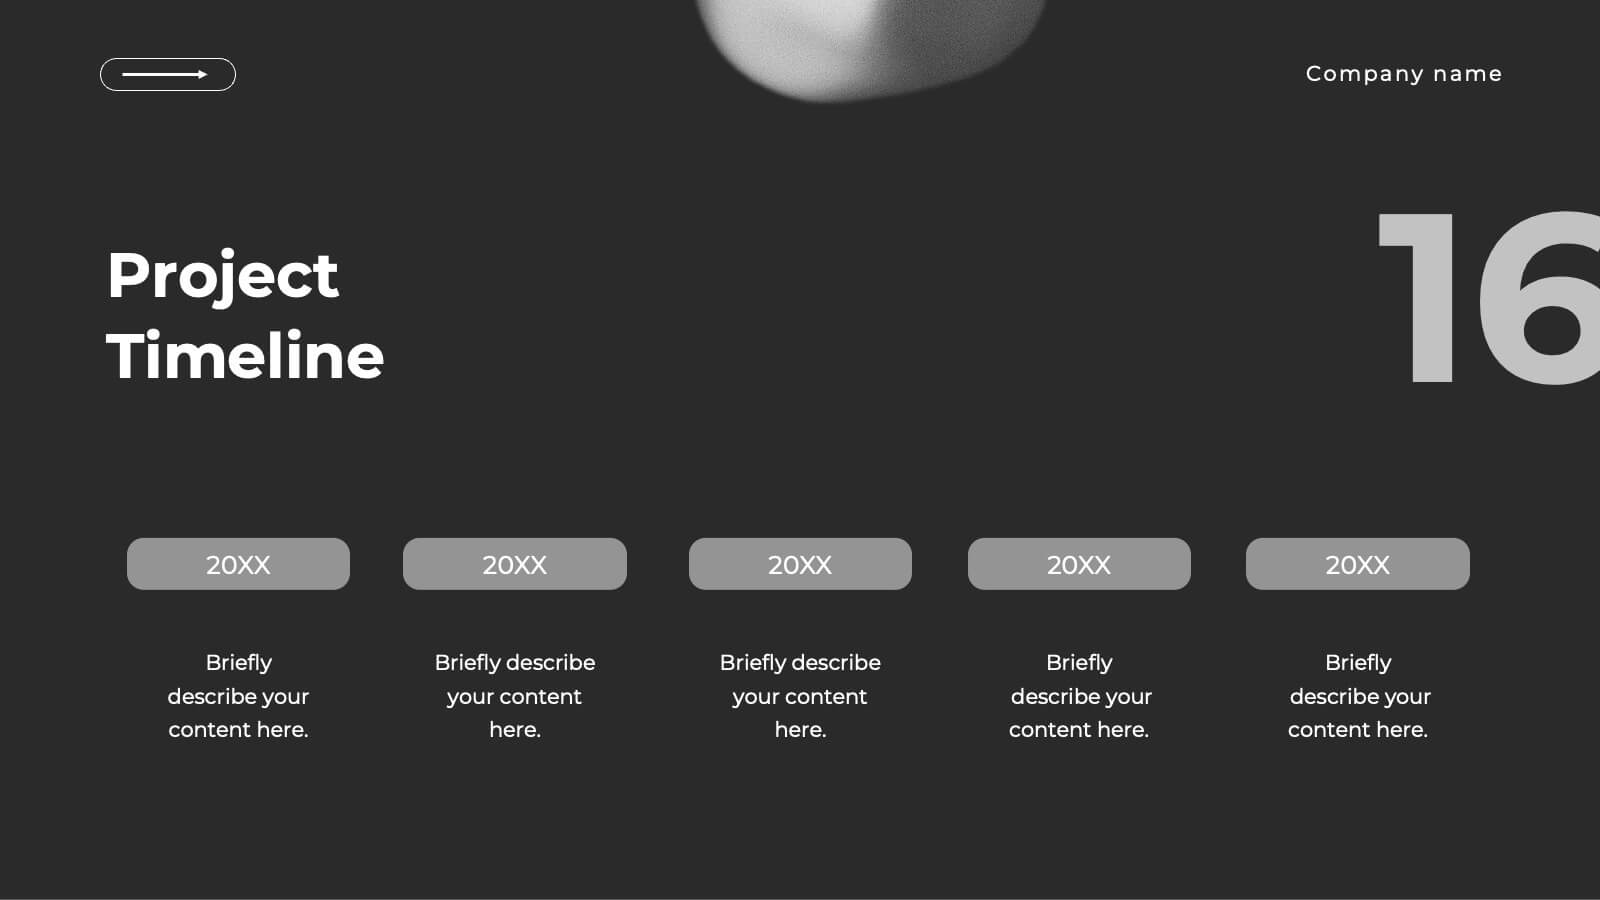
Realm UX UI Design Pitch Deck Presentation
Present your UX/UI design process with this sleek and modern design template! It covers everything from concept development to wireframes, prototypes, design iterations, and final design presentation. Fully customizable and compatible with PowerPoint, Keynote, and Google Slides, it’s perfect for design teams and professionals looking to showcase their creative process effectively.


7 diapositivas
SWOT Analysis Infographic Presentation Template
SWOT analysis is a strategic tool that's usually done to help you determine your company's strengths and weaknesses, as well as opportunities and threats that could affect your company's future. With this template you can visually present the results of a SWOT analysis. They are used too quickly and easily communicate the key findings of the analysis to stakeholders, such as investors and employees. This templates infographics typically include four quadrants, each representing one of the SWOT elements. Use this template to make an easy-to-read infographic of your company's success factors.


24 diapositivas
Machina UX Design Presentation
The UX Design Presentation Template is tailored for user experience projects. Covering sections like user research, personas, wireframes, prototyping, and usability guidelines, it offers a clean, professional layout. Fully customizable and compatible with PowerPoint, Keynote, and Google Slides, it's perfect for showcasing your design process and insights with clarity.


5 diapositivas
Insurance Policy Infographics
Dive into the intricacies of insurance with our insurance policy infographics. Rendered in a professional palette of blue and an array of engaging colors, this creative, vertical template simplifies the often complex world of insurance policies. Ideal for insurance agents, companies, and educators, it provides a visual aid to explain coverage specifics, terms, and conditions or to compare policy offerings clearly and effectively. The infographic includes aesthetically pleasing graphics, symbolic icons, and designated spaces for factual data, making it a quintessential tool for enhancing audience understanding and promoting informed decision-making.


6 diapositivas
Process Flow Charts Presentation
Bring your workflow to life with a clean, modern layout that transforms complex steps into a simple visual path. This presentation helps teams explain processes, percentages, and progress with clarity and ease, making it ideal for planning and optimization. Fully compatible with PowerPoint, Keynote, and Google Slides.


5 diapositivas
Strategic Blue Ocean Shift Presentation
Dive into bold new thinking with a slide that makes strategic transformation feel clear, focused, and actionable. This presentation breaks down key decisions that help teams shift from competitive pressure to value innovation, making complex choices easy to visualize and present. Fully compatible with PowerPoint, Keynote, and Google Slides.


6 diapositivas
Progressive Insurance Infographics
Explore Progressive Insurance with our customizable infographic template. This template is fully compatible with popular presentation software like PowerPoint, Keynote, and Google Slides, allowing you to easily customize it to showcase various aspects of Progressive Insurance, its services, and achievements. The Progressive Insurance infographic template offers a visually engaging platform to highlight the company's history, insurance offerings, customer satisfaction, and industry leadership. Whether you're an insurance professional, a potential customer, or a financial analyst, this template provides a user-friendly canvas to create informative presentations and educational materials about Progressive Insurance. Learn more about Progressive Insurance with this SEO-optimized infographic template, thoughtfully designed for clarity and ease of use. Customize it to showcase Progressive's unique features, coverage options, and innovations, making it a valuable resource for sharing information about the company with your audience. Start crafting your personalized infographic today to explore the world of Progressive Insurance.


23 diapositivas
Cosmira Digital Strategy Presentation
This Digital Strategy Presentation provides a comprehensive framework for outlining business objectives, competitive analysis, and growth opportunities. It includes key sections such as SWOT analysis, performance metrics, and implementation plans. Ideal for businesses and marketers, the slides are fully editable and compatible with PowerPoint, Keynote, and Google Slides.


7 diapositivas
Team Work Infographic Presentation Template
Teamwork is a method of working collaboratively in order to achieve a goal. Members of a team can accomplish more than they could individually through their combined talents, knowledge and experience. This template can be used to help explain what teamwork is, what it looks like, why it’s important, and how you can cultivate it within your organization. This teamwork template is designed to encourage communication. Use this template to help evaluate what areas your team can improve on and how they can do so. Point out exactly how vital teamwork is to the success of your business.