


Características


¿Tienes alguna pregunta?
Recomendar


6 diapositivas
Bubble Map Ideas Infographics
Visualize your ideas creatively with our Bubble Map Ideas infographic template. This template is fully compatible with popular presentation software like PowerPoint, Keynote, and Google Slides, allowing you to easily customize it to brainstorm and organize your concepts using a bubble map format. The Bubble Map Ideas infographic template offers a visually engaging platform to brainstorm and categorize ideas, concepts, and relationships in a structured and visually appealing manner. Whether you're a creative thinker, project manager, or educator, this template provides a user-friendly canvas to create informative presentations and visualizations of your ideas. Elevate your idea generation and organization with this SEO-optimized Bubble Map Ideas infographic template, thoughtfully designed for clarity and ease of use. Customize it to map out your ideas, prioritize them, and identify key connections, ensuring that your creative process becomes more organized and productive. Start crafting your personalized infographic today to bring your ideas to life.


7 diapositivas
Data-Driven Market Segmentation Presentation
Visualize customer segments with clarity using the Data-Driven Market Segmentation Presentation. This template features a structured, interconnected diagram with six customizable data points, ideal for audience targeting, persona mapping, or campaign planning. Clean, modern, and easy to edit in PowerPoint, Keynote, or Google Slides.


5 diapositivas
Business People Collaboration Overview Presentation
Showcase team dynamics with the Business People Collaboration Overview Presentation. This template uses a clean hexagon layout to highlight roles, responsibilities, or partnerships between individuals or departments. Ideal for collaboration strategies, organizational structures, or cross-functional workflows. Fully editable in PowerPoint, Canva, and Google Slides.


5 diapositivas
Oil Industry Trends Infographics
The oil industry, also known as the petroleum industry, is a crucial sector of the global economy that involves exploration, production, refining, and distribution of petroleum products. These infographic templates are designed to showcase key trends and insights in the oil industry. They aims to present complex information in a clear and visually appealing manner, making it easy for your viewers to grasp important concepts and trends in the industry. This is perfect for anyone interested in understanding the trends and dynamics shaping the oil industry. Compatible with Powerpoint, Keynote, and Google Slides.


26 diapositivas
Summer Sale Presentation
Soak up the bright, sunny vibes of a presentation template that’s perfectly tailor-made for the lively summer season. Its radiant design, infused with the essence of summer sales and tropical aesthetics, is a perfect match for retail campaigns, travel promotions, or any topic that aims to bring the sizzle of summer into a room. Bright colors, playful graphics, and beach-inspired backgrounds set the stage for vibrant storytelling, whether you're introducing a seasonal team, showcasing hot vacation spots, or highlighting the latest summer fashion. The template not only captures the casual, cheerful spirit of the season but also ensures that your content makes a splash with clear, concise data displays and infographics. It’s a breeze to use across various platforms like PowerPoint, Keynote, and Google Slides, ensuring your summer message is as refreshing as a cool ocean wave.


10 diapositivas
Brainstorming and Creative Idea Generation Presentation
Unlock Brainstorming and Creative Idea Generation with this visually engaging template designed to help teams capture, refine, and present ideas effectively. Featuring gear-themed graphics, color-coded sections, and structured placeholders, this template is ideal for workshops, innovation meetings, and design thinking sessions. Fully customizable and compatible with PowerPoint, Keynote, and Google Slides, ensuring seamless integration into your workflow.


4 diapositivas
Root Cause Analysis for Problem Solving
Tackle problems from the inside out with this structured and easy-to-follow layout. This root cause analysis template helps you clearly map out underlying issues and visualize their impact in one slide. Ideal for team discussions, audits, and presentations—fully editable in PowerPoint, Keynote, and Google Slides for maximum flexibility.


5 diapositivas
Environmental and Social Sustainability Presentation
Explore the synergy of environmental protection and social responsibility with our Environmental and Social Sustainability Presentation template. This visual aid is a compelling tool for discussing key strategies in balancing ecological and social impacts, providing a roadmap for sustainable business practices. Ideal for engaging audiences in discussions about conservation and community engagement, the template is fully compatible with PowerPoint, Keynote, and Google Slides, ensuring a smooth presentation experience in any setting.


21 diapositivas
Mystic UX Research Report Presentation
Present your UX research with precision using this sleek and engaging report template! It covers key elements like user research, wireframes, prototyping, testing, and branding guidelines, providing a comprehensive overview of the design process. Ideal for client reviews or team discussions, this template is fully compatible with PowerPoint, Keynote, and Google Slides.


7 diapositivas
Customer Journey Infographic Presentation Template
A Customer Journey Infographic is an illustration of the different stages a customer goes through when interacting with a business or organization. It is a way to show the customer's experience with the business or organization, from the initial contact to the post-purchase follow-up. This template is perfect for showing how people interact with your business, the emotions and feedback of your customer at each stage. This template includes lots of photo layouts, charts, and timelines that you can customize to show the different stages a customer goes through on their journey with your business.


6 diapositivas
Platform-Specific Social Strategy Presentation
Break down your marketing approach by channel using this clear, platform-focused timeline. Highlight strategies for TikTok, Facebook, Instagram, X, and email in a linear, easy-to-read format. Ideal for digital marketers, content teams, and social media managers. Fully editable in PowerPoint, Keynote, and Google Slides to match your brand and strategy.

20 diapositivas
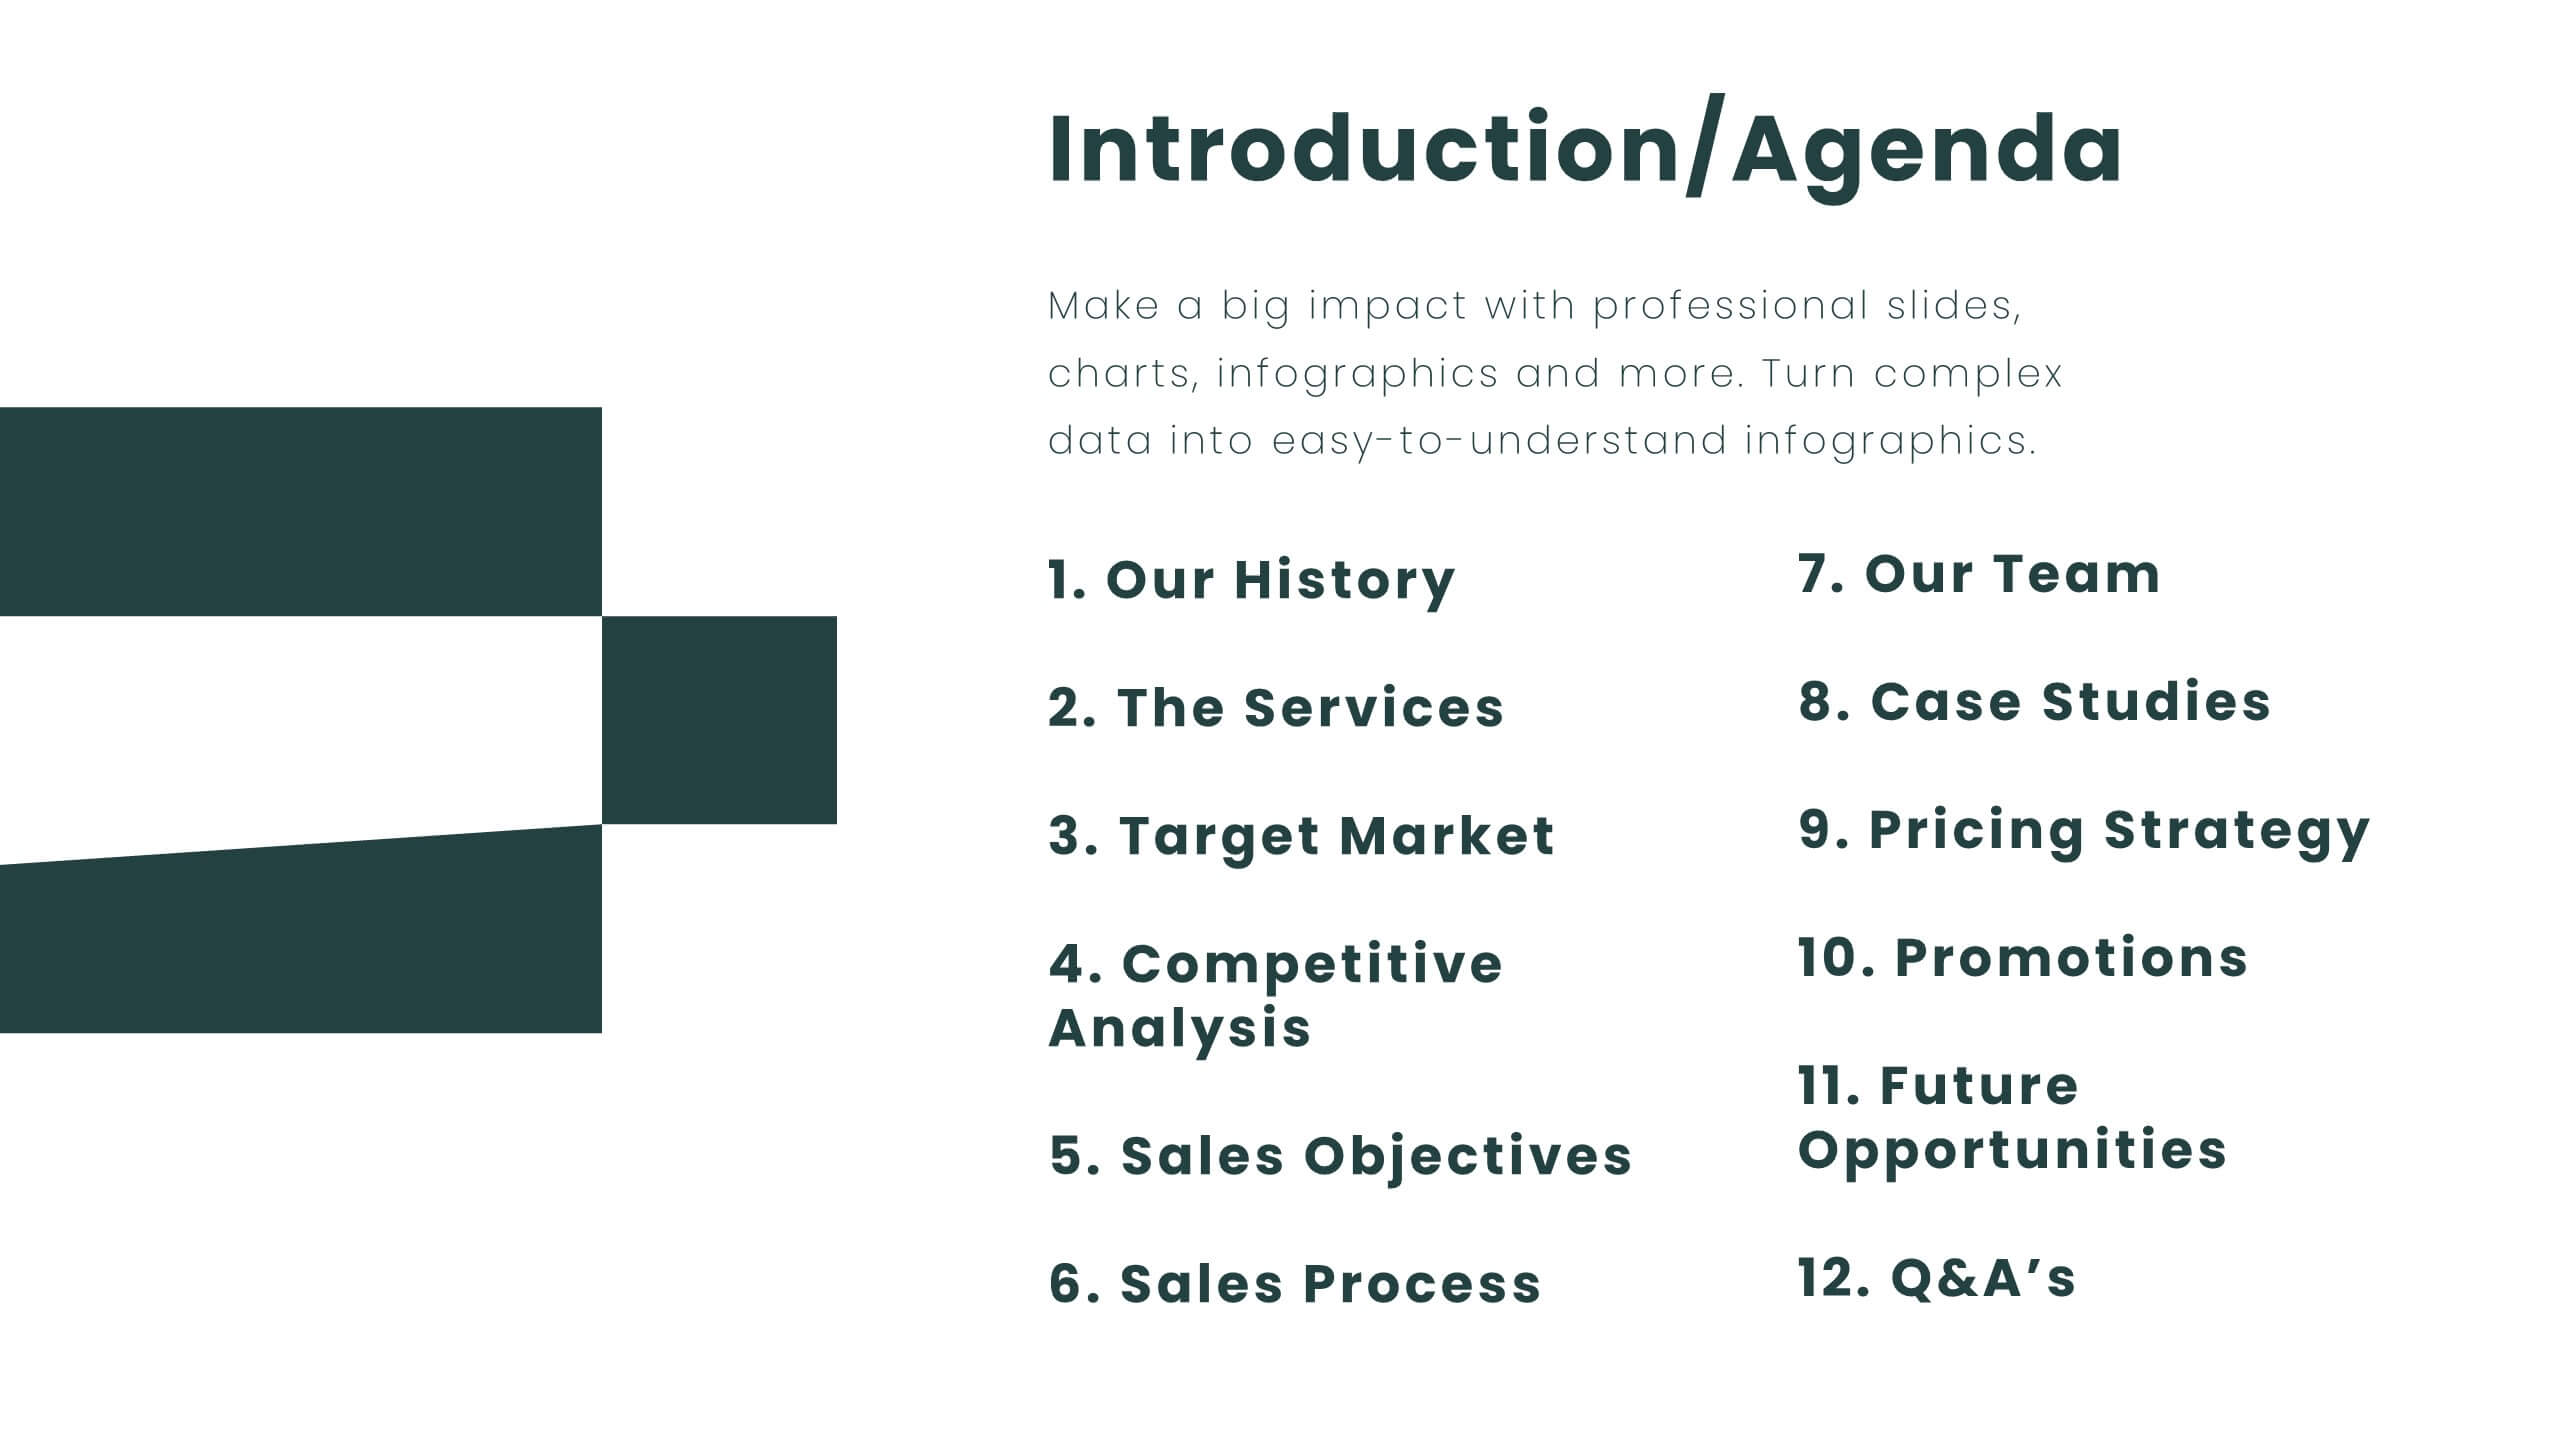
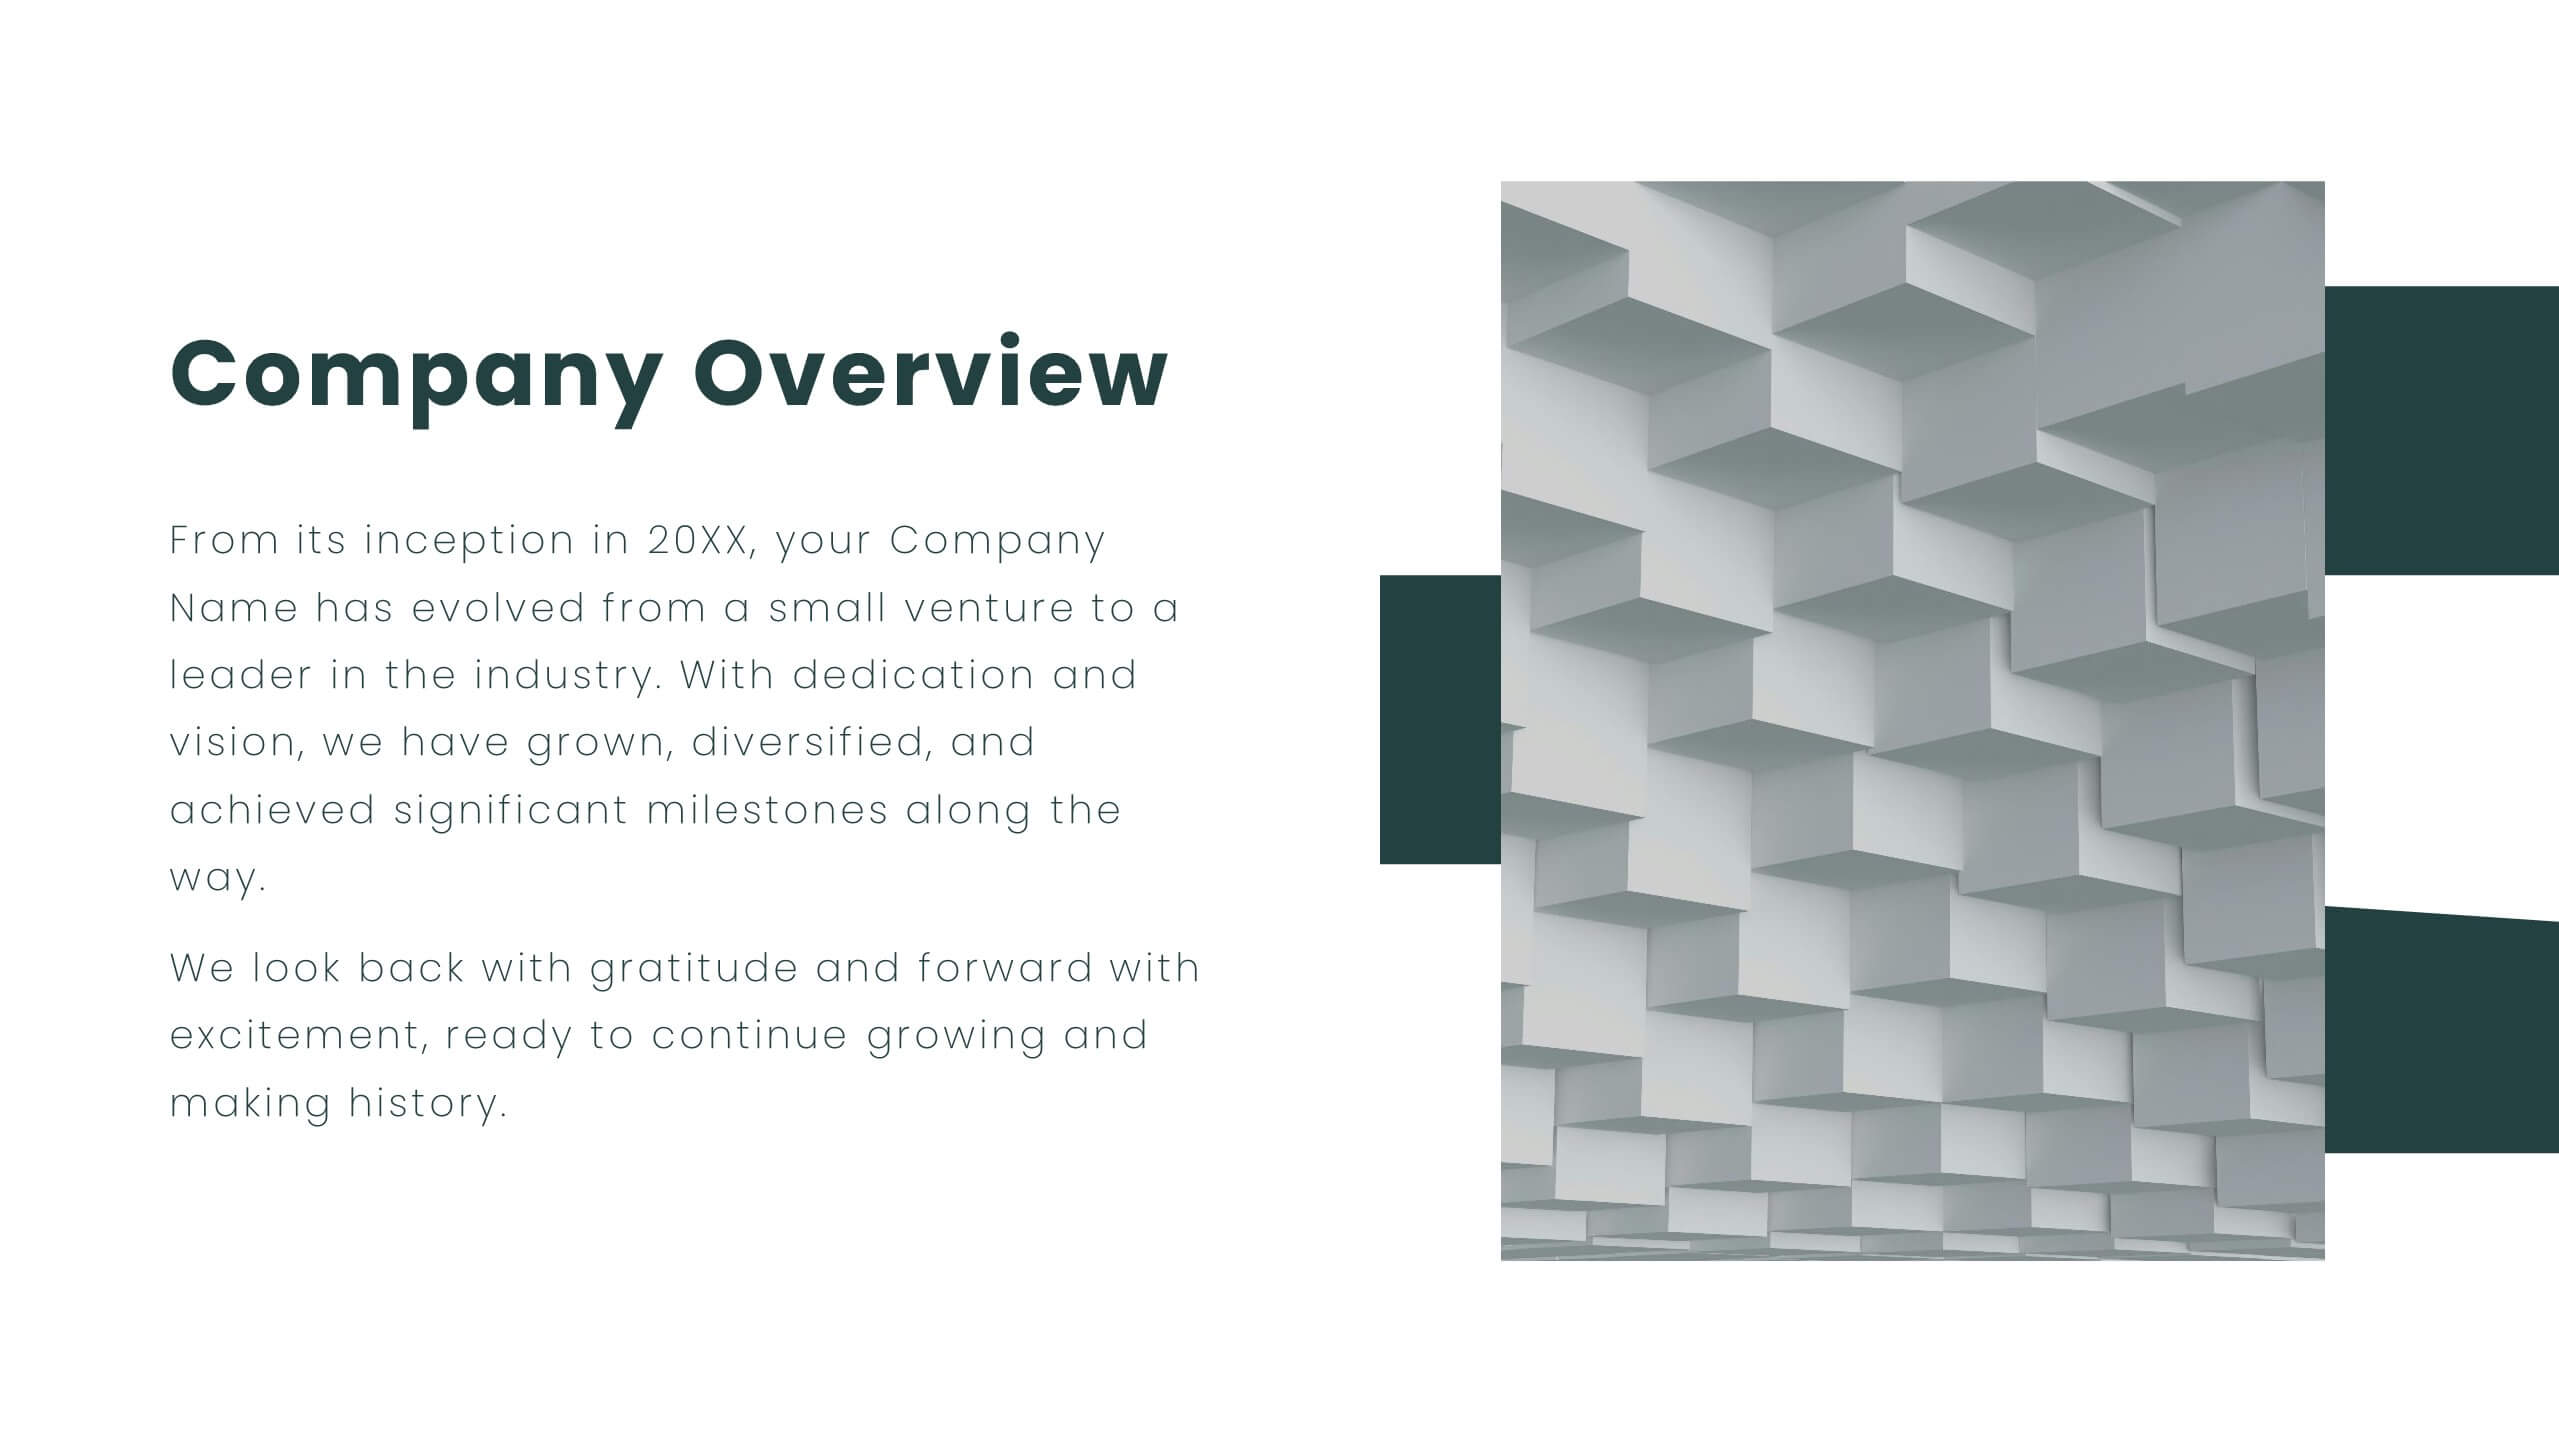
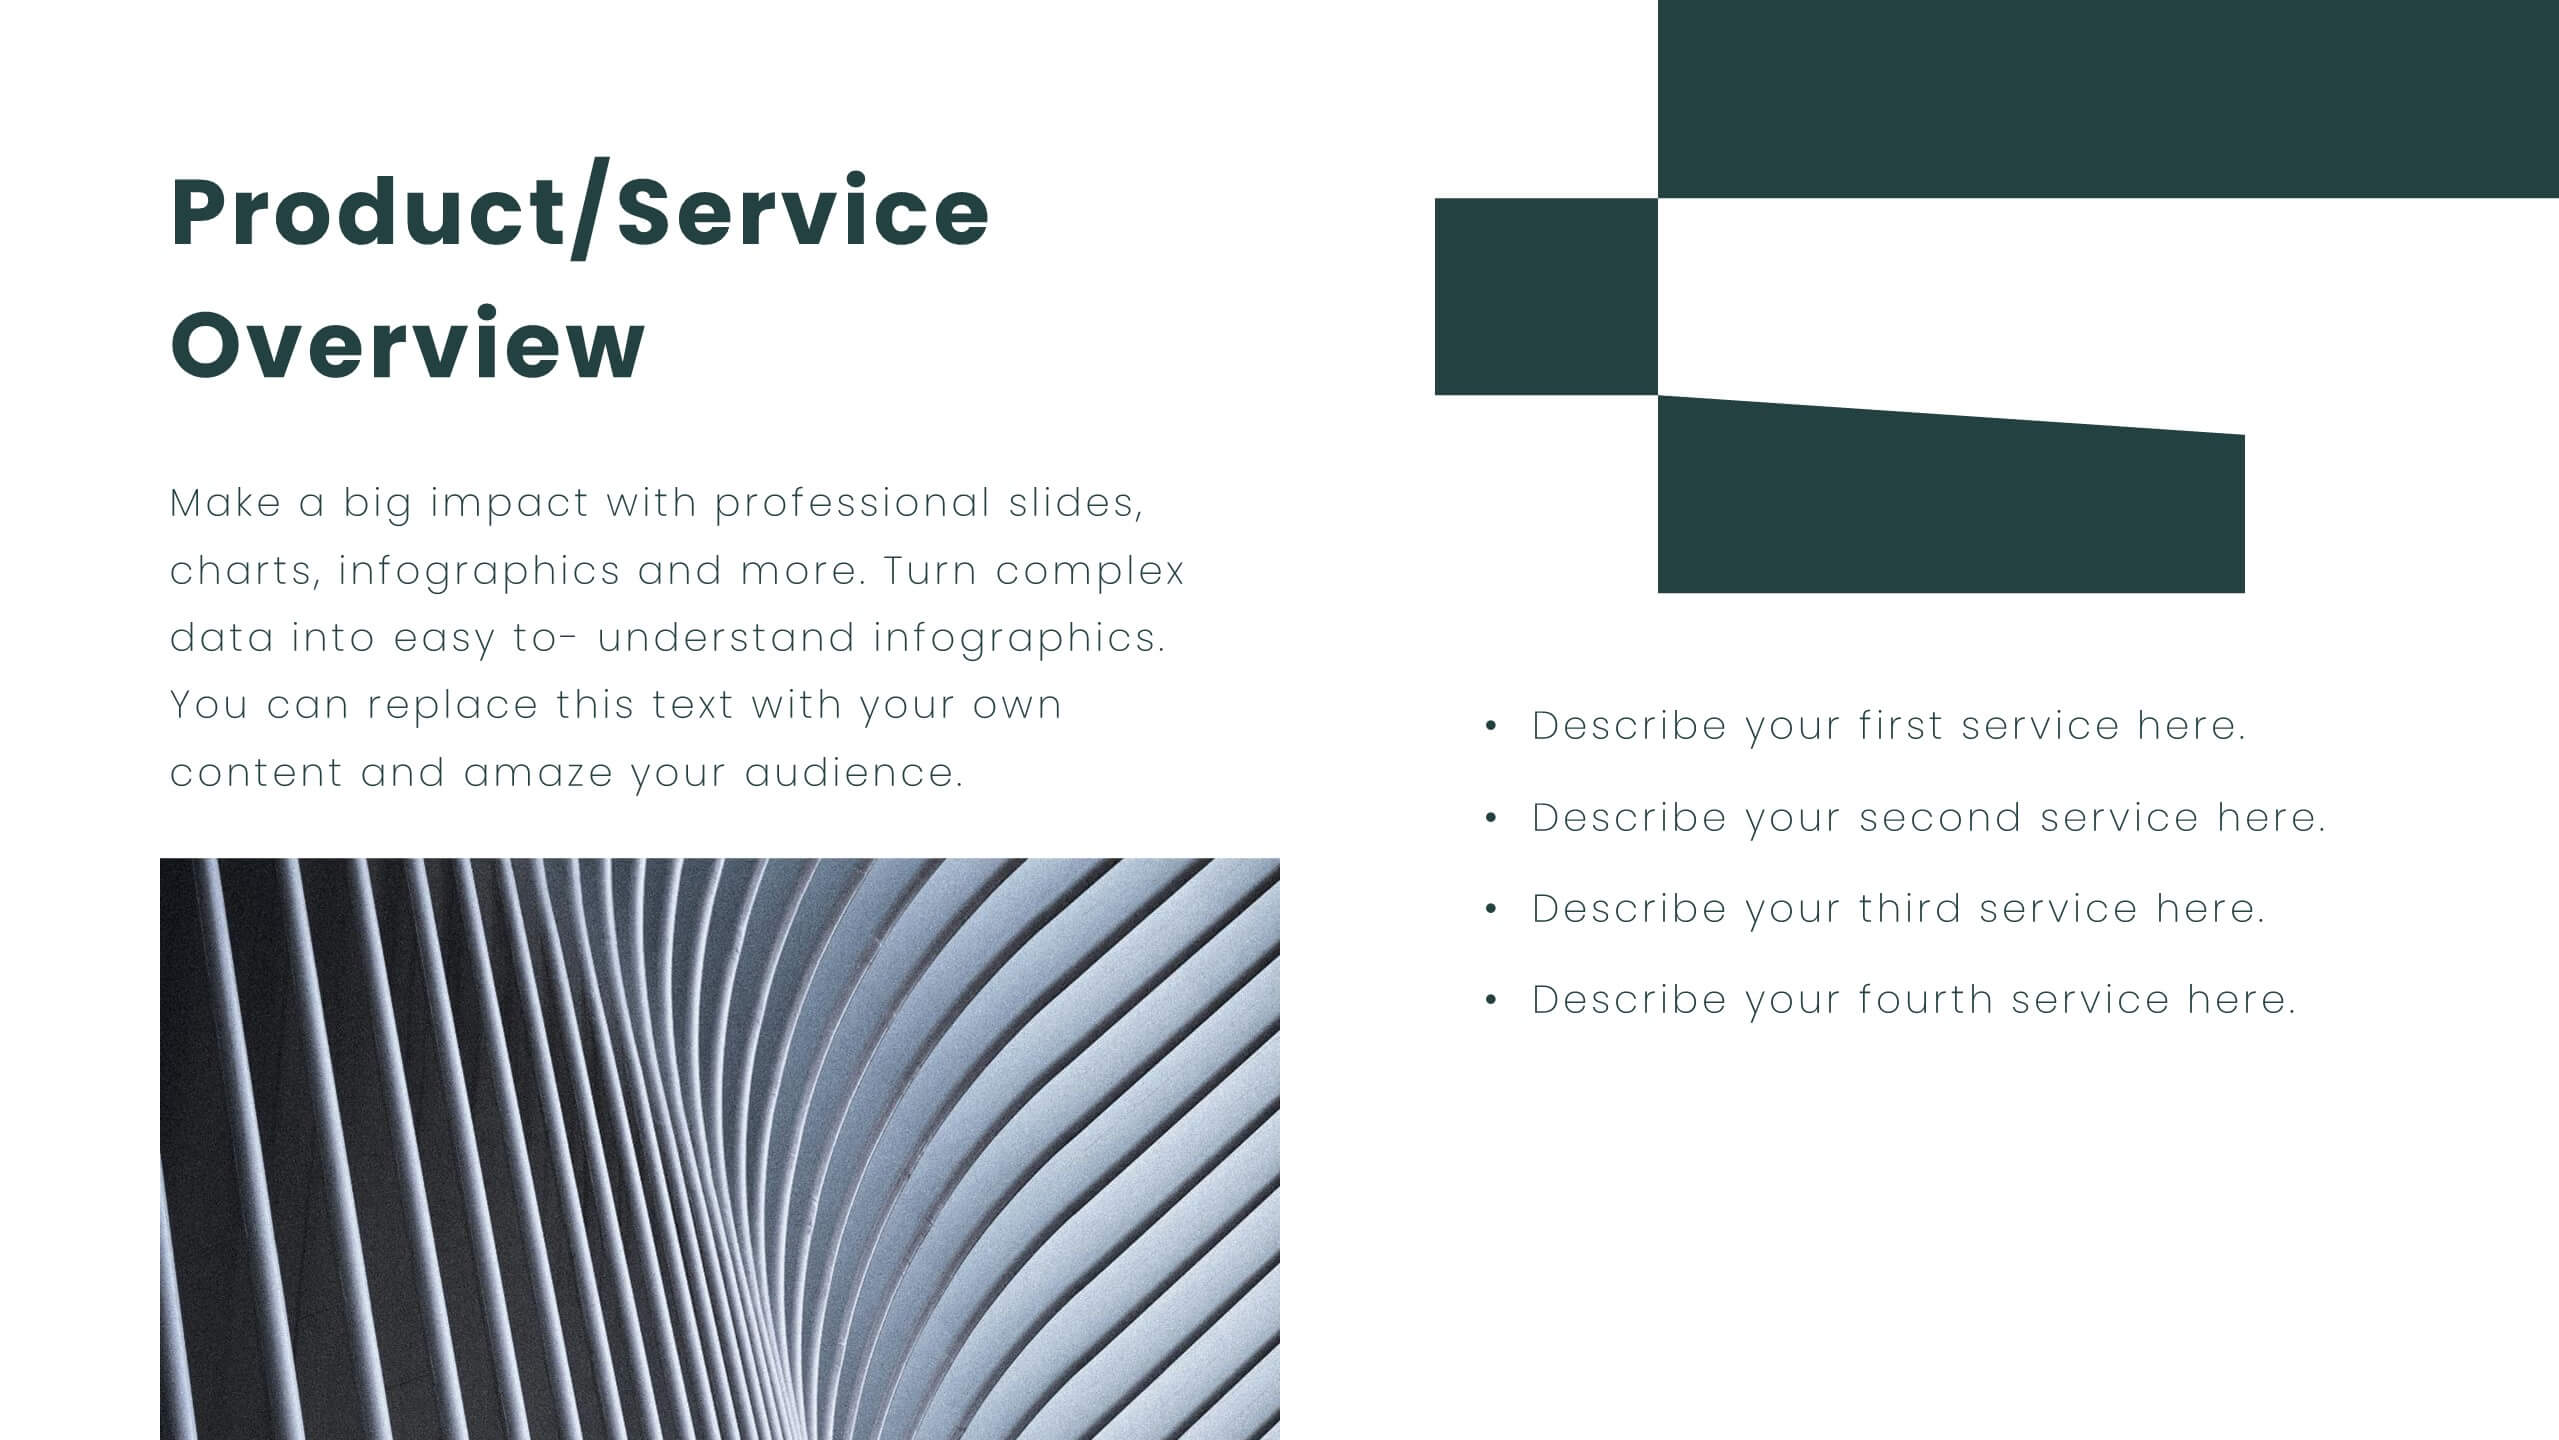
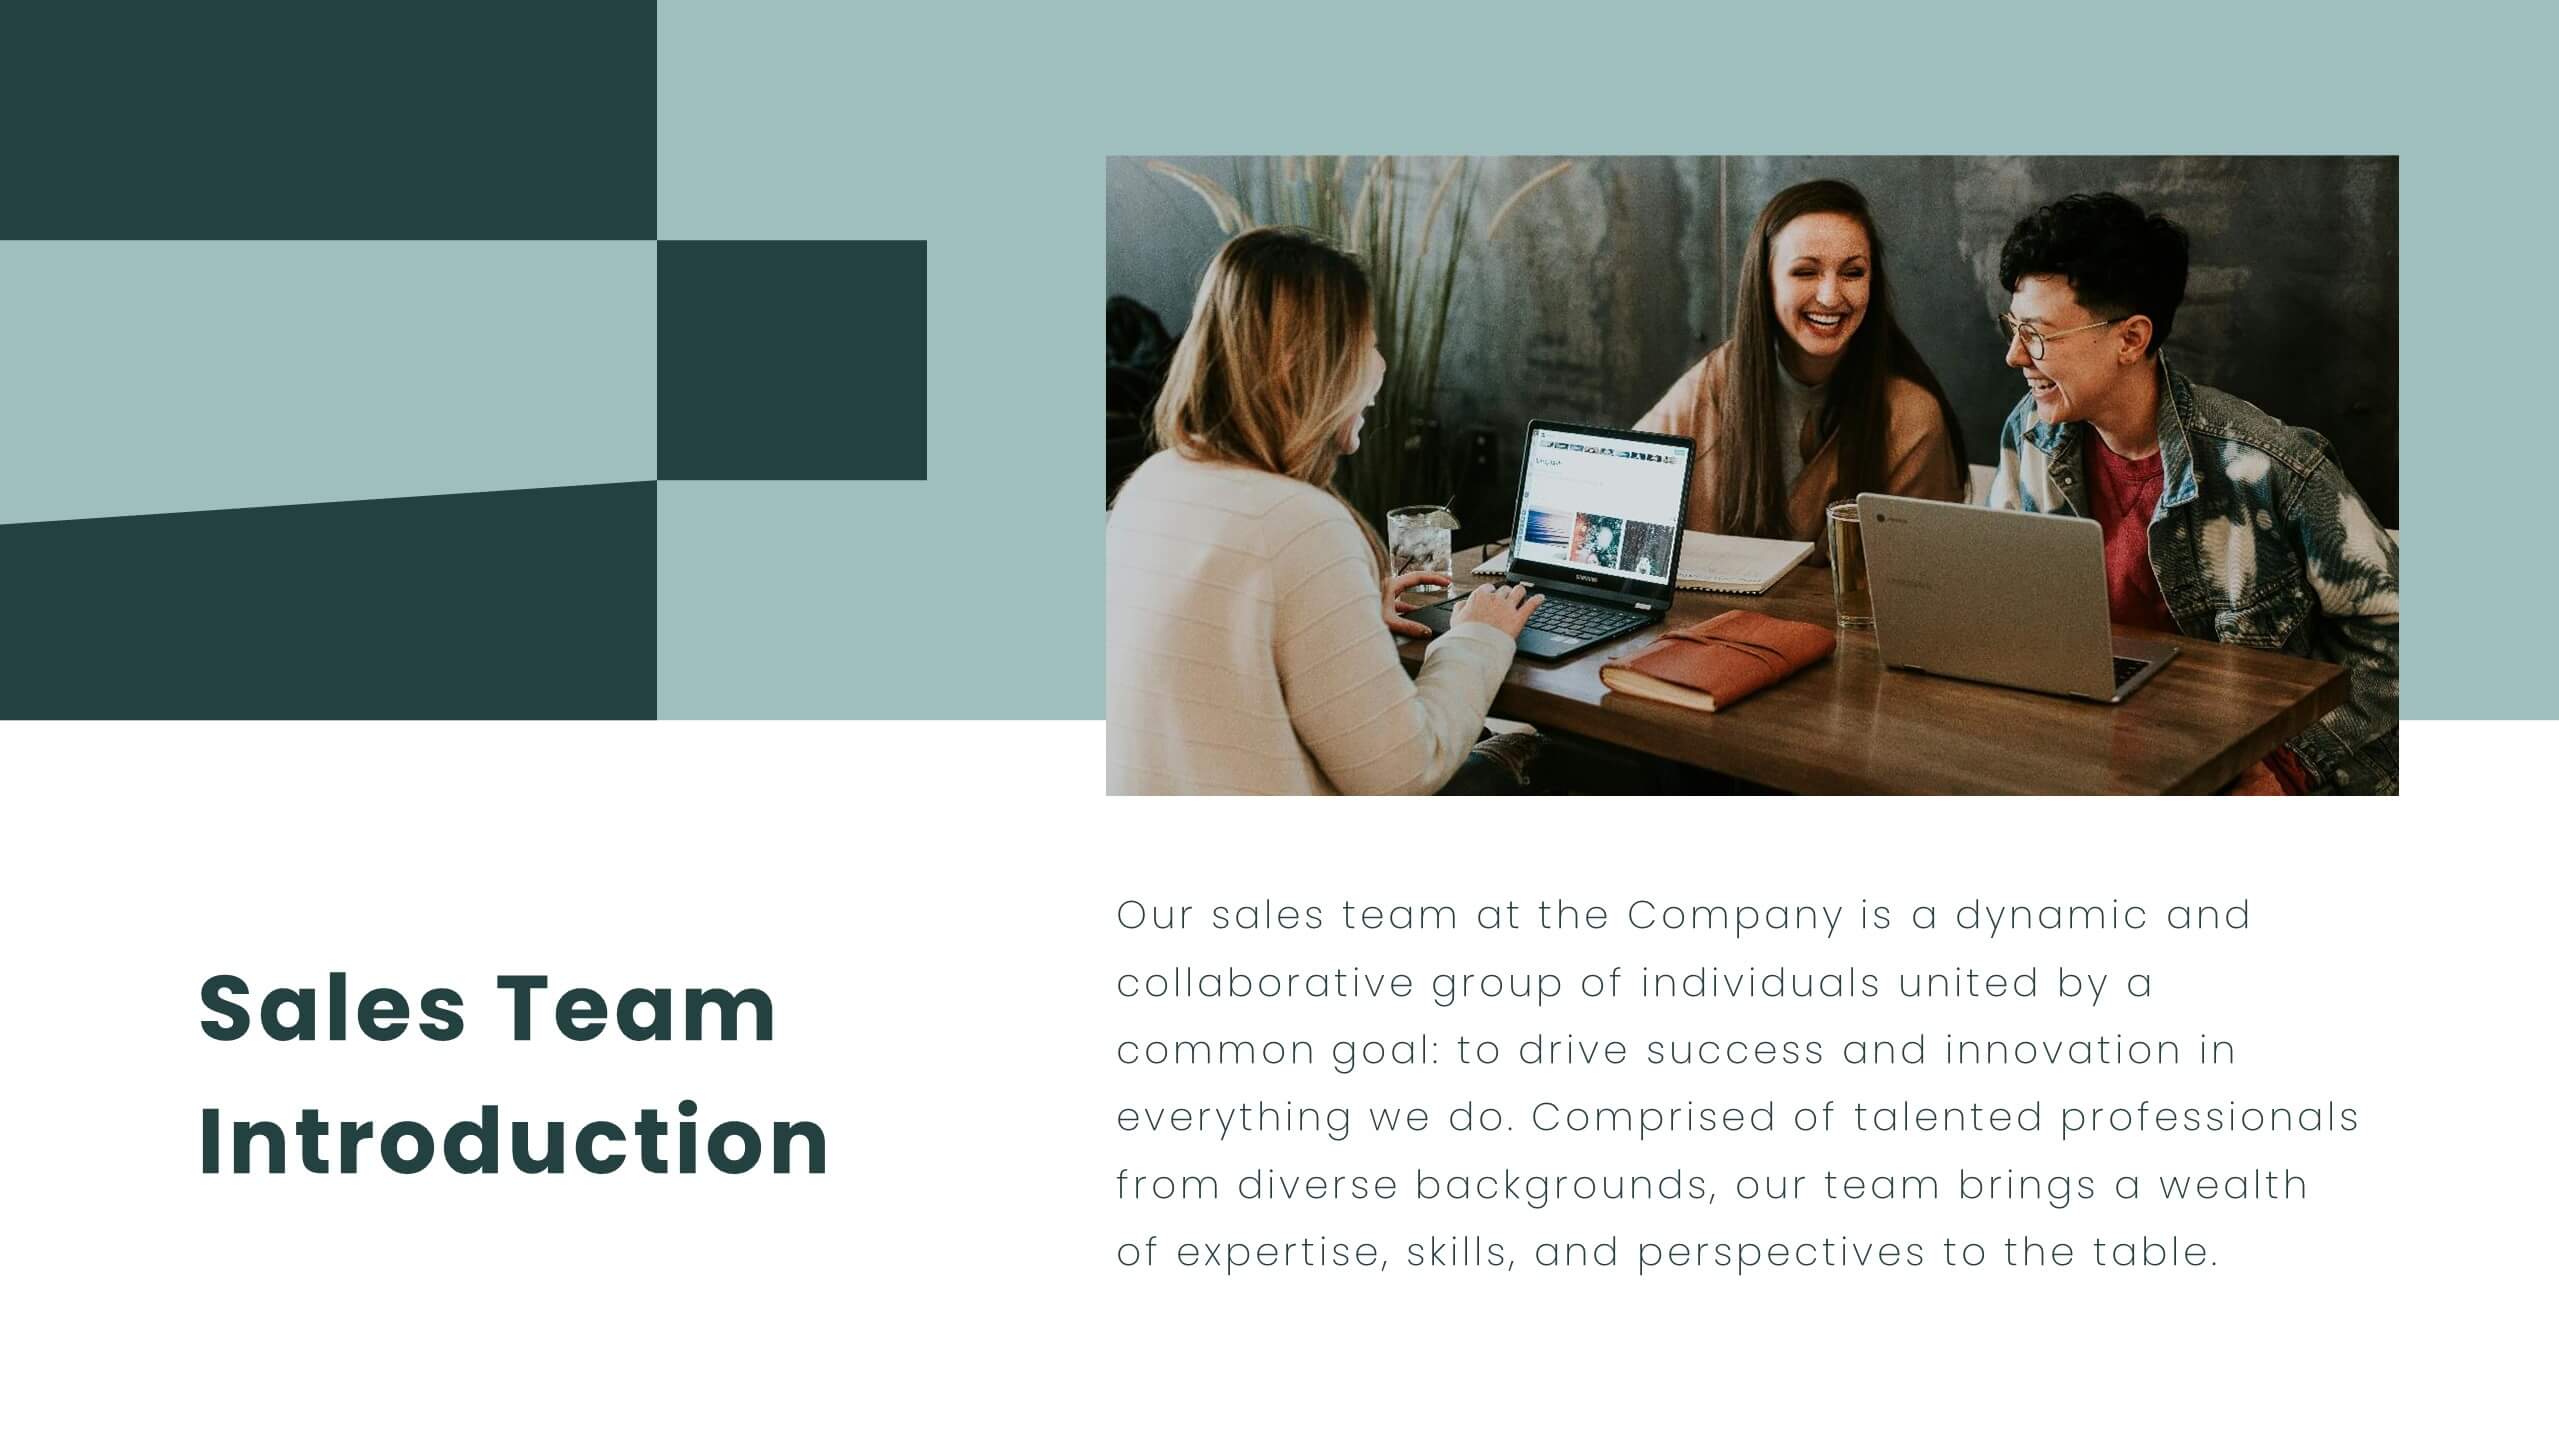
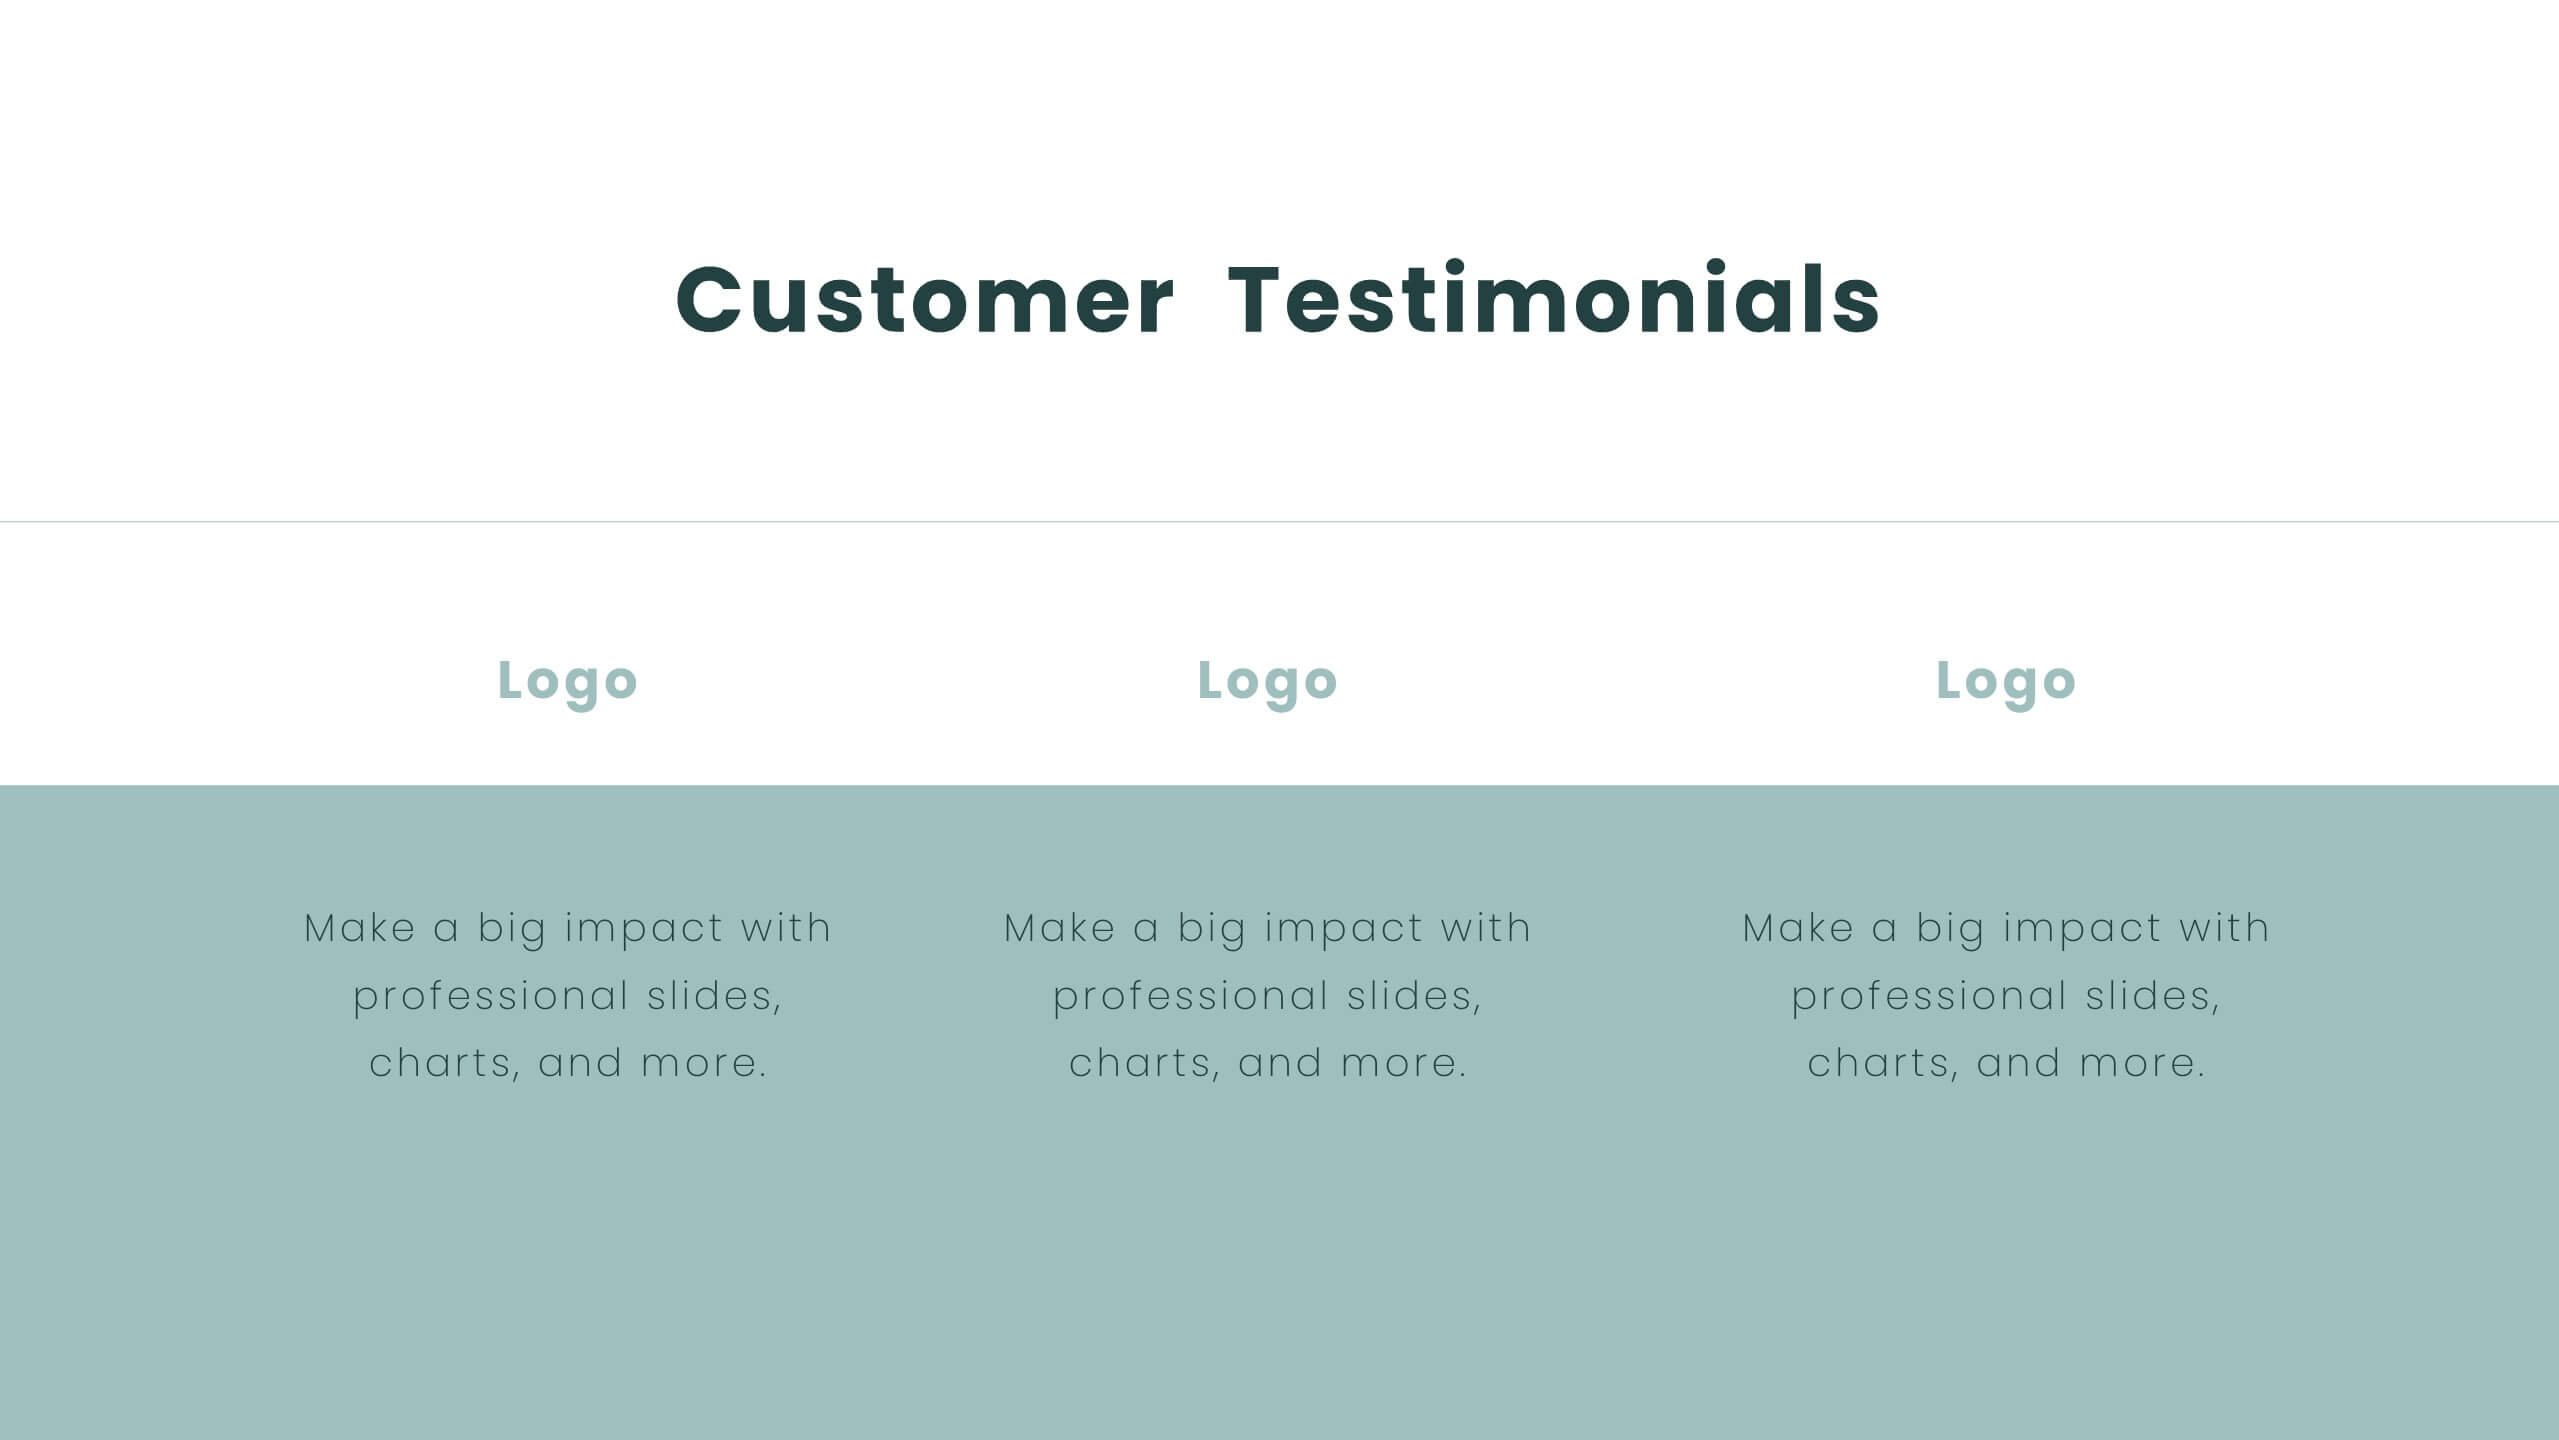
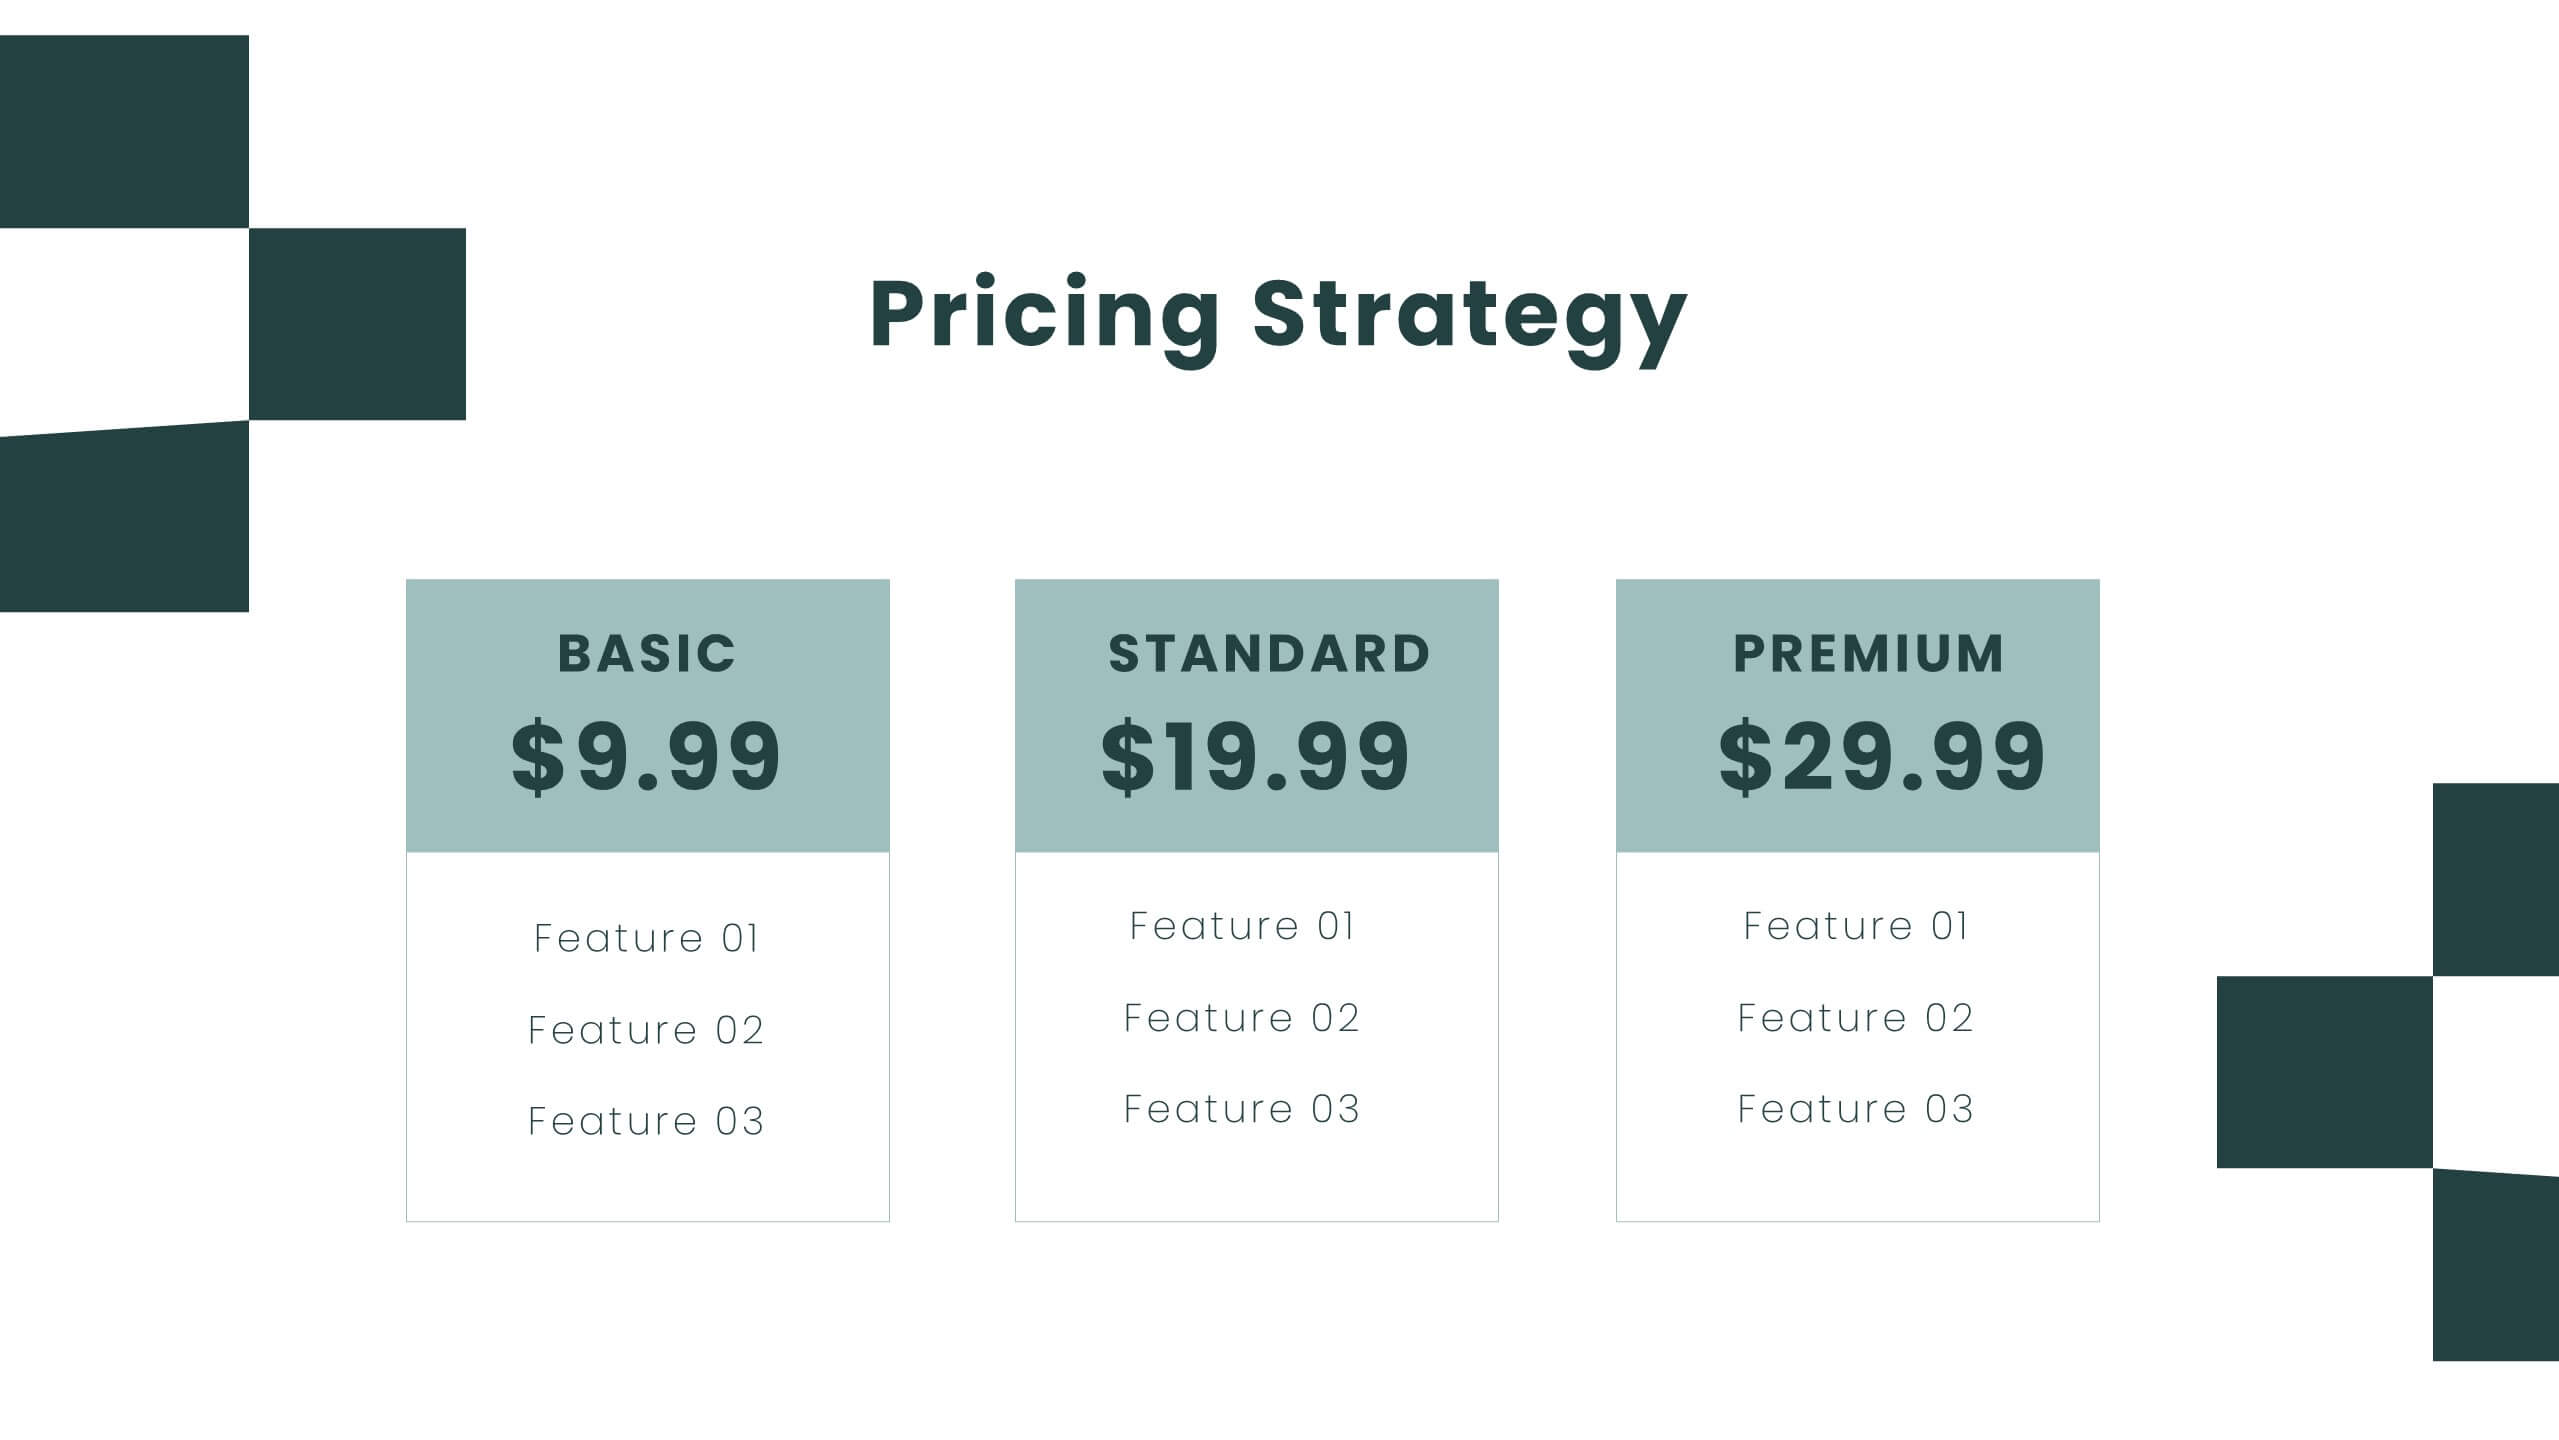
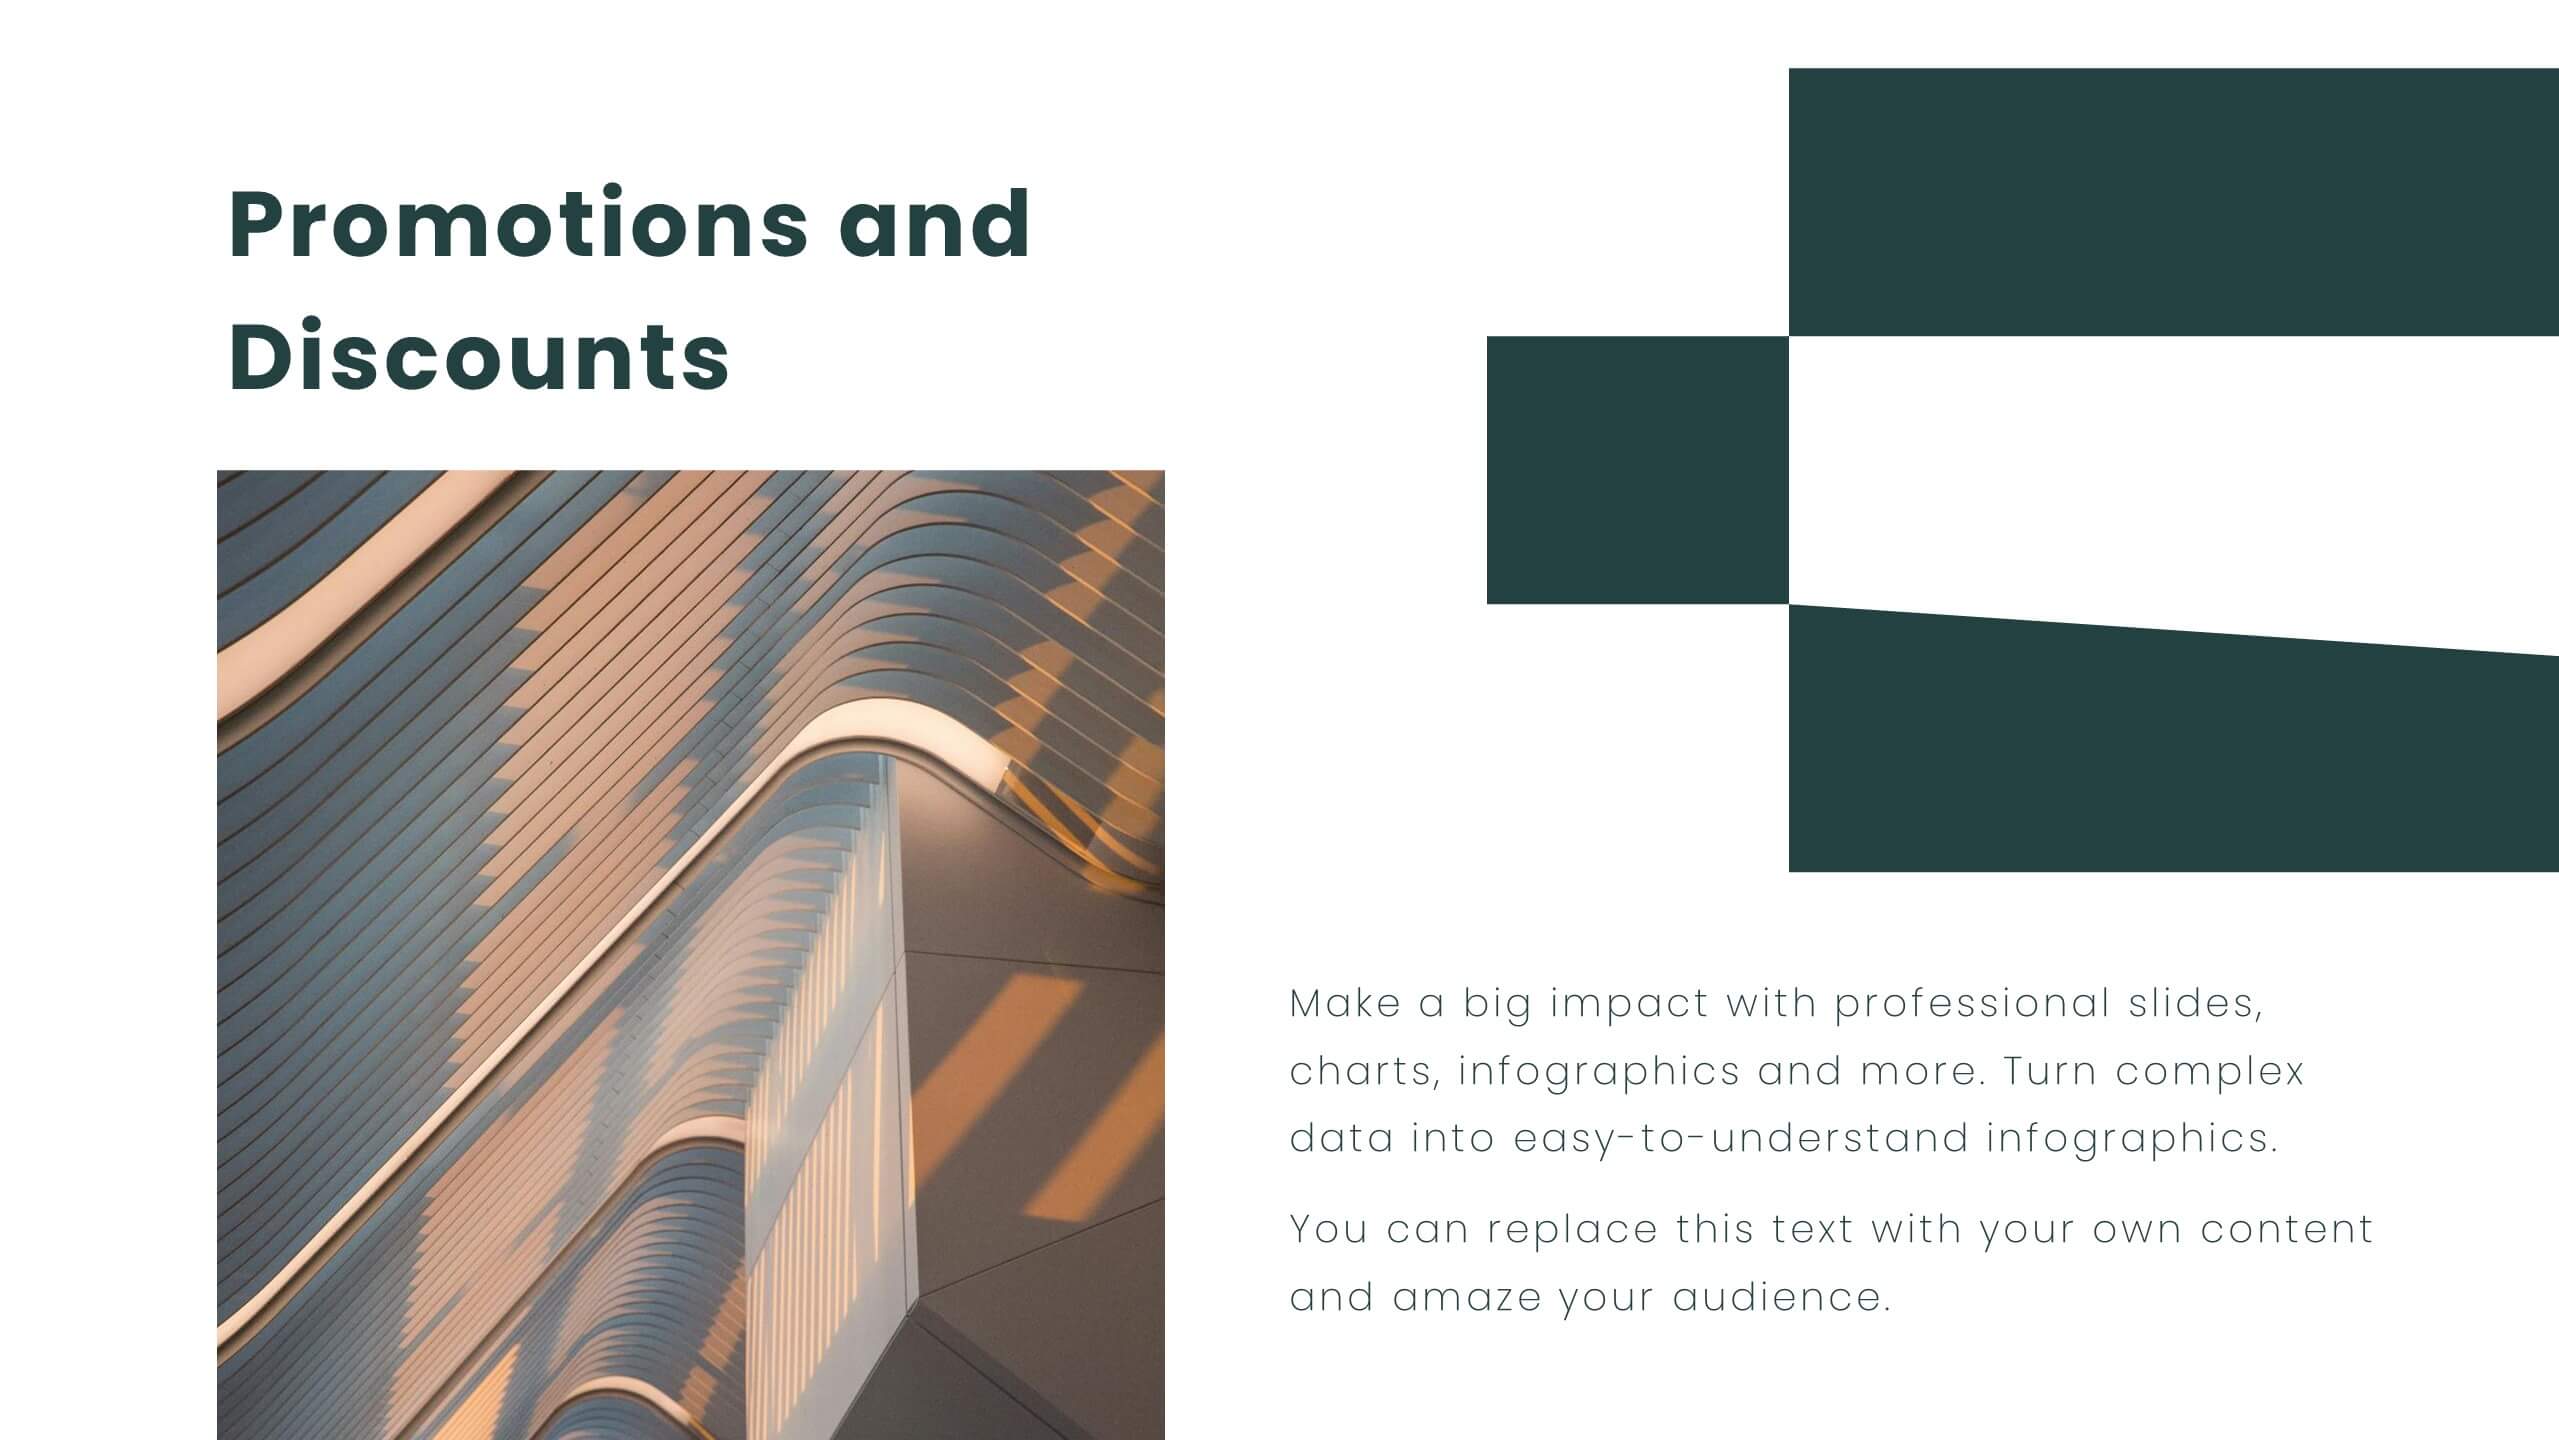
Radiant Sales Proposal Presentation
Elevate your pitch with this polished sales proposal template! Perfect for presenting company overviews, product/service details, and pricing strategies, it includes slides for competitive analysis and customer testimonials. Impress your audience with clear visuals and structured content. Compatible with PowerPoint, Keynote, and Google Slides for seamless presentations on any platform.


5 diapositivas
Risk Assessment Heat Map Presentation
Evaluate risks effectively with a structured heat map. This Risk Assessment Heat Map helps visualize potential threats by mapping probability and impact levels. Ideal for risk management, business continuity planning, and decision-making. Fully customizable and compatible with PowerPoint, Keynote, and Google Slides for professional and seamless integration.


26 diapositivas
Blockchain for Businesses Presentation
Navigate the world of decentralized technology with our Blockchain for Businesses presentation template, compatible with PowerPoint, Keynote, and Google Slides. Tailored for business leaders, tech entrepreneurs, and financial experts, this template is a gateway to understanding blockchain's impact on the corporate landscape. Our template demystifies blockchain, presenting its core concepts and applications in business, from enhancing security to streamlining transactions. It provides a visual narrative to explain how blockchain can be a game-changer in various industries by fostering transparency, efficiency, and trust. With customizable diagrams, charts, and case studies, you can illustrate the practical benefits of blockchain integration in business operations. This template is SEO-optimized to reach audiences interested in leveraging blockchain technology for competitive advantage. Use our template to educate your audience about the strategic implementation of blockchain and position your business at the forefront of technological innovation.


7 diapositivas
United States Market Map Infographic
Navigate the vastness of the United States with our meticulously designed map infographic. Rendered in a pristine white background, this template is adorned with the patriotic fervor of red, the tranquility of blue, and the charm of purple. Whether it's for market segmentation, regional data visualization, or a travel itinerary, the infographic seamlessly blends informative value with visual appeal. This US map, compatible with Powerpoint, Keynote, and Google Slides, offers custom-made icons and flexible image placeholders to suit varied purposes. Unfold stories from coast to coast, showcasing the diverse tapestry that is the United States.


5 diapositivas
4-Stage Gap Identification Presentation
A clear, engaging way to map progression, this presentation helps you illustrate each stage of identifying business gaps with structure and clarity. It guides audiences through challenges, priorities, and opportunities in a simple step-by-step flow that’s easy to follow and present. Fully compatible with PowerPoint, Keynote, and Google Slides.


5 diapositivas
Real Estate Business Process Workflow Presentation
Streamline property operations with this real estate workflow template, designed to visualize each stage from acquisition to closing. Featuring a modern cityscape graphic and five-step layout, it’s perfect for showcasing processes, timelines, or strategies. Fully editable in Canva, PowerPoint, or Google Slides for professional, industry-specific presentations.