


Características


¿Tienes alguna pregunta?
Recomendar


6 diapositivas
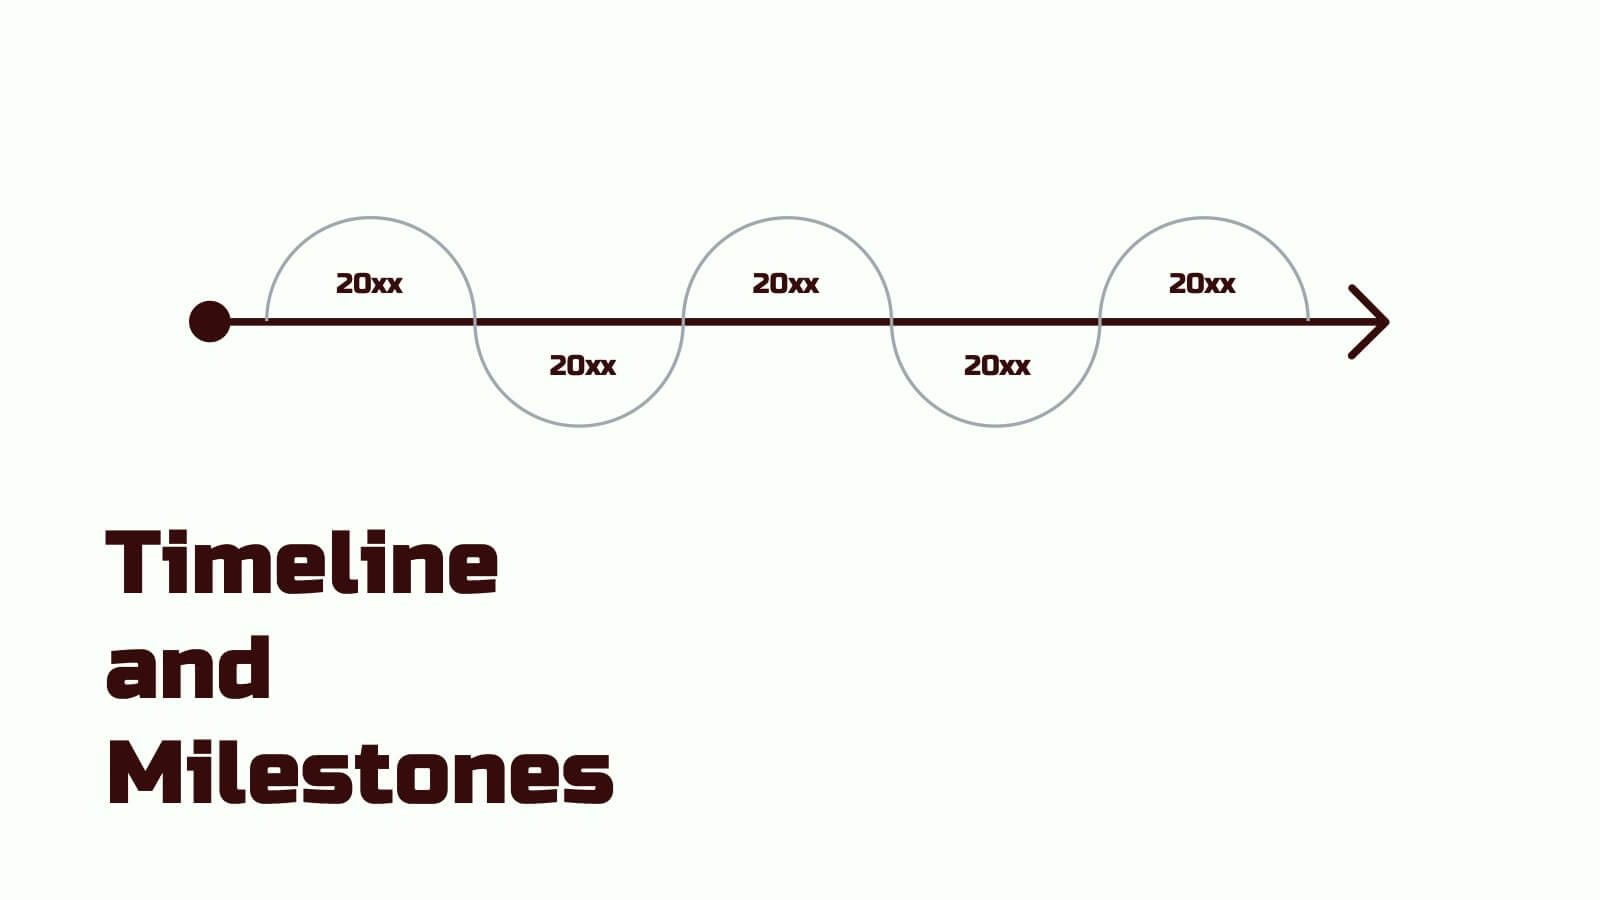
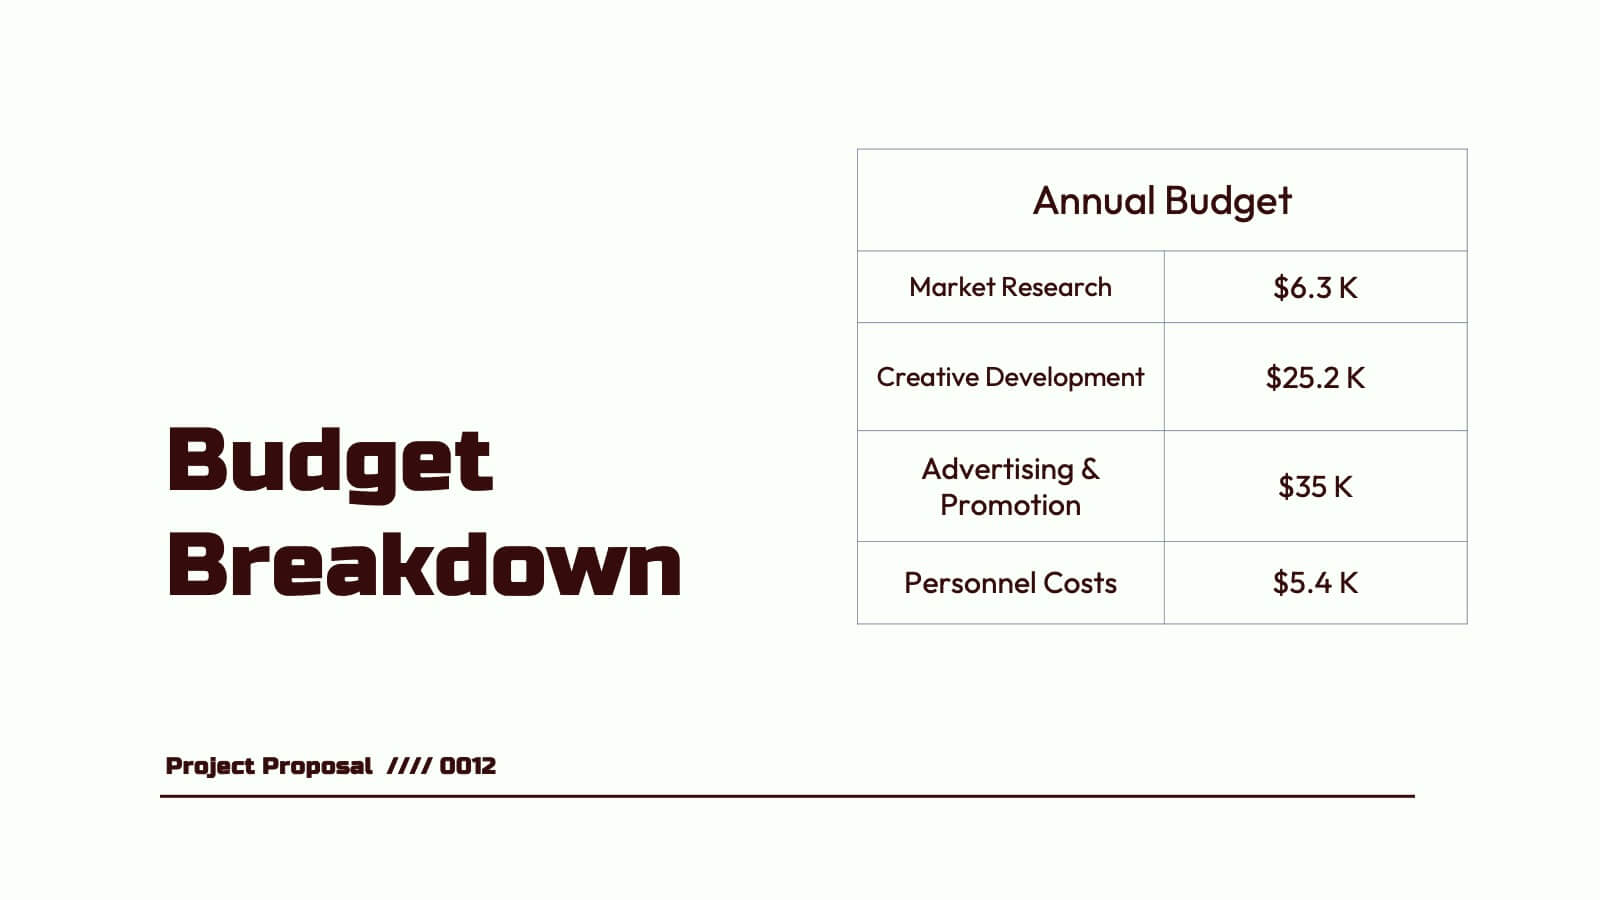
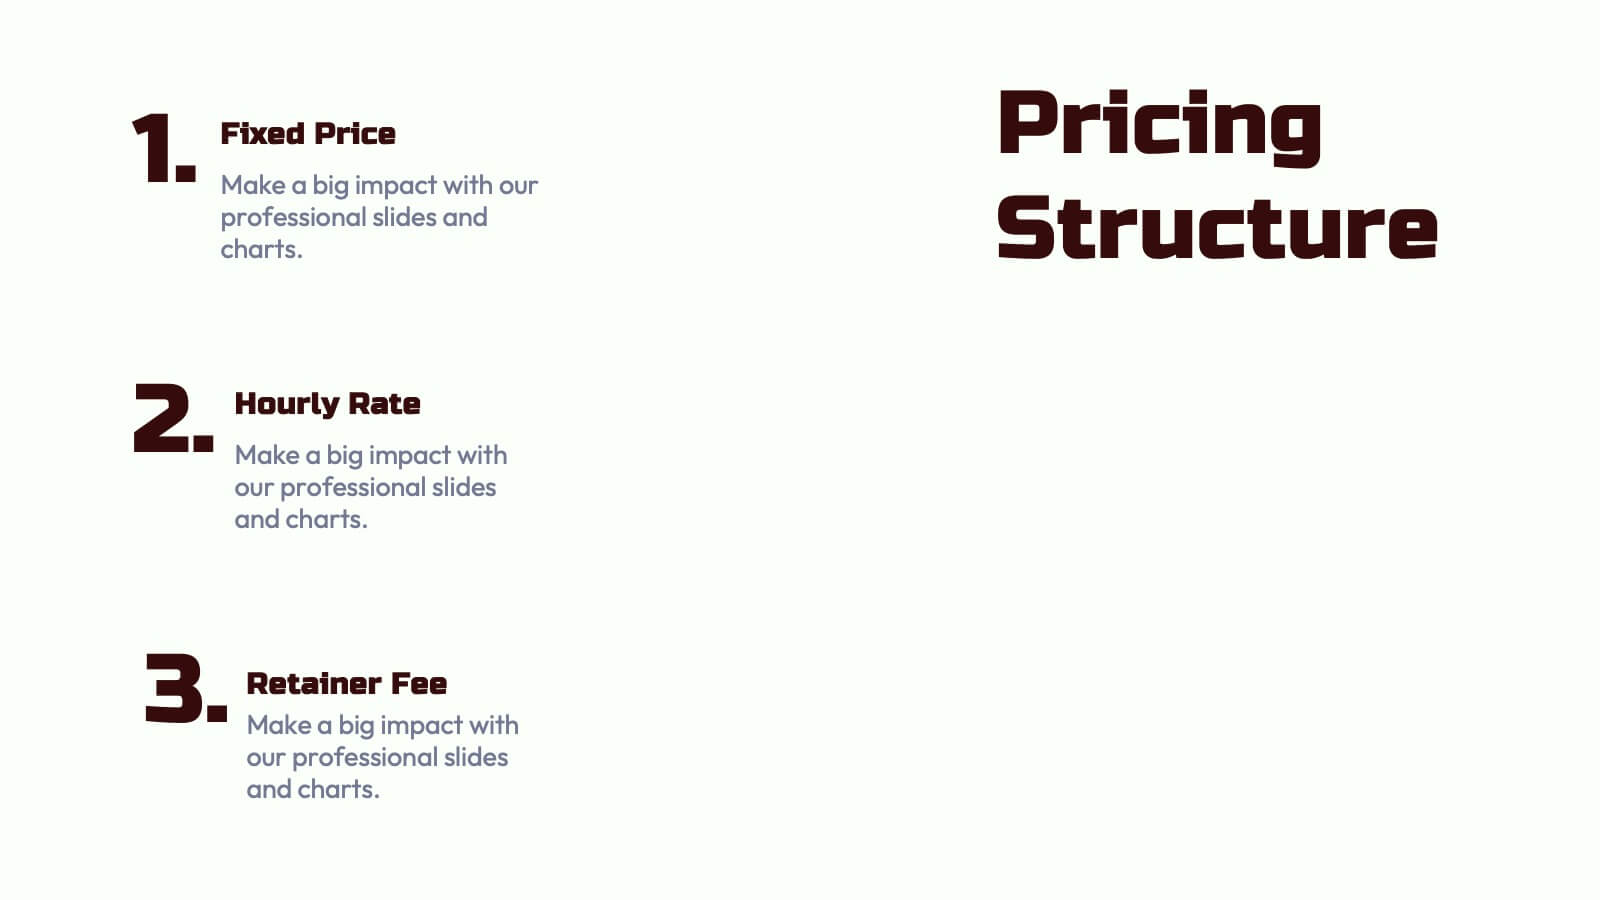
Project Proposal Slide Deck Presentation
Make your next pitch unforgettable with a clean, structured layout that turns complex project ideas into a clear visual story. Ideal for presenting timelines, goals, or performance metrics, it helps you communicate your proposal with confidence and precision. Fully compatible with PowerPoint, Keynote, and Google Slides for effortless editing.


5 diapositivas
Business Future Vision Strategy Presentation
Visualize the roadmap to your company’s future with this engaging Business Future Vision Strategy slide. The stacked cylinder infographic helps you layer key initiatives, goals, or timelines in a clean and structured format. With five editable tiers and corresponding text areas, this layout is perfect for showcasing development phases, innovation strategies, or long-term planning. Ideal for strategic meetings, business proposals, or future-focused pitches. Compatible with PowerPoint, Keynote, and Google Slides for seamless customization.


20 diapositivas
Nebula Project Proposal Presentation
Create a compelling project proposal with this structured, professional template! It includes sections for problem statements, proposed solutions, goals, timelines, and pricing. Perfect for organizing your ideas clearly and professionally, it's fully customizable and compatible with PowerPoint, Keynote, and Google Slides. This template makes it easy to present your proposals effectively and win clients.


21 diapositivas
Journey Sales Proposal Presentation
Get ready to seal the deal with the Journey Sales Proposal Presentation template! This template is designed to help you craft compelling sales proposals that captivate and convince. With a clean, modern design, it allows you to showcase your products or services, highlight your competitive edge, and present your pricing strategies effectively. Each slide is thoughtfully designed to guide your audience through the sales process, from introduction to final agreement. Whether you're pitching to potential clients or presenting to stakeholders, this template provides the perfect structure to outline your objectives, strategies, and key metrics. It also includes sections for team introductions, customer testimonials, and future opportunities, making it a comprehensive tool for any sales professional. The Journey template is fully customizable and compatible with PowerPoint, Keynote, and Google Slides, ensuring you can easily tailor it to fit your brand and message. Start closing more deals with style and confidence!


22 diapositivas
Garnet Qualitative Research Findings Presentation
This qualitative research findings presentation template provides a structured layout for sharing in-depth insights from your study. It includes sections for objectives, methodology, data analysis, key findings, and future directions, offering a clear flow for presenting research in a professional format. Perfect for researchers, it’s fully customizable in PowerPoint, Keynote, and Google Slides.


5 diapositivas
Business and Personal Goal Planning Presentation
Align your vision with action using the Business and Personal Goal Planning slide. This clean, professional layout helps break down up to four key objectives using flag-themed visuals, customizable text blocks, and supportive icons. Perfect for comparing business goals with personal development targets in a single view. Fully editable in PowerPoint, Keynote, and Google Slides—ideal for team meetings, coaching sessions, or strategic planning.
4 diapositivas
Growth Path Arrow Design Presentation
Rise with momentum as you visualize progress in a clean, modern layout built for showcasing goals, achievements, and forward movement. This presentation highlights each stage in a clear upward path, helping audiences follow your narrative with ease. Fully editable and compatible with PowerPoint, Keynote, and Google Slides.


20 diapositivas
Victoria Design Strategy Proposal Presentation
This design strategy proposal template, crafted with a soft, modern aesthetic, offers a comprehensive layout for presenting design elements, processes, and deliverables. Each slide provides a clean, structured approach to showcase your brand’s design brief, target audience, color palette, typography, mood board, and project timeline. Perfect for designers and agencies, it supports PowerPoint, Keynote, and Google Slides for versatile use.


10 diapositivas
AI Impact on Business and Innovation Presentation
Deliver insights with precision using this data-driven presentation template tailored for machine learning, AI, and analytics topics. Featuring a central hub-and-spoke design, this layout allows you to showcase key components like algorithms, tools, processes, or data sources. Each segment includes clean icons and customizable titles for seamless editing. Ideal for data scientists, tech professionals, and academic presentations. Fully editable in PowerPoint, Keynote, and Google Slides.


5 diapositivas
Minimal Watercolor Aesthetic Presentation
Bring a soft artistic touch to your ideas with this clean, watercolor-inspired layout designed for simple, modern storytelling. The slide helps you highlight key points with gentle color accents that feel elegant yet professional, making complex insights easier to follow. Fully compatible with PowerPoint, Keynote, and Google Slides.


4 diapositivas
Europe Market Expansion Visualization Presentation
Showcase your European growth strategy with the Europe Market Expansion Visualization Presentation. This map-based slide design allows you to clearly highlight regional opportunities, new market entries, and key expansion zones using icons and color-coded country markers. Ideal for strategic planning, investor updates, and sales overviews. Fully editable in PowerPoint, Keynote, Google Slides, and Canva.


6 diapositivas
Business Milestone Roadmap
Visualize key achievements and future goals with this dynamic Business Milestone Roadmap. Perfect for project planning, annual reviews, or startup timelines, this layout walks through five key years or phases with clear markers and icons. Fully editable in PowerPoint, Keynote, and Google Slides.


6 diapositivas
Scalable Data Systems and Analytics Presentation
Break down your cloud data architecture with clarity and flow using this visual diagram template. It helps illustrate how your scalable data systems interact—from ingestion to processing and analytics. Perfect for IT teams and tech presentations. Easily editable and compatible with PowerPoint, Keynote, and Google Slides.
5 diapositivas
Team Achievements and Output Tracking Presentation
Celebrate success and monitor progress with the Team Achievements and Output Tracking presentation template. Designed with visual medal icons and color-coded team figures, this layout is perfect for highlighting milestones, recognizing contributors, and tracking output performance. Fully editable and compatible with PowerPoint, Keynote, and Google Slides.


5 diapositivas
Internal Communication Flow Chart Presentation
Visualize key communication channels within your organization using this internal communication flow chart. With a clean radial layout, this template helps you illustrate how information travels between departments or roles. Ideal for HR teams, managers, or consultants. Fully editable in Canva, PowerPoint, and Google Slides for seamless customization.


5 diapositivas
Corporate Skills Training Program Presentation
Elevate corporate capability with the 'Corporate Skills Training Program' template, ideal for detailing strategic workforce development. It's crafted for organizations aiming to enhance employee competencies and performance metrics. This template is compatible with PowerPoint, Keynote, and Google Slides, ensuring adaptability across various presentation platforms.


6 diapositivas
Business Case Study Slide Deck Presentation
Bring your success story to life with a clean, data-driven layout designed to showcase real results and insights. Perfect for highlighting challenges, solutions, and measurable outcomes, this presentation helps make your analysis clear and engaging. Fully compatible with PowerPoint, Keynote, and Google Slides for easy customization and professional delivery.