


Características


¿Tienes alguna pregunta?
Recomendar


4 diapositivas
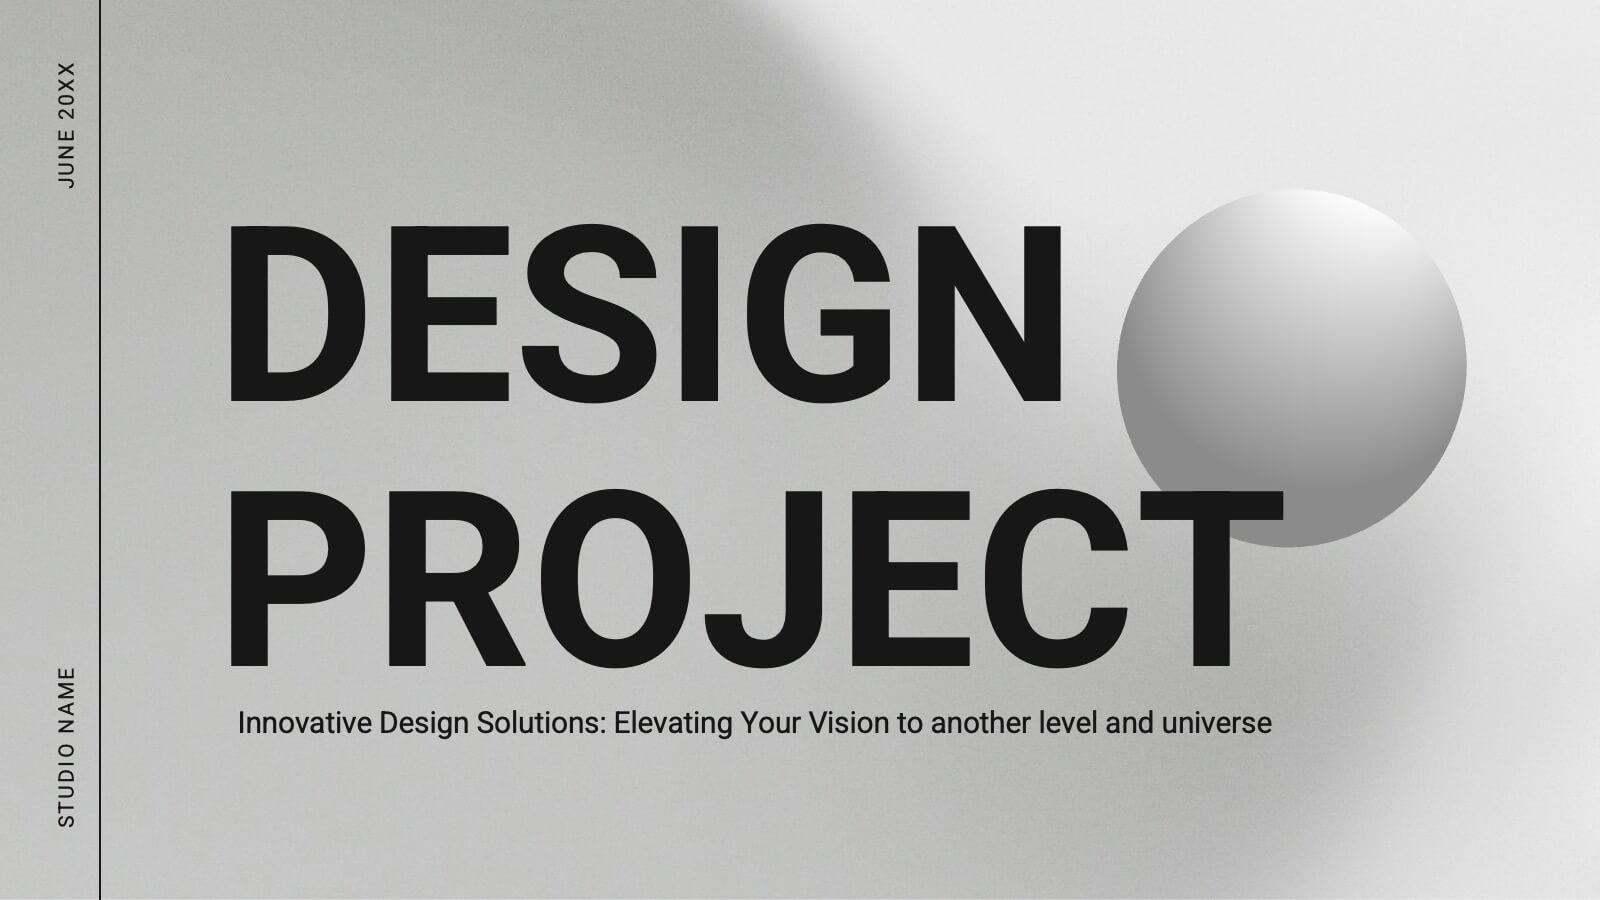
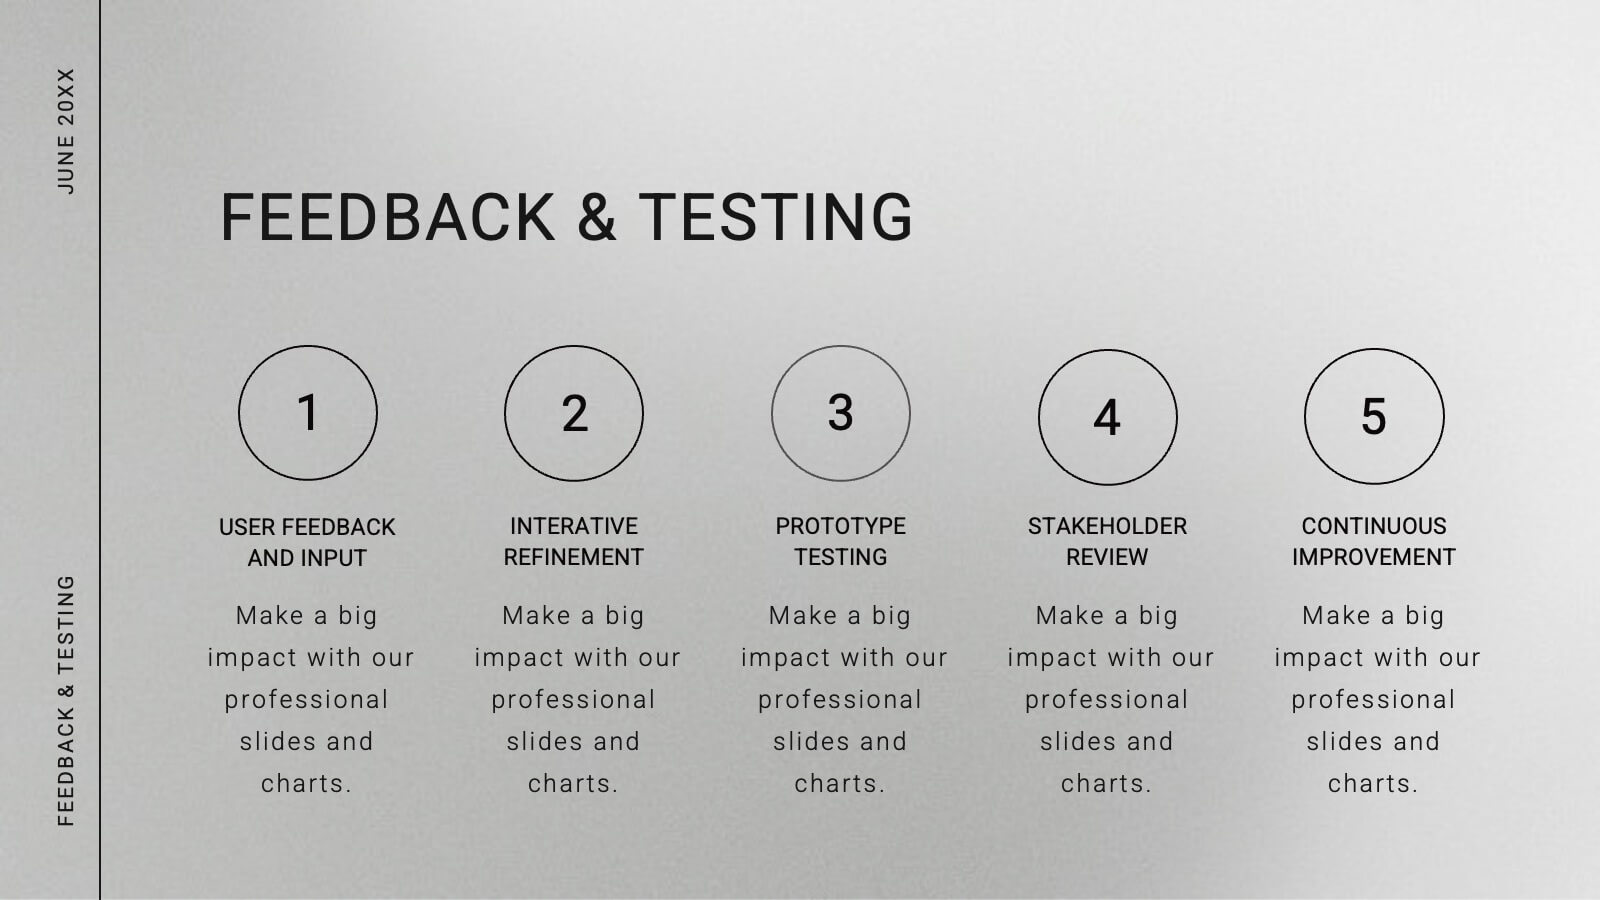
Marketing Campaign Action Plan Presentation
Drive impactful marketing results with the Marketing Campaign Action Plan presentation. This structured and visually engaging template helps you outline campaign objectives, key strategies, and execution steps in a clear, step-by-step format. Designed for marketers, strategists, and business teams, this fully editable slide ensures seamless planning and tracking of marketing initiatives. Compatible with PowerPoint, Keynote, and Google Slides.


10 diapositivas
5G Technology and Network Advancements Presentation
Showcase key milestones and trends in modern telecom evolution with this dynamic 5G network infographic. The slide features a clean, wave-like flow connecting five signal tower icons, perfect for outlining technological phases, speed upgrades, or infrastructure rollouts. Suitable for IT professionals, telecom analysts, and future-tech strategists. Fully customizable in PowerPoint, Keynote, and Google Slides.


5 diapositivas
Breast Cancer Prevention Infographics
Breast Cancer is a serious disease that affects millions of people worldwide. These infographics are visual representations of information that provide tips and strategies to help prevent breast cancer. These infographics include statistics about breast cancer, risk factors, and preventative measures that can be taken to reduce the risk of developing the disease. You can also use these to provide information on screening and early detection, such as mammograms and self-exams. The visuals in these infographics may include icons, images, graphs, and charts to make the information easy to understand.


4 diapositivas
Financial Cost Management Strategies Presentation
Effectively plan and monitor financial performance with the Financial Cost Management Strategies Presentation template. This slide provides a clear roadmap for cost optimization, budget allocation, and financial efficiency improvements. Ideal for finance teams, business strategists, and executives aiming for streamlined cost control. Fully editable in PowerPoint, Keynote, and Google Slides for easy customization.


7 diapositivas
Adventure Challenge Infographic
The Adventure Challenge is a concept or product designed to encourage individuals or groups to step out of their comfort zones and embrace new, exciting experiences. This infographic template is designed to spark your inner explorer and conquer new horizons. This infographic is your compass to discover, challenge, and triumph in the realm of adventure. Compatible with Powerpoint, Keynote, and Google Slides. Illustrate the metaphorical mountains you'll climb during your adventure journey. This infographic will showcase various checkpoints of your adventure, guiding you as you chart your course and achieve milestones.


3 diapositivas
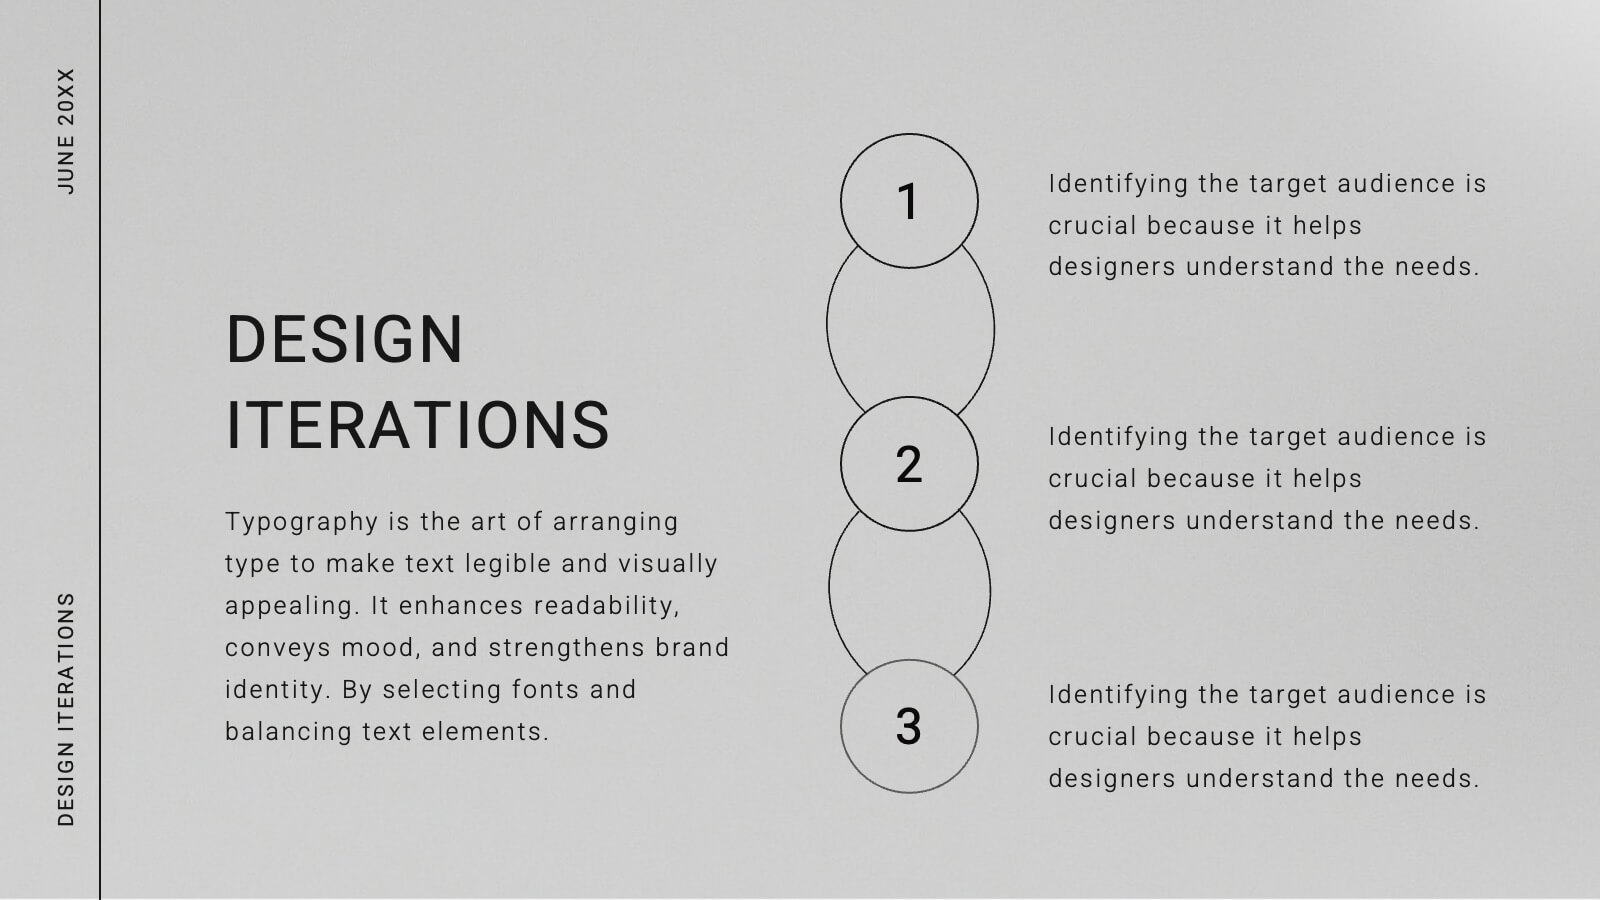
Visual Breakdown with Tree Diagram Format Presentation
Illustrate growth stages, concepts, or layered development with the Visual Breakdown with Tree Diagram Format Presentation. This creative design uses three tree icons—seedling, sapling, and mature tree—to represent progression or hierarchy. Ideal for timelines, product evolution, or strategic planning. Fully editable in PowerPoint, Keynote, and Google Slides.


5 diapositivas
Infrastructure and Construction Industry
Showcase progress and performance metrics in the construction sector using this crane-themed, vertical bar chart design. Perfect for engineers, project managers, and developers, this slide uses color-coded scaffolding to illustrate percentages, growth, or completion rates. Fully editable in PowerPoint, Keynote, and Google Slides.


5 diapositivas
Business Project Status Review Presentation
Present your team's progress with clarity using this hexagon-icon based project review layout. Designed for status updates, this slide includes four visually distinct sections with toggle-style indicators for highlighting progress, milestones, or tasks. Ideal for project managers, corporate teams, or consultants. Fully editable in PowerPoint, Keynote, and Google Slides.


30 diapositivas
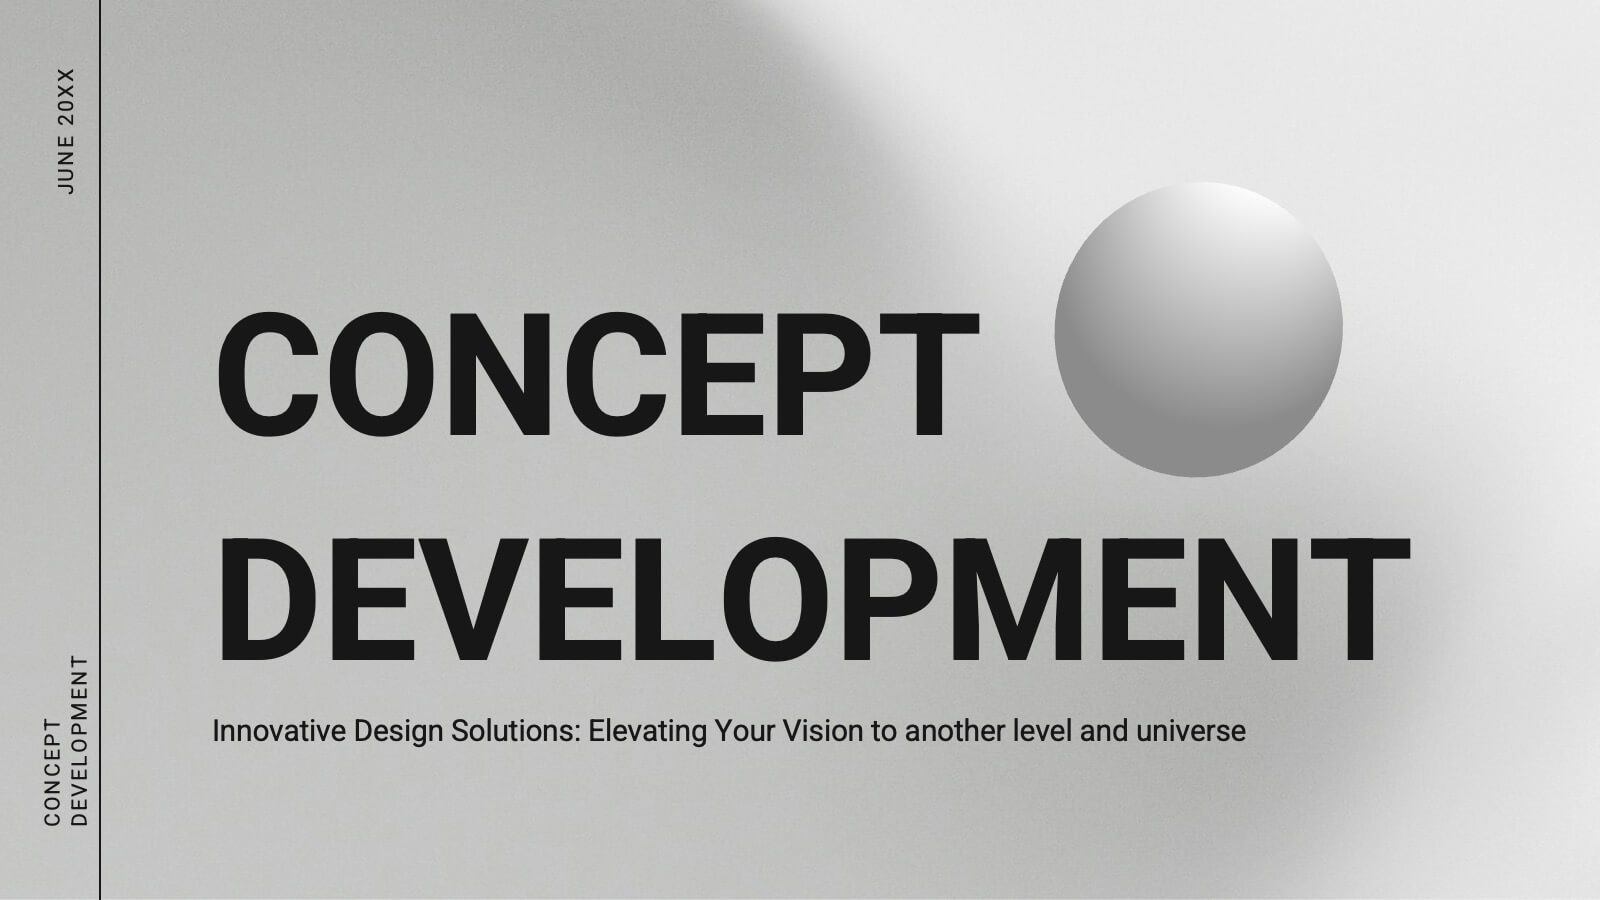
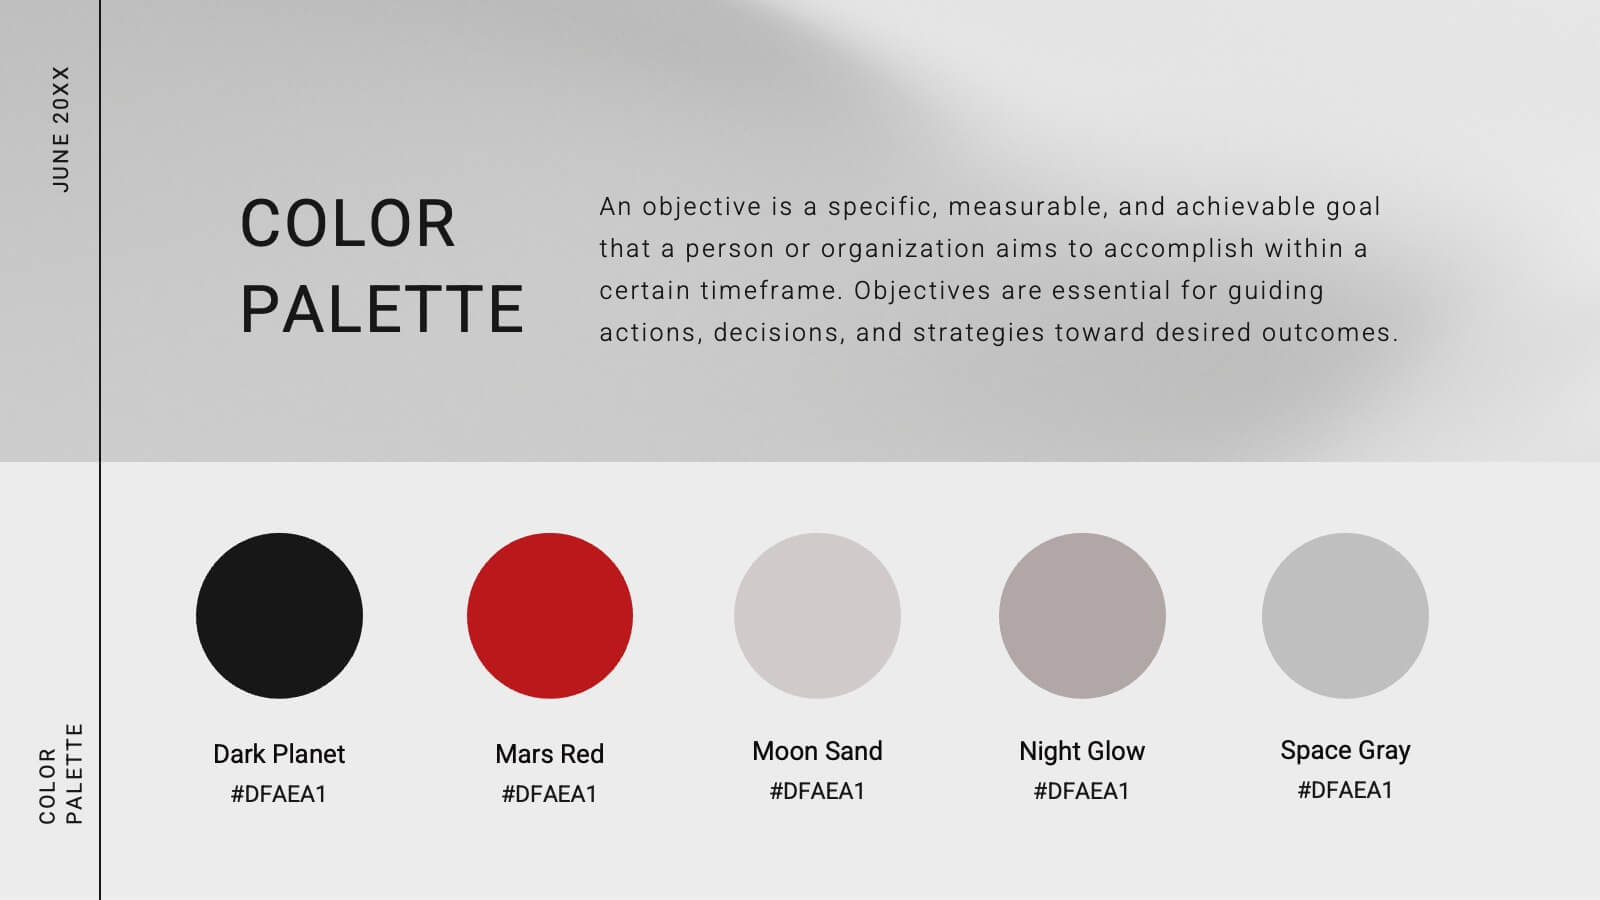
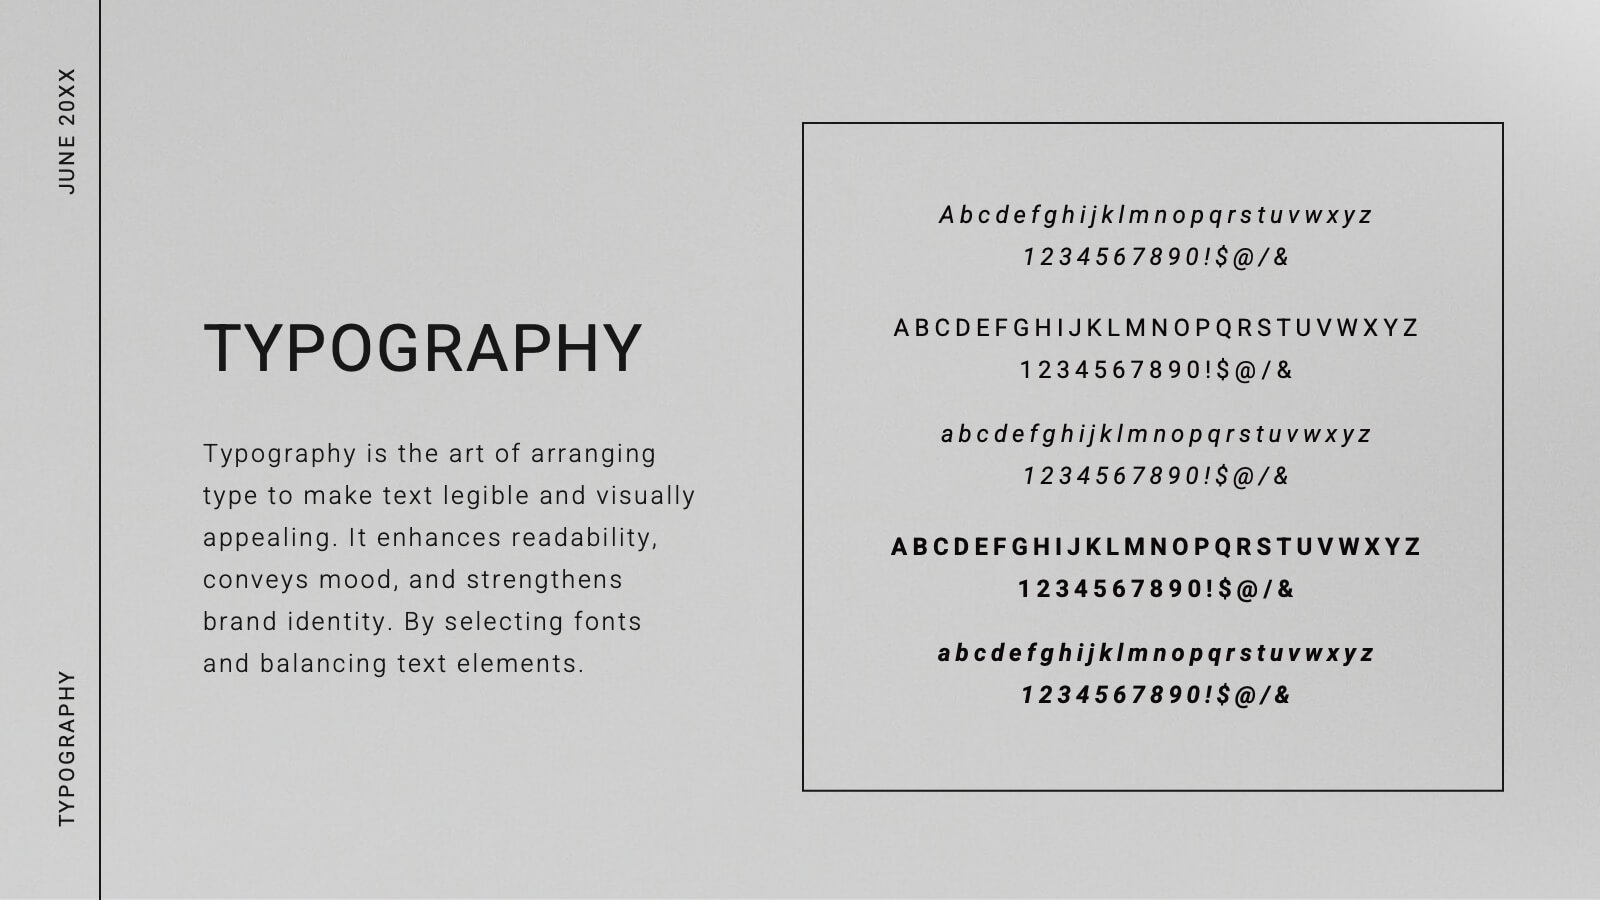
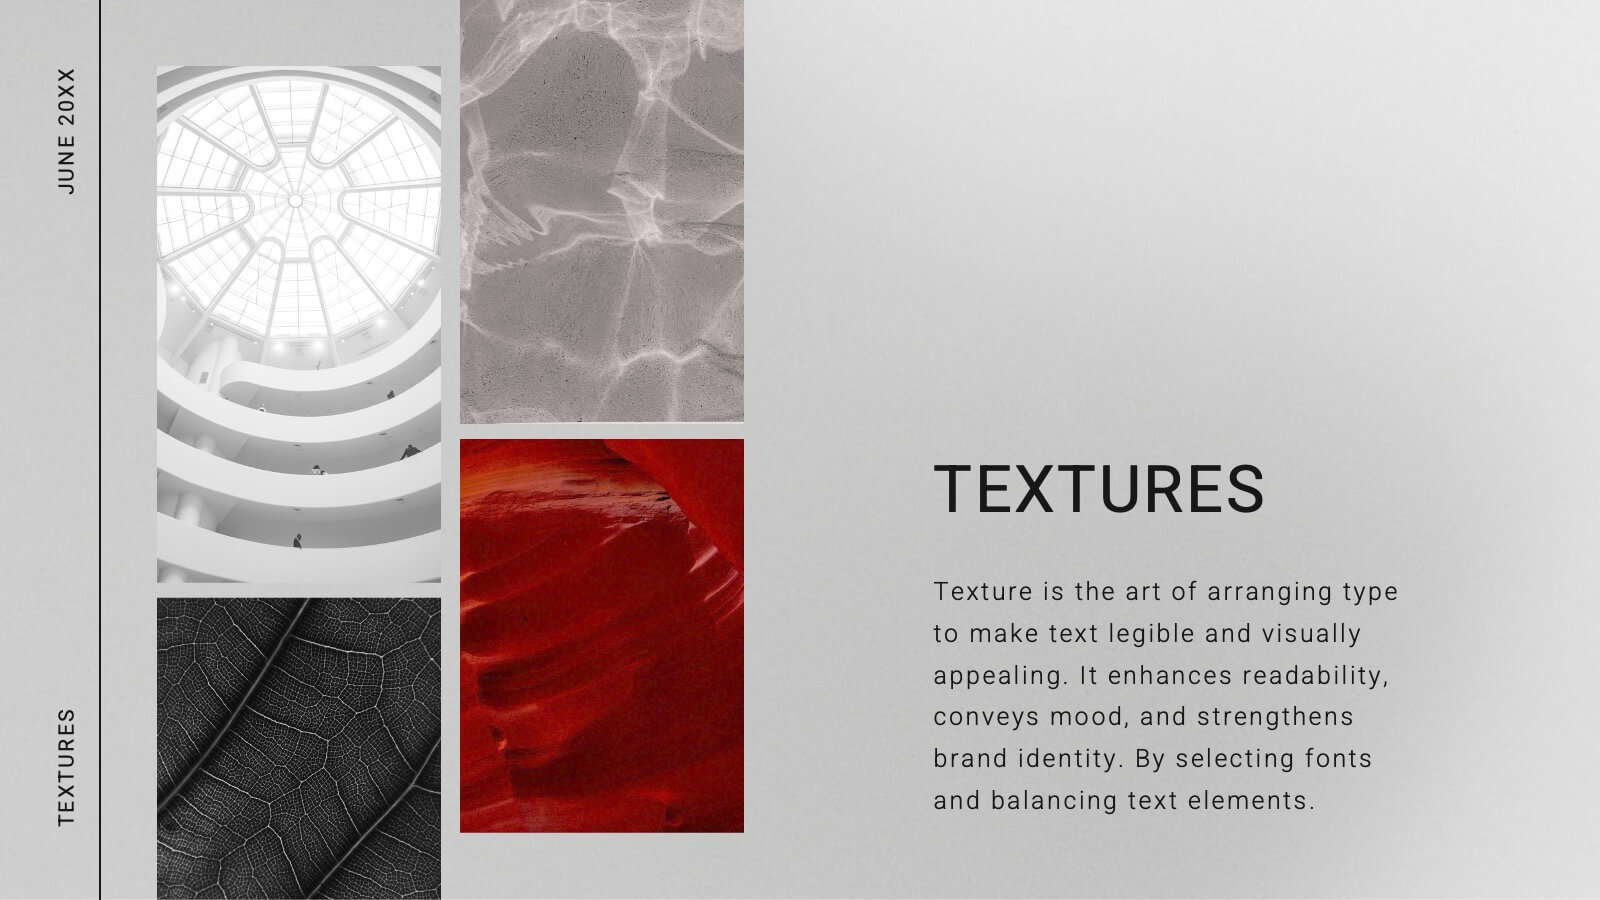
Fusoria Brand Guidelines Proposal Presentation
Build a strong and cohesive brand identity with this sleek and professional brand guidelines proposal presentation. Covering essential topics like typography, color palettes, visual direction, and branding principles, this template helps you define and communicate your brand’s essence. Fully customizable and compatible with PowerPoint, Keynote, and Google Slides for a seamless presentation experience.


7 diapositivas
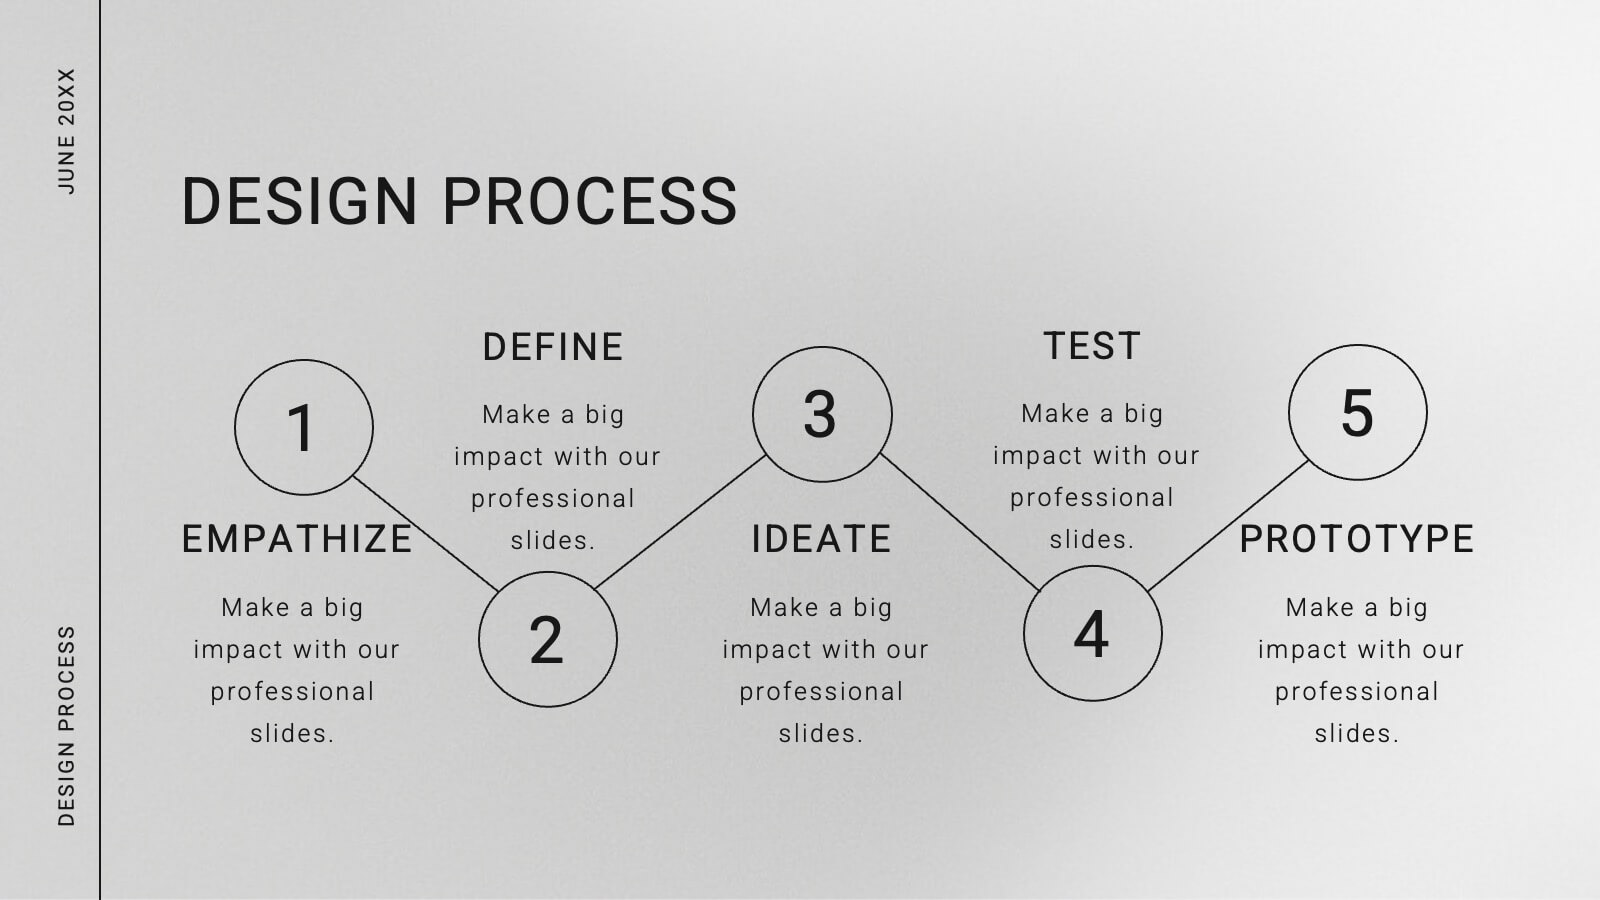
Steps Process Infographic Presentation Template
A steps process is a way of breaking down a task or project into a series of smaller, manageable steps. This template is perfect for showing steps processes in a fun and easy-to-understand way. It's compatible with Powerpoint, Keynote, and Google Slides, so you can use it on any device. This template has attention-grabbing colors to make your presentation stand out. It is also customizable with step charts, so you can make your presentation look just the way you want. With this template, you can make learning fun and easy for your students, or make your business presentations look professional.


24 diapositivas
Zenith Investor Pitch Presentation
Impress your investors with this sleek, modern pitch deck presentation template. Perfect for detailing problem statements, solutions, business models, and revenue projections, it features a professional design with a cohesive color scheme. Highlight key elements like market opportunities, competitive landscapes, and financials to captivate your audience. Compatible with PowerPoint, Keynote, and Google Slides, it ensures seamless presentations on any platform.


6 diapositivas
Social Media Analytics Infographic
Social Media Analytics refers to the process of collecting, analyzing, and interpreting data from social media platforms to gain insights into audience behavior, content performance, and overall social media effectiveness. This template showcases key concepts and insights related to social media analytics. This template is designed to help individuals and businesses understand and leverage the power of data-driven analysis to enhance their social media strategies. This template is perfect to optimize your social media presence, improve engagement, and drive meaningful results. Compatible with Powerpoint, Keynote, and Google Slides.


4 diapositivas
Corporate Strategy Business Case Presentation
Develop a winning corporate strategy with this structured business case template! Perfect for analyzing finances, operations, market trends, and client insights, this clean and organized layout helps businesses communicate key strategies effectively. Fully customizable and compatible with PowerPoint, Keynote, and Google Slides for seamless, professional presentations.


5 diapositivas
Sports Industry Market Trends Presentation
Visualize key metrics in the sports sector with this dynamic Sports Industry Market Trends slide. Designed with a timeline layout and medal-inspired percentage rings, it allows you to highlight four core insights or data points. Ideal for industry overviews, competitor benchmarking, or annual sports business reports. Fully editable in PowerPoint, Keynote, and Google Slides.


20 diapositivas
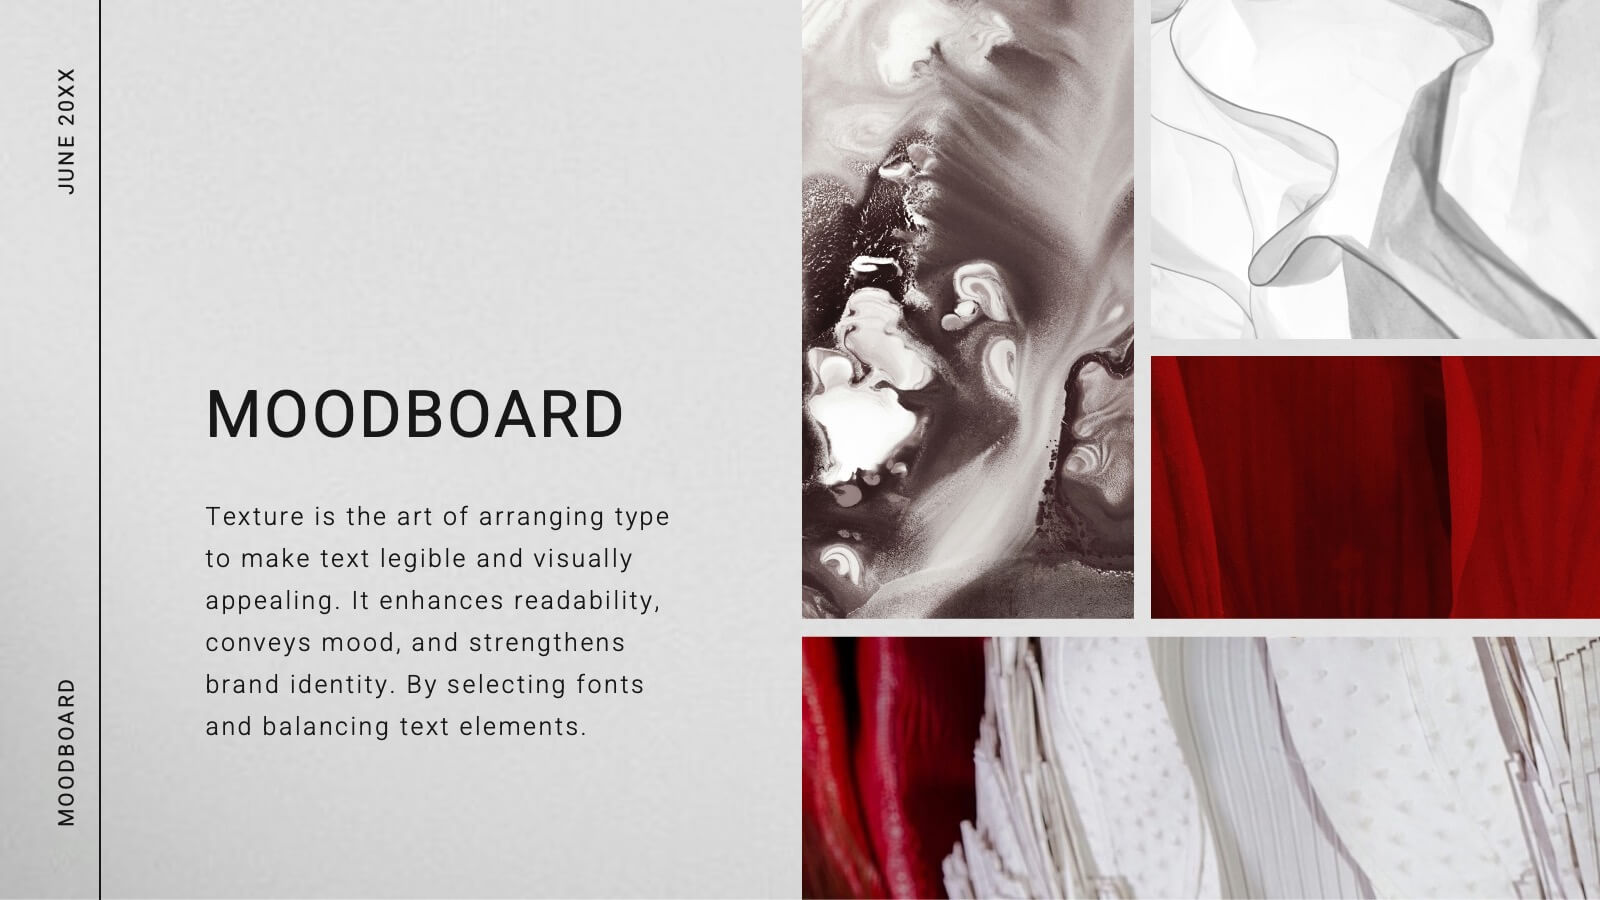
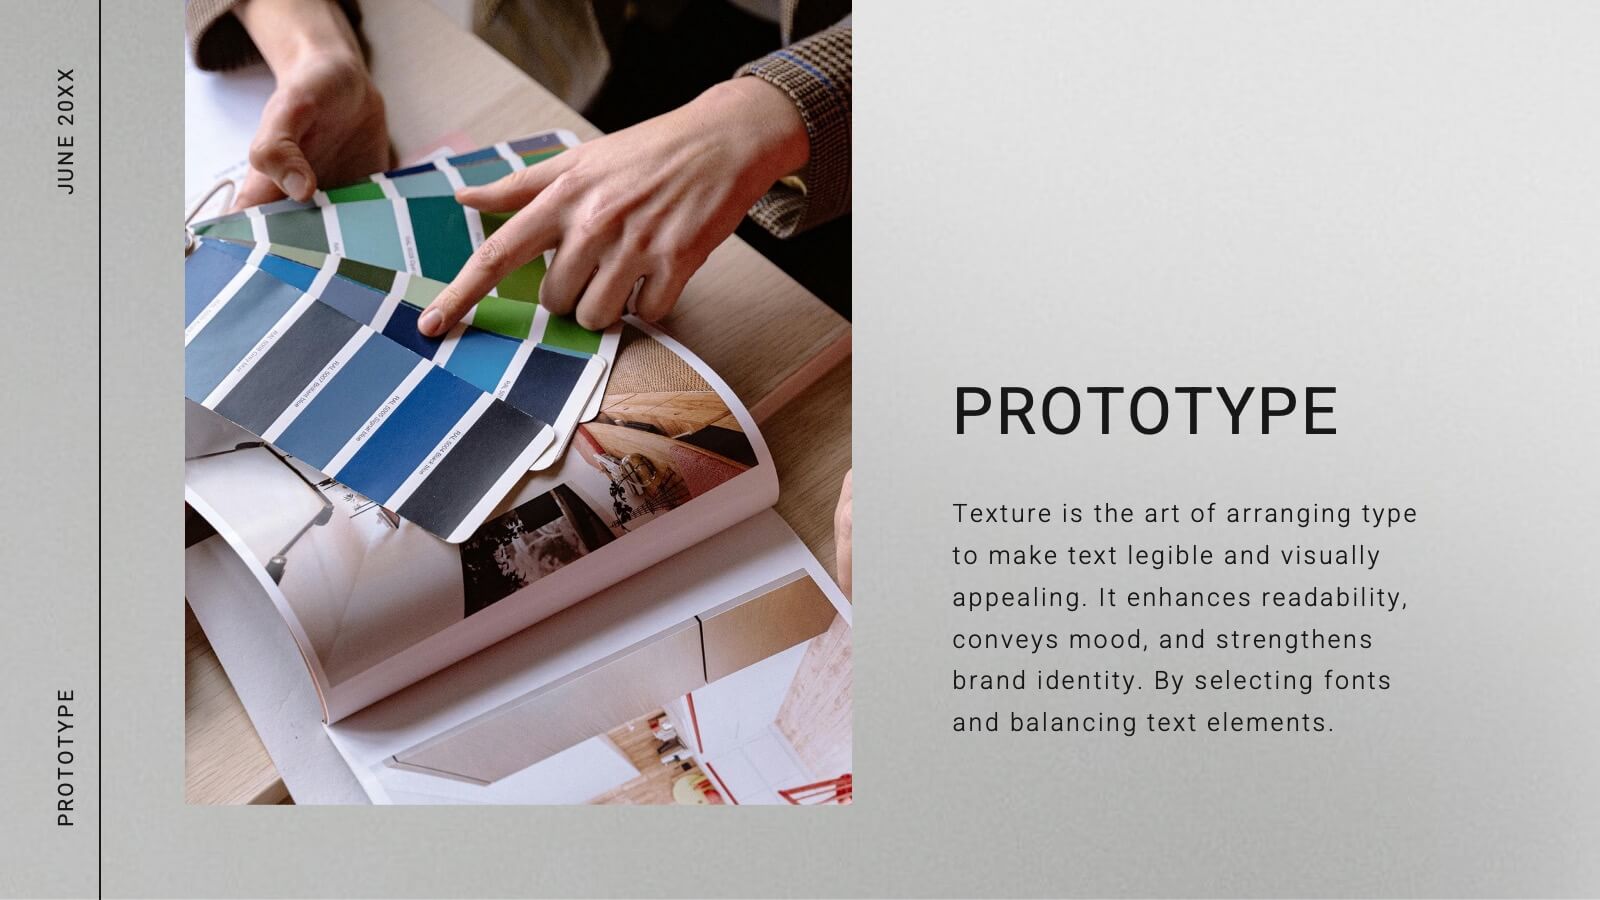
Comet Graphic Design Project Plan Presentation
Craft stunning design project presentations with this elegant template. Showcase objectives, processes, mood boards, and final designs effectively. Ideal for creative teams and clients. Fully compatible with PowerPoint, Keynote, and Google Slides.


5 diapositivas
Essential Education Infographics
Education is a key driver of individual and societal progress, and investing in education is essential for building a better future for all. This vertical infographic template is designed for educators, trainers, and other professionals who want to create informative and visually appealing educational materials. The theme of the template is centered around education, with bright and colorful illustrations of books, pencils, and other educational tools. Compatible with PowerPoint, Keynote, and Google Slides. Each slide is fully editable, allowing you to easily change the colors, fonts, and content to suit your needs.


7 diapositivas
Company Profile Infographic
This collection of company profile templates is designed to meet the diverse needs of various businesses, providing an efficient and polished method for presenting a company's identity, accomplishments, and offerings. Each template is meticulously crafted to cater to different professional contexts, making them suitable for annual reports, investment summaries, or internal briefings. Structured for clarity, these templates enable businesses to effectively communicate essential details such as company history, objectives, and the breadth of services or products offered. They are also equipped to showcase crucial statistics like employee numbers, significant achievements, and organizational hierarchy, enhancing the overall presentation. The design blends modern aesthetics with functionality, incorporating a professional color palette and clean layout that holds viewer interest and enhances readability. Customization is straightforward, allowing for easy adjustments in colors, fonts, and design elements to align with specific brand identities. Ideal for corporations looking to convey their market stance and engage potential clients, investors, or prospective employees, these templates serve as a vital tool in creating impactful and informative company profiles.