


Características


¿Tienes alguna pregunta?
Recomendar


6 diapositivas
5-Step SEO Marketing Funnel Presentation
Ignite your marketing story with a bold, flowing visual that makes every step feel purposeful and easy to follow. This presentation breaks down each stage of the SEO funnel, helping you explain strategy, performance, and conversion paths with clarity. Fully compatible with PowerPoint, Keynote, and Google Slides.


8 diapositivas
Customer Demographics Target Market Presentation
Dive into the depths of your audience with the "Customer Demographics Target Market" presentation template. Ideal for marketers and businesses aiming to understand and segment their customer base effectively, this template offers a vibrant, clear visual breakdown of demographic data. Ensure your strategic communications resonate with the right crowd, with compatibility for PowerPoint, Keynote, and Google Slides.


5 diapositivas
Target Audience Analysis Slide Presentation
Discover who your audience truly is with this clear and visually balanced layout designed to simplify audience insights. Perfect for marketing plans, presentations, and strategy reports, it helps you visualize key demographics and behaviors effortlessly. Fully customizable and compatible with PowerPoint, Keynote, and Google Slides for easy editing.


4 diapositivas
Strategic SWOT Matrix Overview Presentation
Present your strategic insights with clarity using the Strategic SWOT Matrix Overview Presentation. This modern slide layout features a sleek horizontal design that separates Strengths, Weaknesses, Opportunities, and Threats into visually distinct segments. Ideal for business planning, strategy reviews, or team discussions. Fully editable in PowerPoint, Canva, and Google Slides.
5 diapositivas
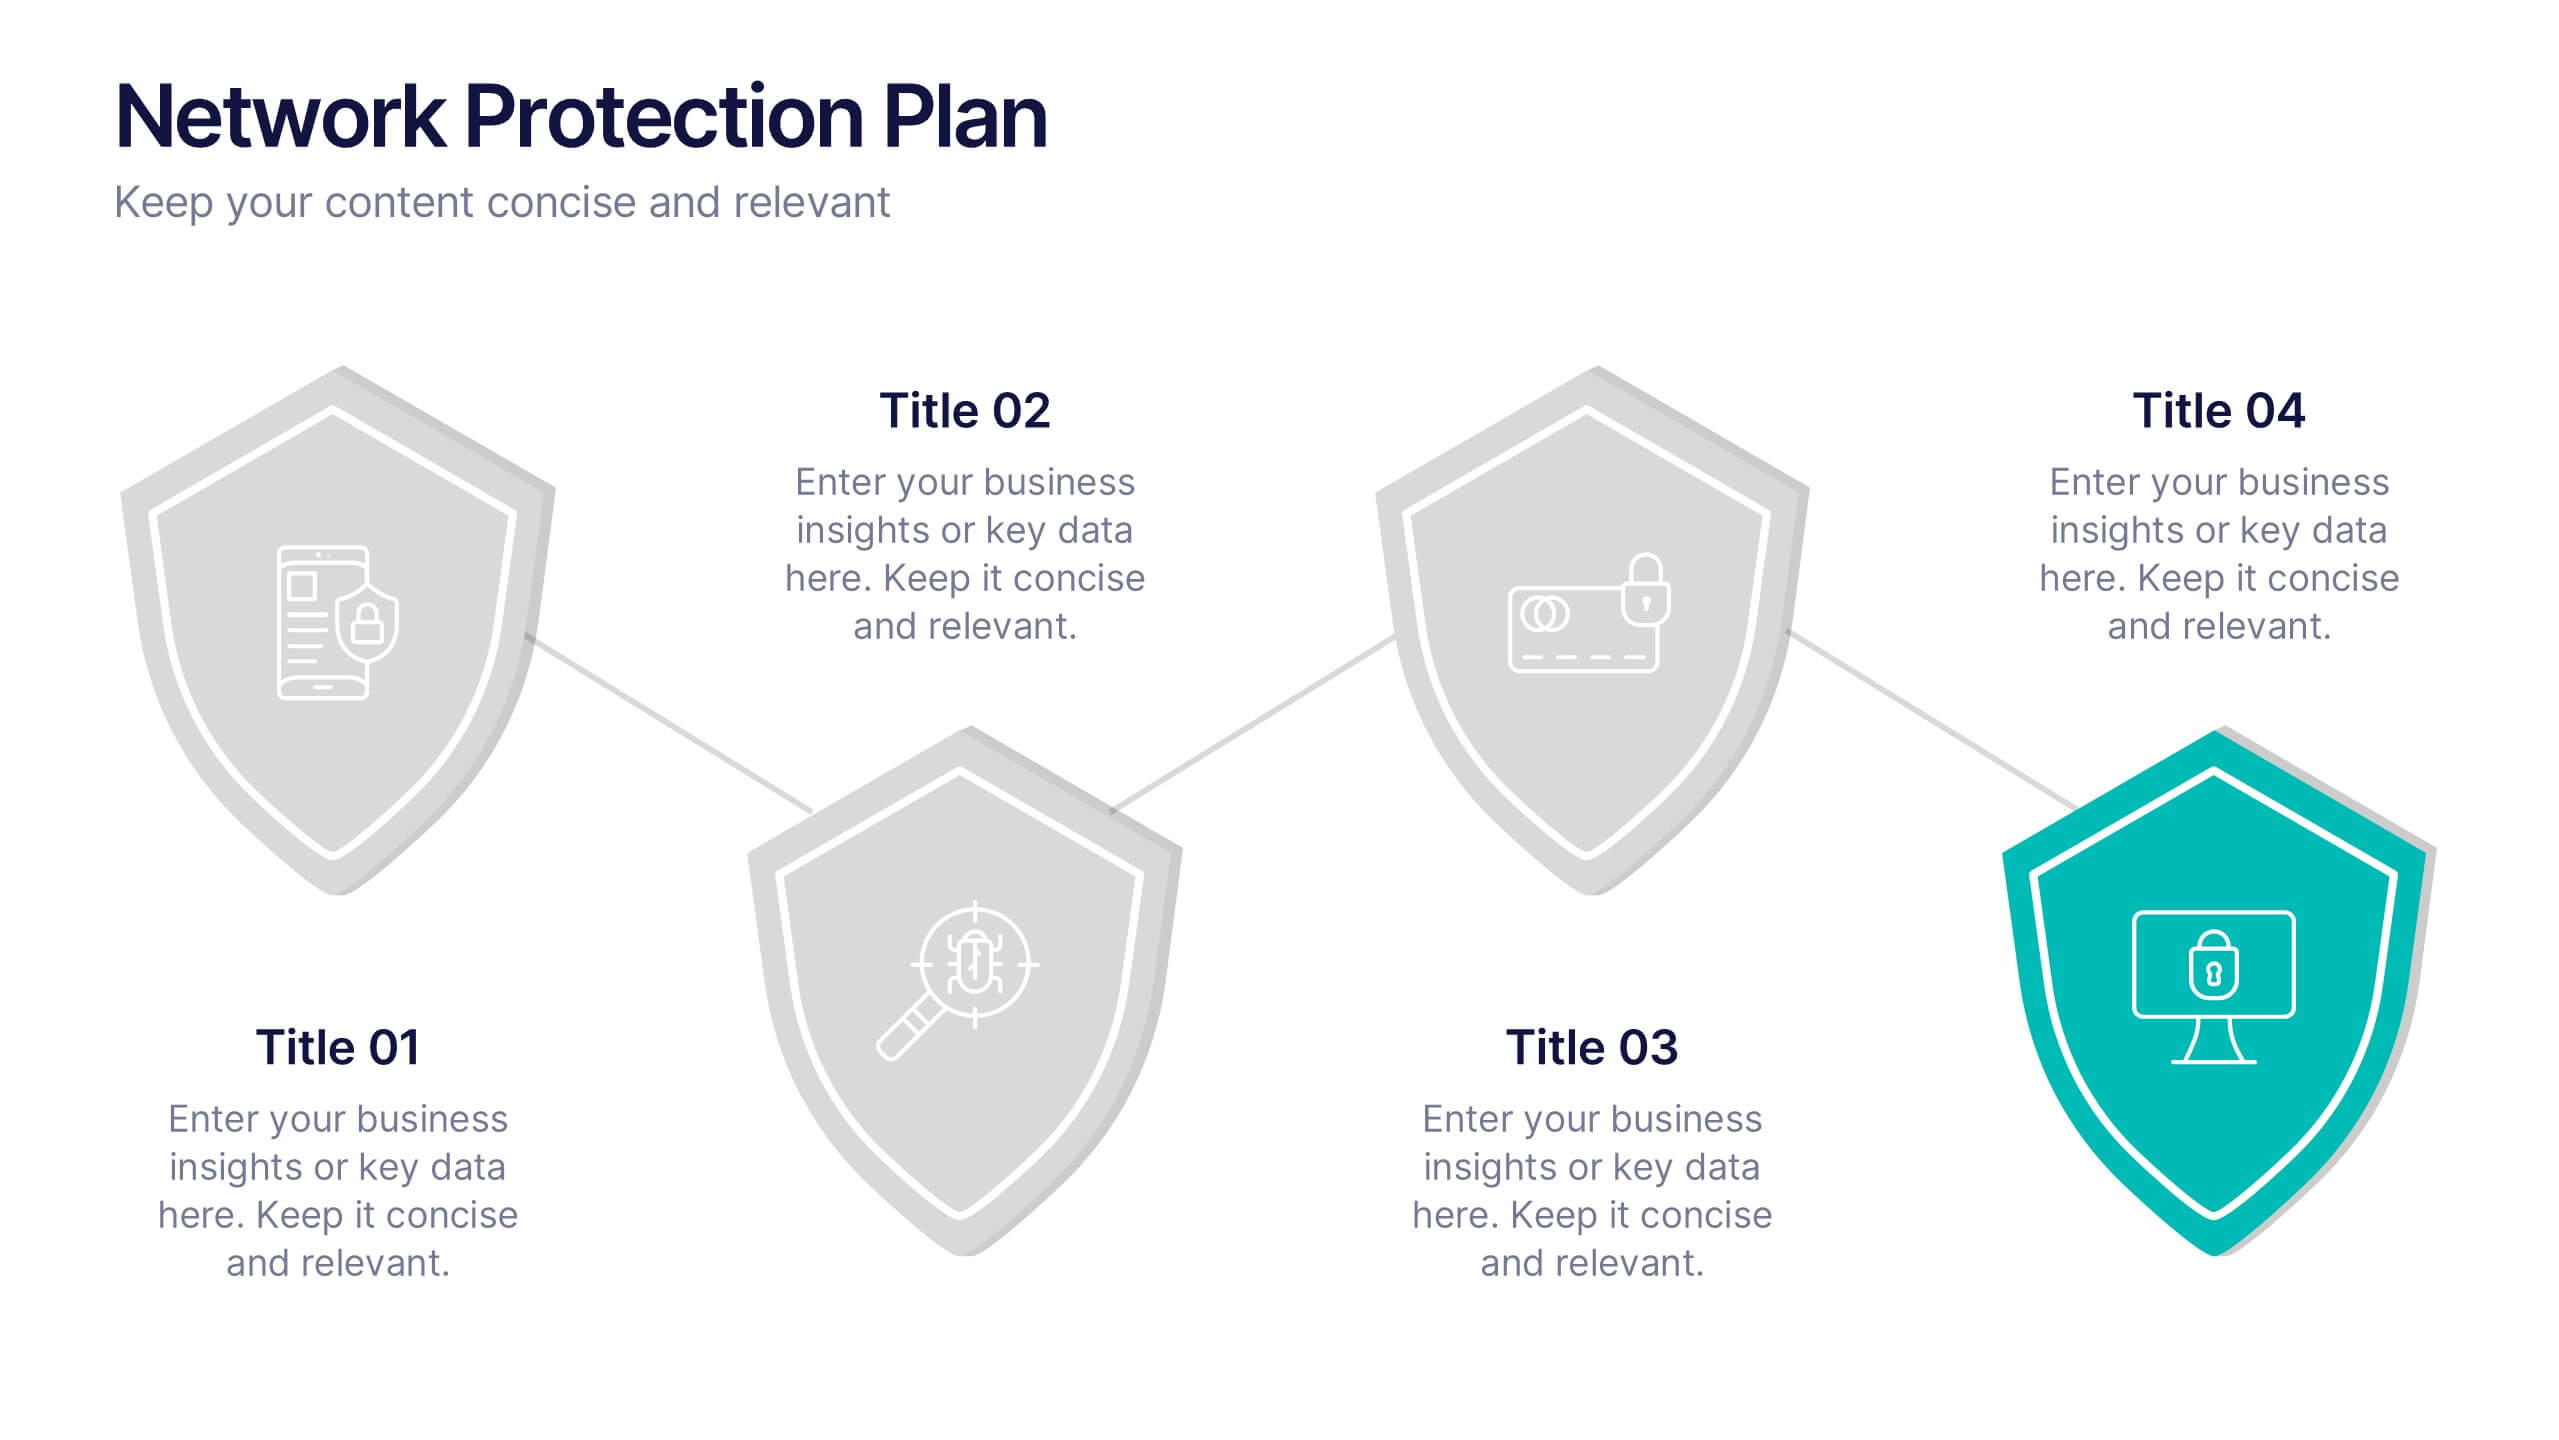
Network Protection Plan Presentation
Bold visuals and clean structure make this presentation a powerful way to communicate your protection strategy with clarity and confidence. It helps you break down key security stages, outline responsibilities, and show how each layer strengthens overall network resilience. Fully compatible with PowerPoint, Keynote, and Google Slides.


7 diapositivas
Time Management Strategies Infographic Presentation
Time management is the process of planning, organizing, and allocating time effectively to achieve specific goals and objectives. This simple and professional template shows you the basics of time management. It uses a combination of bullet points, tables and illustrations to give you the information you need in a practical form. Use this presentation as a step-by-step guide on how you can become more efficient at managing daily business tasks. This infographic template is designed to help you manage your time and prioritize your actions by highlighting the different aspects of a task.
5 diapositivas
Tracking Milestones and SMART Goals Presentation
Visualize your SMART goals with clarity using this arrow-based infographic template. Each step—Specific, Measurable, Achievable, Relevant, and Time-bound—is clearly segmented to track progress and prioritize objectives. Fully editable in Canva, PowerPoint, and Google Slides, it’s perfect for planners, project managers, and strategists seeking to streamline goal achievement.


7 diapositivas
Feedback Infographics Presentation Template
The goal of feedback is to recognize strengths and improve weaknesses. Feedback, both positive and negative, helps us see what we can improve on in order to better our results. This template is perfect for understanding how essential feedback is, and learning how to deliver feedback in a productive way. It provides positive criticism, showing what you can improve to achieve better results and success. Feedback provides the opportunity to learn, and is the most effective way to improve your skills. This template makes it simple to create an informed and well-rounded presentation to share.


5 diapositivas
Root Cause Analysis Fishbone Slide Presentation
Give your problem-solving sessions a fresh visual spark with a tree-style diagram that makes tracing causes feel clear and intuitive. This presentation helps you break down issues, organize insights, and present findings with clean, structured flow. Perfect for teams and workshops. Fully compatible with PowerPoint, Keynote, and Google Slides.


6 diapositivas
Project Roadmap with Strategic Phases Presentation
Visually guide your team through every phase with the Project Roadmap with Strategic Phases Presentation. This template features a curved arrow layout to illustrate project milestones, making it perfect for planning, strategy, or progress updates. Fully customizable in PowerPoint, Google Slides, and Canva for seamless integration into any workflow.


5 diapositivas
Risk and Obstacle Mapping Presentation
Turn up the heat on problem-solving with this vibrant template designed to visualize risks and roadblocks clearly. Use this layout to assess, categorize, and communicate potential business obstacles with precision. It's ideal for risk analysis presentations and strategy meetings. Fully compatible with PowerPoint, Keynote, and Google Slides for easy editing.


10 diapositivas
4 Stages of Strategic Execution Process Presentation
Clarify your strategy with the 4 Stages of Strategic Execution Process Presentation. This visually layered circle layout walks your audience through each key stage of execution—ideal for planning, operations, and team alignment. Each step is color-coded and fully editable, ensuring your message stays focused. Compatible with PowerPoint, Keynote, Google Slides, and Canva.


21 diapositivas
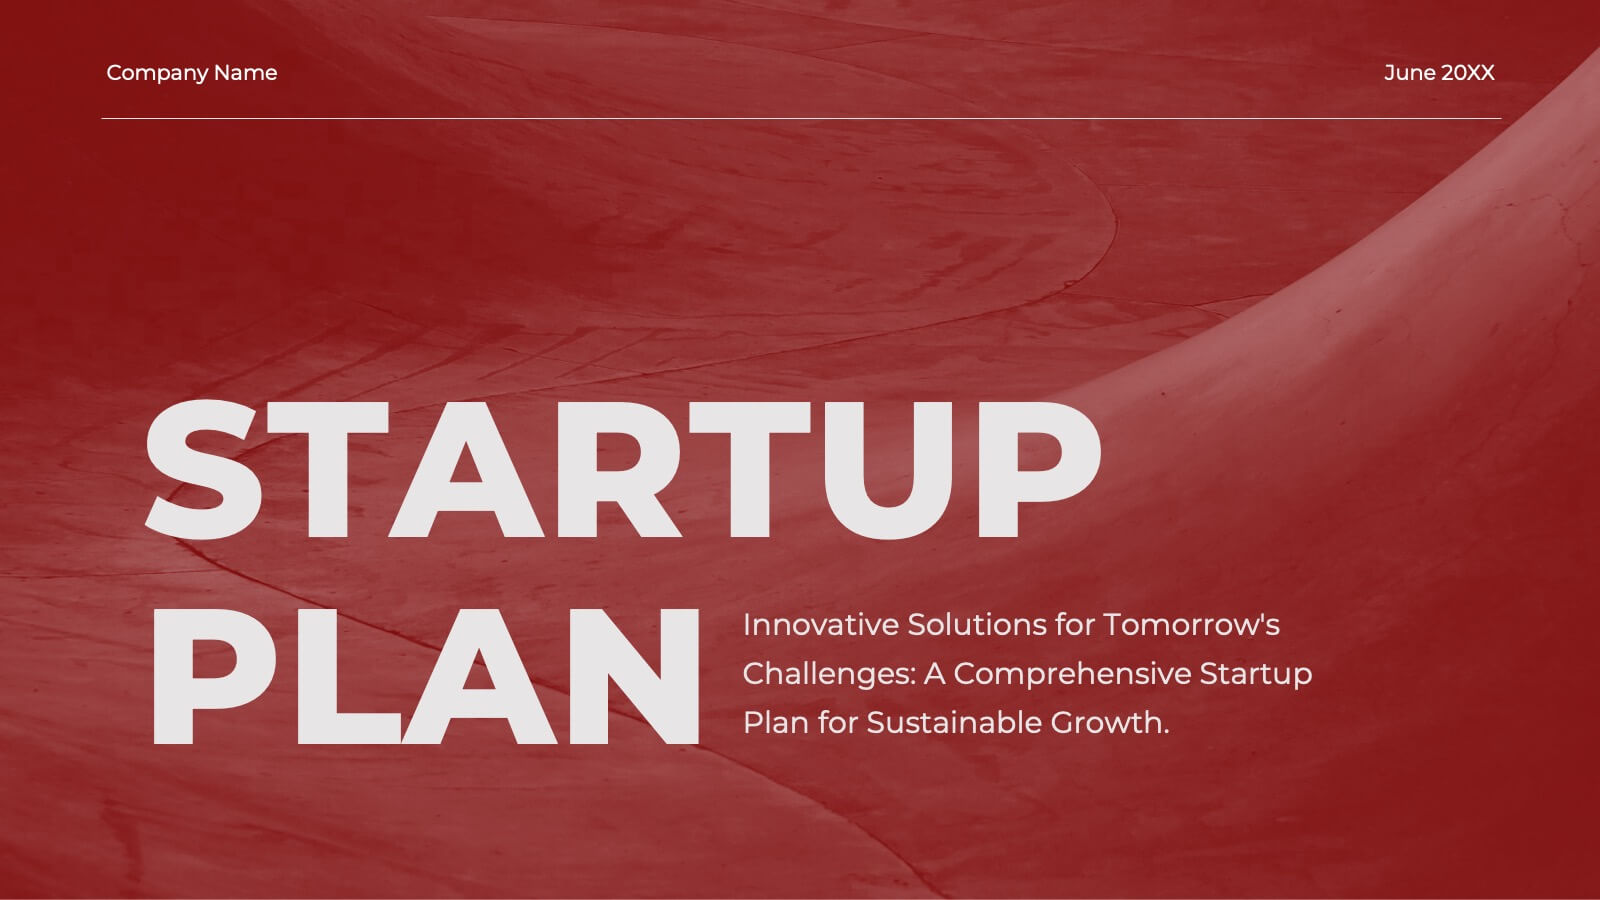
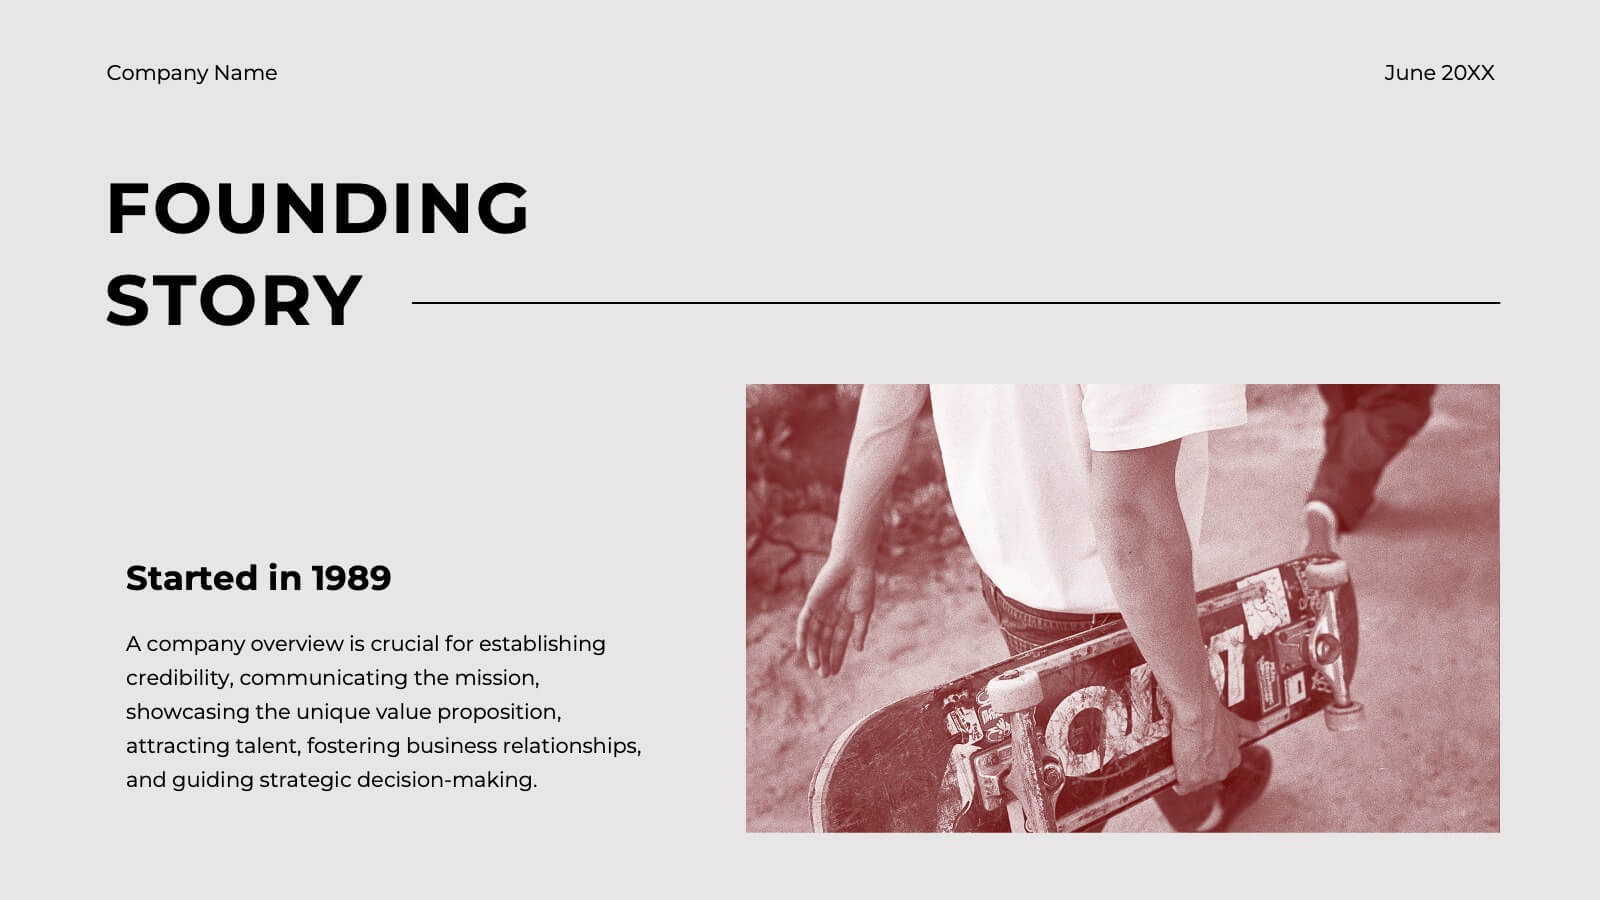
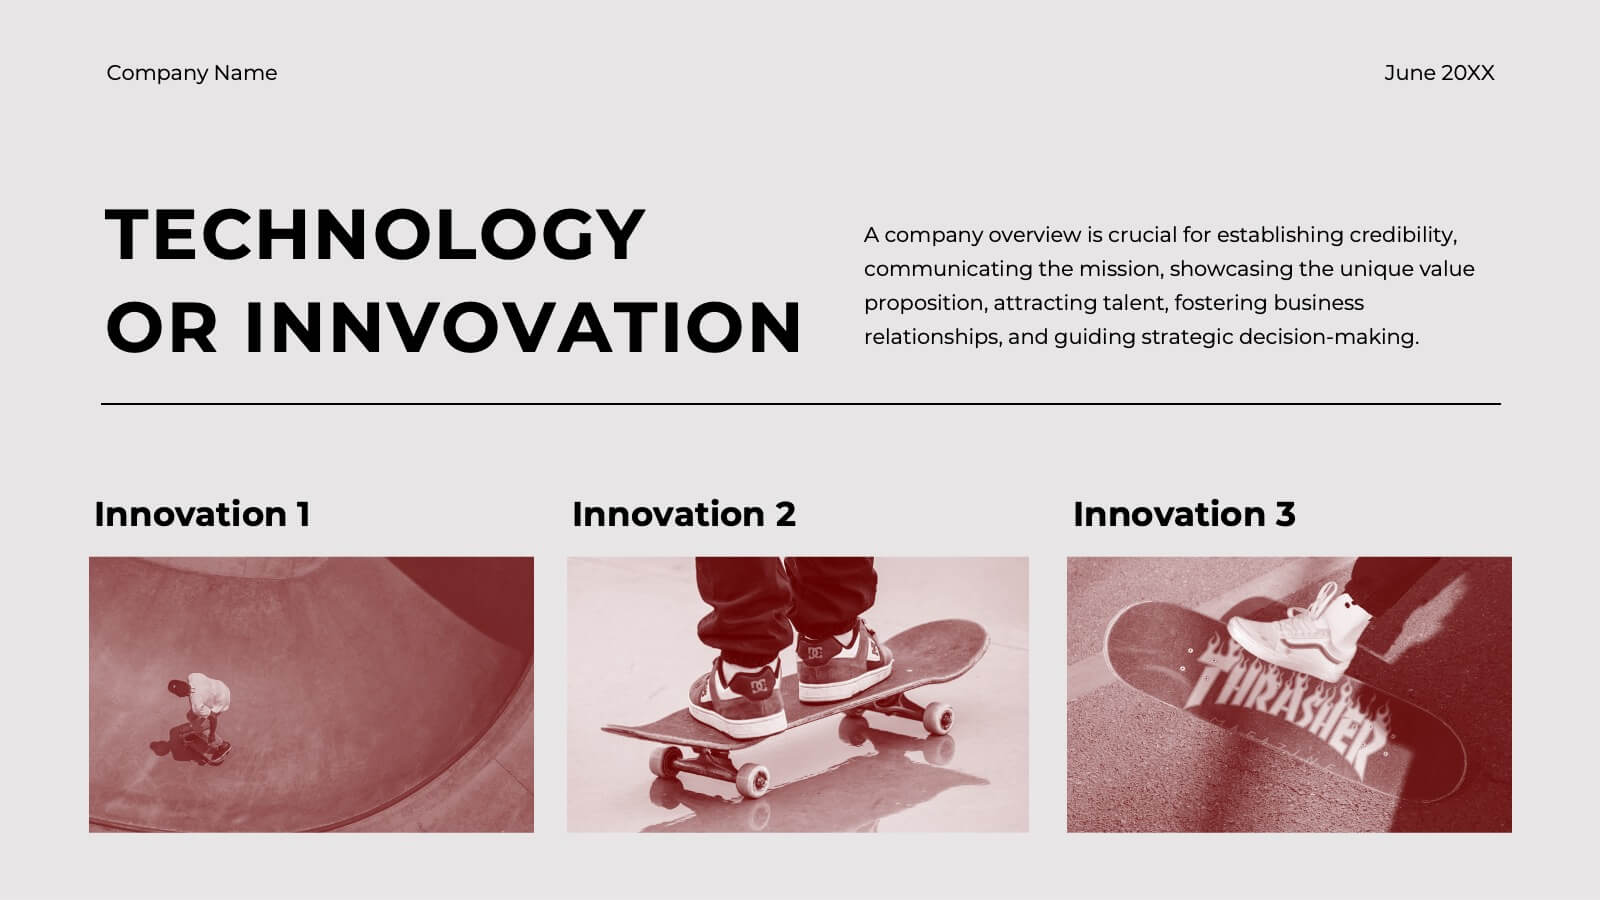
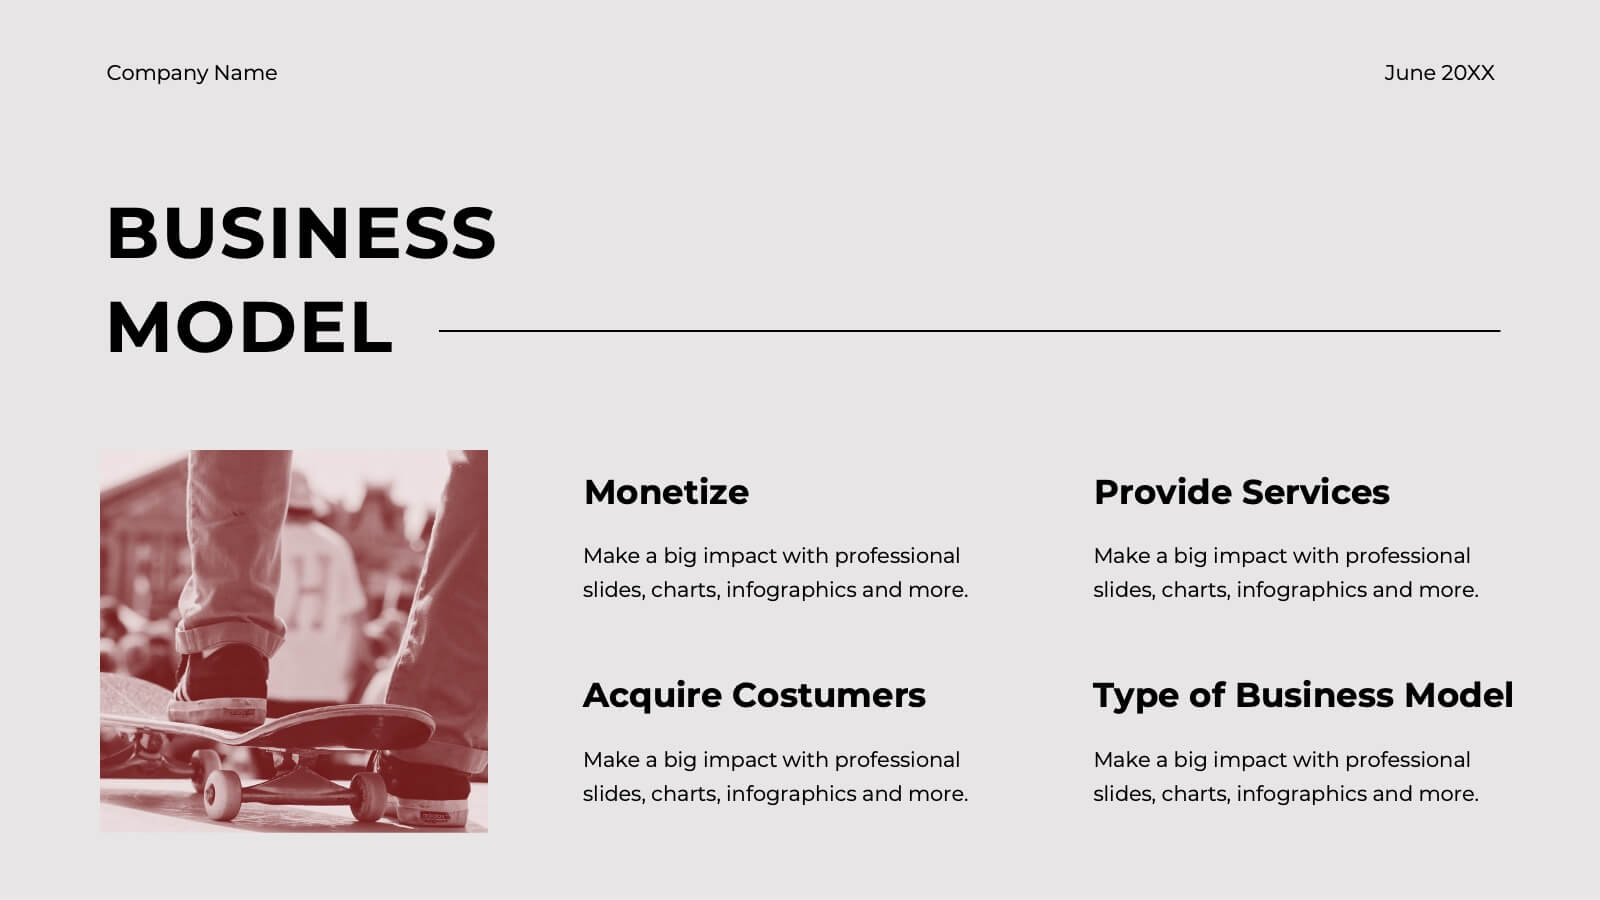
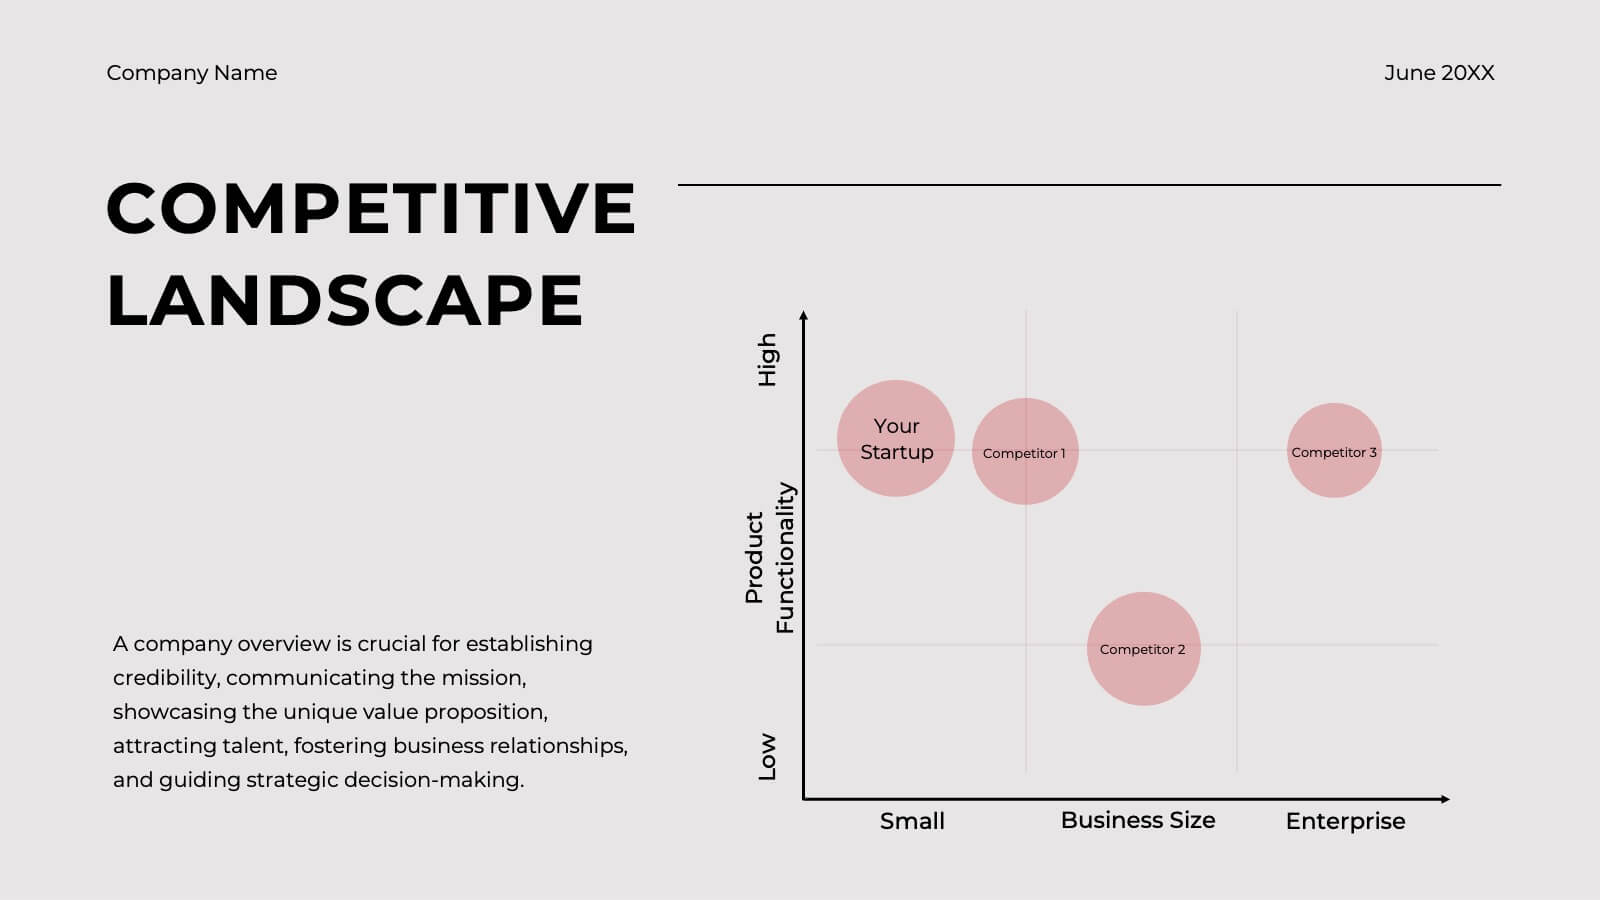
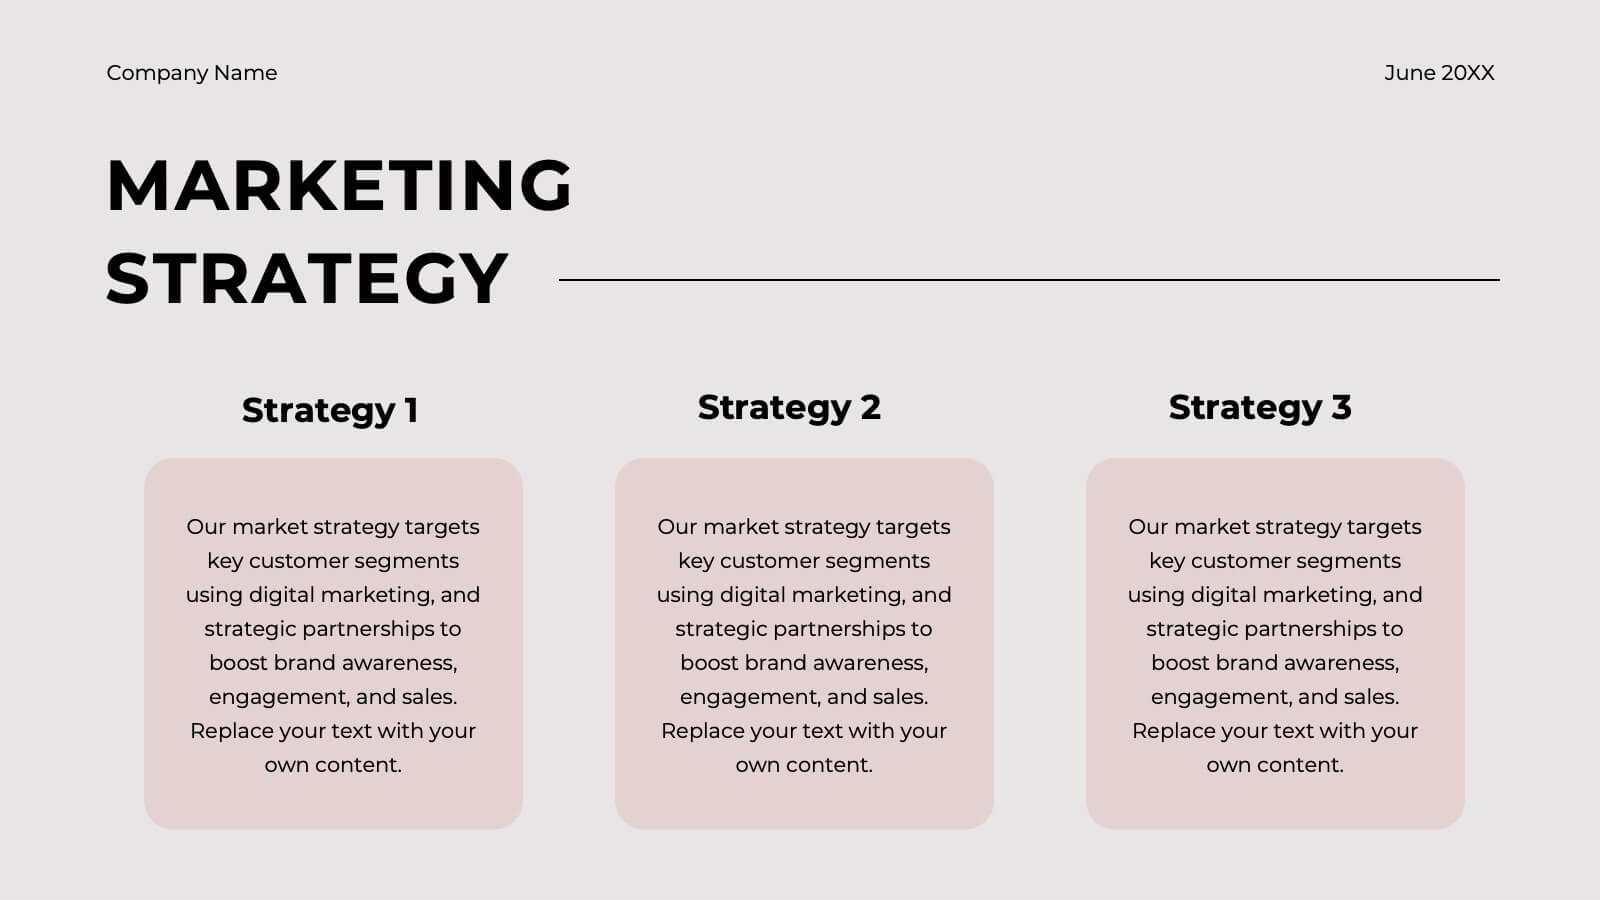
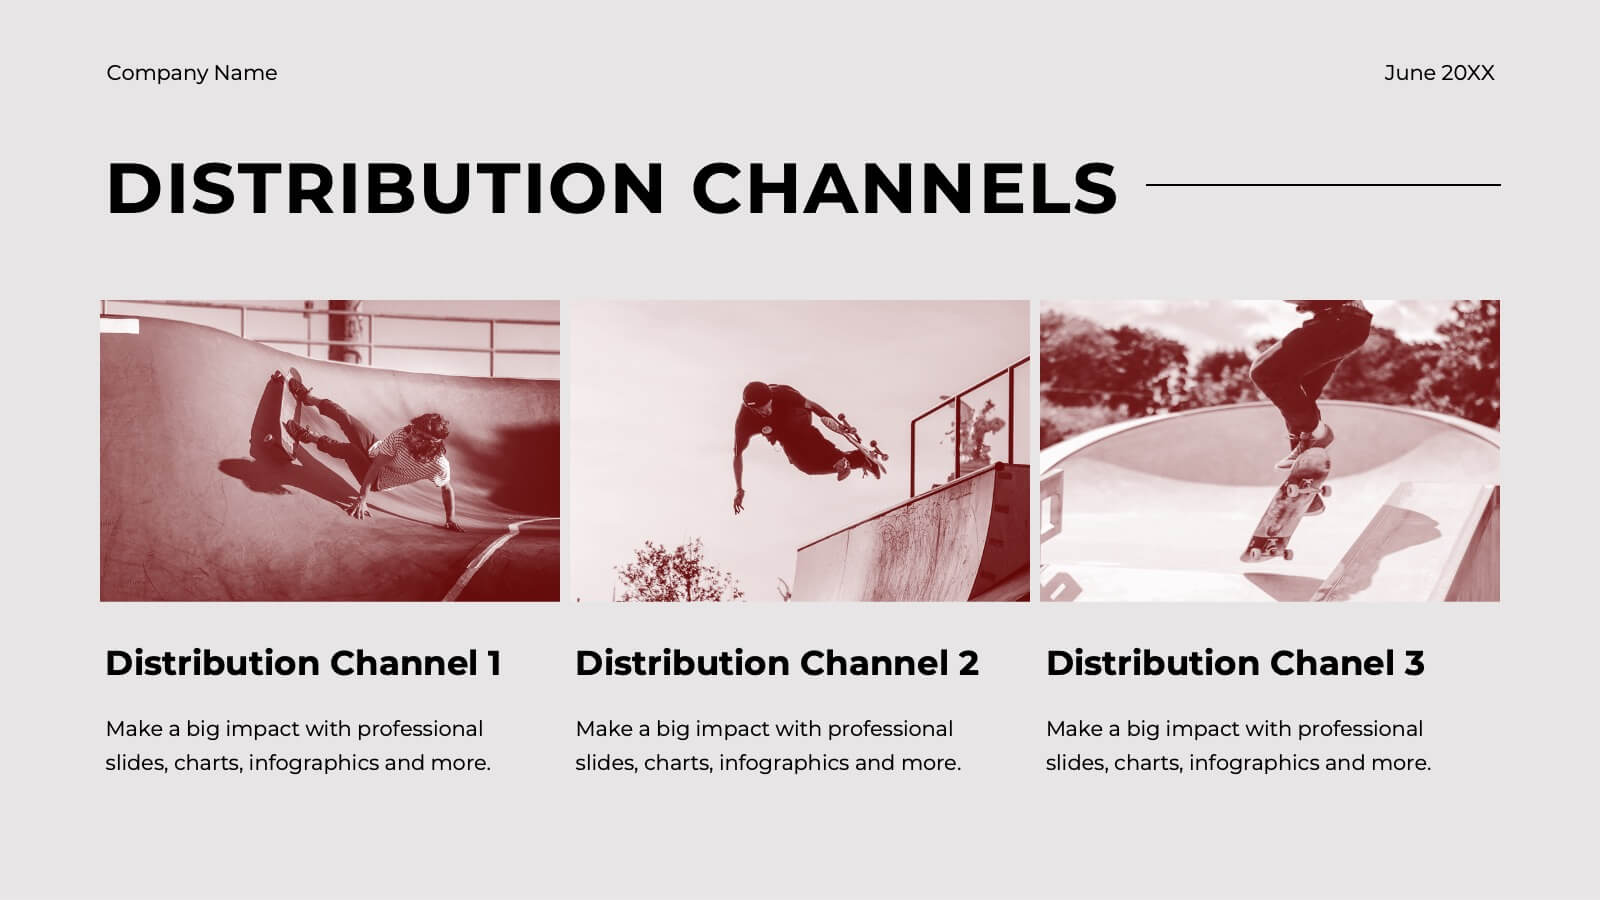
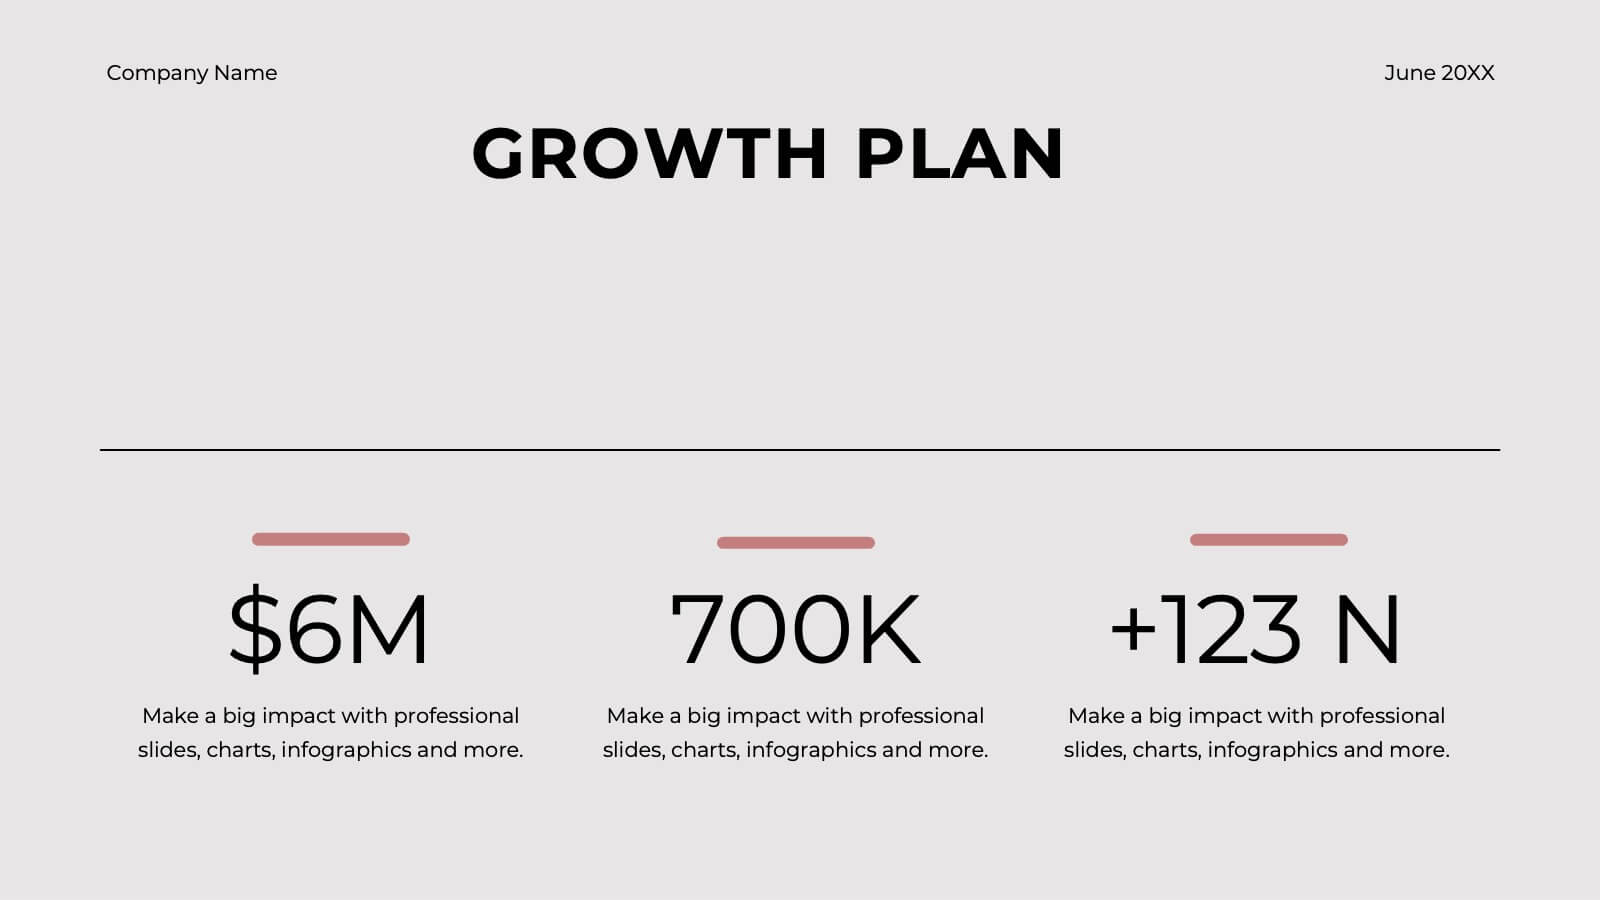
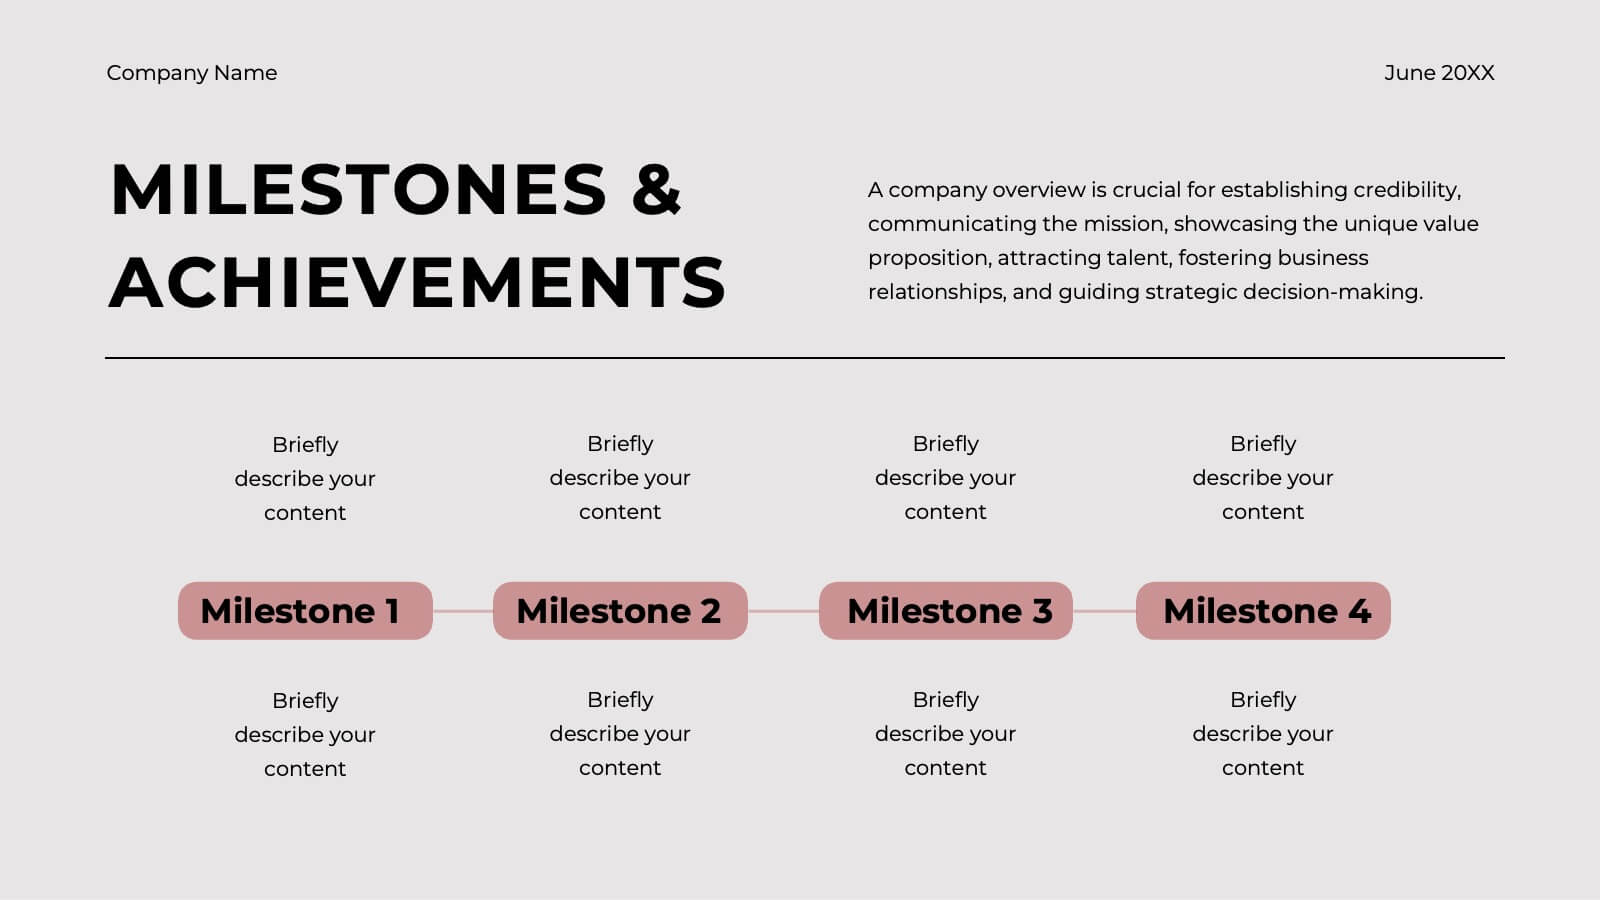
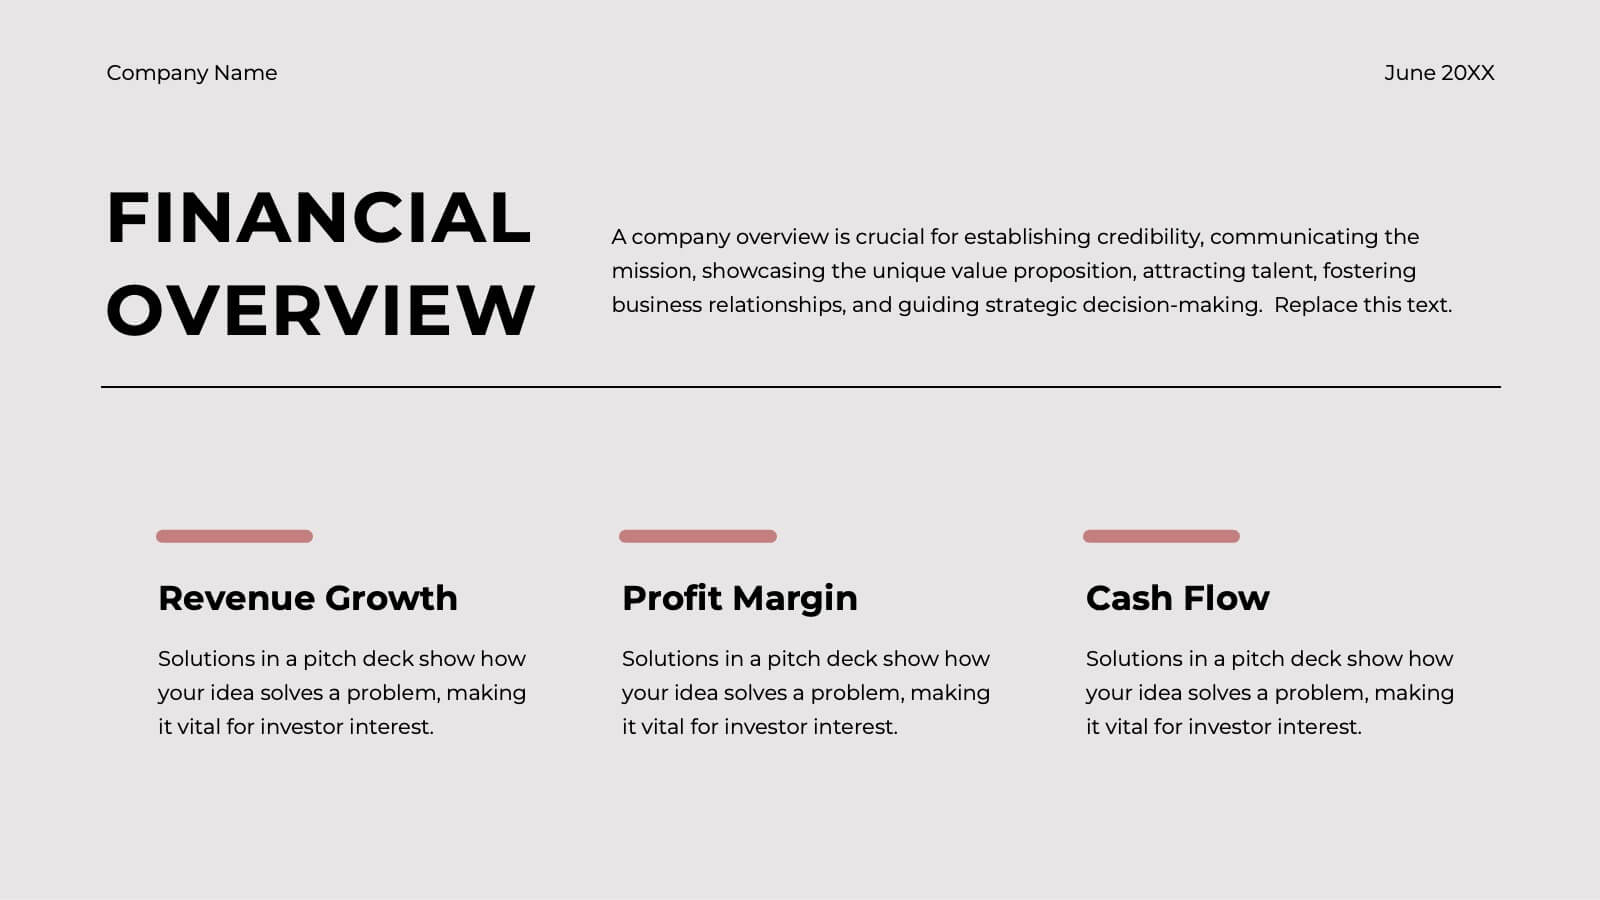
Ember Startup Growth Plan Presentation
Launch your entrepreneurial journey with this dynamic startup plan template! Perfect for detailing your mission, market strategy, and unique value proposition, it features professional slides for customer analysis, business models, and financial projections. Present your innovative ideas clearly and convincingly. Compatible with PowerPoint, Keynote, and Google Slides for seamless presentations on any platform.


7 diapositivas
Medical Group Infographic
introducing our medical group infographic, a seamless blend of clinical precision and informative clarity. Designed predominantly in a calming palette of white and healing green, this infographic effectively encapsulates the diverse facets of a medical group. Through a series of graphics, specialized medical icons, and dedicated image placeholders, one can effortlessly convey intricate medical processes or healthcare strategies. This template is ideally suited for healthcare administrators, medical educators, hospital marketing teams, and anyone striving to present complex medical group data in a simplified, digestible manner.


4 diapositivas
Economic Growth in South America Map Presentation
Gain insights into regional development with the Economic Growth in South America Map template, designed to visualize financial data and economic trends across different areas of the continent. It features a clear map highlighting specific countries, accompanied by customizable bars representing economic indicators in dollar values. This template is excellent for presentations analyzing economic performance and growth opportunities within the continent.


20 diapositivas
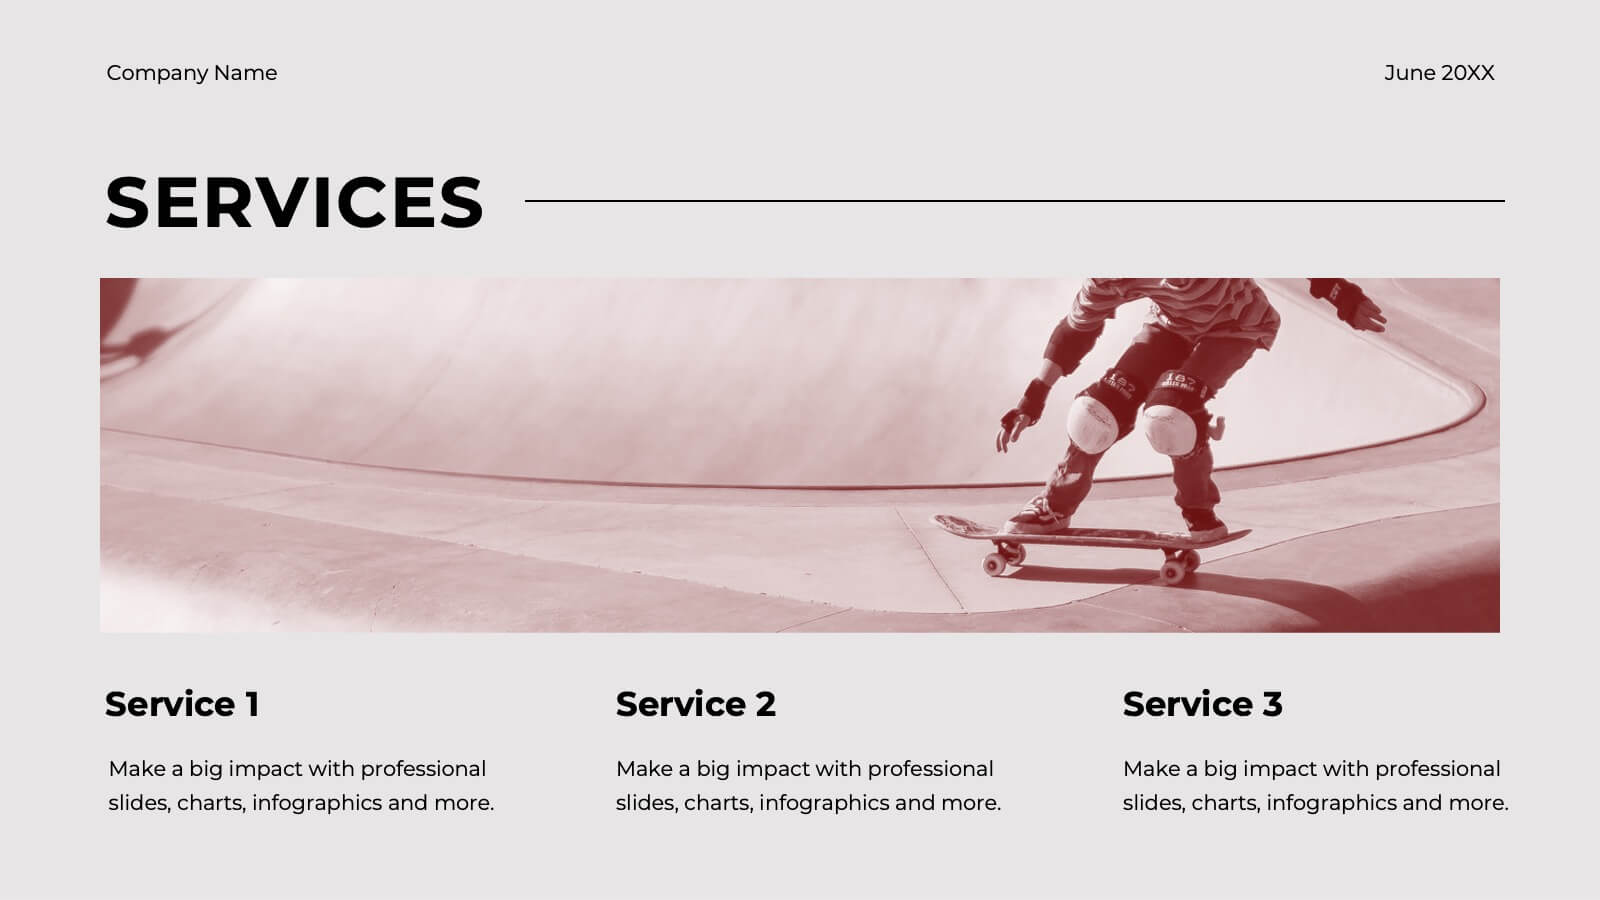
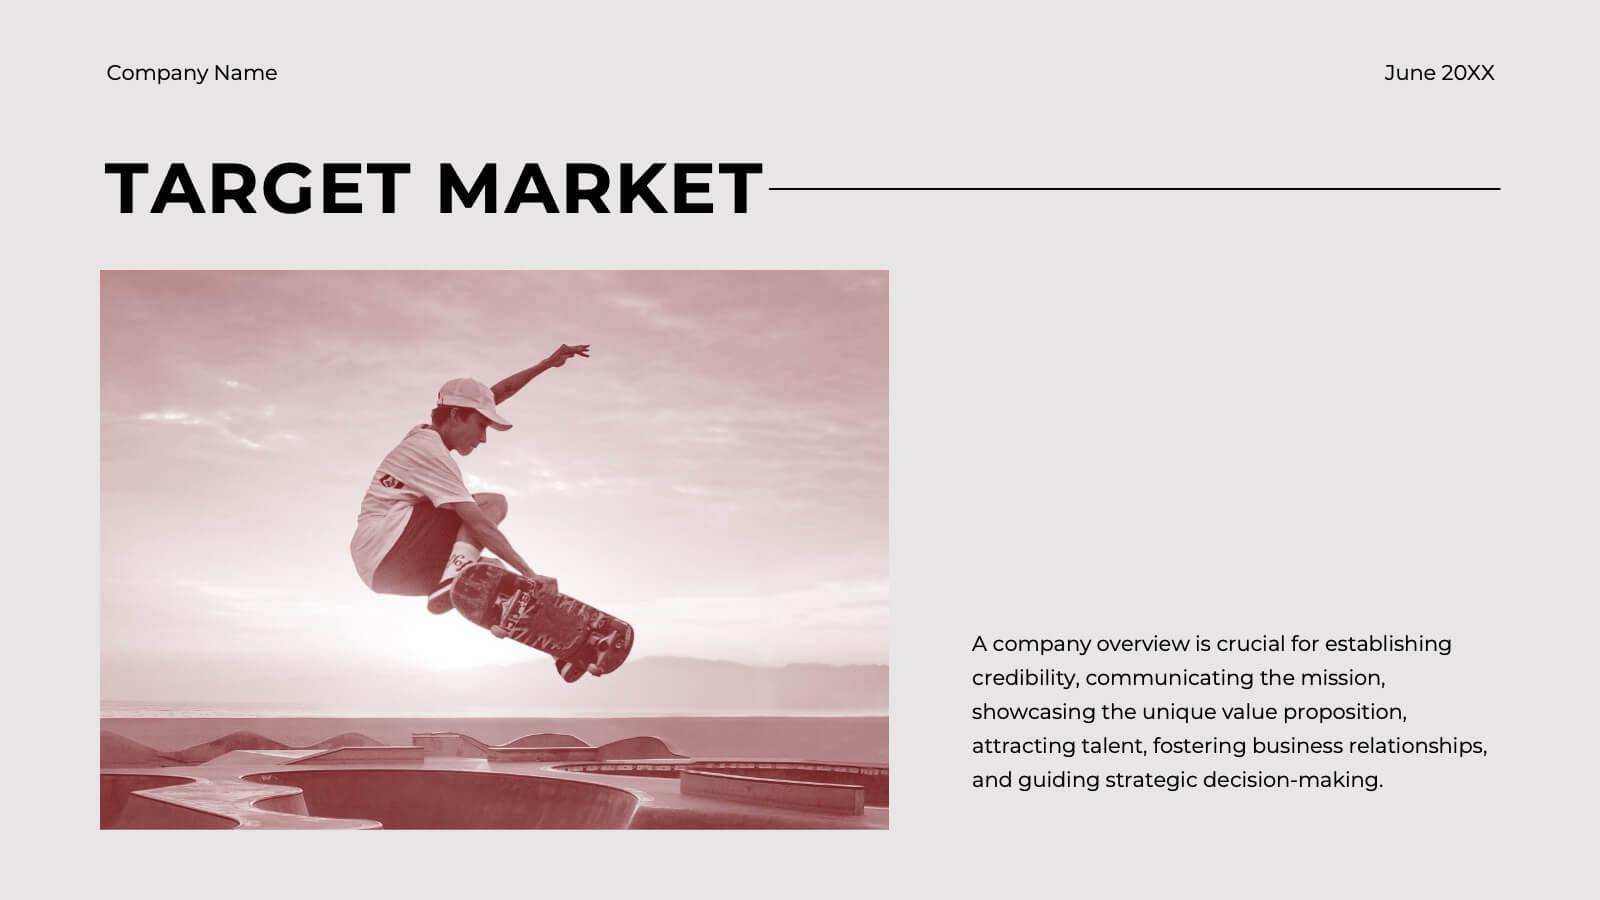
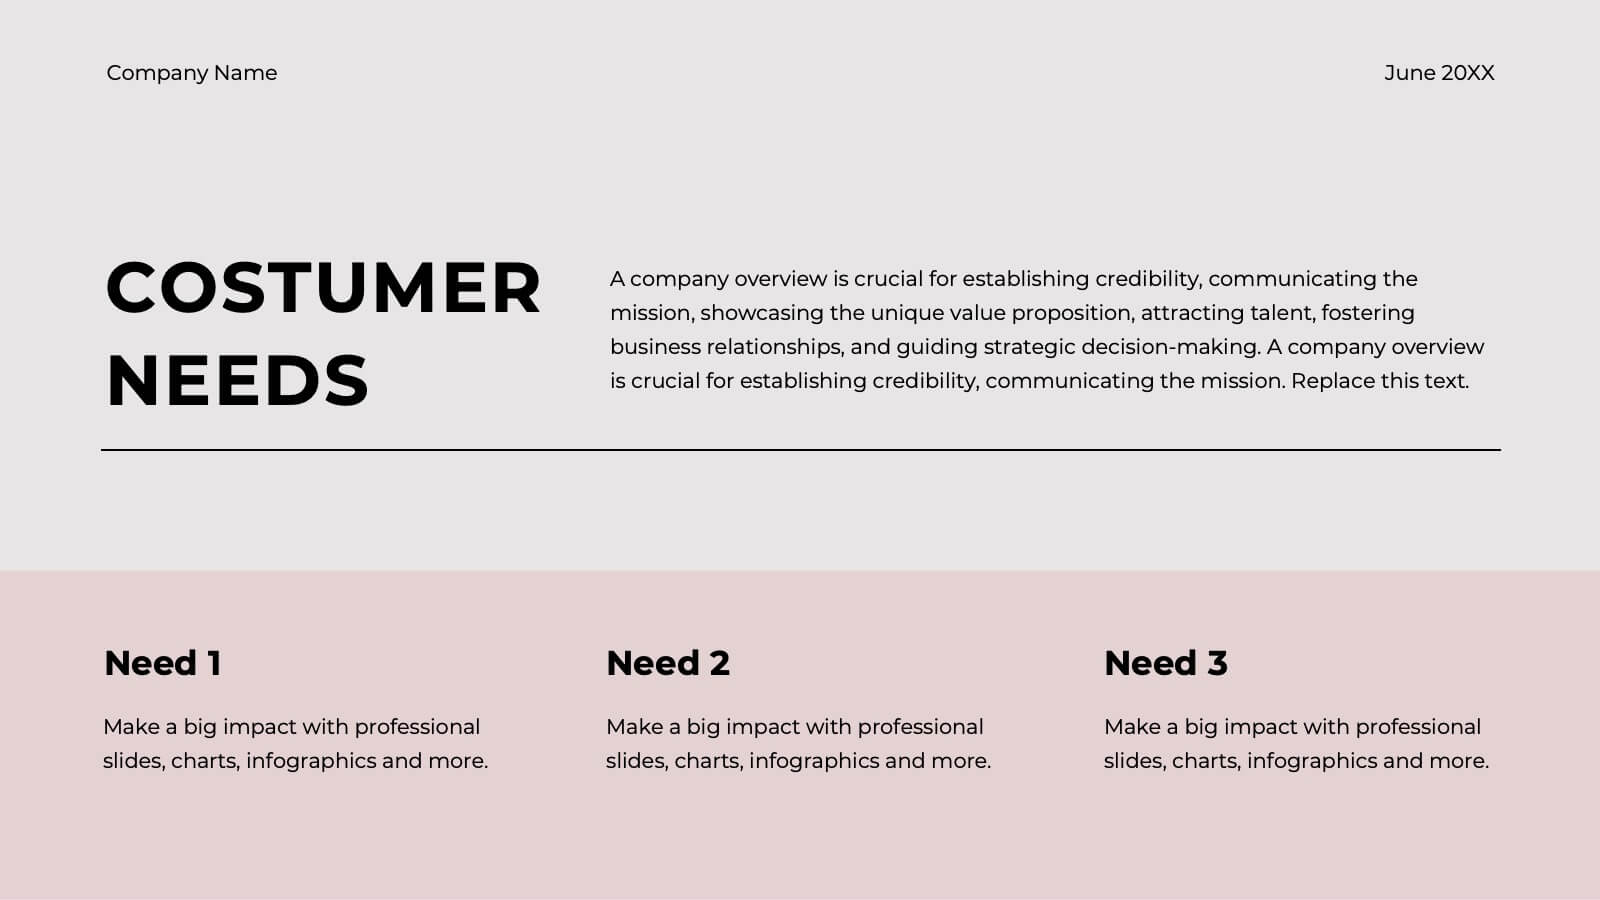
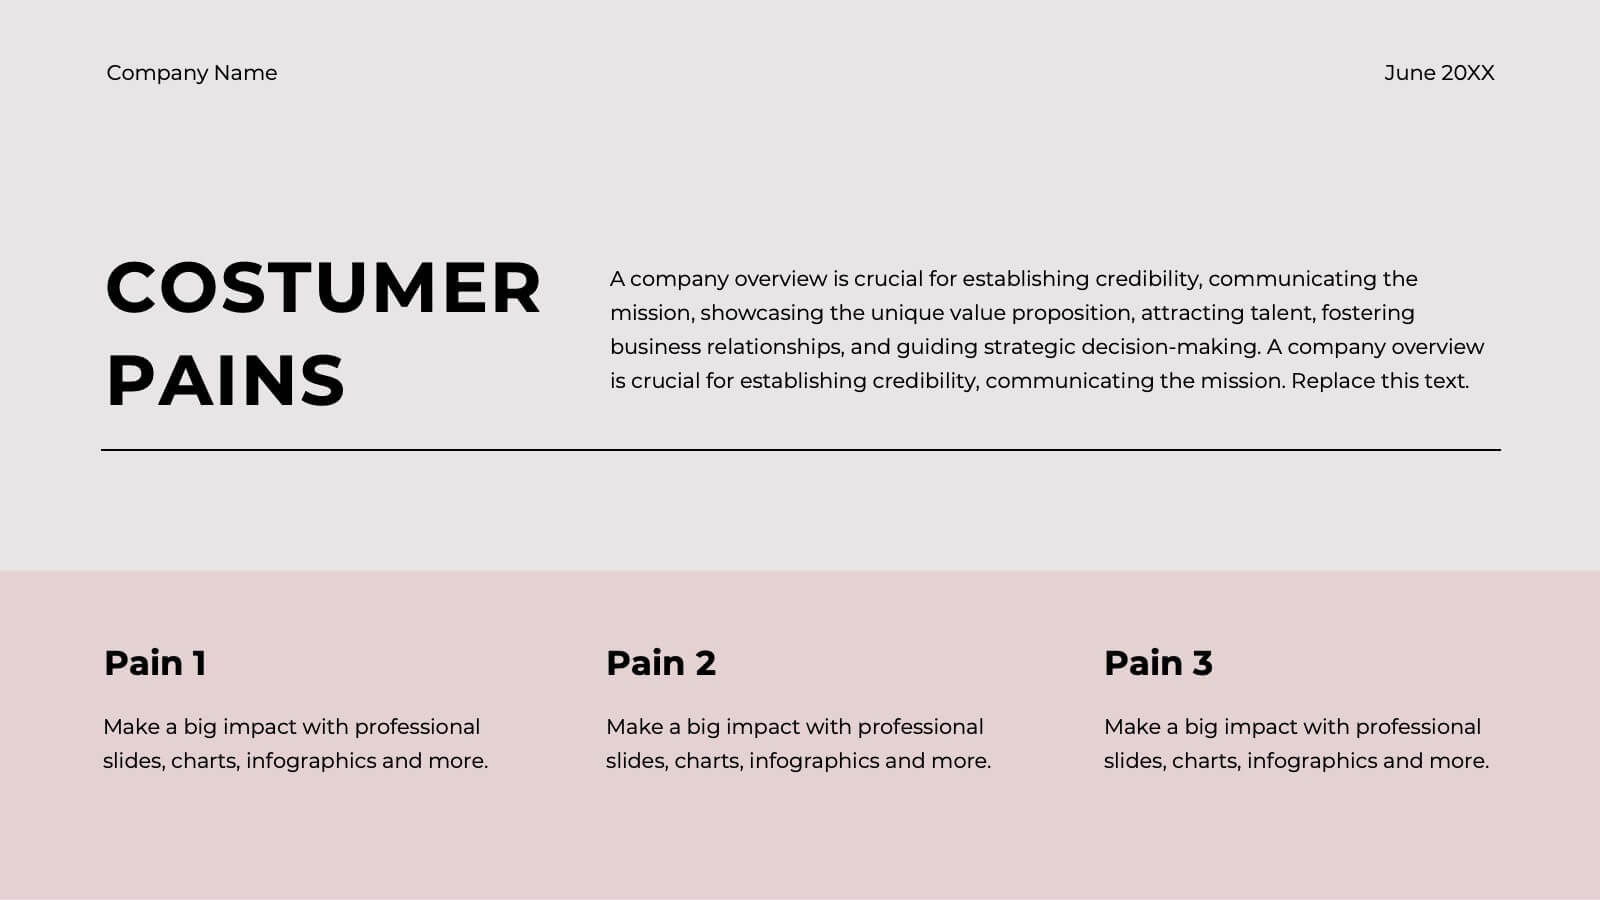
Spartan Content Marketing Pitch Deck Presentation
The Spartan Marketing Pitch Deck is designed to captivate and impress with its bold, modern layout and striking black-and-white color scheme. Perfect for delivering powerful marketing strategies, this template covers all essential aspects from industry overview to consumer behavior analysis. It seamlessly guides you through emerging technologies, content marketing trends, and mobile marketing insights. The deck emphasizes personalization trends, influencer marketing, and the latest eCommerce developments, ensuring your pitch resonates with cutting-edge strategies. Whether discussing SEO and SEM trends or diving into customer experience and brand storytelling, this template delivers your message with clarity and impact. Conclude with a strong call to action, ensuring your audience is engaged and ready to take the next step. Fully compatible with PowerPoint, Keynote, and Google Slides, the Spartan Marketing Pitch Deck is an excellent choice for professionals aiming to deliver a memorable and persuasive presentation.


7 diapositivas
Big Data Analytic Infographics
Big Data are the large and complex data sets that are difficult to process and analyze using traditional data processing methods. This template will allow you to visualize key data points and insights in an appealing and easy to digest way. Your information is presented in a clear manner with a variety of graphs, to convey the fundamentals of big data analytics. Customize this infographic with your own data in the bullet points and graphics. Quickly edit text and colors for your next presentation. All the slide in this template are fully editable in Powerpoint, Keynote, and Google Slides.