


Características


¿Tienes alguna pregunta?
Recomendar


6 diapositivas
South America Biome Map Infographics
Explore our adaptable South America Biome Map infographic template, a powerful resource for visualizing the diverse ecosystems found across the South American continent. This template is fully compatible with popular presentation software such as PowerPoint, Keynote, and Google Slides, enabling you to easily customize it to suit your specific needs. The South America Biome Map infographic template serves as a flexible canvas for illustrating information about various biomes, including rainforests, grasslands, deserts, and more. Whether you're an educator, environmental enthusiast, or simply intrigued by South America's ecology, this template offers an intuitive platform to create informative presentations and educational materials. Impress your audience with this SEO-optimized South America Biome Map infographic template, expertly designed for clarity and user-friendliness. Customize it to showcase the unique features and biodiversity of South America's biomes, making it an invaluable tool for your projects and presentations. Get started on crafting your personalized infographic today!


4 diapositivas
Circular Data Flow in Systems Presentation
Visualize relationships and flow within your systems using the Circular Data Flow in Systems Presentation. Ideal for showcasing input-output dynamics, data loops, or stakeholder interaction, this diagram presents centralized nodes with surrounding connectors for clarity. Each element is editable and works seamlessly in PowerPoint, Google Slides, and Canva.


5 diapositivas
Breast Cancer Awareness Day
Raise awareness and educate with this visually impactful Breast Cancer Awareness Day template. Featuring circular infographic elements styled in a breast tissue-inspired layout, this slide design is ideal for campaigns, health education, corporate wellness events, and social initiatives. Each section can be customized with key data, statistics, or actionable messages. Fully editable in PowerPoint, Keynote, and Google Slides.


7 diapositivas
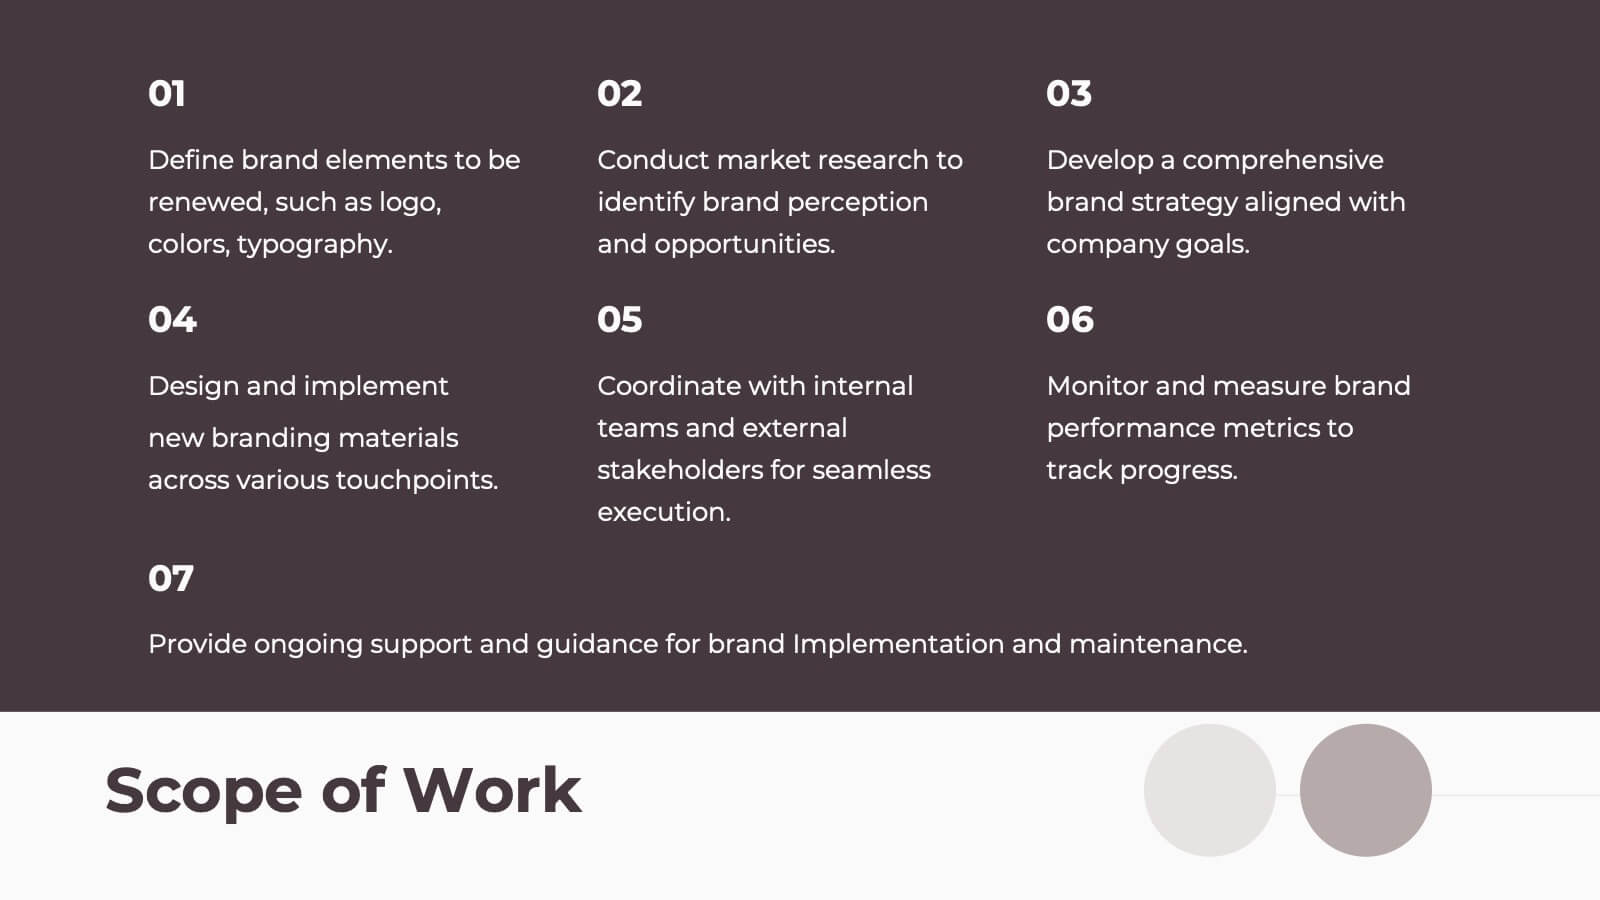
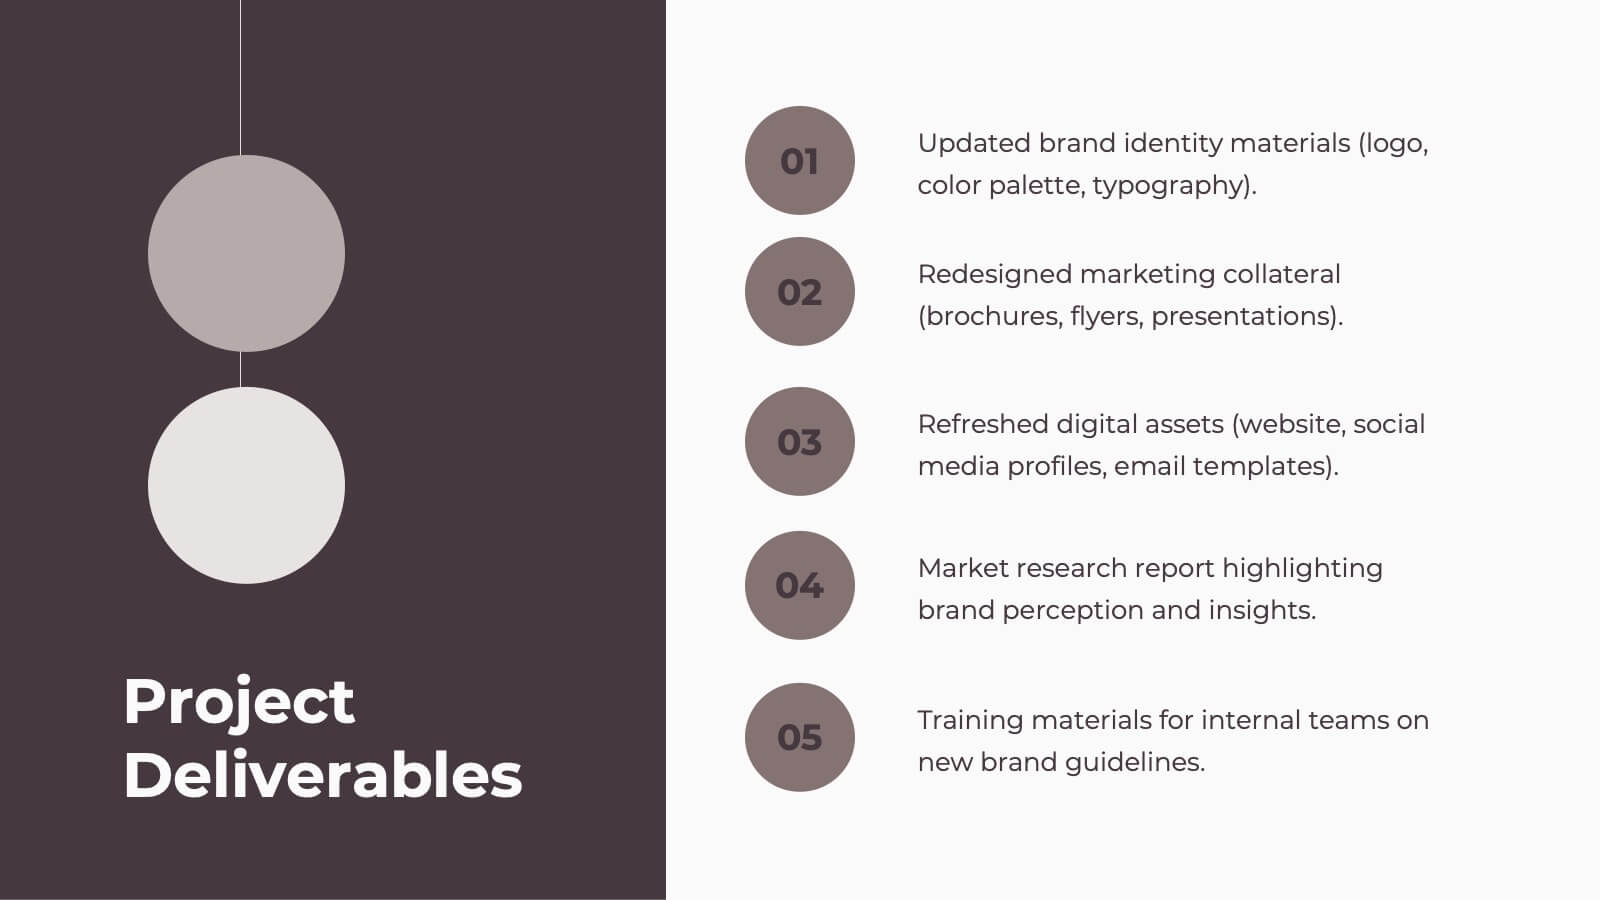
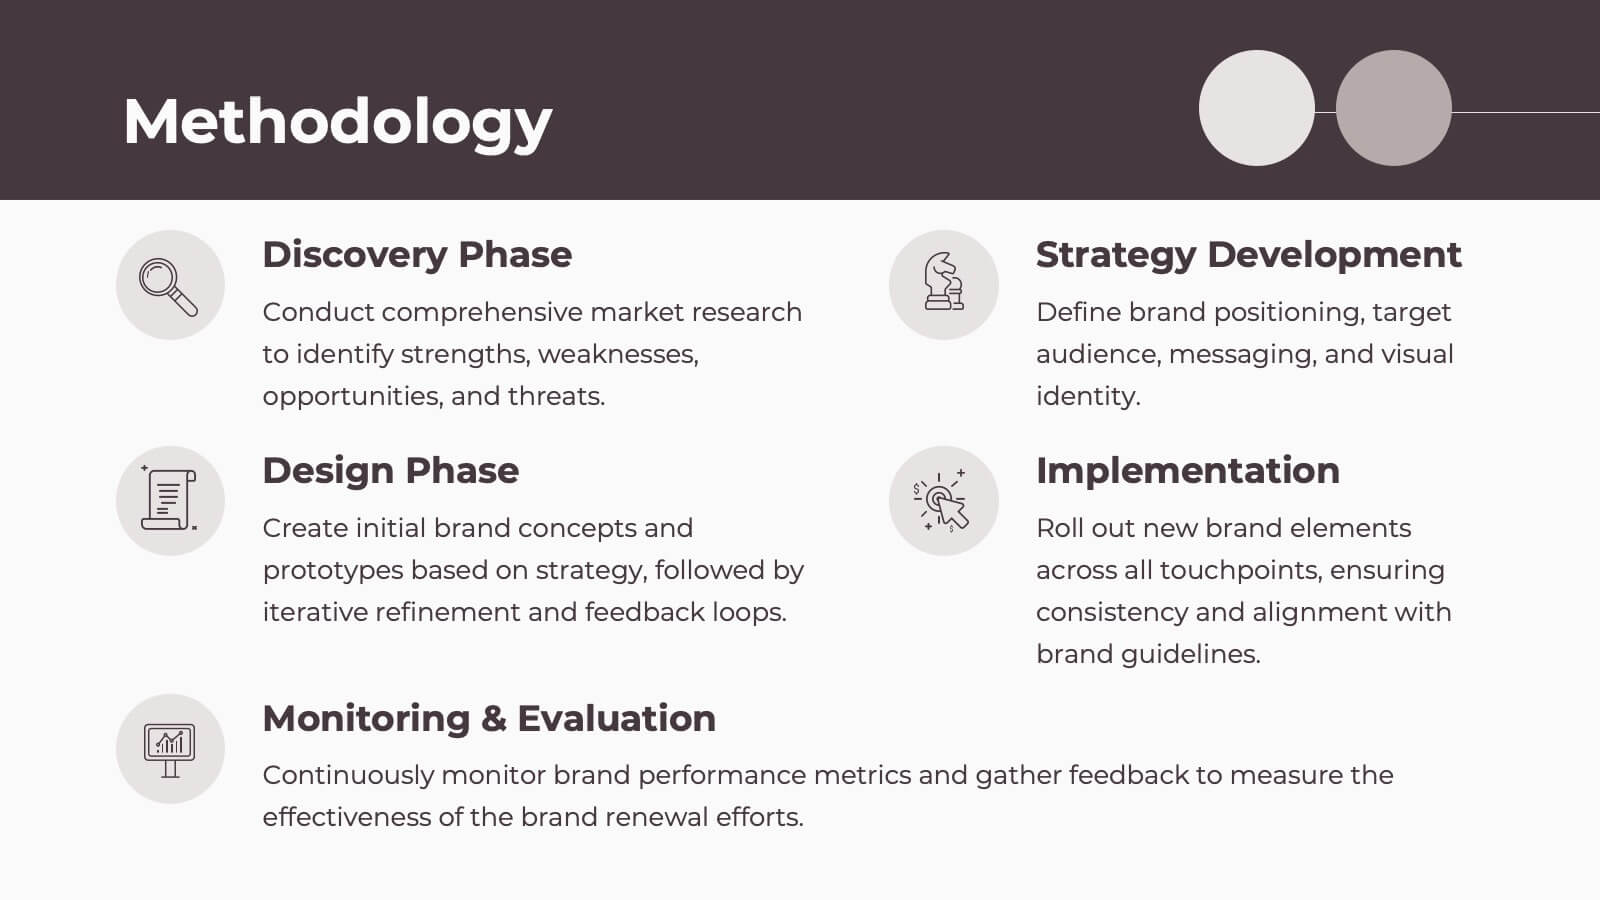
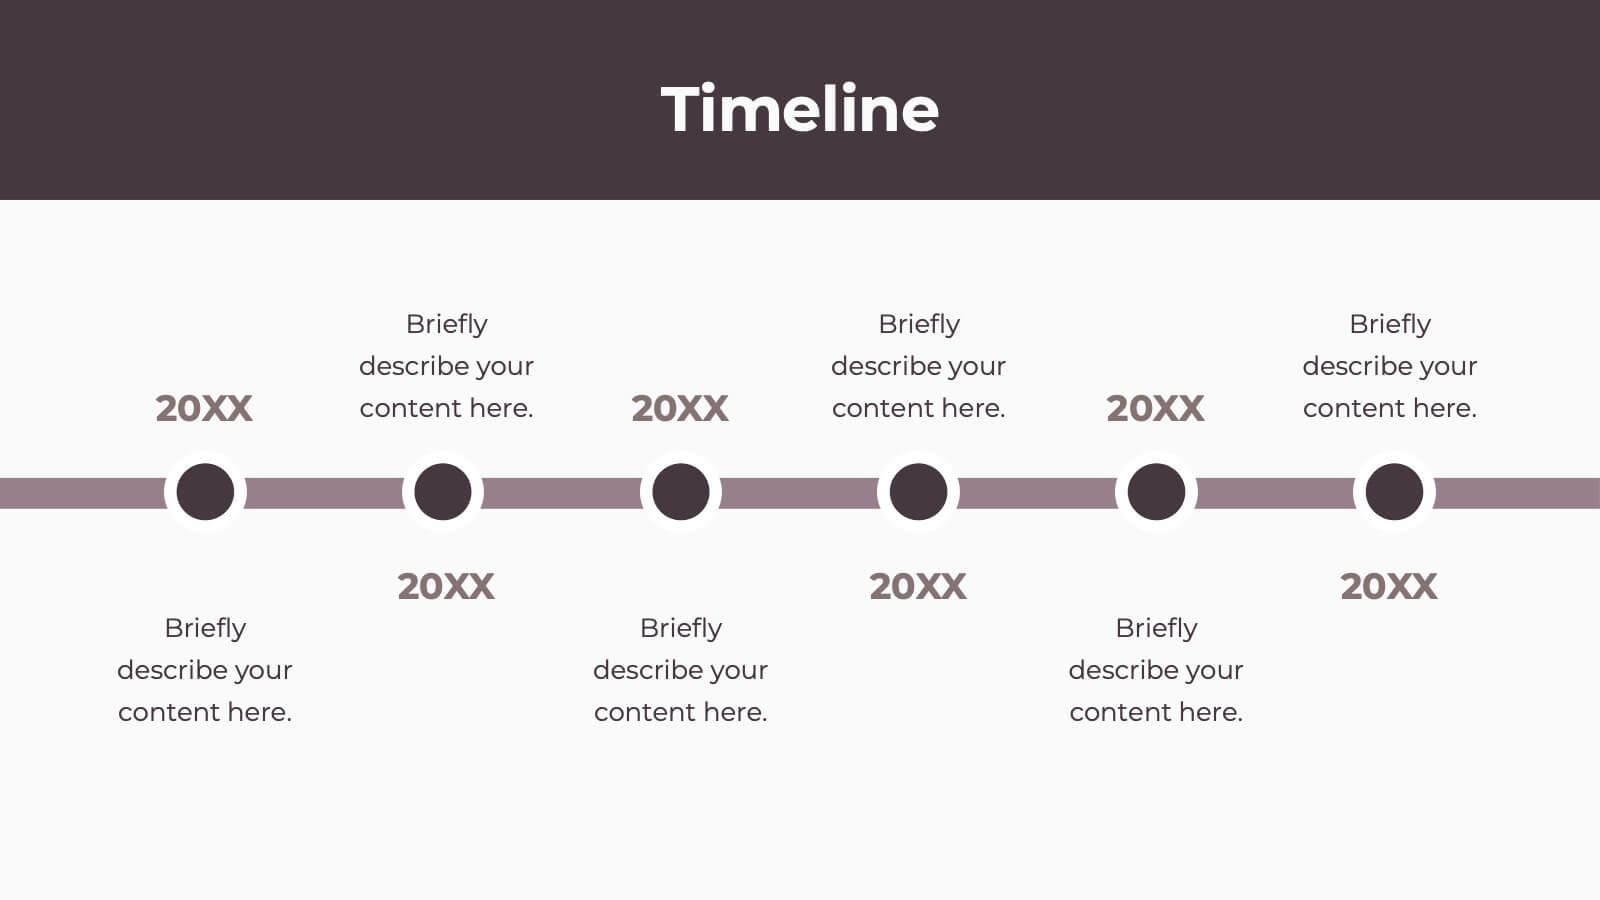
Business Strategy Options Presentation
Bring clarity to your strategic choices with a clean, modern layout that helps you present multiple business directions side by side. Ideal for showcasing growth plans, decision paths, or market approaches, this presentation makes strategy easy to follow. Fully compatible with PowerPoint, Keynote, and Google Slides for effortless editing.


4 diapositivas
Customer Persona Slide Presentation
Bring your audience closer to your ideal customer with this clean, visual layout designed for clarity and storytelling. Perfect for marketing, branding, and strategy presentations, it helps you highlight key traits, motivations, and insights with ease. Fully compatible with PowerPoint, Keynote, and Google Slides for effortless customization.


5 diapositivas
Environment Preservation Infographics
Environment preservation refers to the protection, conservation, and sustainable management of natural resources and ecosystems to maintain their integrity and ensure their long-term viability. These vertical infographics are designed to raise awareness about the current environmental challenges and inspire individuals and communities to take action to protect and conserve the environment. It can be used in presentations, workshops, educational campaigns, and sustainability initiatives to inspire individuals, organizations, and communities to take steps towards a more sustainable and resilient future. Compatible with Powerpoint, Keynote, and google Slides.


7 diapositivas
Security Framework Infographic
A security framework, also known as a cybersecurity framework, is a structured set of guidelines, best practices, standards, and processes that help organizations design, implement, monitor, and manage robust security measures to protect their information systems and resources. This infographic template is a fortress of knowledge, guiding you through the pillars of a robust security infrastructure that safeguards your digital realm. Compatible with Powerpoint, Keynote, and Google Sides. Every element in this infographic embodies a facet of a comprehensive security framework.


6 diapositivas
PESTEL Framework Business
Simplify your strategic analysis with this clean and colorful PESTEL presentation. Perfect for breaking down Political, Economic, Sociocultural, Technological, Environmental, and Legal factors. Each segment uses bold icons and color coding to guide your audience through external influences. Easily customizable in PowerPoint, Keynote, and Google Slides.


10 diapositivas
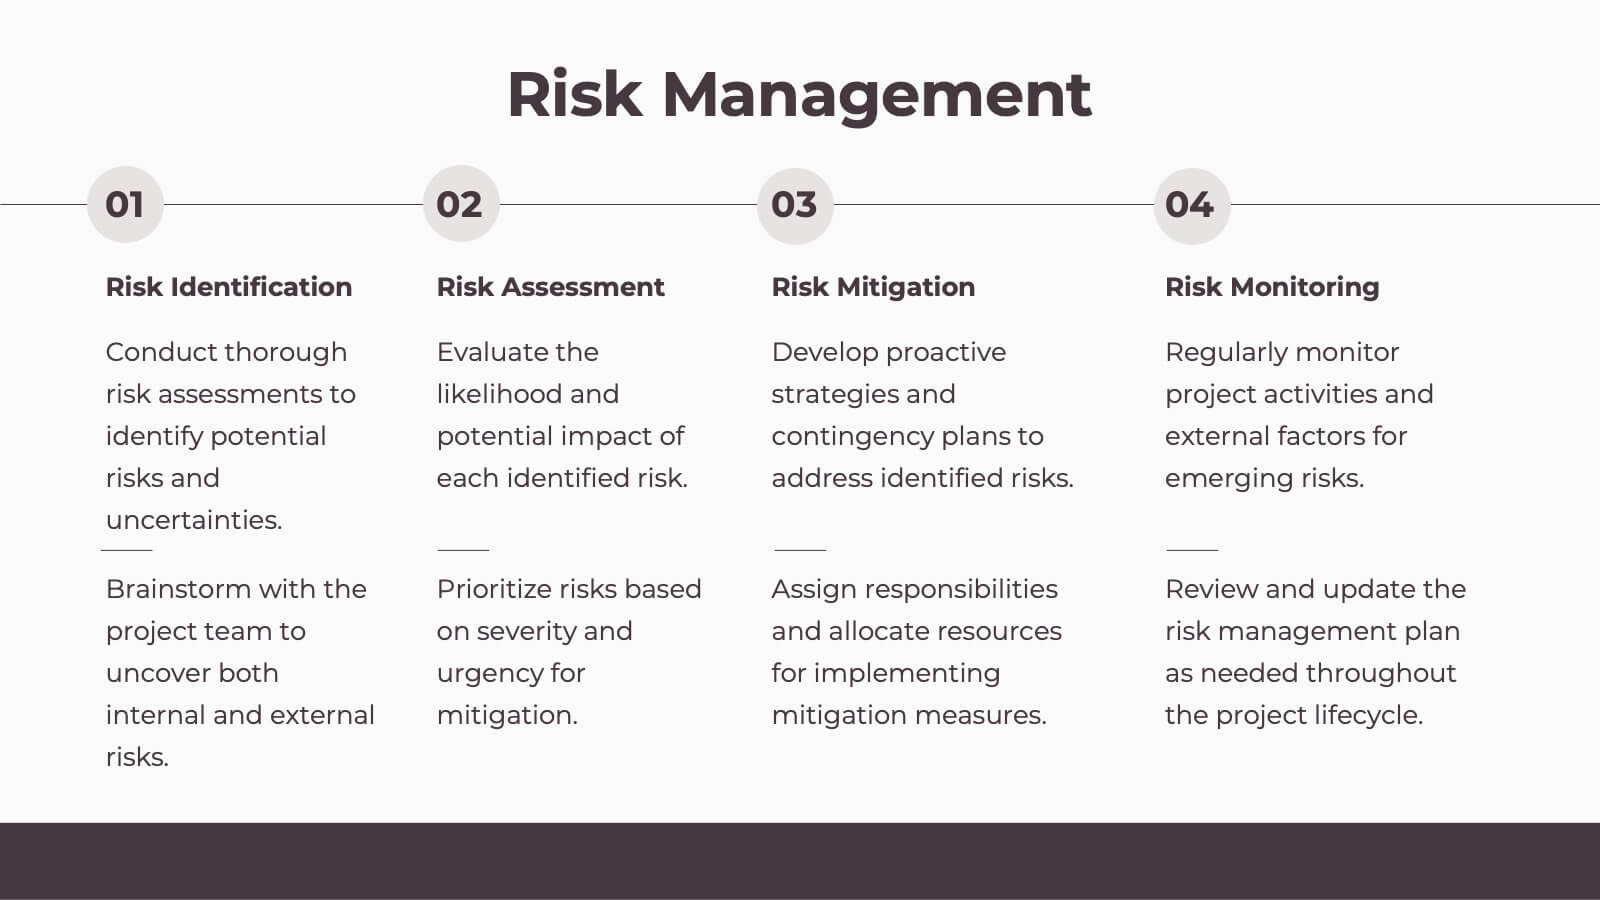
Corporate Risk Assessment Framework
Clearly outline your organization’s safety strategy with this structured hierarchy of controls slide. Featuring five progressive risk control methods—Elimination, Substitution, Engineering, Administrative, and PPE—this template is perfect for safety training, compliance briefings, and risk audits. Compatible with PowerPoint, Keynote, and Google Slides.


21 diapositivas
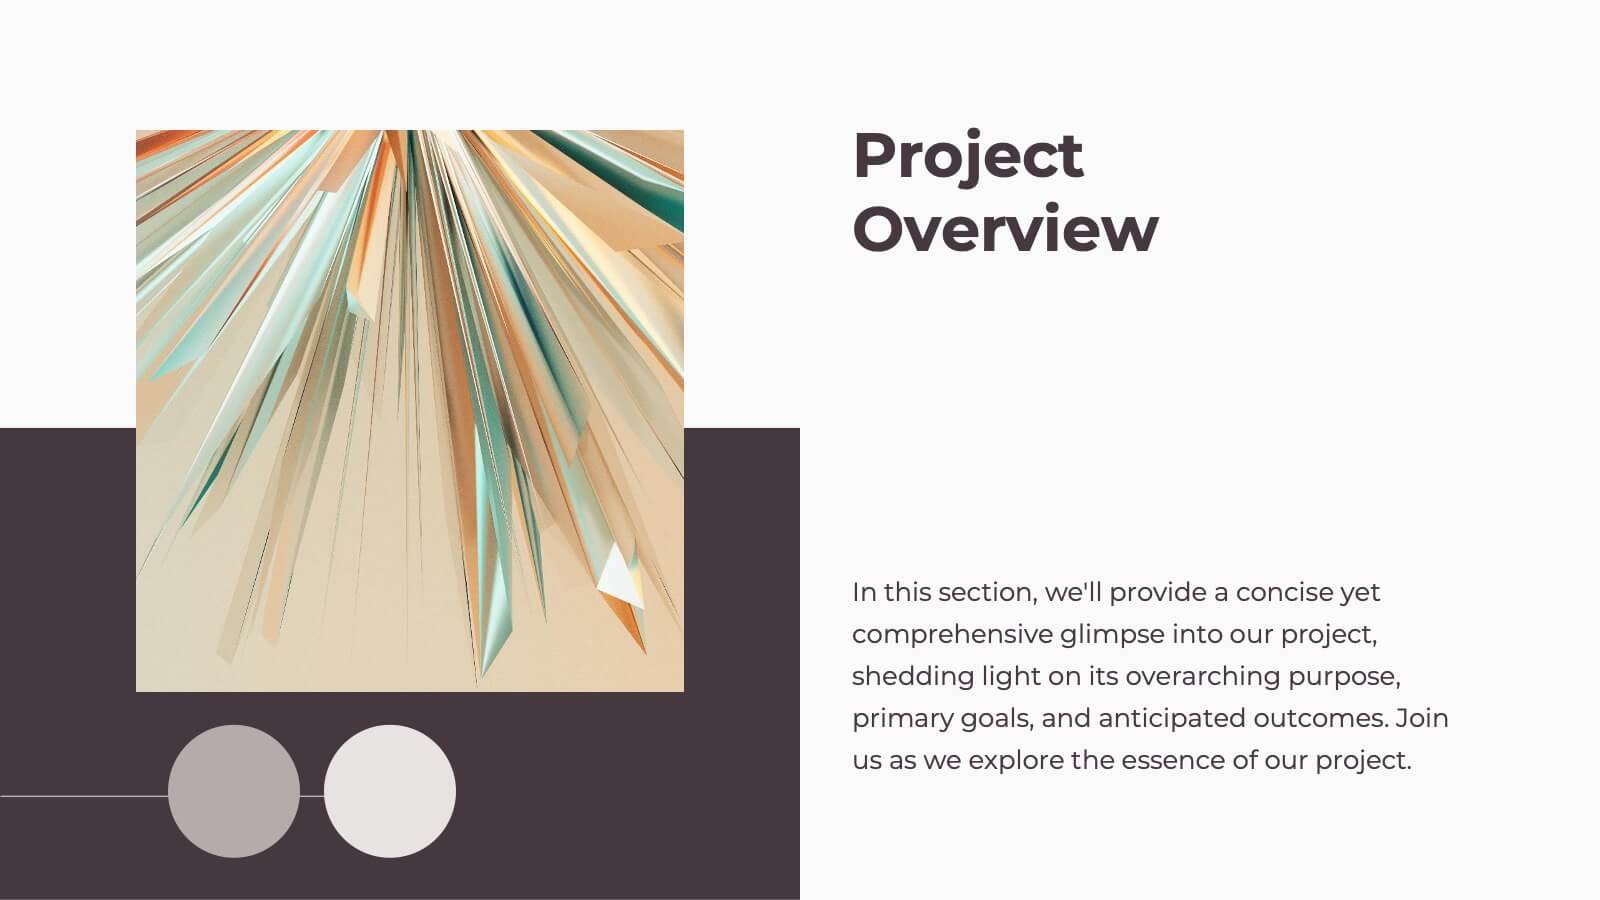
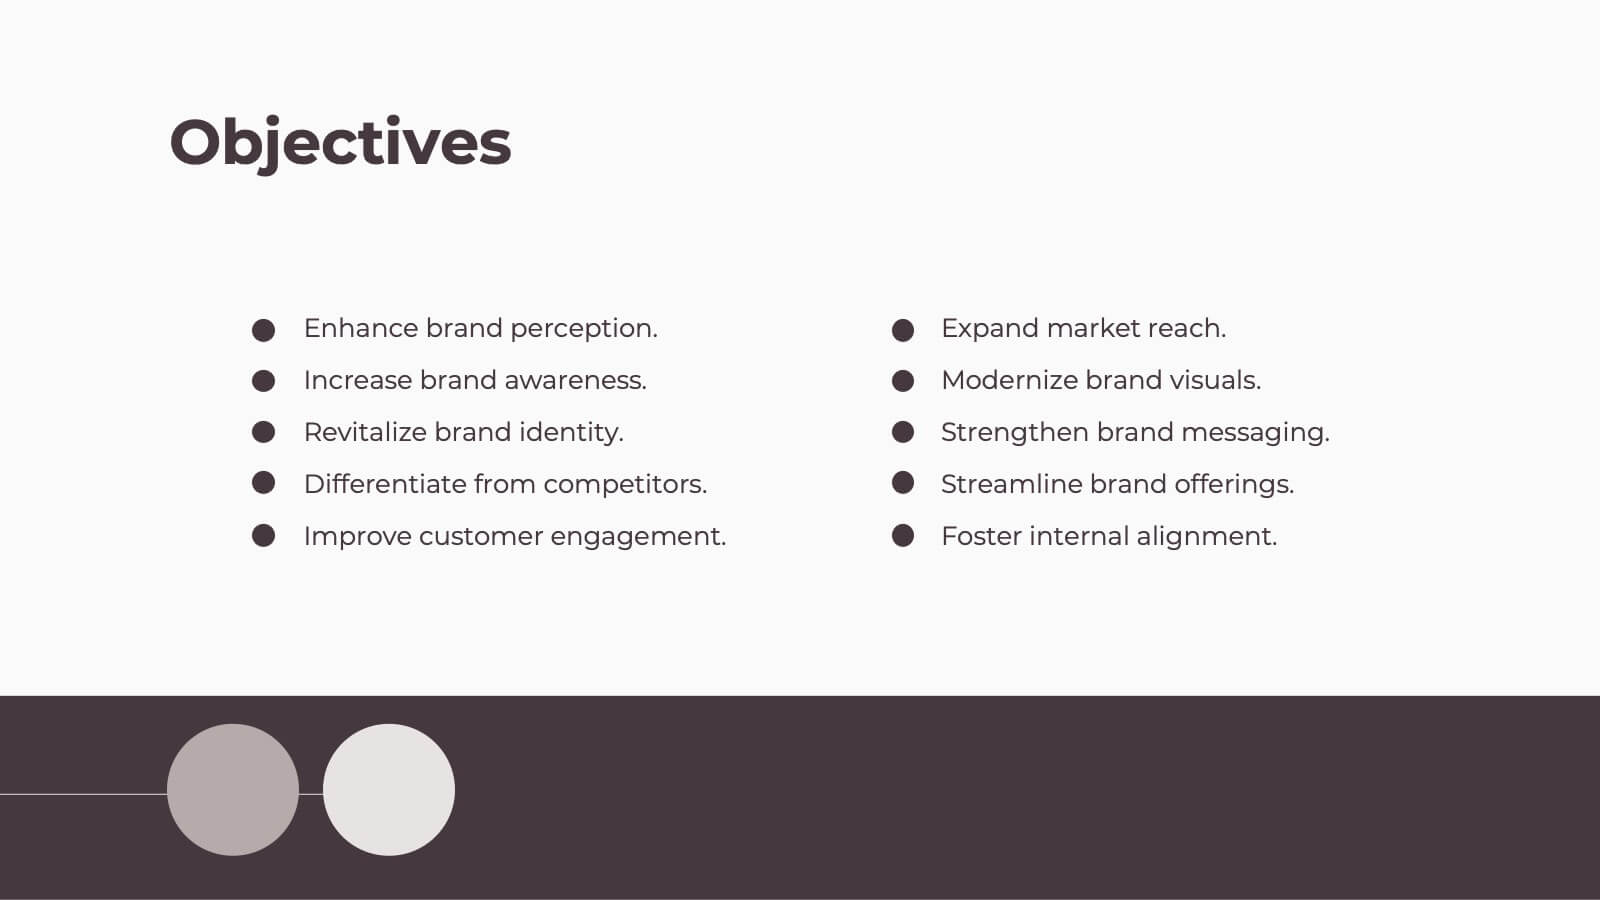
Spectrum Project Timeline Presentation
Plan and execute your projects with precision using this detailed project plan template! Perfect for outlining objectives, timelines, and resource allocation. Ideal for project managers and teams aiming to ensure successful project delivery. Compatible with PowerPoint, Keynote, and Google Slides, this template keeps your project organized, clear, and on track. Ensure project success!


8 diapositivas
Customer Feedback and Review
Highlight real user opinions with this Customer Feedback and Review presentation. Designed to showcase testimonials, star ratings, and satisfaction percentages, each slide offers a clean, card-style layout perfect for product reviews, client testimonials, or user surveys. Fully customizable in PowerPoint, Keynote, and Google Slides.


6 diapositivas
Business Triangle Model Presentation
Visualize the core components of business success with the Business Triangle Model template. This structured framework highlights three interconnected elements, making it ideal for strategic planning, risk assessment, and performance analysis. Customize it effortlessly to suit your needs. Compatible with PowerPoint, Keynote, and Google Slides for seamless integration.


4 diapositivas
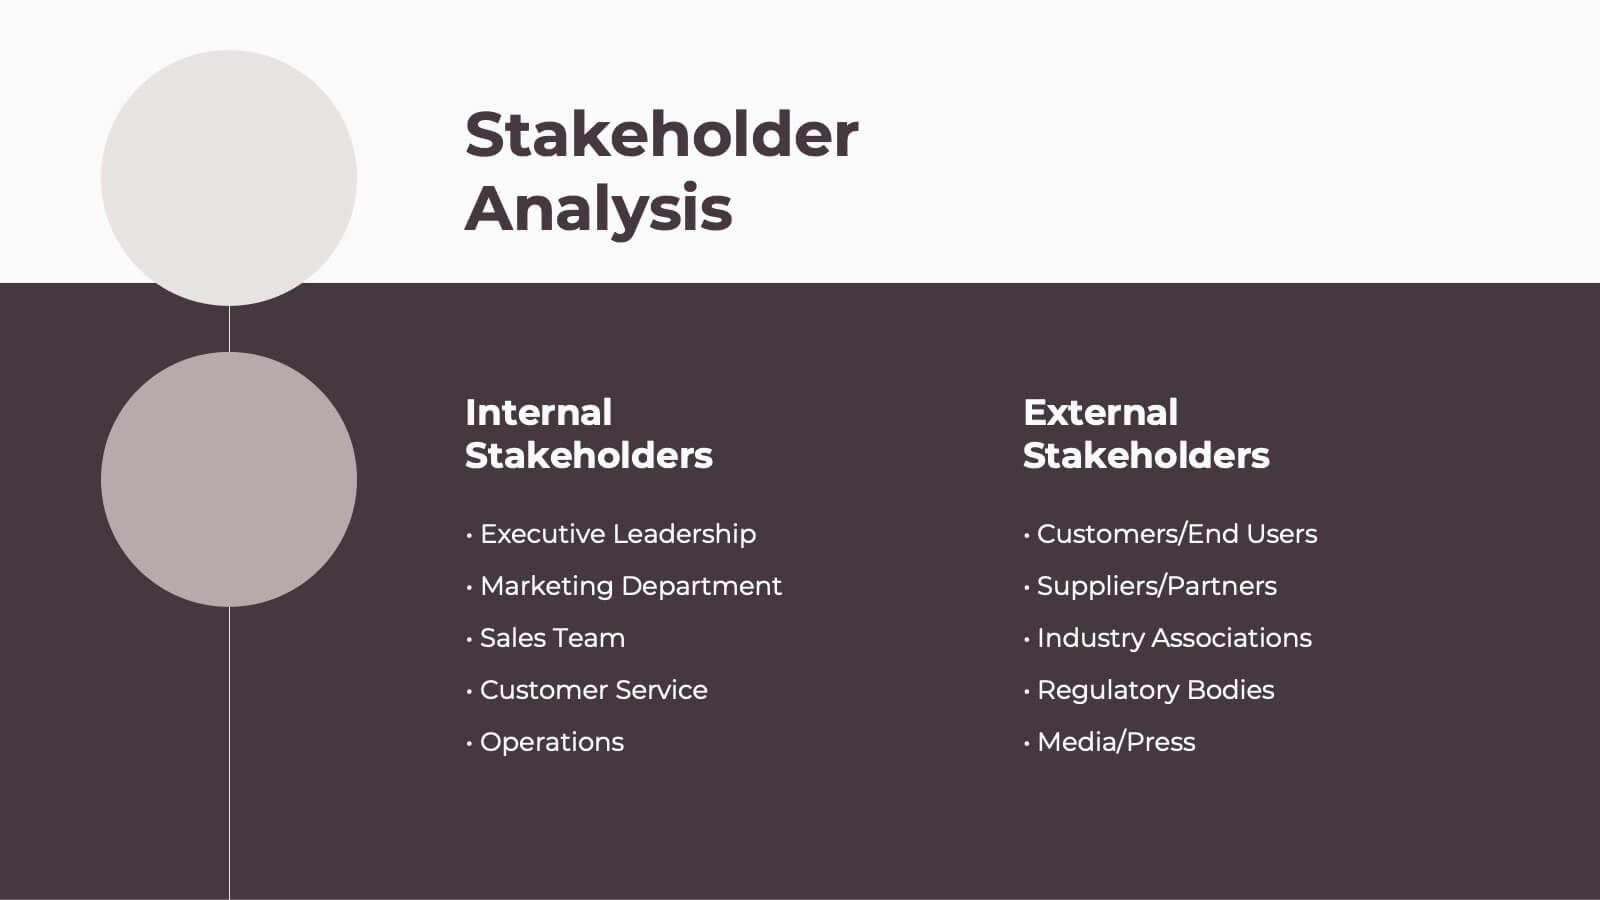
Stakeholder Analysis Matrix Example Presentation
Make every relationship in your project strategy crystal clear with this smart and colorful matrix design. Perfect for mapping influence, interest, and engagement levels, it helps teams identify priorities and manage communication effectively. Fully editable and compatible with PowerPoint, Keynote, and Google Slides for seamless customization.


19 diapositivas
Prism Design Strategy Proposal Presentation
Bring your design strategy to life with this modern and stylish presentation template! Perfect for showcasing your design concepts, processes, and elements, this template ensures that your ideas are communicated effectively. With a sleek layout for design briefs, mood boards, prototypes, and project timelines, it's the ideal tool for creative professionals. Customize it easily in PowerPoint, Keynote, or Google Slides to make a lasting impression on your audience.


4 diapositivas
Mobile and Laptop Mockup Devices
Present your digital products with style using this modern mockup slide. Featuring a realistic laptop and smartphone duo, this layout is perfect for showcasing websites, apps, or UI designs. Fully editable in PowerPoint, Keynote, and Google Slides—customize text, colors, and layout with ease.


5 diapositivas
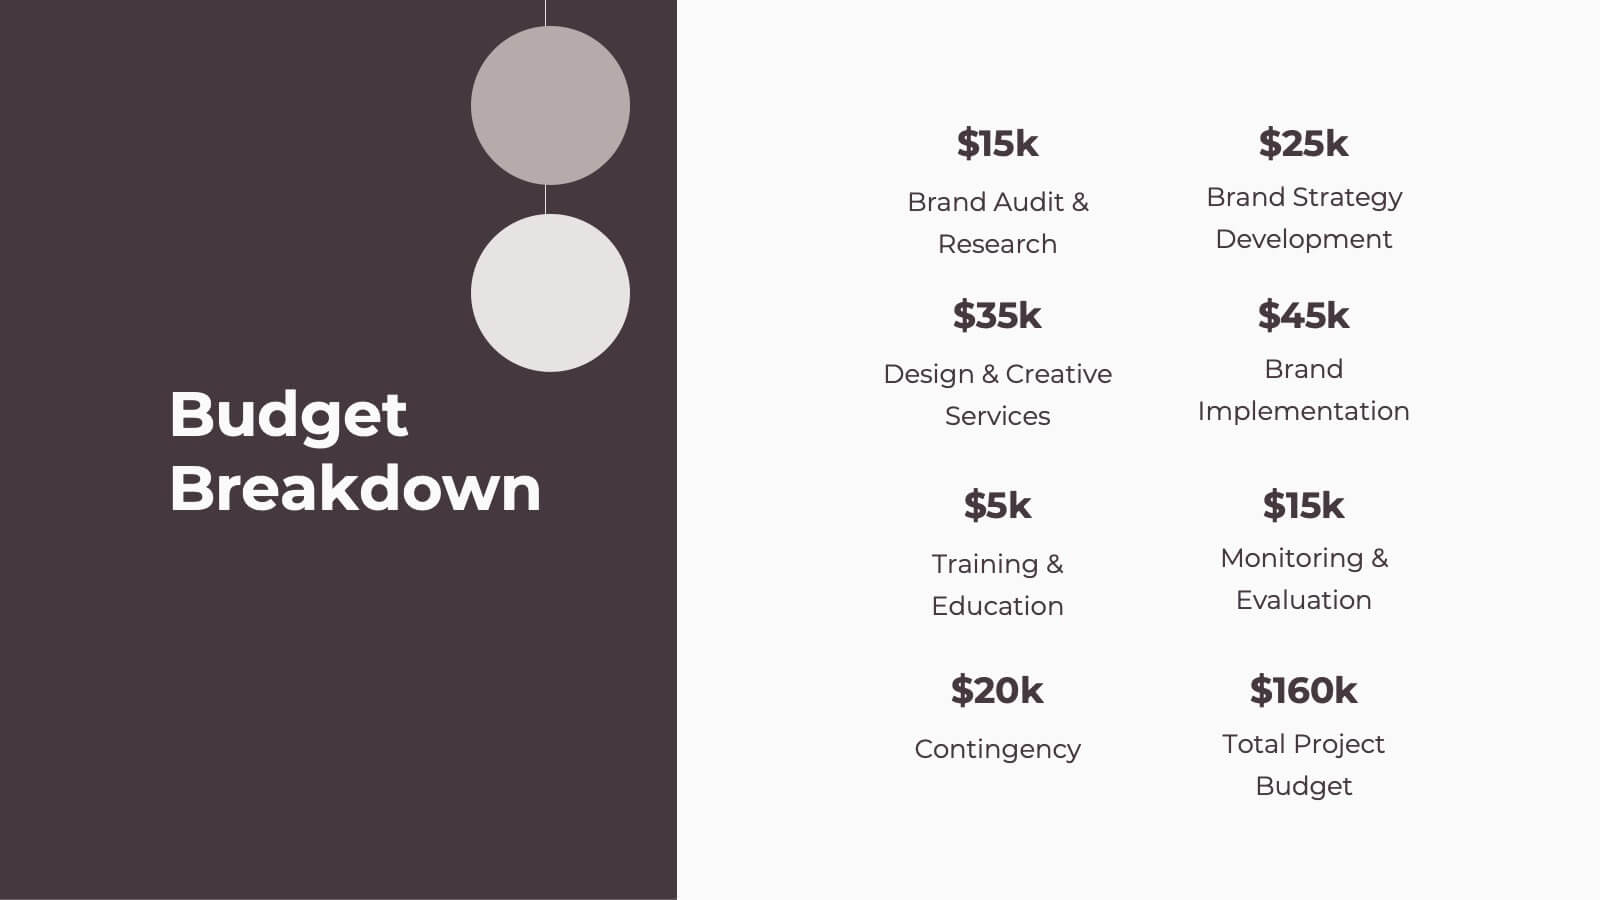
Strategic Budget Planning Forecasting
Tired of messy spreadsheets? This clean and creative template makes budget forecasting easier to visualize and share. Centered around a playful piggy bank illustration, it lets you outline strategic goals, savings plans, and key metrics in a format that’s easy to follow. Fully compatible with PowerPoint, Keynote, and Google Slides.


5 diapositivas
Business Report Summary Slide Presentation
Deliver key metrics and insights with confidence using this Business Report Summary Slide. Featuring segmented graphs, percentage indicators, and a 6-part breakdown, this layout helps you highlight performance trends and action items clearly. Ideal for reporting, monthly reviews, or executive briefings. Fully editable in PowerPoint, Keynote, and Google Slides.