


Características


¿Tienes alguna pregunta?
Recomendar


6 diapositivas
Financial Trading and Stock Performance Presentation
Explore market dynamics with the "Financial Trading and Stock Performance" presentation template. Perfect for finance professionals, these slides offer a visual analysis of stock trends over the years. Featuring bar graphs and gauge charts for annual comparison, it's designed for impactful presentations. These templates are compatible with PowerPoint, Keynote, and Google Slides, enhancing their accessibility across different platforms.


5 diapositivas
Veterinary Diagnostics and Treatment Presentation
Clearly outline your care process with the Veterinary Diagnostics and Treatment presentation. This slide features a visually appealing medical bag segmented into four quadrants, each marked by colorful paw prints and editable titles. Ideal for showcasing diagnosis steps, treatment plans, or service categories for veterinary clinics. Fully customizable and easy to adapt for use in PowerPoint, Keynote, and Google Slides. Perfect for pet care professionals seeking a professional, pet-friendly visual.


26 diapositivas
Spellis Rebranding Project Plan Presentation
Revamp your brand’s identity with this sleek and strategic presentation template. Covering key aspects such as brand values, audience personas, strategy, positioning, and future development, this template ensures a comprehensive rebranding approach. Fully customizable and compatible with PowerPoint, Keynote, and Google Slides for seamless use.


5 diapositivas
Suicide Prevention & Awareness Infographics
Suicide Awareness plays a vital role in addressing the global public health issue of suicide. These vertical infographics are powerful and informative designs that aim to raise awareness about suicide prevention, promote mental health, and provide essential information to help individuals recognize the signs and support those in need. With its thoughtful and sensitive design, the template communicates important statistics, facts, and resources. The template is fully customizable, allowing you to personalize the infographics with your own content, including local helpline numbers, support services, or specific awareness campaigns.


7 diapositivas
Schedule Infographics Presentation Template
Featuring our Schedule Infographic template, this is a great tool for business owners, students and others who need to create an impactful presentation. Using this template will ensure that your main point is emphasized and can be easily understood by all of your viewers. This template includes different colors and fonts that can be easily edited and changed. This will help you visualize your existing data and create a presentation that includes all of your points. Use this template to make a professional and smart looking schedule, and present your plan to others in an easy to understand way.


6 diapositivas
Geographic Asia Overview Template Presentation
Discover insights across Asia with a clean, professional layout that brings your regional data to life. Perfect for showcasing demographics, market distribution, or geographic highlights, this visual map design ensures clarity and impact in every slide. Fully compatible with PowerPoint, Keynote, and Google Slides for effortless editing and presentation.


4 diapositivas
Root Cause Problem Solving Presentation
Uncover insights with a clear, visual approach that makes complex issues easy to understand and communicate. This presentation guides audiences through identifying underlying problems, mapping causes, and highlighting solutions in a structured, memorable way. Clean icons and tree-based visuals keep your message engaging. Fully compatible with PowerPoint, Keynote, and Google Slides.


7 diapositivas
Process Table Infographic
Unveil the intricacies of any process with our process table slide infographic. Situated on a clean white base, the design flourishes with a spectrum of green for growth, purple for innovation, blue for consistency, and orange. With its detailed infographics, symbolizing icons, and flexible image placeholders, this template offers a structured representation of step-by-step processes, from initiation to completion. Perfectly calibrated for Powerpoint, Keynote, or Google Slides. An indispensable tool for business analysts, operations managers, educators, or anyone looking to streamline and visualize processes.


4 diapositivas
Green Initiatives & Climate Strategy Presentation
Highlight your sustainability roadmap with the Green Initiatives & Climate Strategy Presentation. Designed with a quadrant tree layout, this slide communicates four key environmental focus areas. Ideal for eco-friendly proposals, CSR updates, or climate reports. Fully customizable in PowerPoint, Keynote, and Google Slides—perfect for green strategies, goals, or impact summaries.


6 diapositivas
International Law Infographics
Our International Law infographic is a versatile and informative tool for professionals and educators to incorporate into presentations on Powerpoint, Keynote, and Google Slides. It's specially crafted to elucidate the complexities of international law, making it an indispensable aid for lawyers, law students, and legal analysts. The infographic is thoughtfully designed to summarize the principles, mechanisms, and impact of international law on global relations. It provides a visual breakdown of treaties, jurisdiction, and the functions of international legal bodies. The layout is intended to guide the audience through the intricacies of international legal processes in a straightforward and comprehensible manner. Utilizing this infographic will enhance your ability to communicate the nuances of international legal frameworks effectively. It's particularly useful for lectures, seminars, or presentations that require a concise yet thorough explanation of international legal concepts. By presenting this graphic, you can foster a better understanding of how legal norms are applied across borders, promoting a more informed discussion on the subject.


23 diapositivas
Quest Corporate Strategy Proposal Presentation
Unlock success with this powerful corporate strategy template! Detail strategic objectives, market trends, and growth opportunities. Ideal for business leaders aiming to drive growth. Compatible with PowerPoint, Keynote, and Google Slides, this template ensures your strategy is clear, professional, and compelling. Make your vision a reality with impactful presentations.


26 diapositivas
Efficient Time Management Presentation
Optimize your time management skills with a presentation designed to streamline your productivity. The template offers a professional and calming color palette, encouraging focus and clarity. It's structured to address the key principles of time management, from prioritizing tasks to strategic planning. Within the slides, you’ll find tools to introduce time management concepts, team profiles to assign roles efficiently, and charts to monitor progress. Engaging graphics and infographics are used to outline processes and time allocation, making it easier to visualize effective time management strategies. This template is a perfect match for workshops, personal organization sessions, or corporate training programs, compatible with popular platforms like PowerPoint, Keynote, and Google Slides. It’s designed to aid professionals and teams in harnessing their time effectively, ensuring every second counts towards achieving their goals.


10 diapositivas
Healthcare Innovations in Medicine Presentation
Showcase groundbreaking advancements with the Healthcare Innovations in Medicine Presentation template. Designed to highlight medical breakthroughs, research developments, and technological advancements, this visually appealing layout is ideal for healthcare professionals, researchers, and medical institutions. Fully customizable and compatible with PowerPoint, Keynote, and Google Slides, this template ensures your presentation is clear, engaging, and impactful.


6 diapositivas
RAPID Responsibility Matrix Infographics
Efficiently manage responsibilities and tasks with our RAPID Responsibility Matrix infographic template. This template is fully compatible with popular presentation software such as PowerPoint, Keynote, and Google Slides, allowing you to easily customize it to meet your specific project needs. The RAPID Responsibility Matrix infographic template offers a structured framework for defining roles and responsibilities within your team or organization. Whether you're a project manager, team leader, or simply looking to streamline workflows, this template provides a user-friendly platform to create clear and concise matrices for your projects. Optimize your project management processes with this SEO-optimized RAPID Responsibility Matrix infographic template, thoughtfully designed for clarity and ease of use. Customize it to assign and communicate responsibilities effectively, ensuring smooth collaboration and project success. Start crafting your personalized infographic today!


26 diapositivas
Dayne Presentation Template
This beautiful and professional Wedding Cake Template Dayne is the perfect template to boost your business with impressive wedding cake portfolio. Dayne is a great template for showing off bakers, who are sharing about wedding cakes. It also can be used for other themes, as well as personal or business. The color scheme works well with this theme. Pictures and charts are also made for easy editing as well as easy readability. The design is clean and professional looking, so clients feel comfortable and excited about their upcoming events or products. Look no further this is the one for you!


7 diapositivas
Timeline Logistics Infographic
A timeline infographic is a visual representation of the history of your company, product or service. This infographic template is the perfect way to show off your knowledge of a subject while also making it easy for your audience to digest all the information you've presented on hand. This infographic can be used to show the growth of your business. It’s also a great way to show the growth of your career. This template is simple and easy to use, but it’s also very powerful. You can add any icons you want and customize any text on the infographic. Compatible with Powerpoint, Keynote, and Google Slides. This is perfect for any occasion!


22 diapositivas
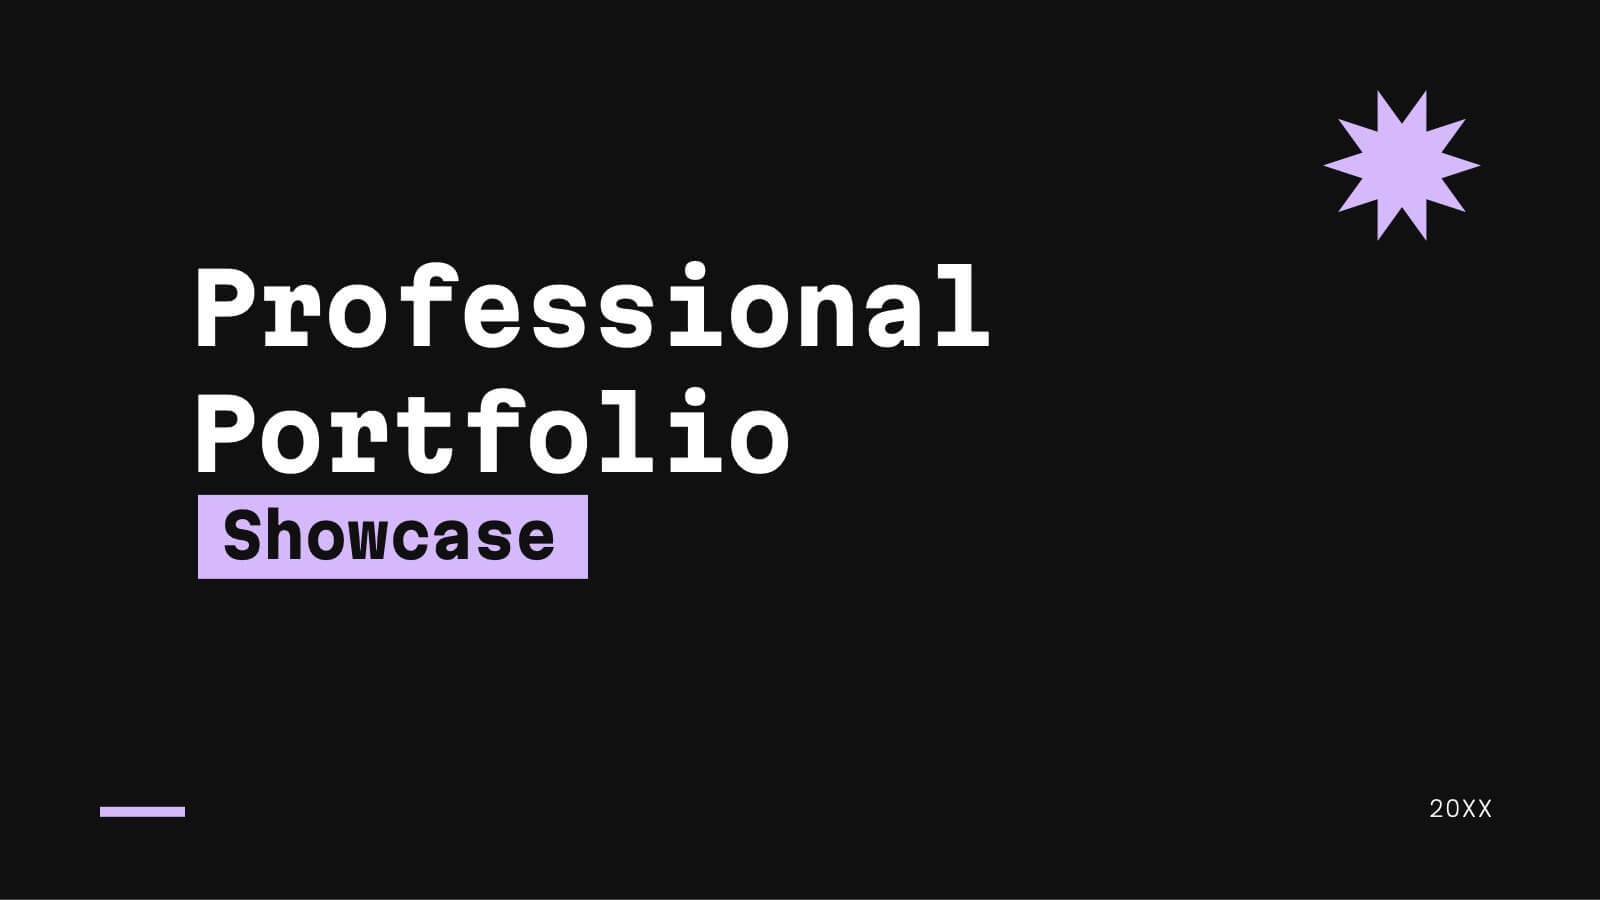
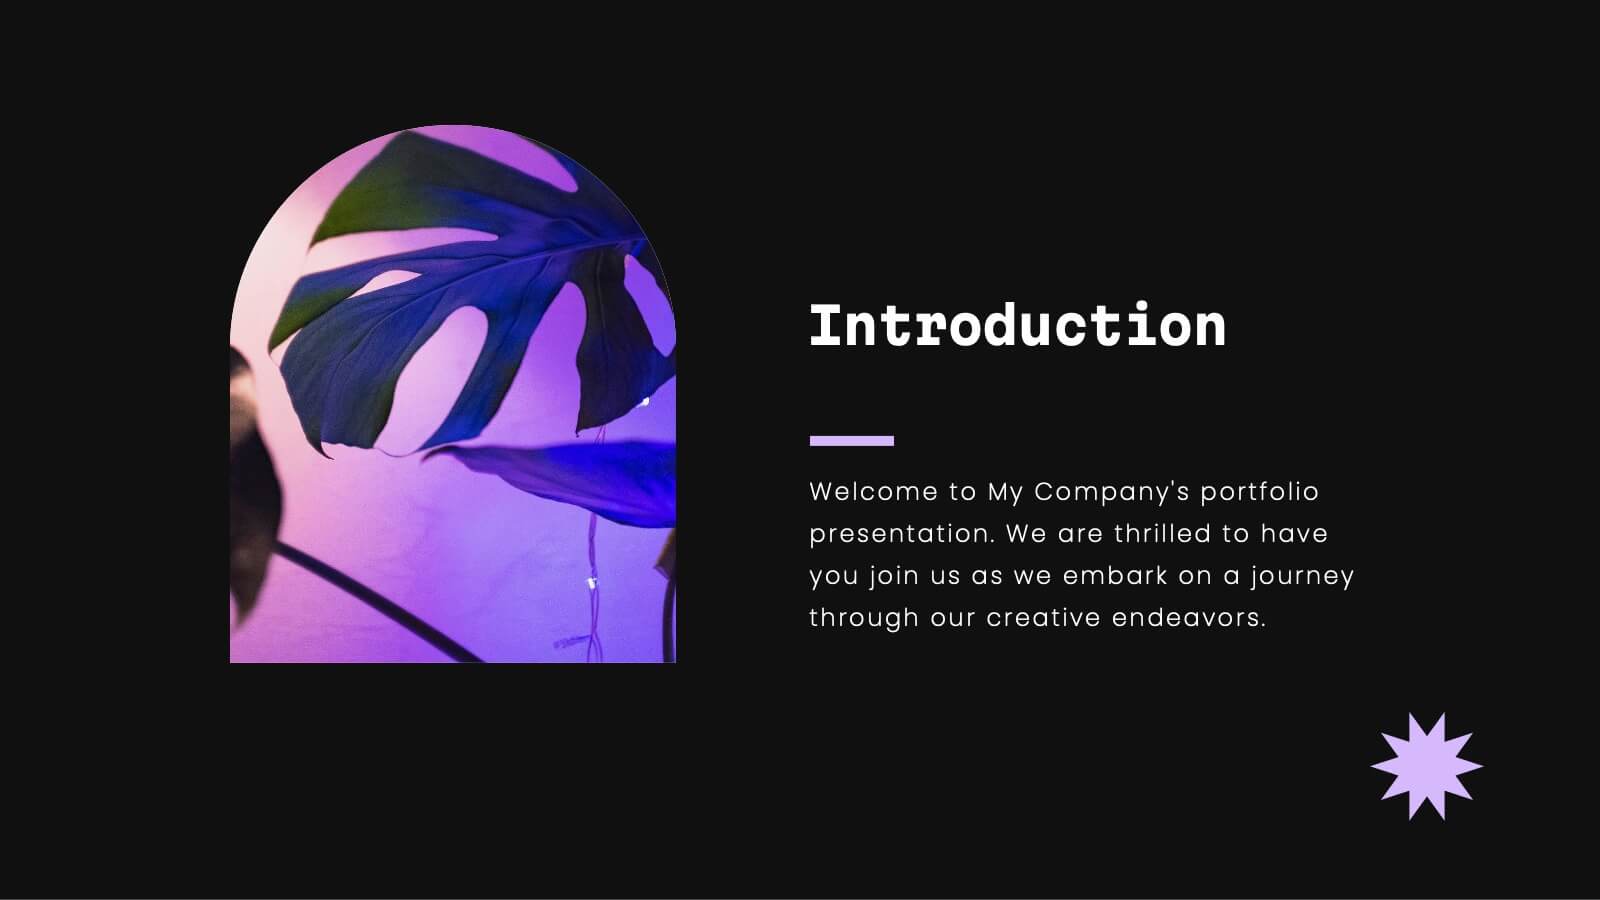
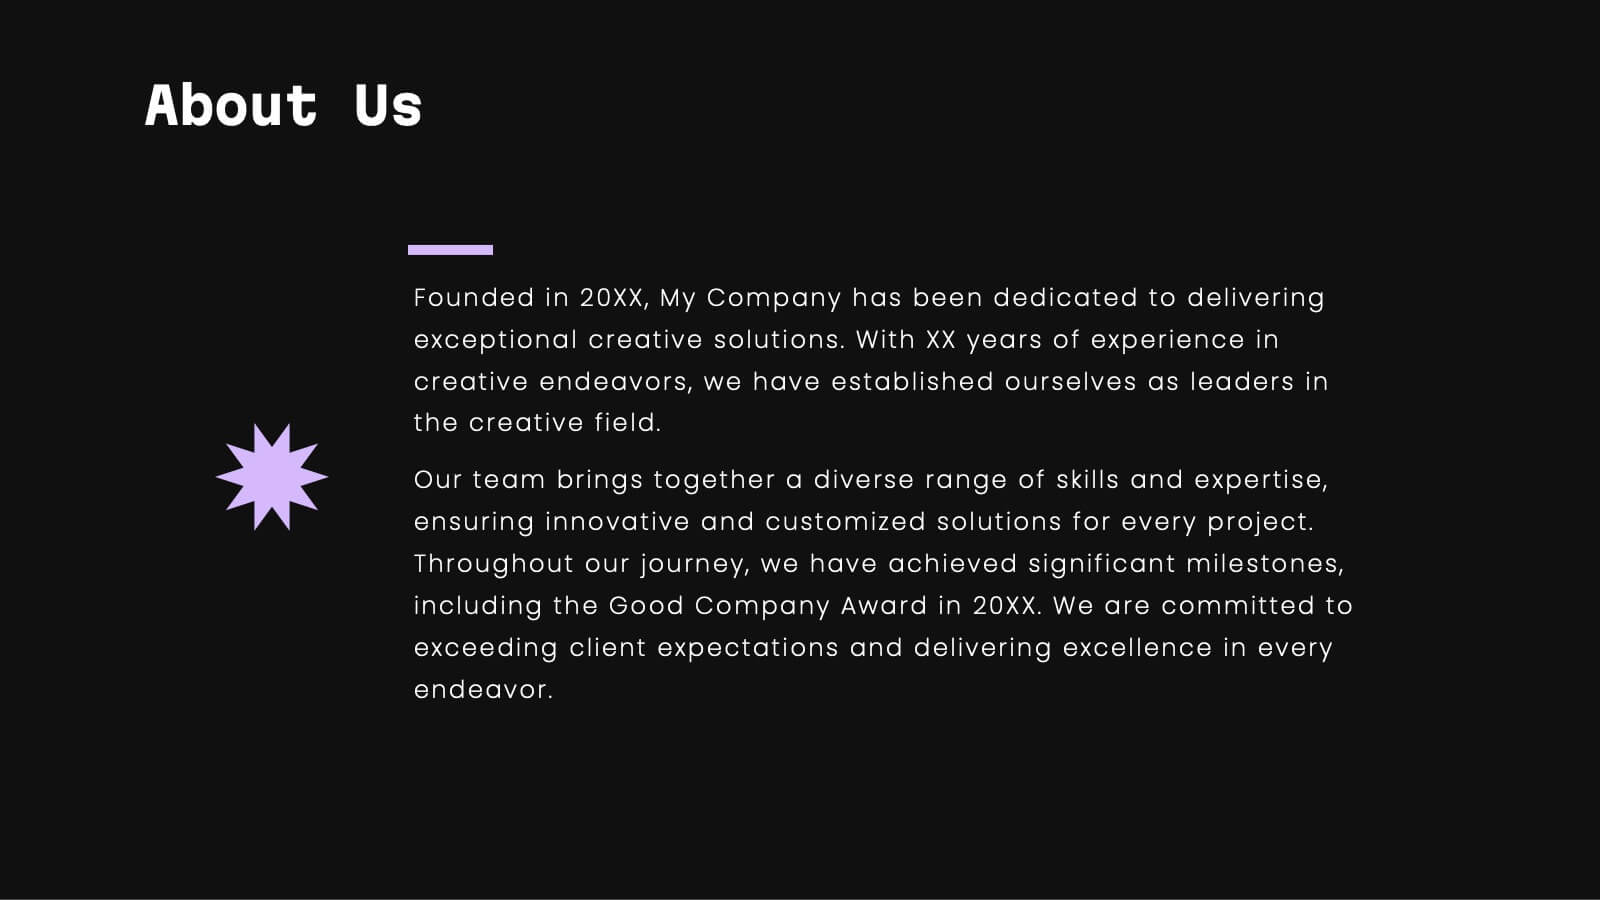
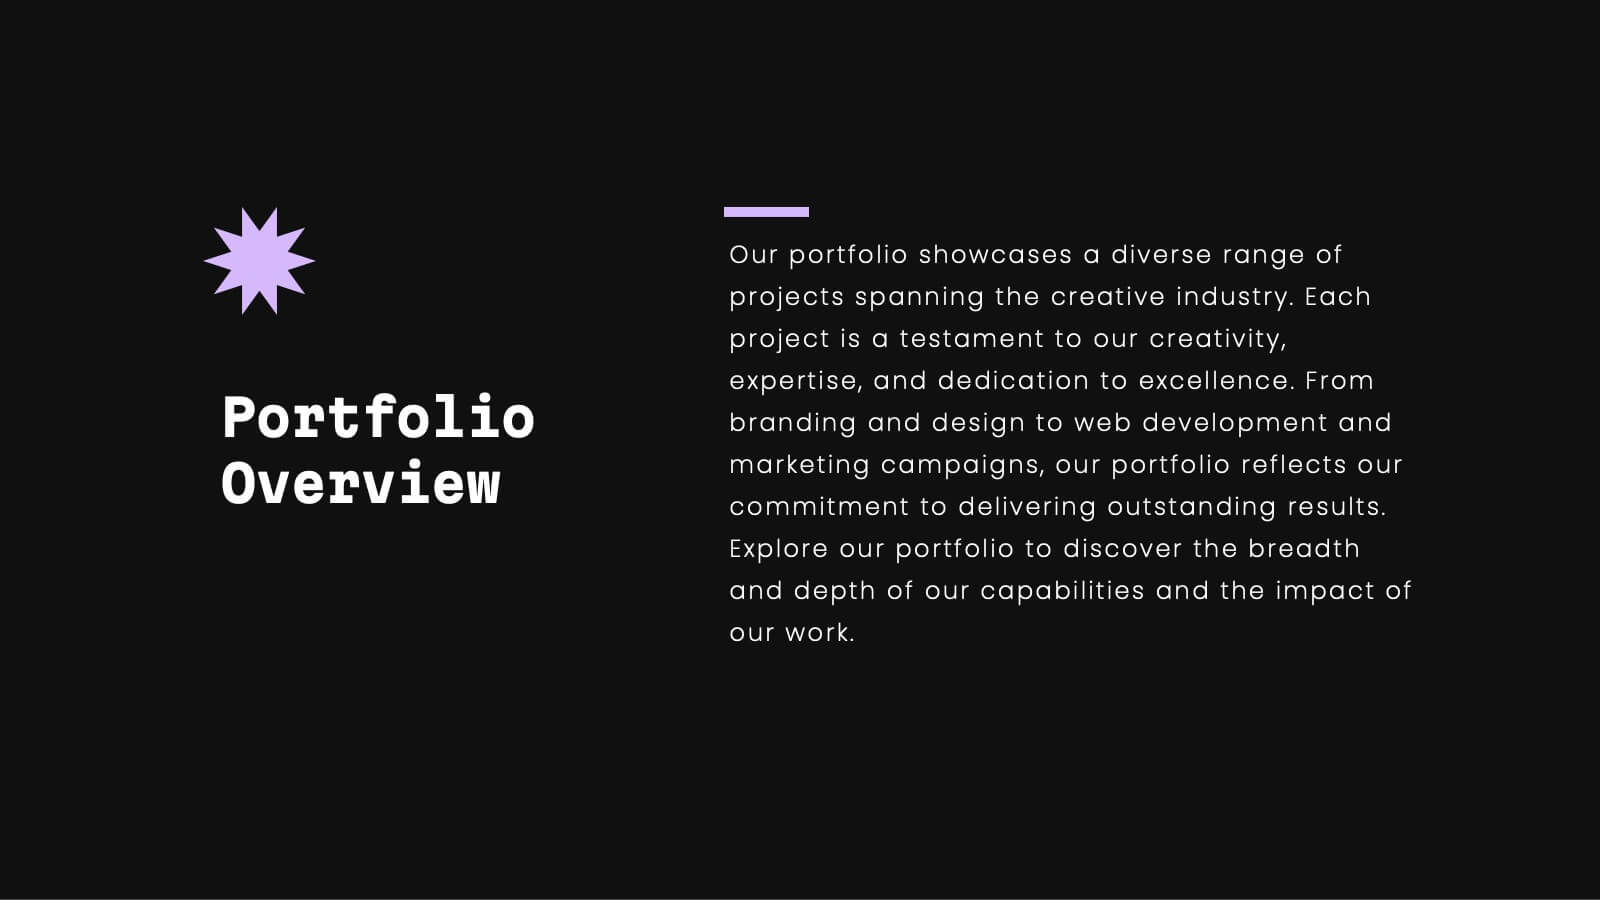
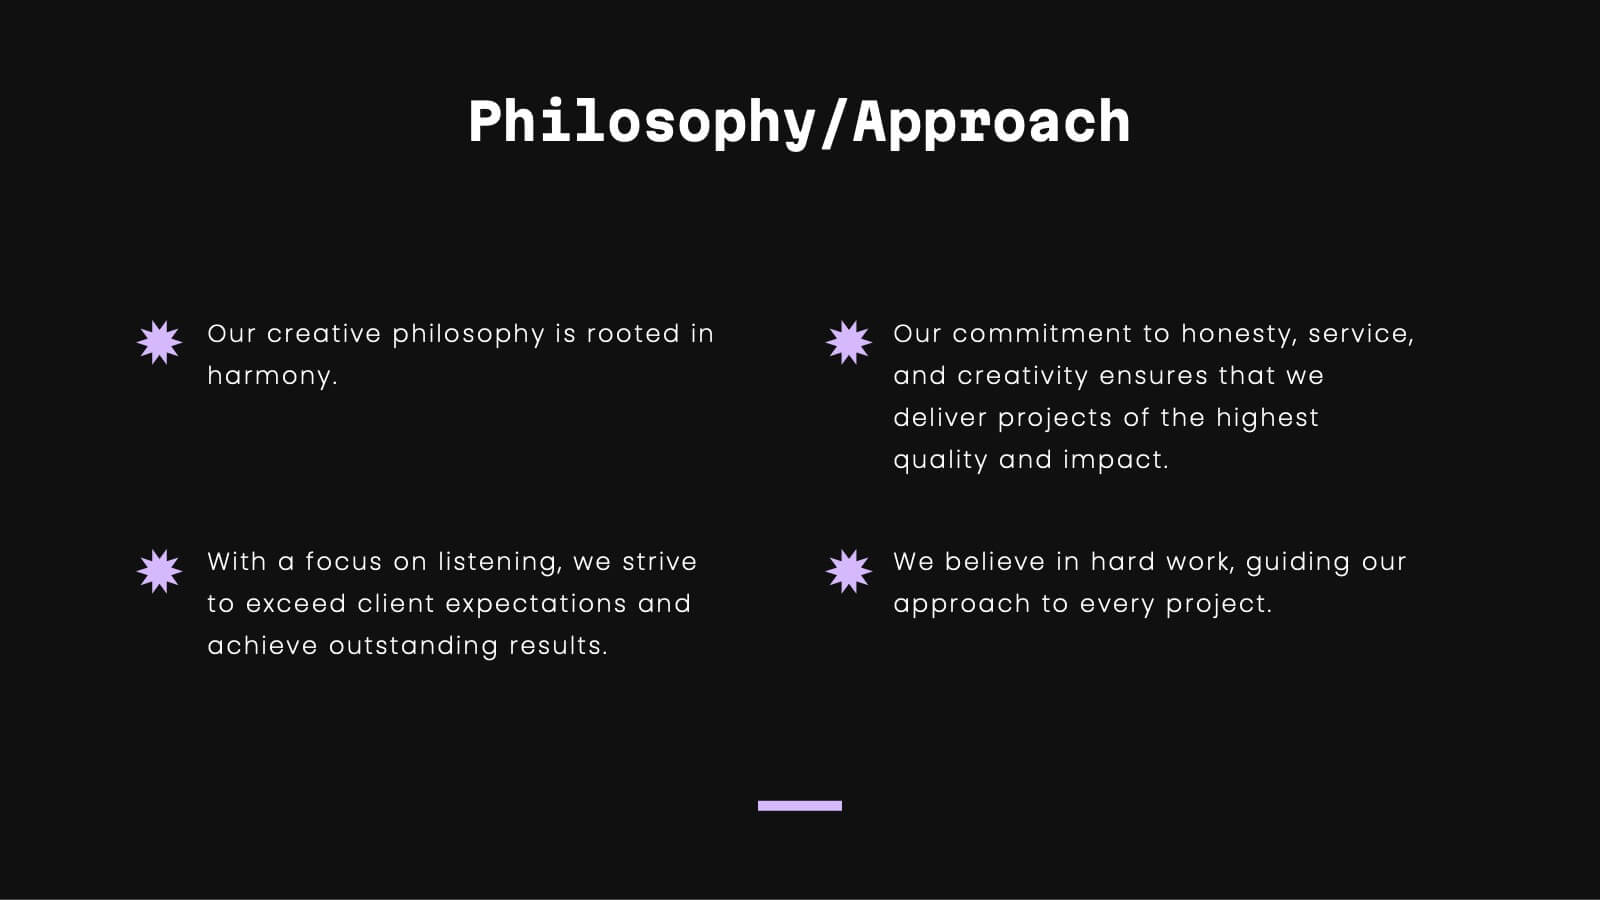
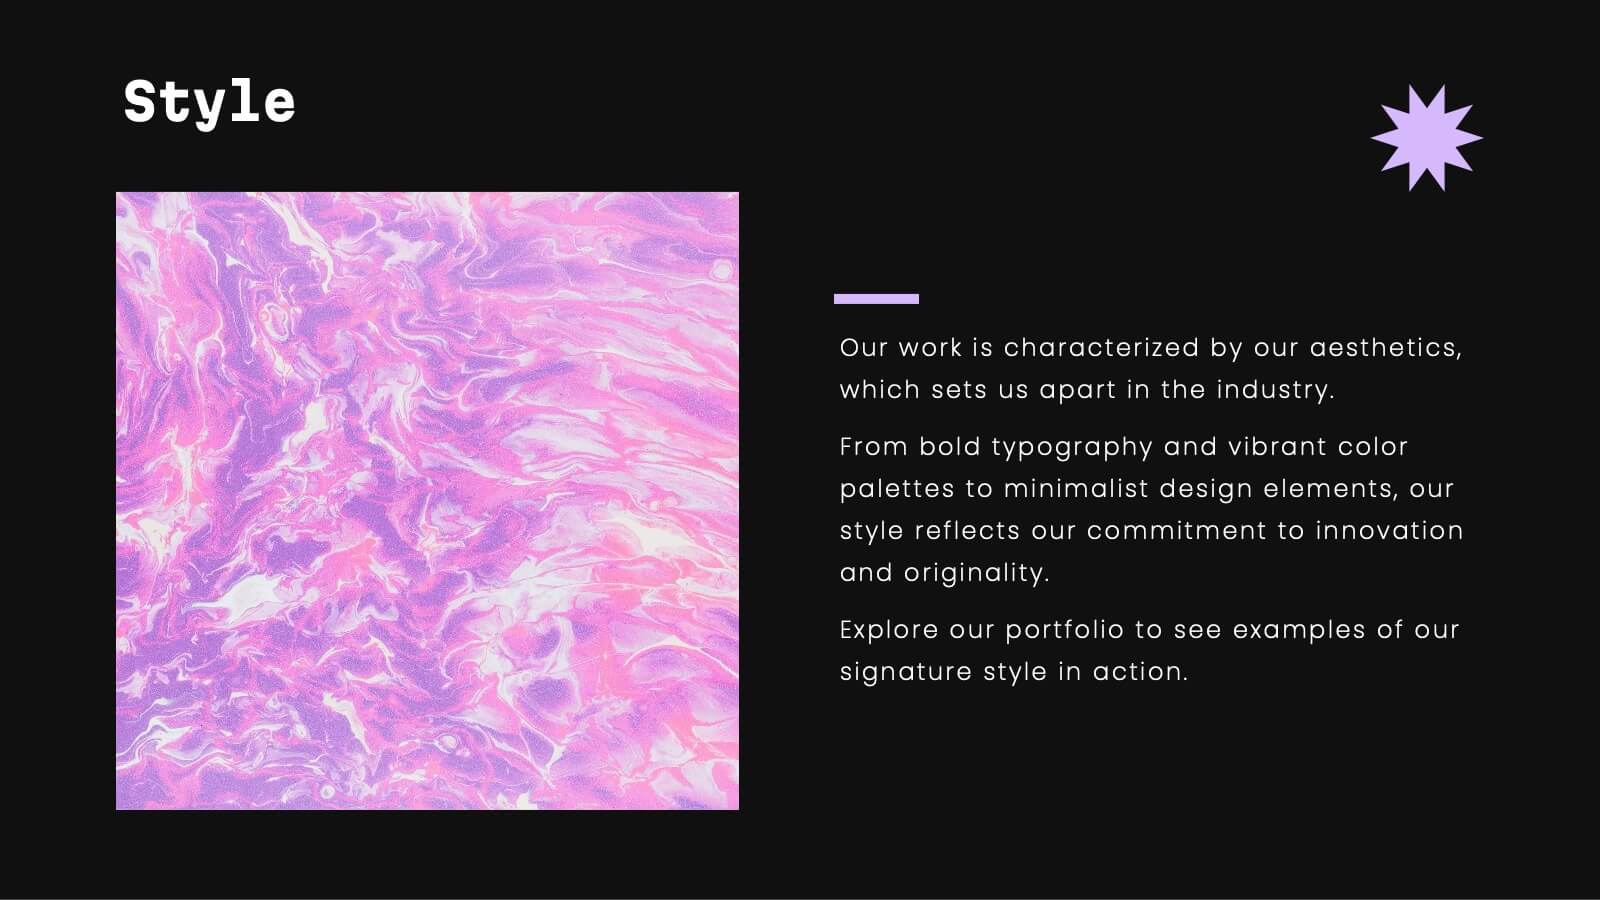
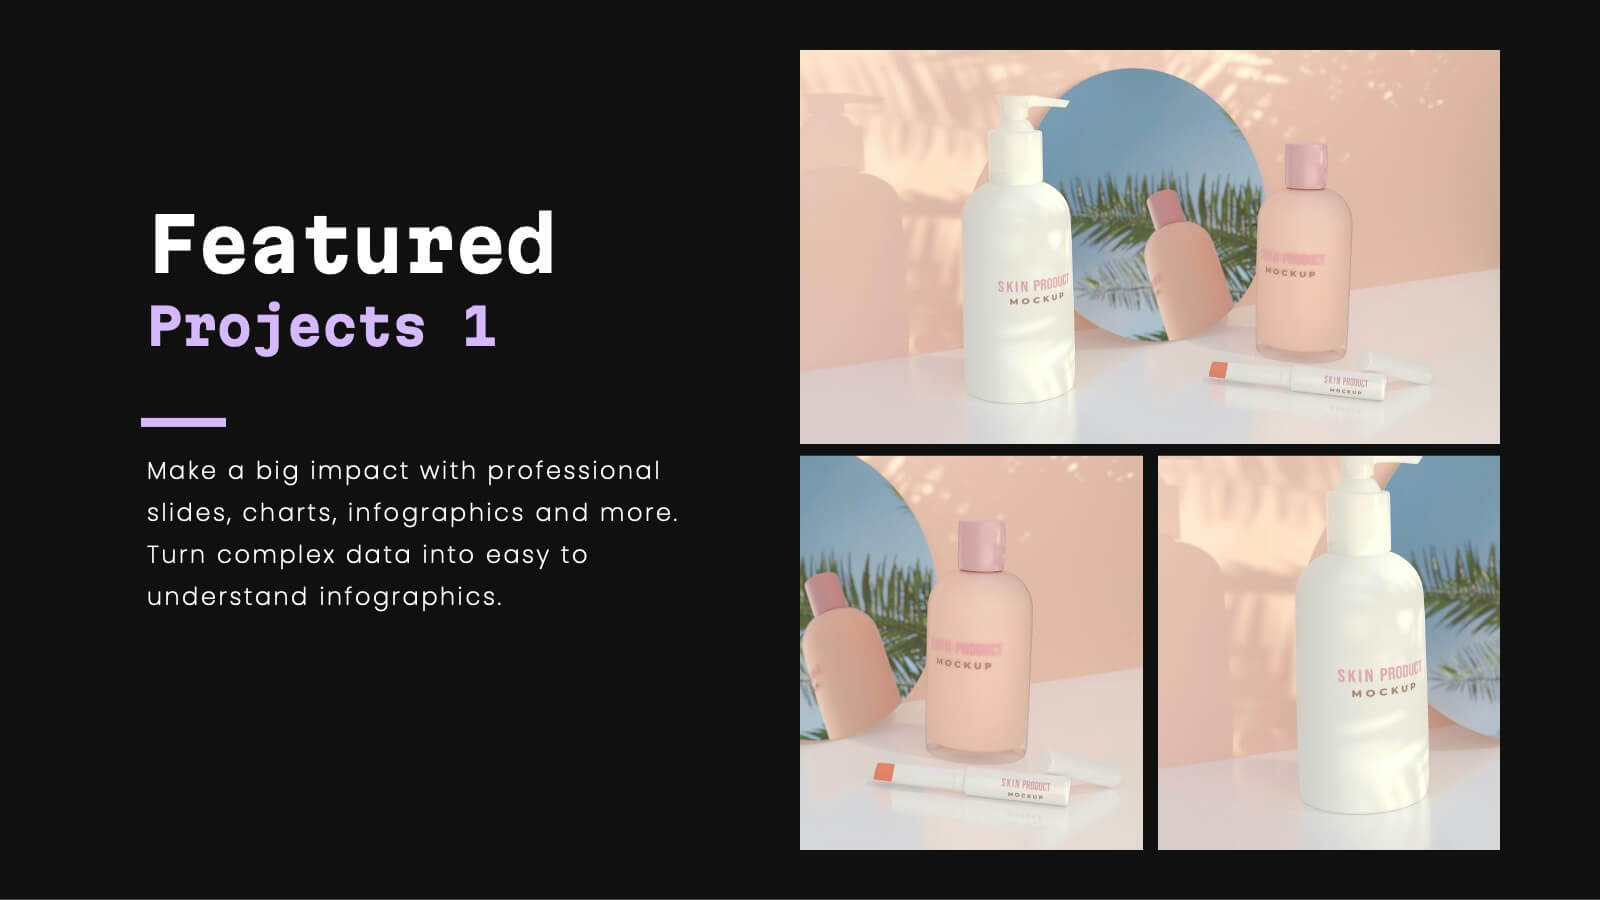
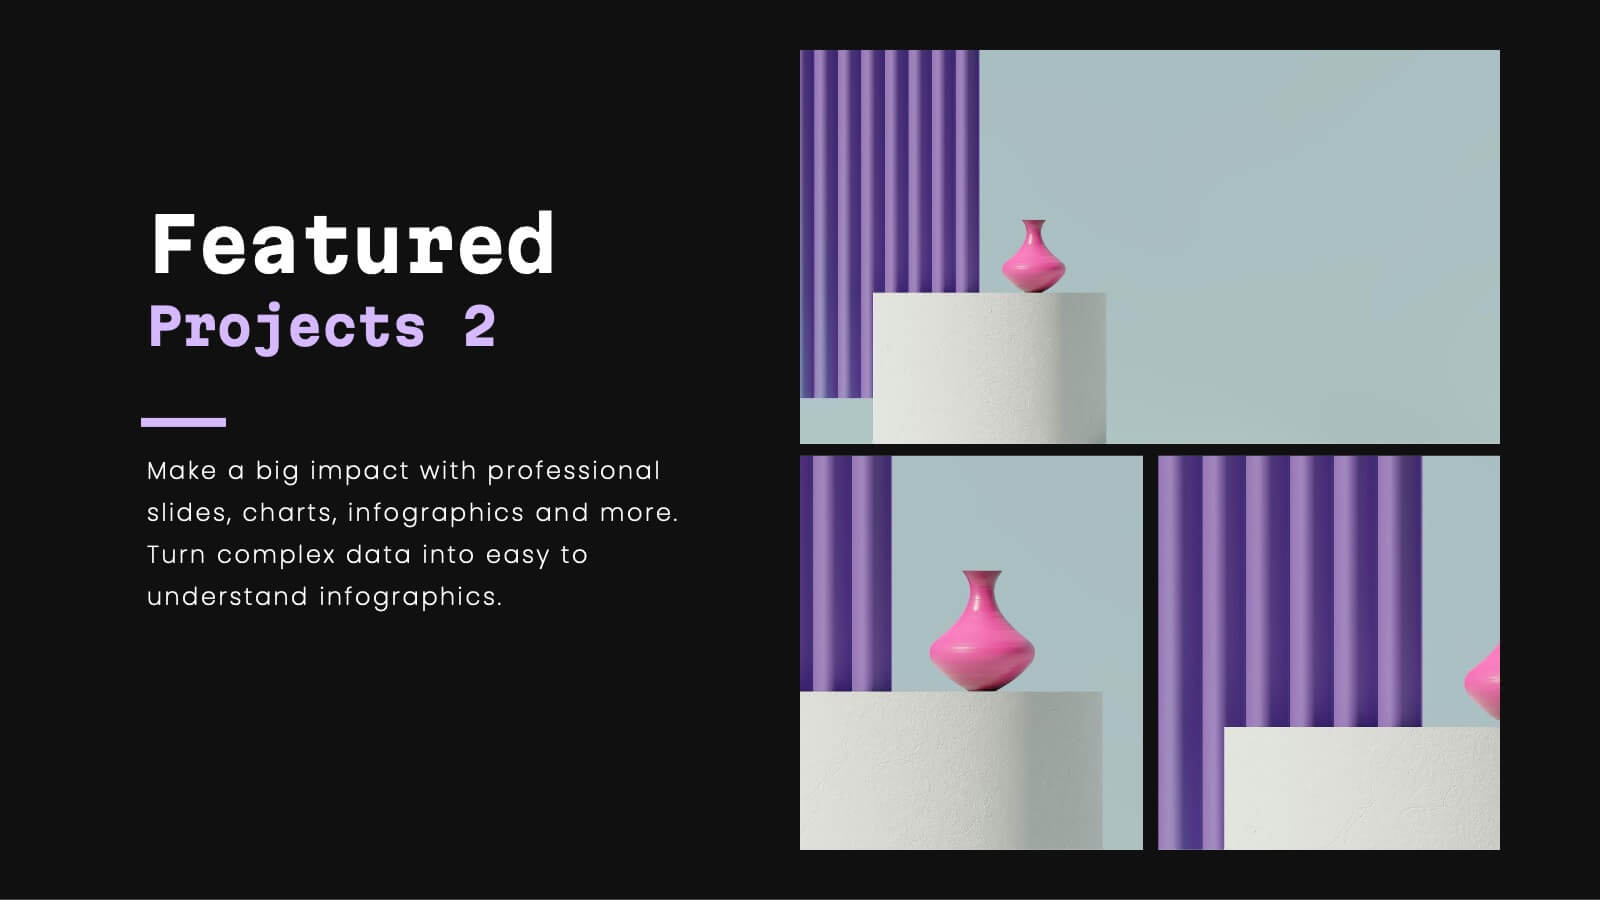
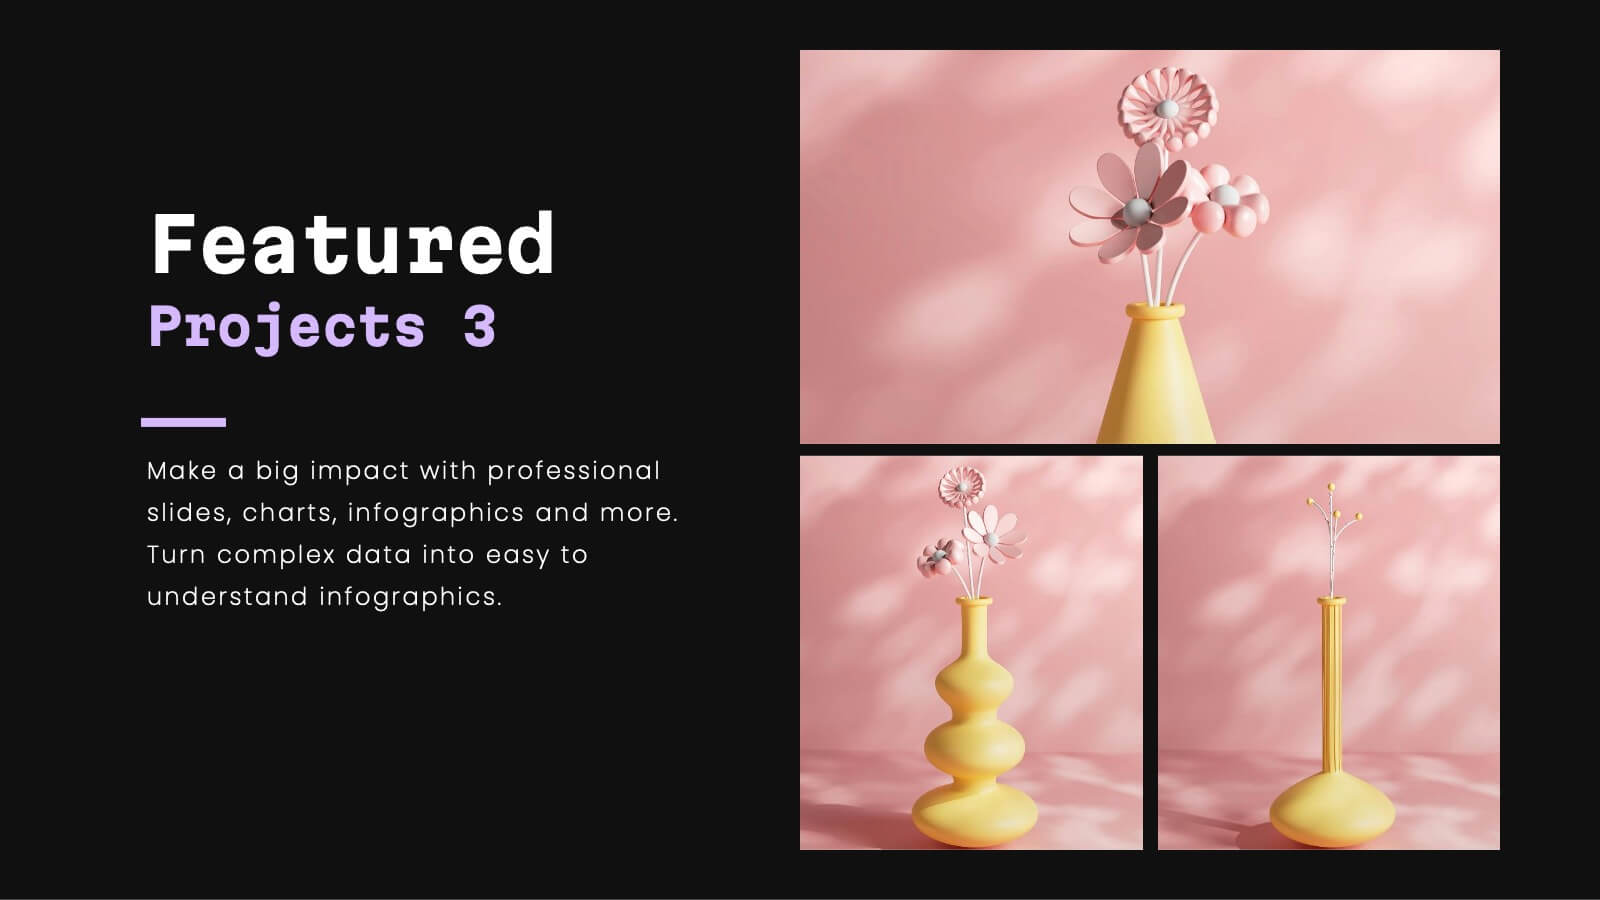
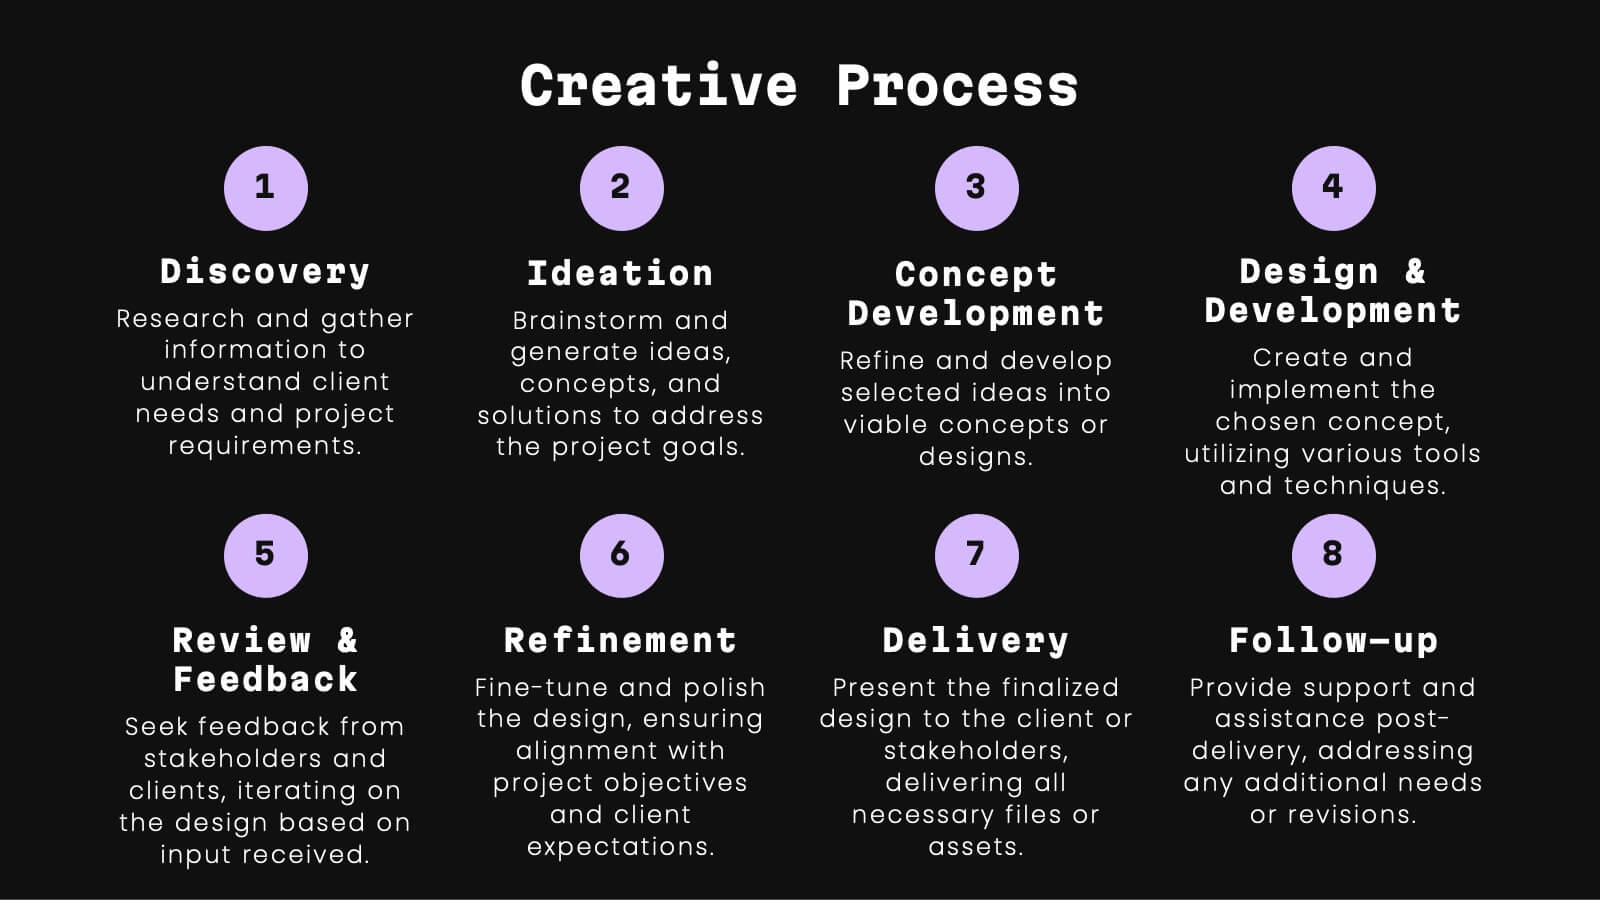
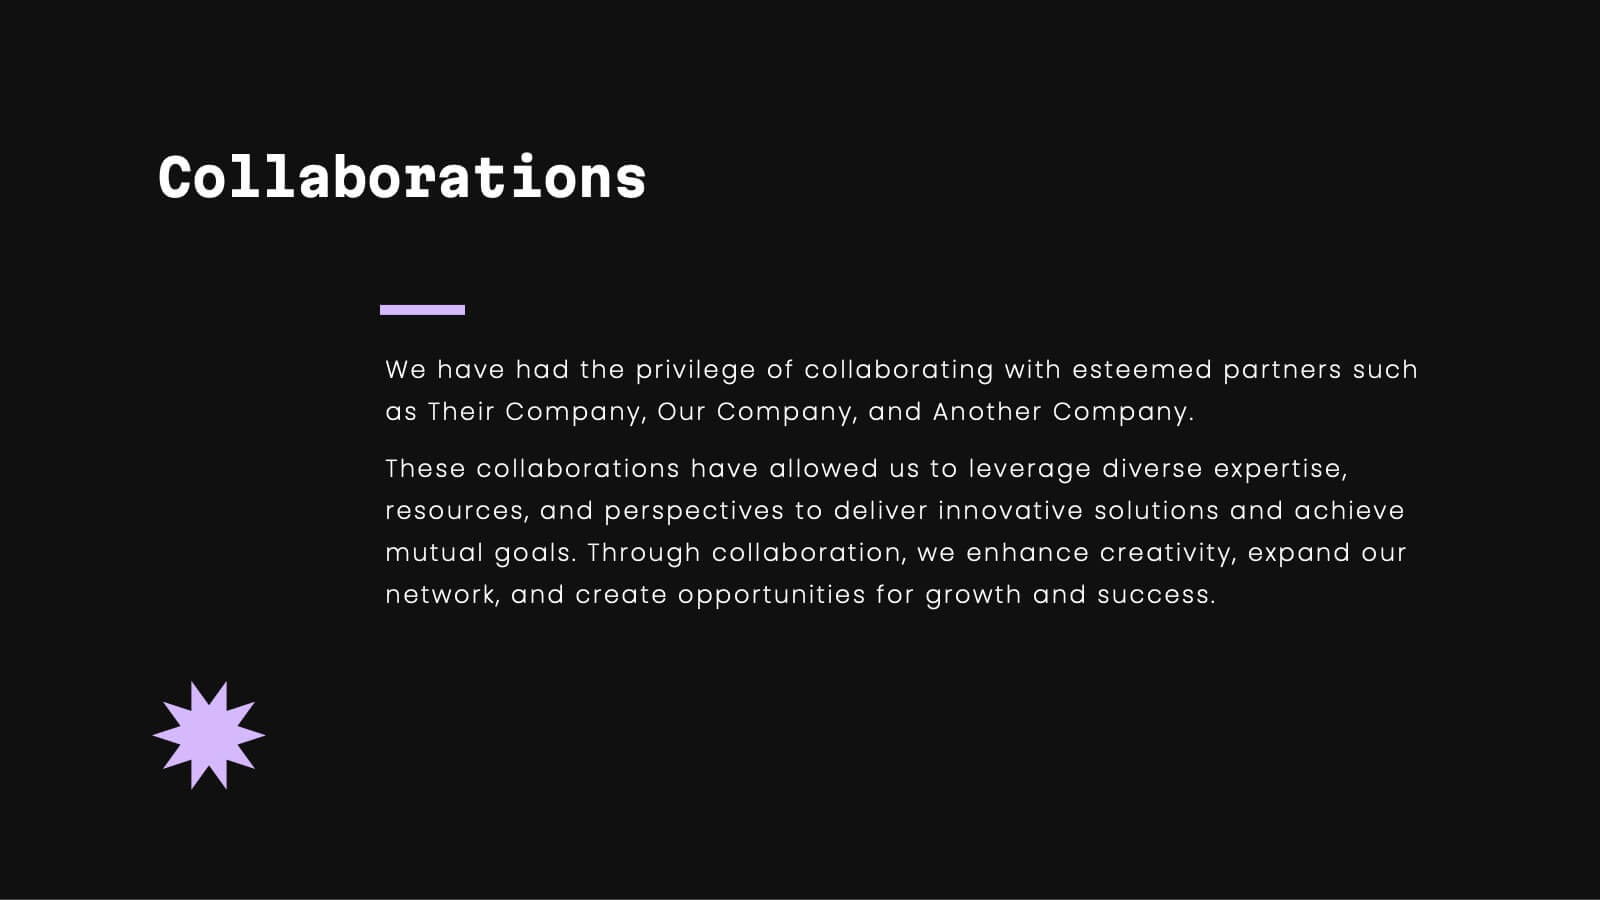
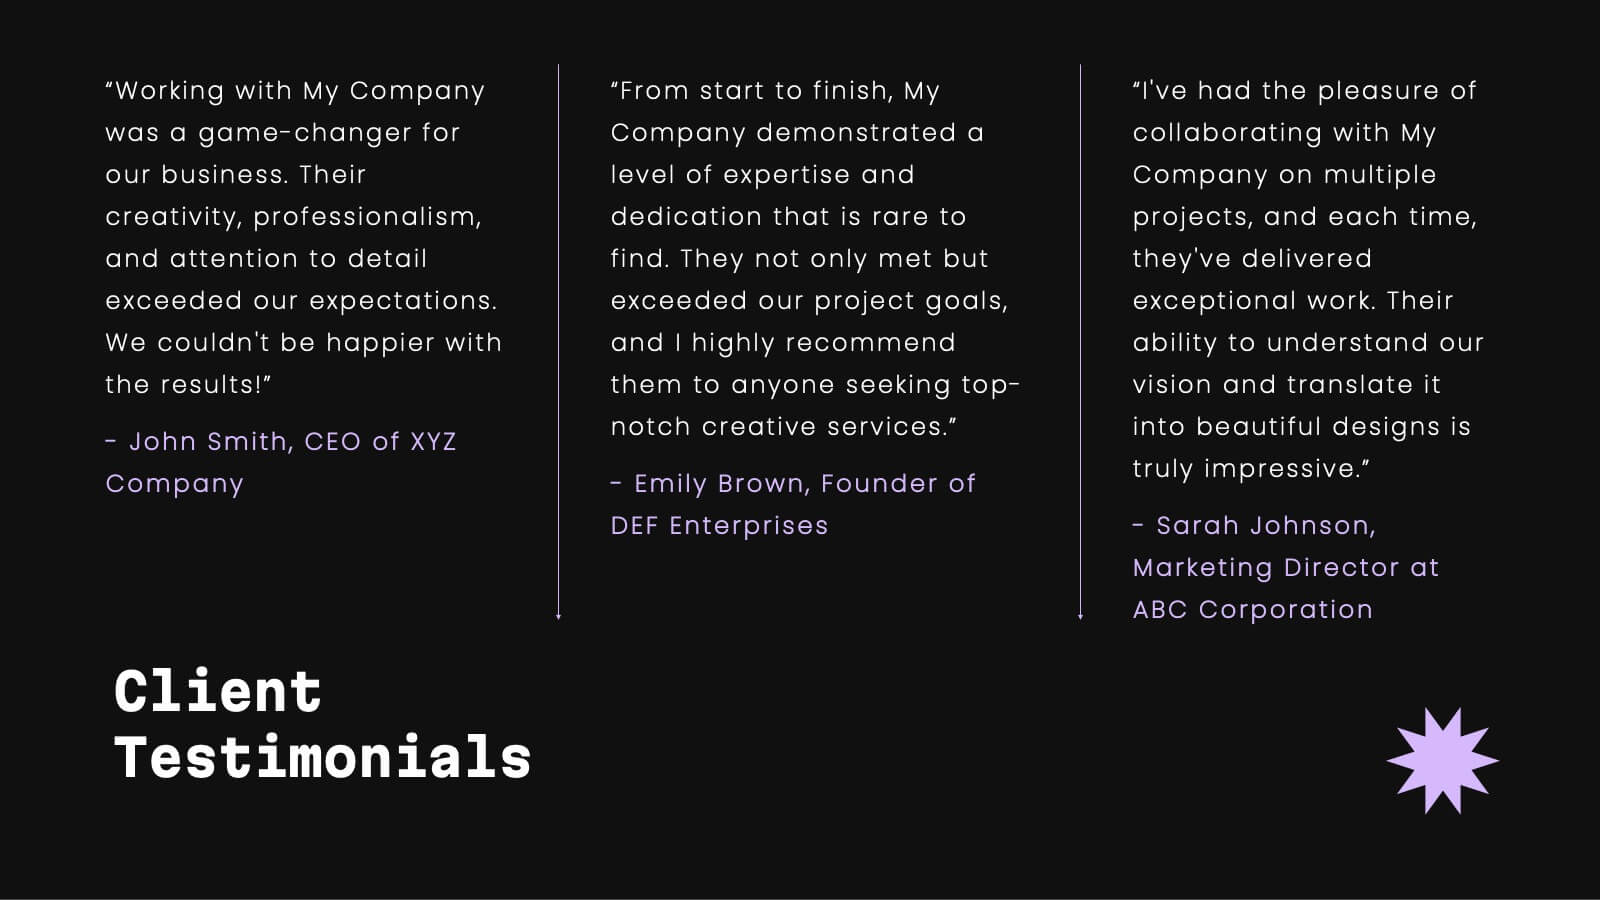
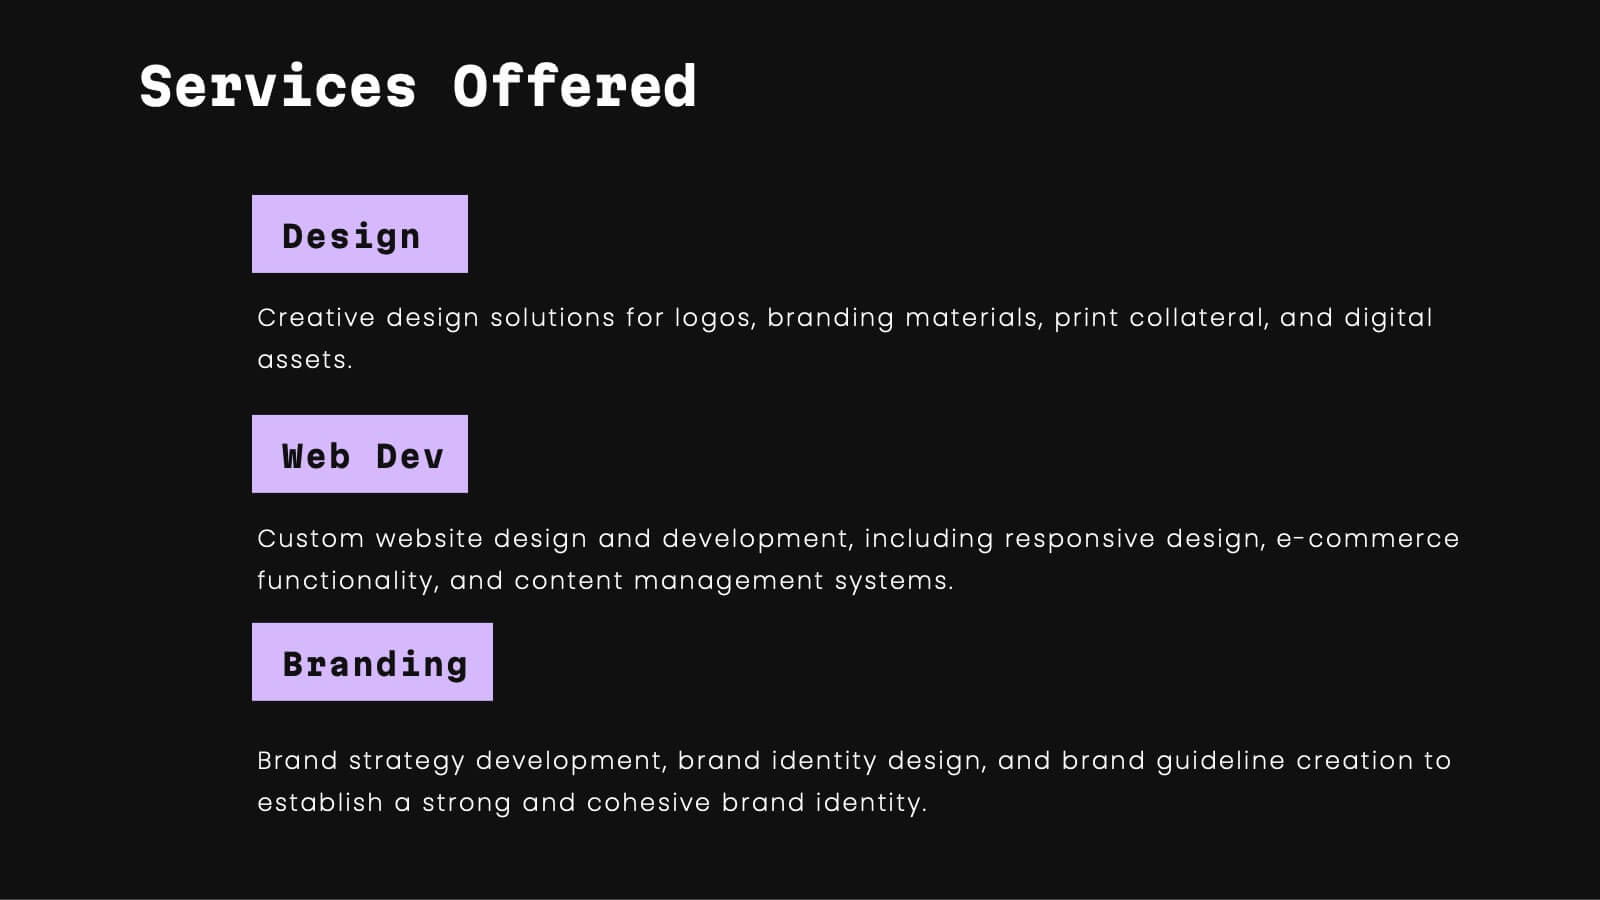
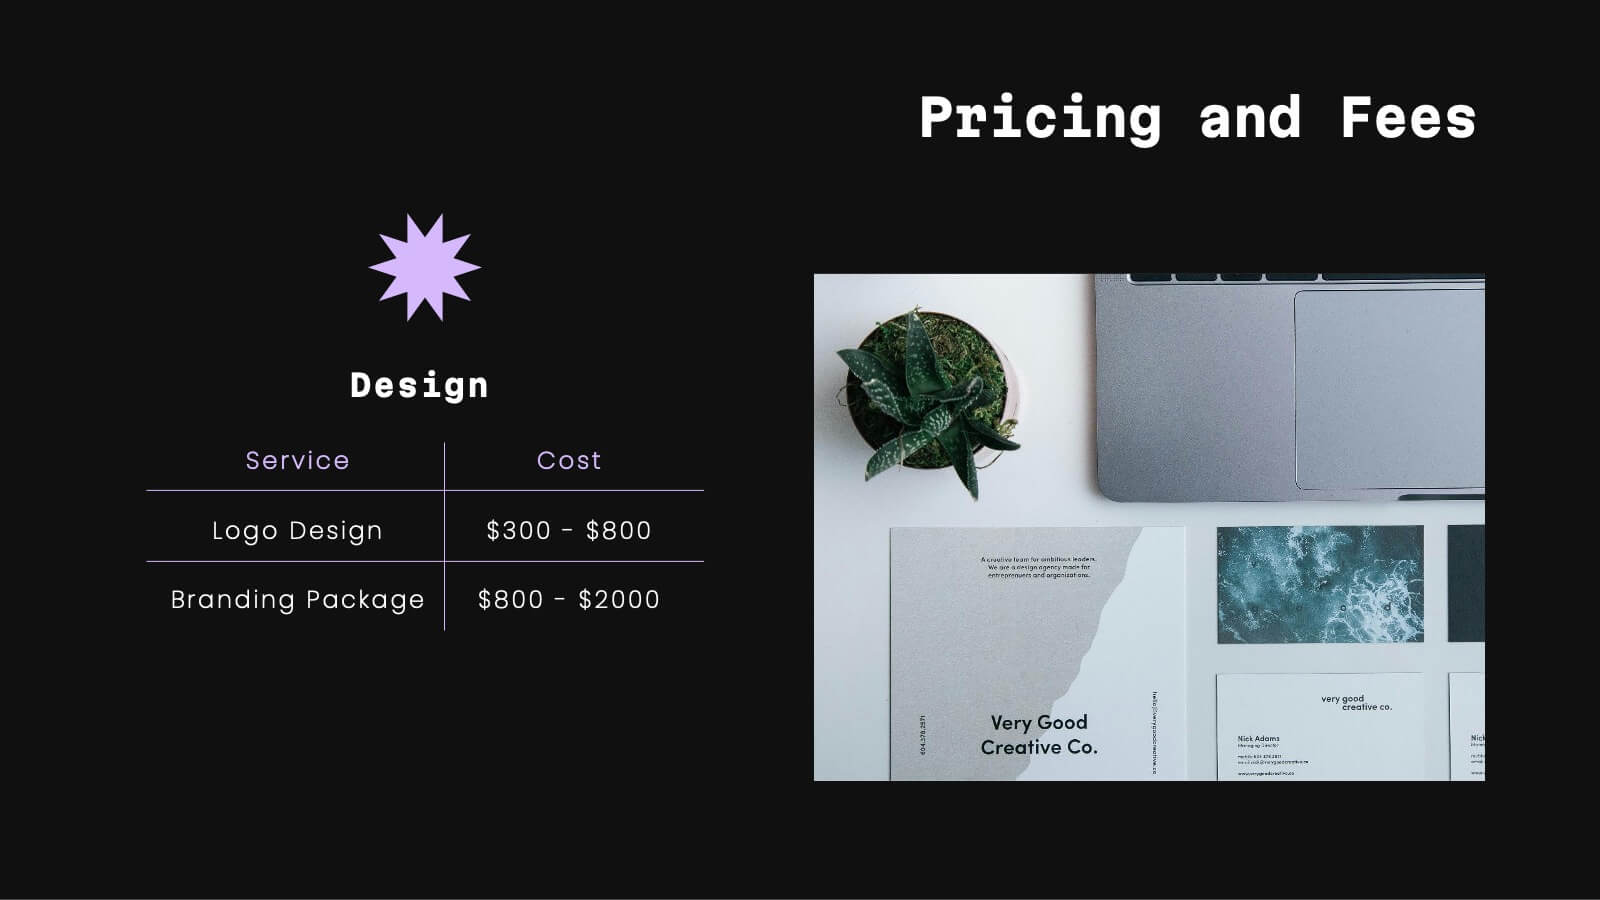
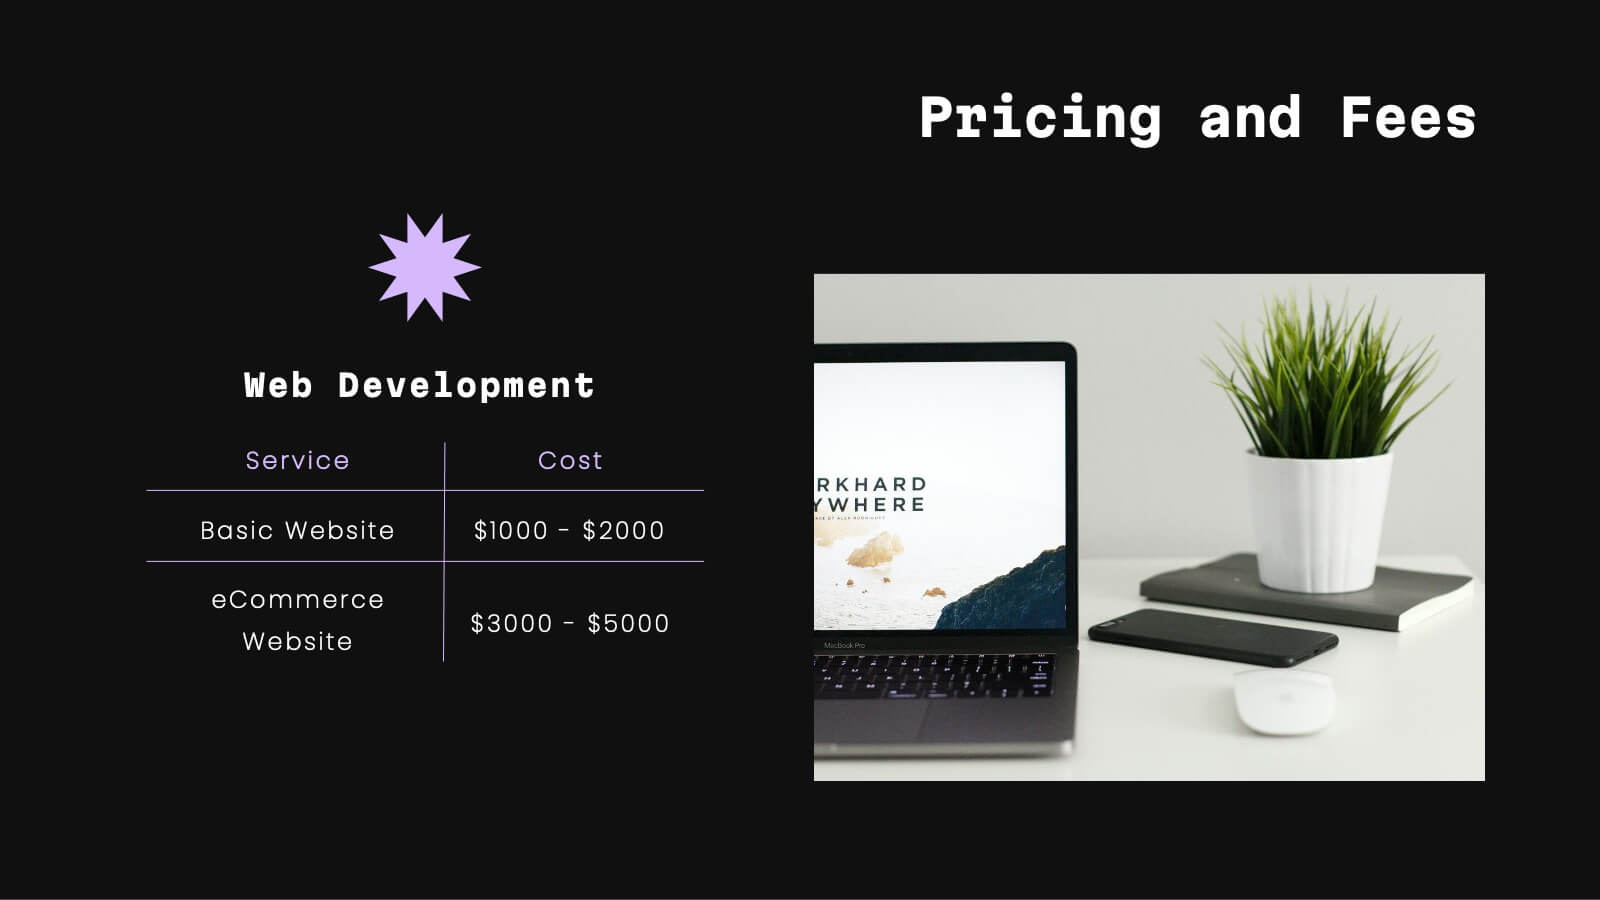
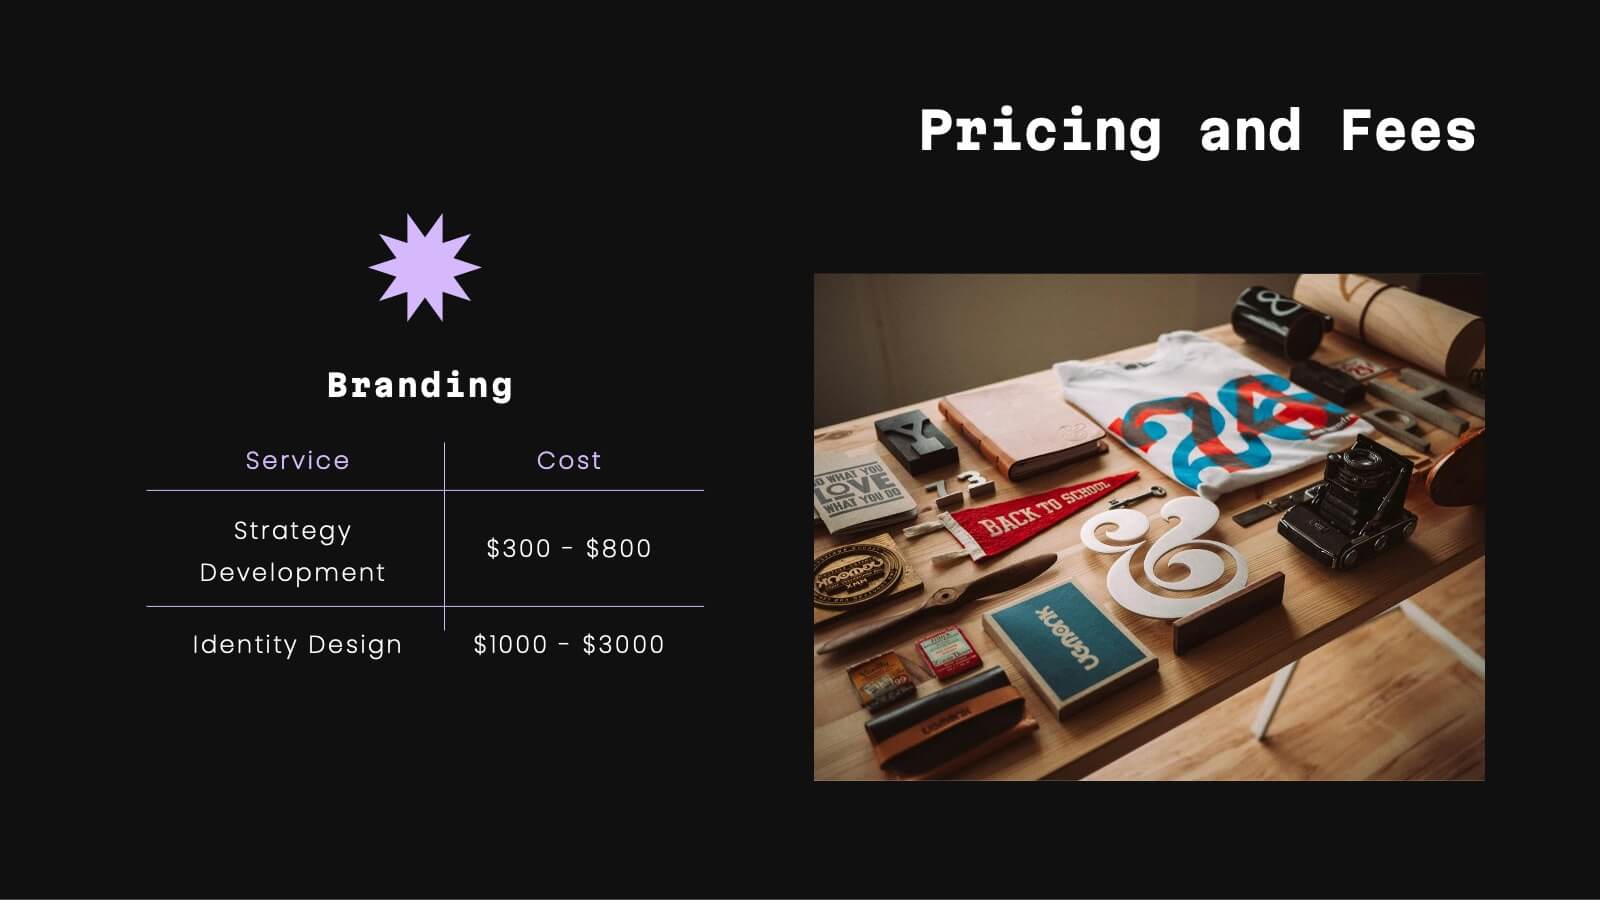
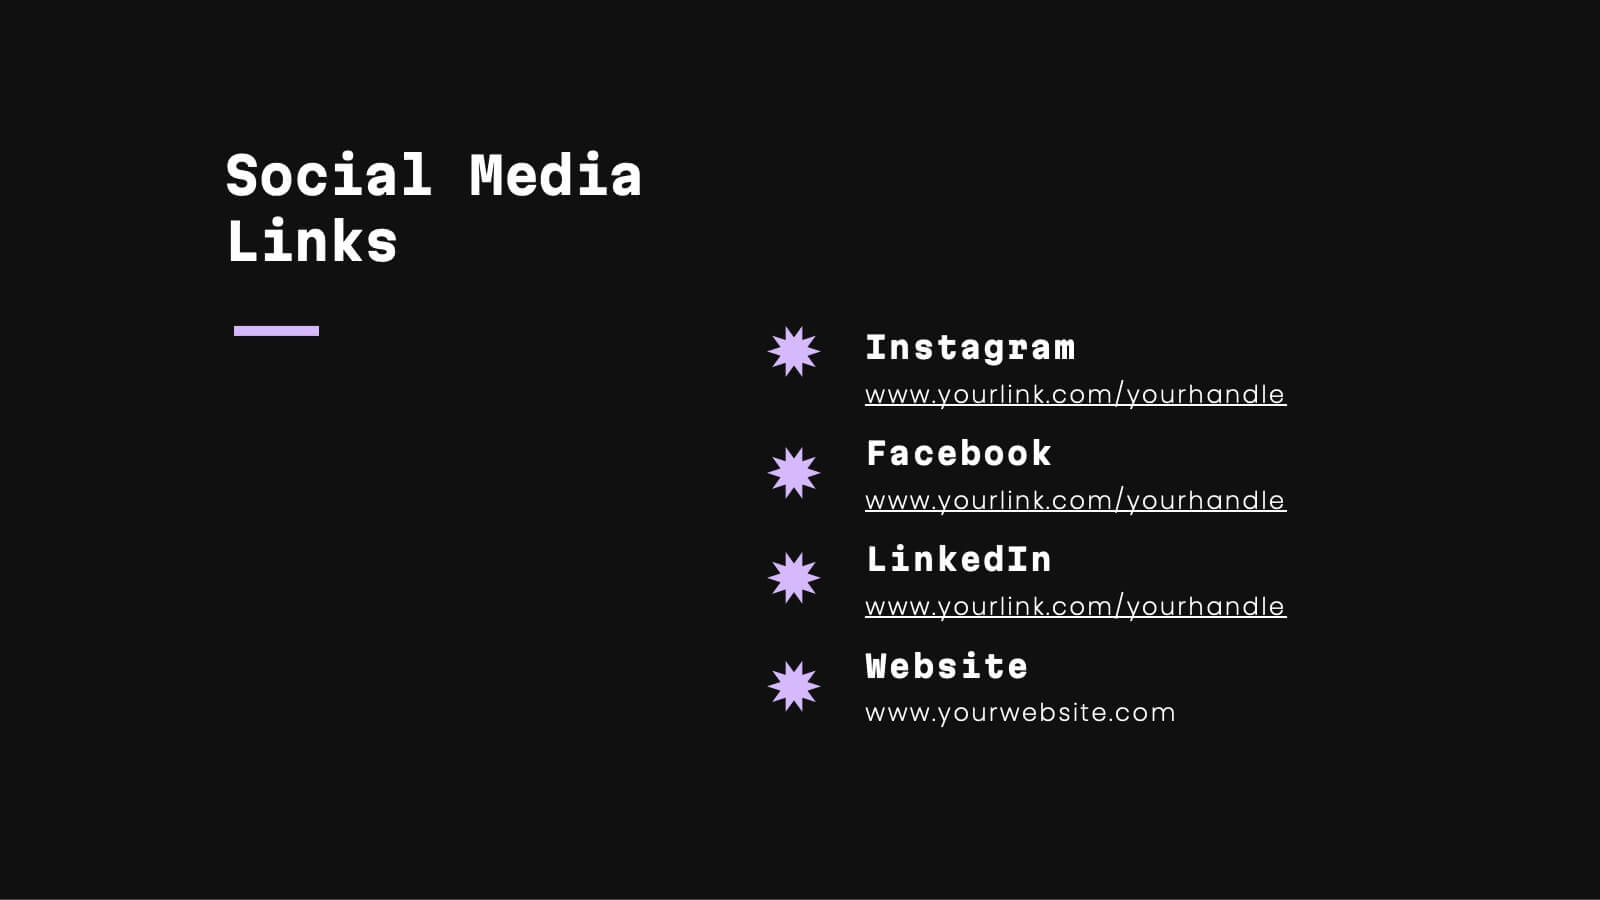
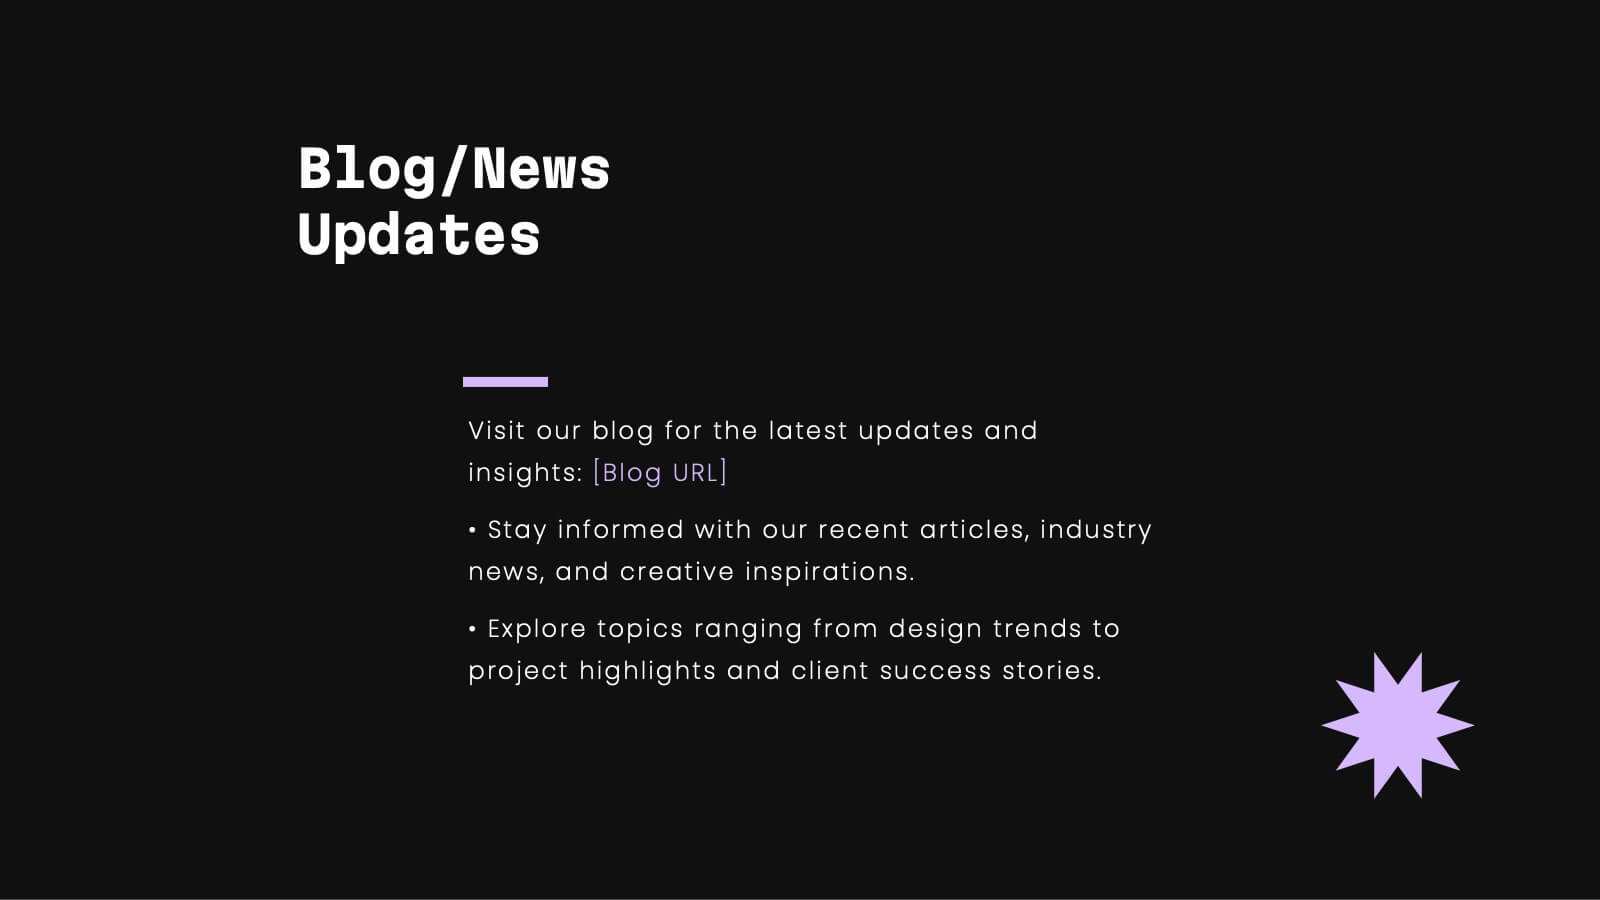
Celeste Professional Portfolio Showcase Presentation
Impress with style using this sophisticated portfolio presentation template. Perfect for showcasing featured projects, creative processes, and client testimonials, this template enhances the visual appeal of your work. Its modern, dark-themed design ensures your content stands out, making a lasting impression. Compatible with PowerPoint, Keynote, and Google Slides, it's versatile for any platform.