
Características


¿Tienes alguna pregunta?
Recomendar


7 diapositivas
Weight Challenge Infographic Presentation
Challenges are essential for personal and professional growth, and they play an important role in our lives in several ways. This template is designed for any and all use. You can use it in business, academic presentations, or home. This template is designed to give you flexibility in your presentations and allow you to create dynamic content that stands out from the crowd. This is compatible with Powerpoint, Keynote, and Google Slides so you can easily edit your presentation. This template can be used for a variety of projects, including team building, goal setting and brainstorming!

22 diapositivas
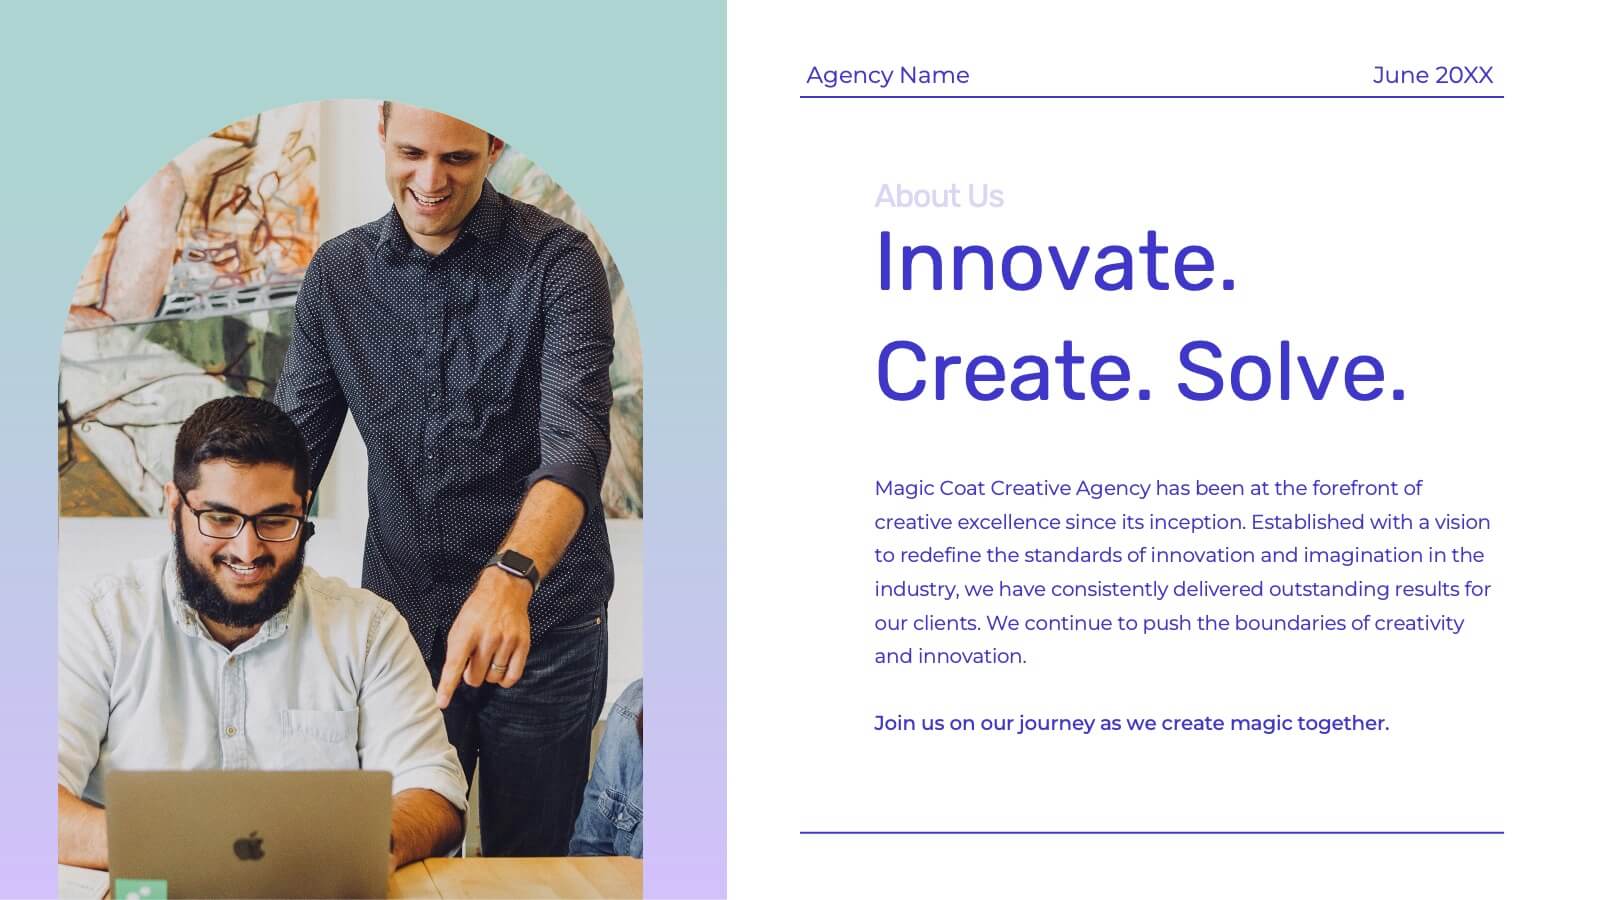
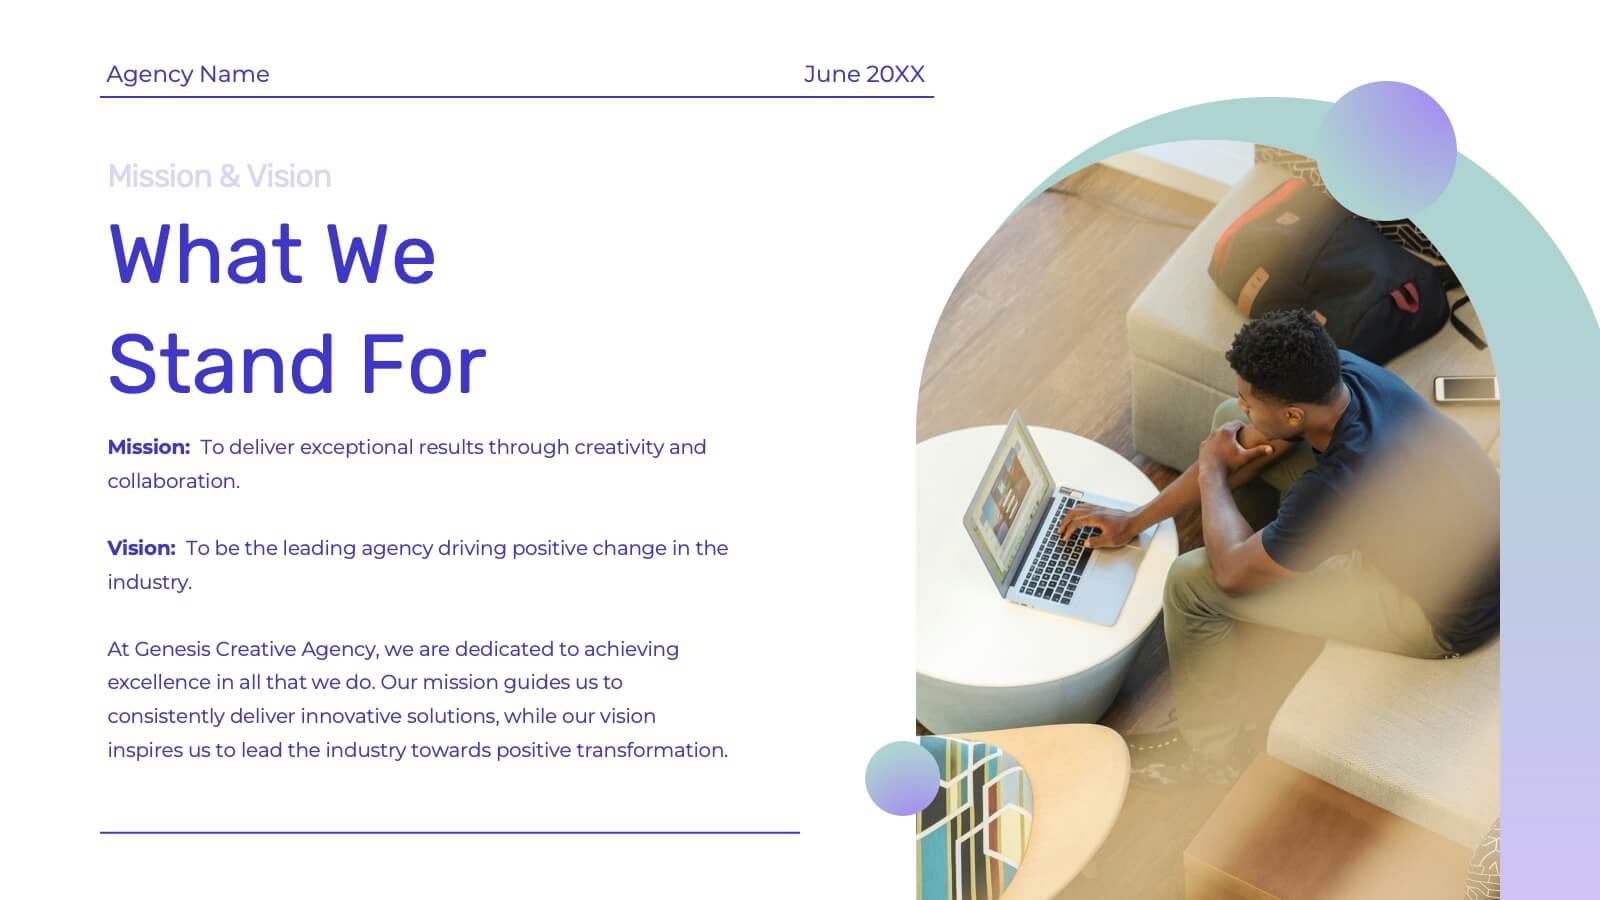
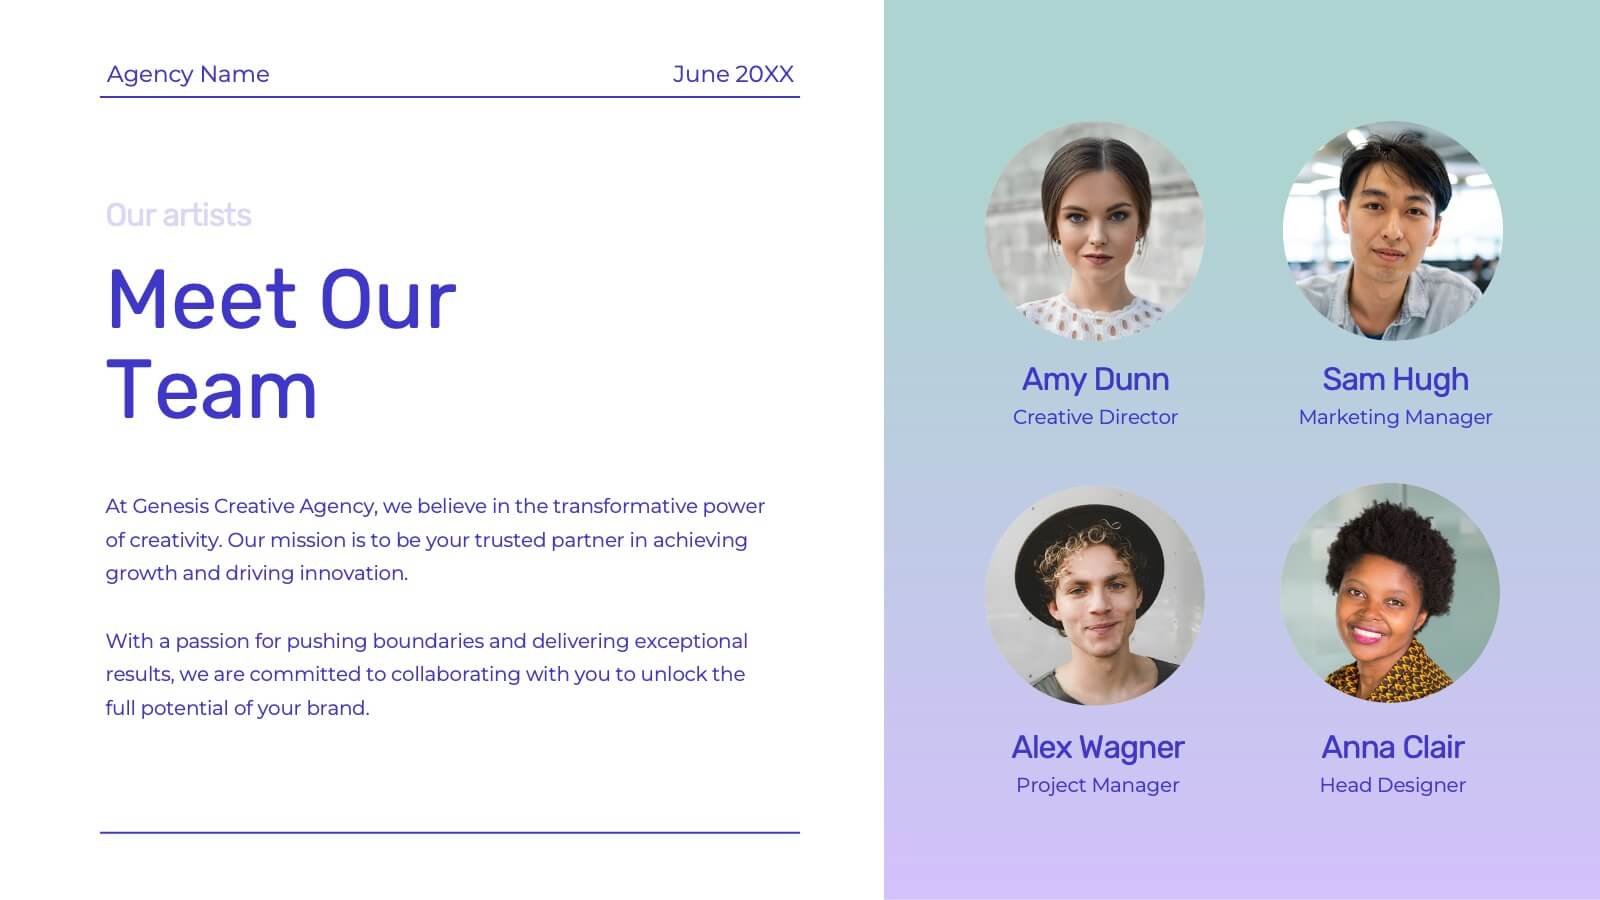
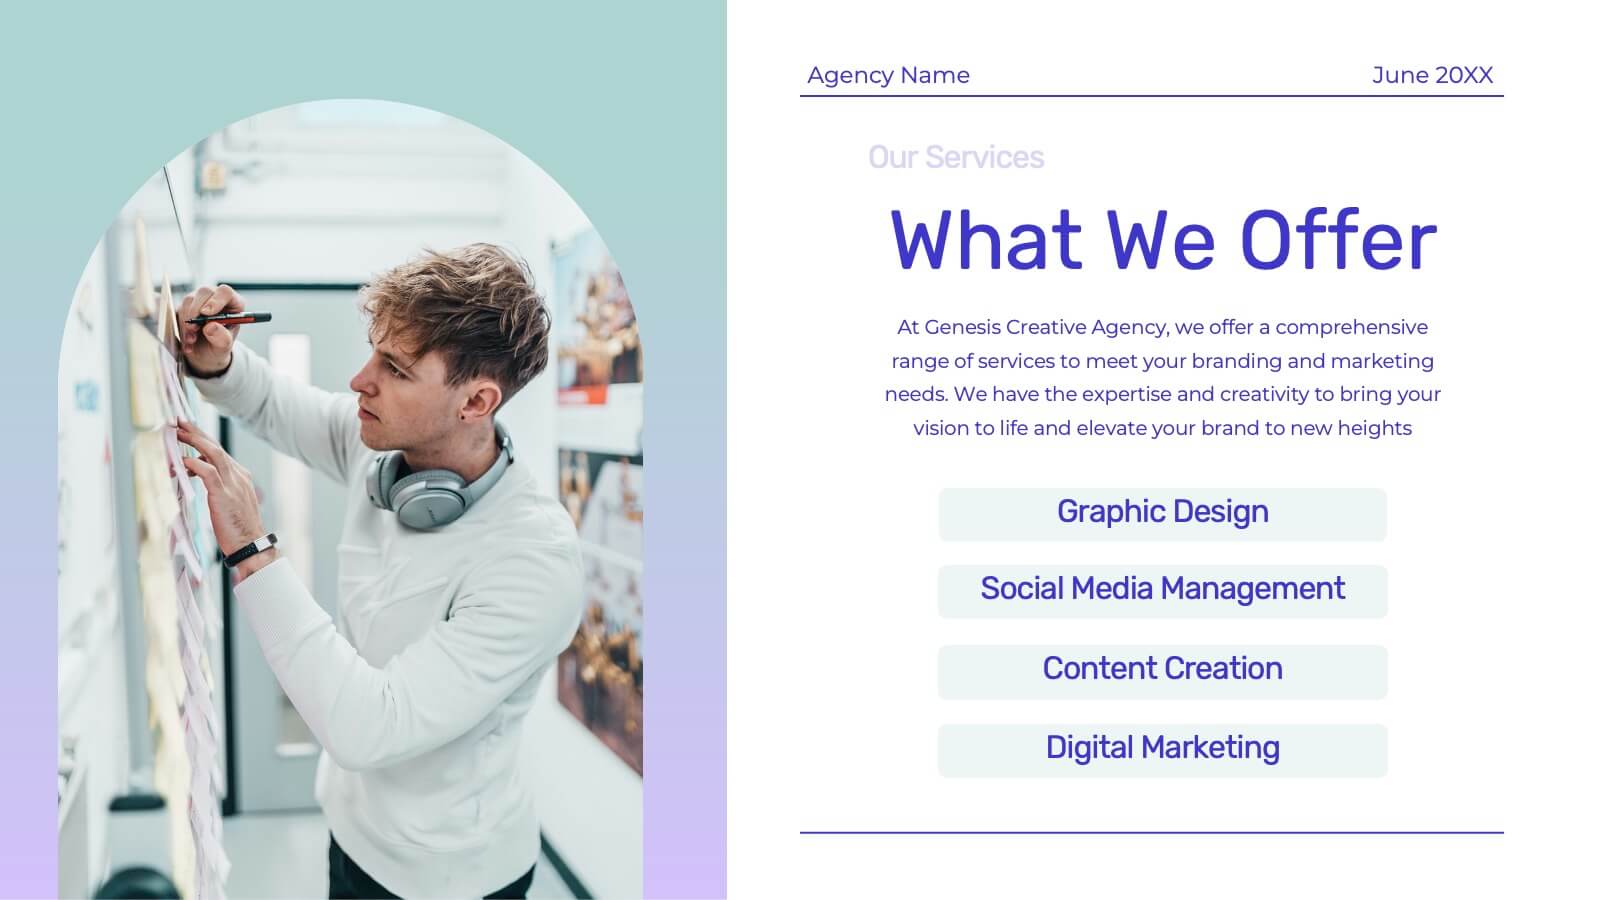
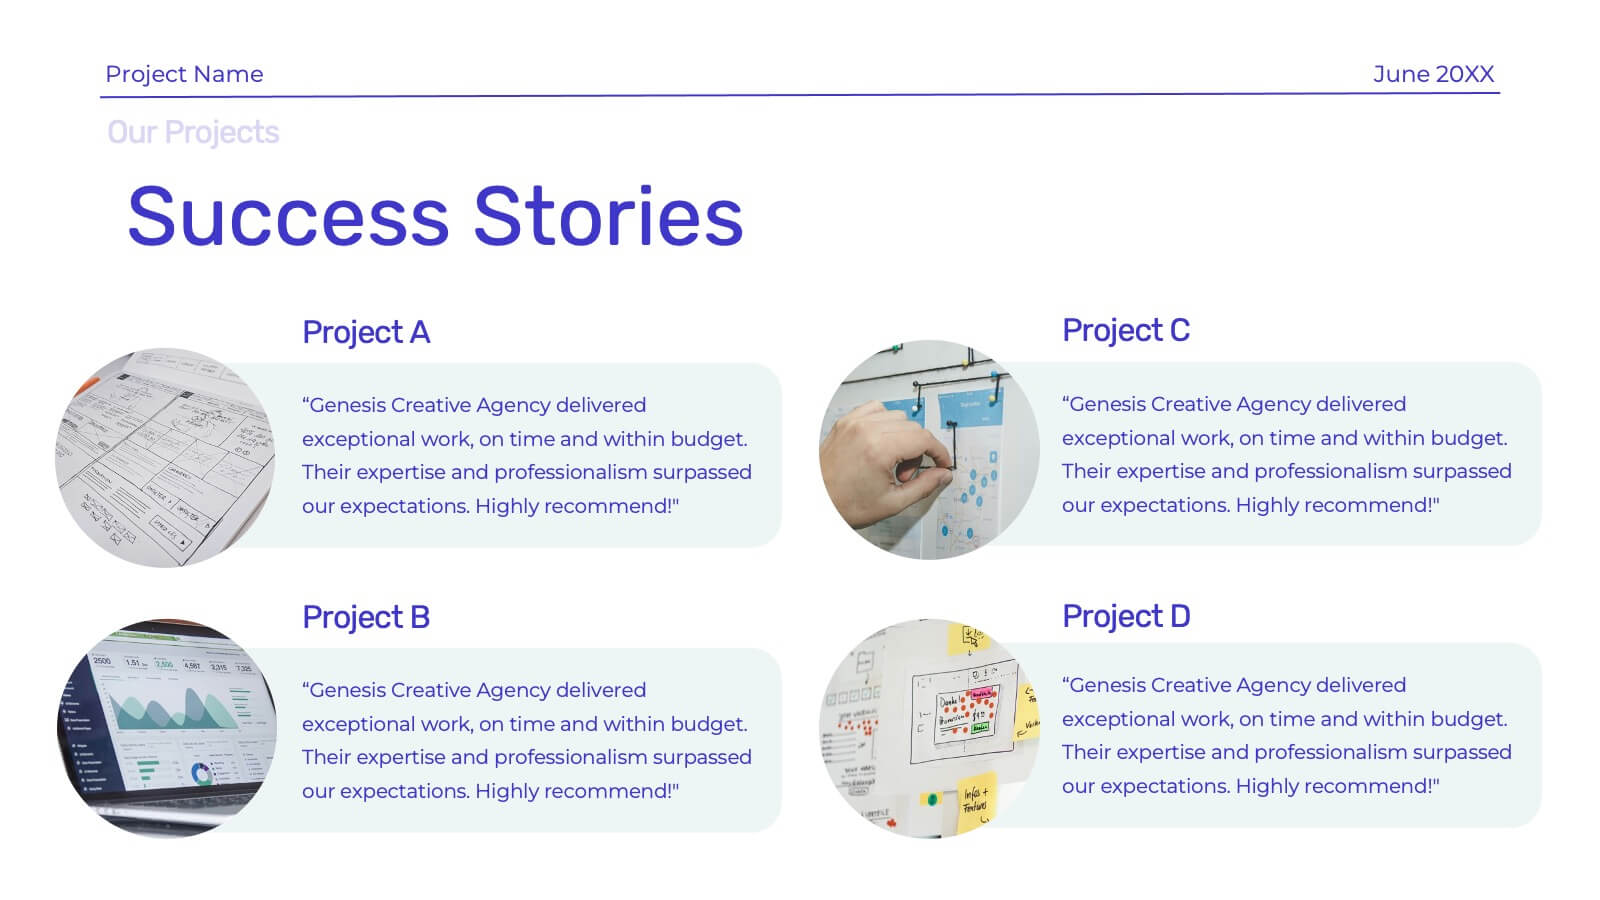
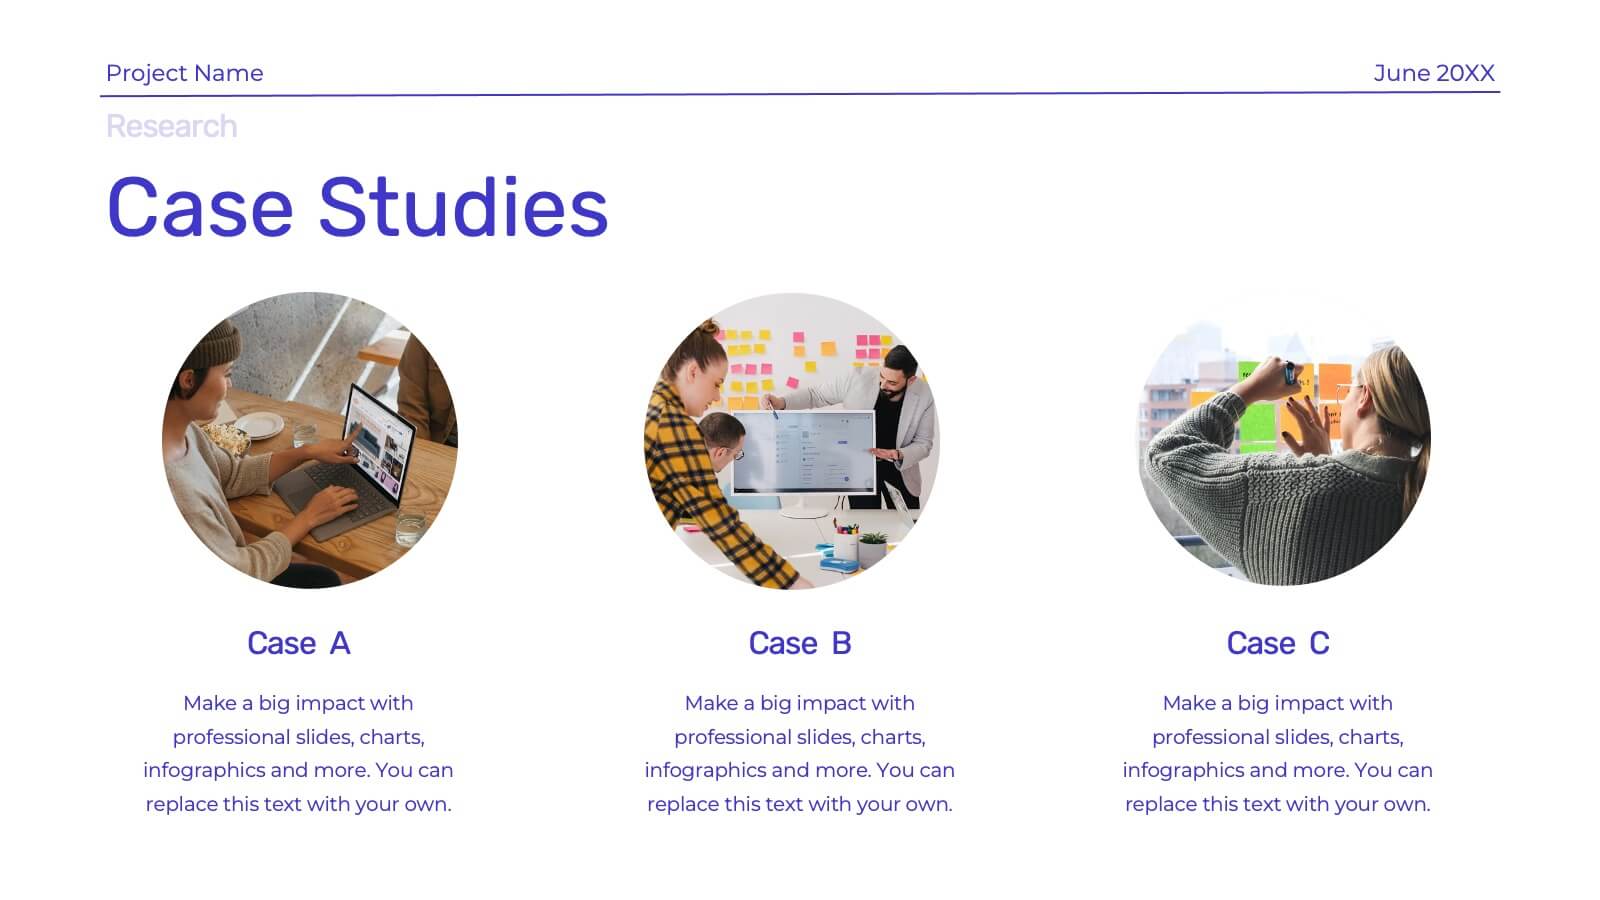
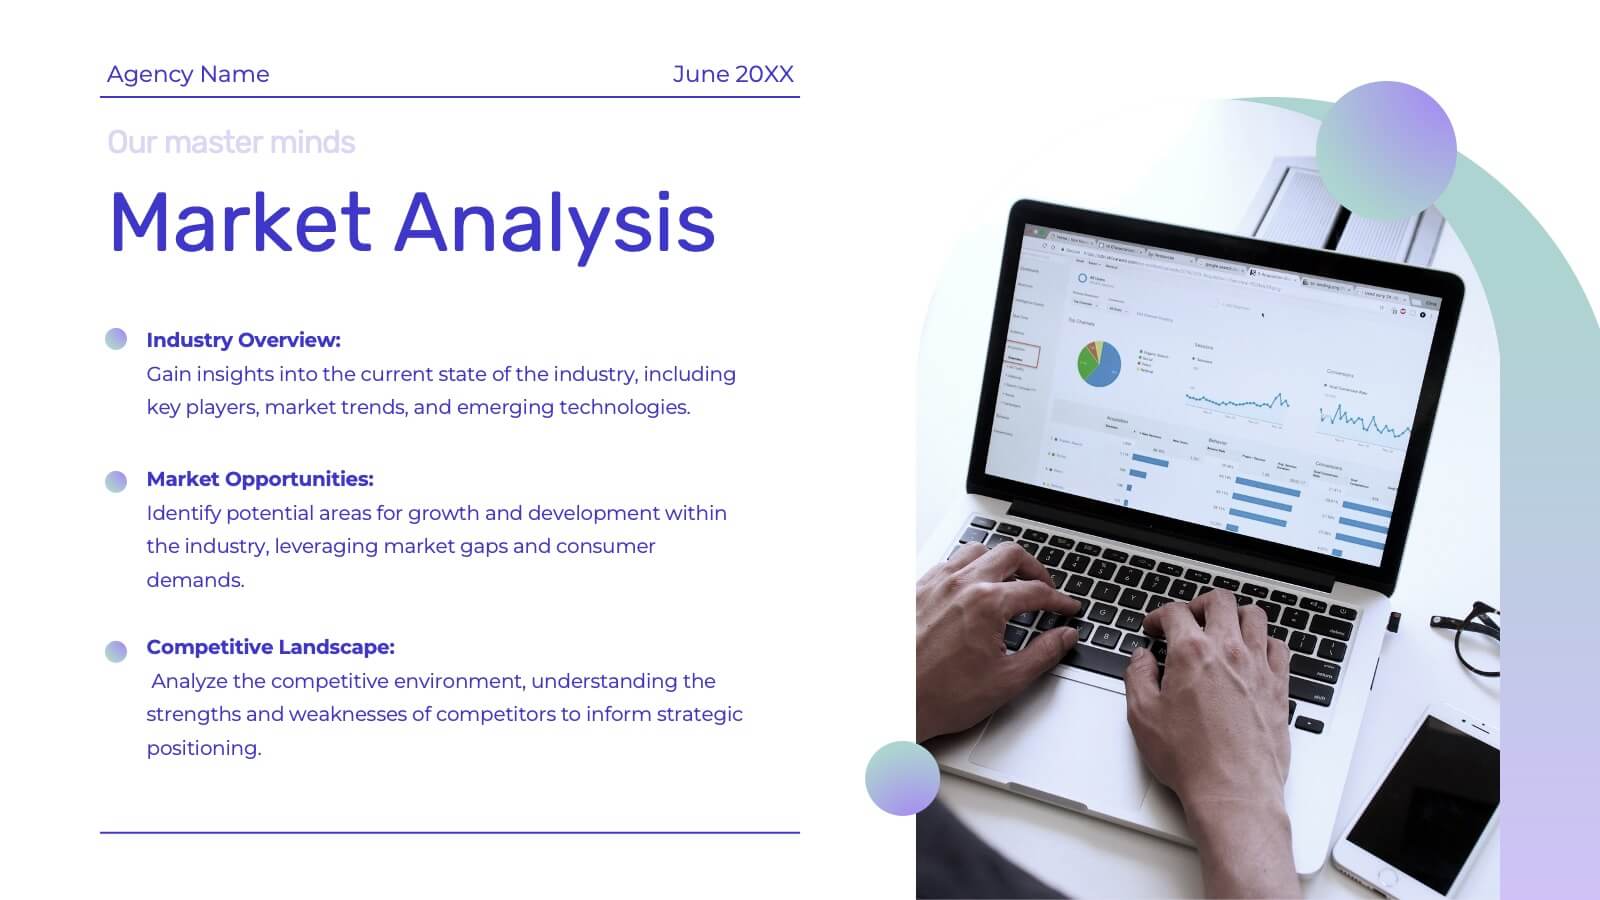
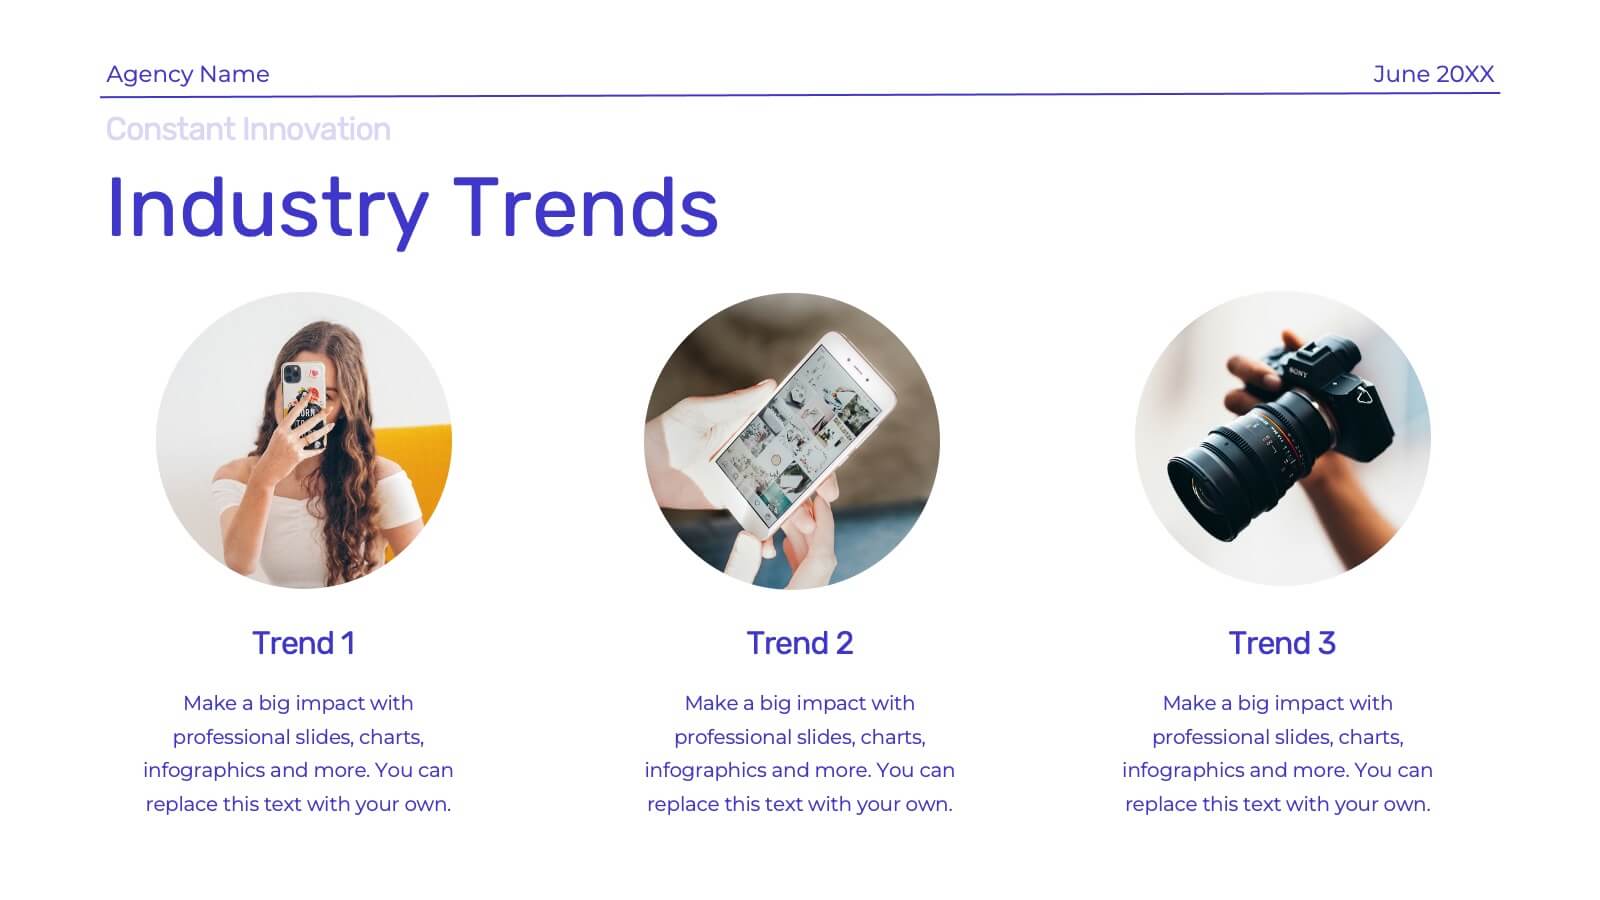
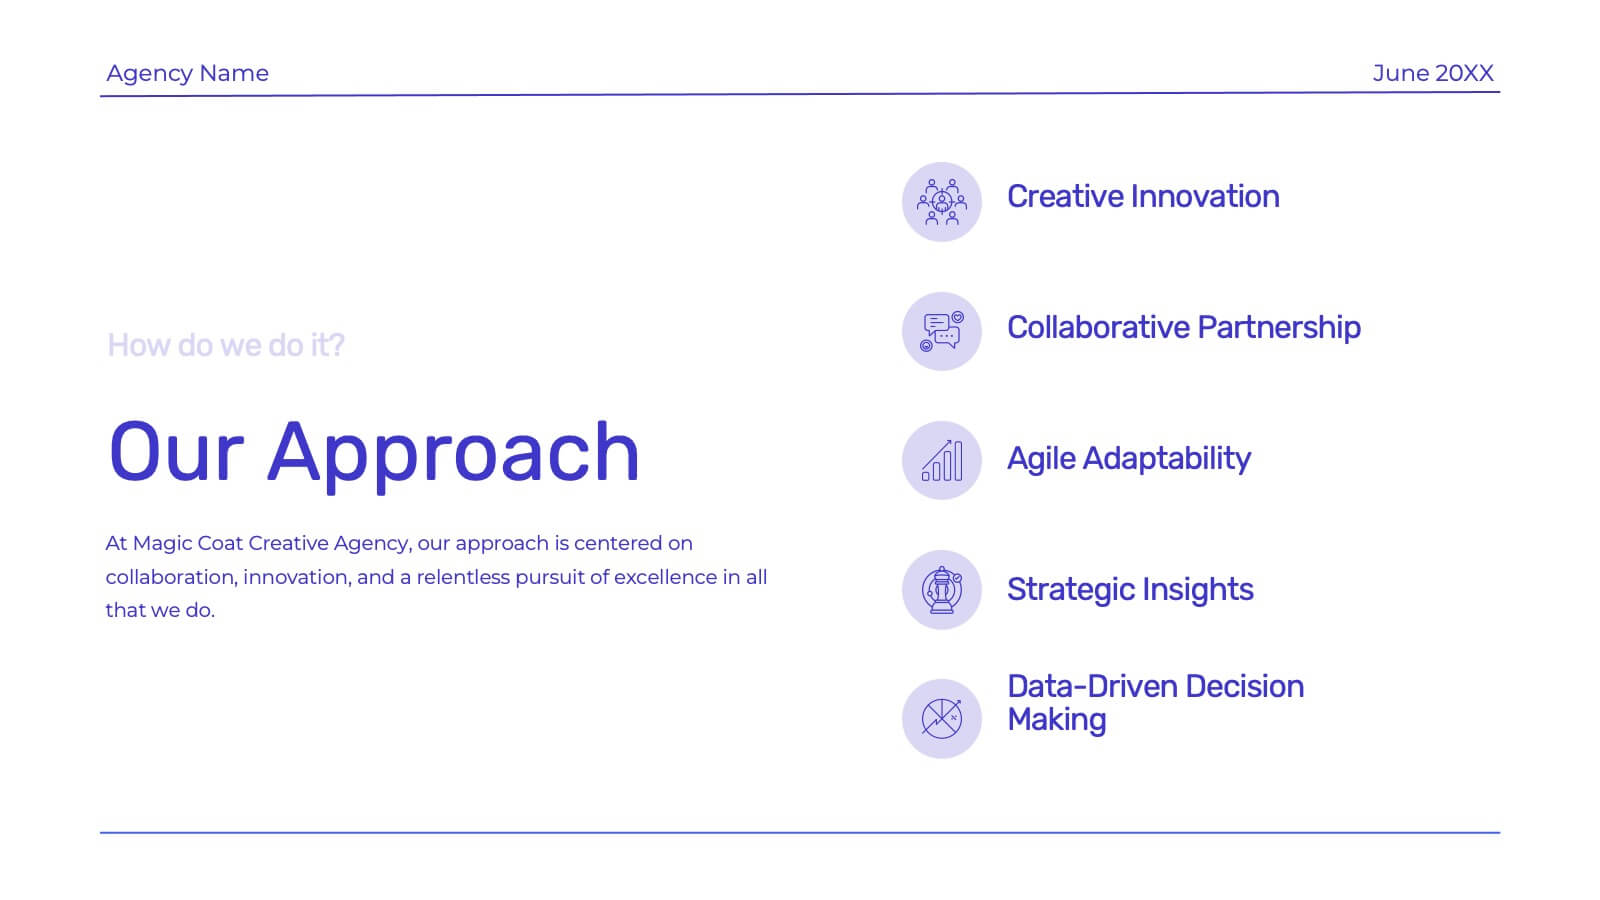
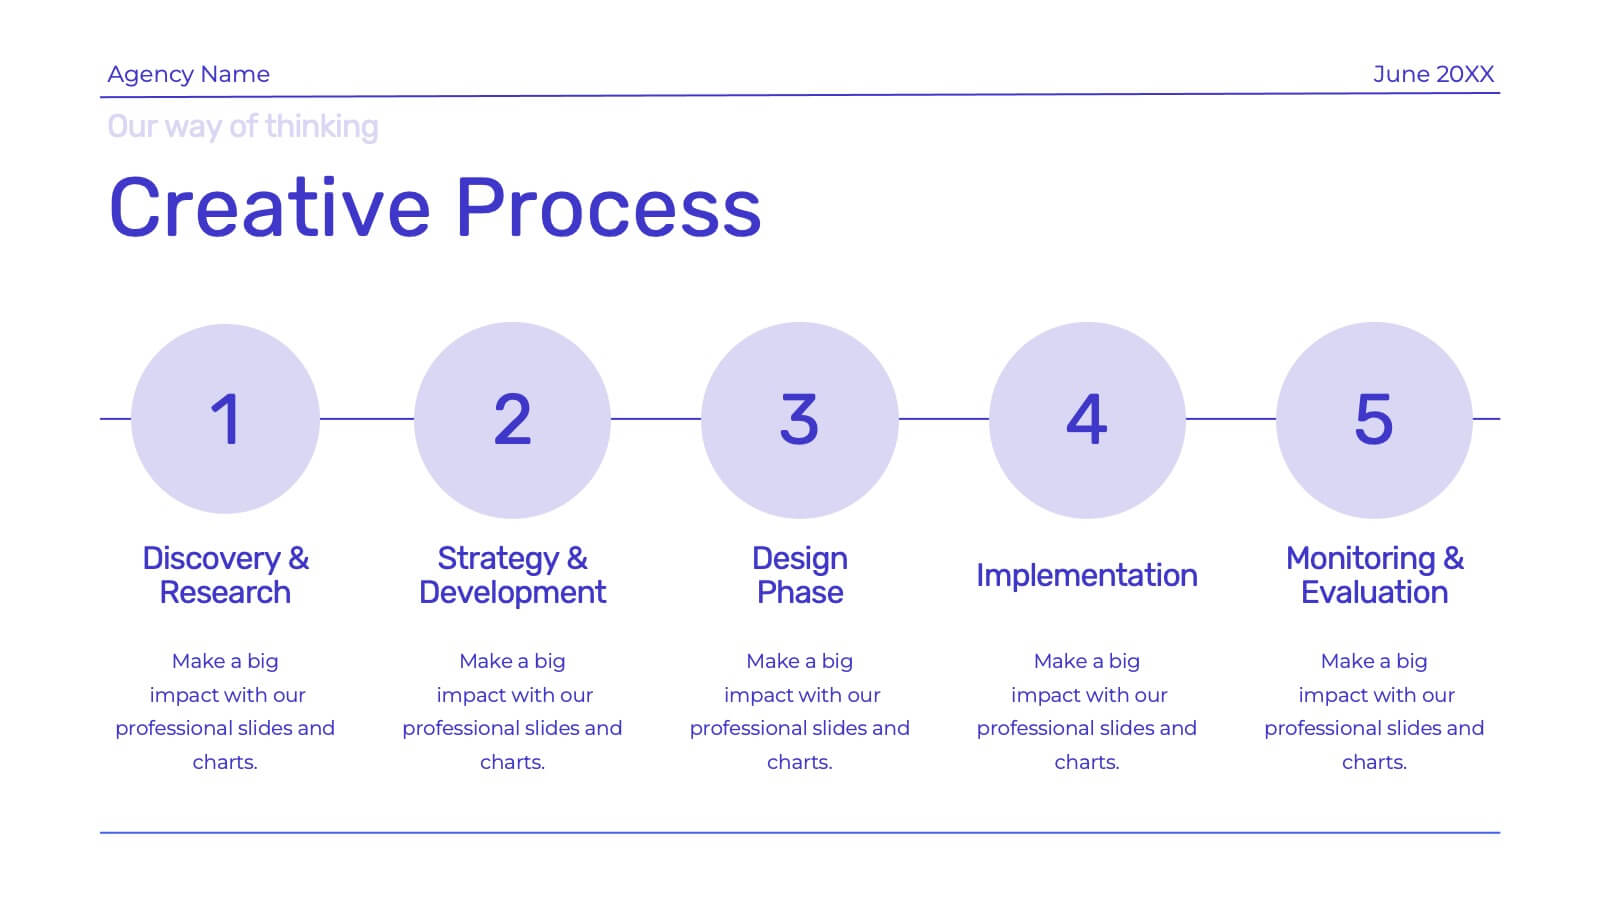
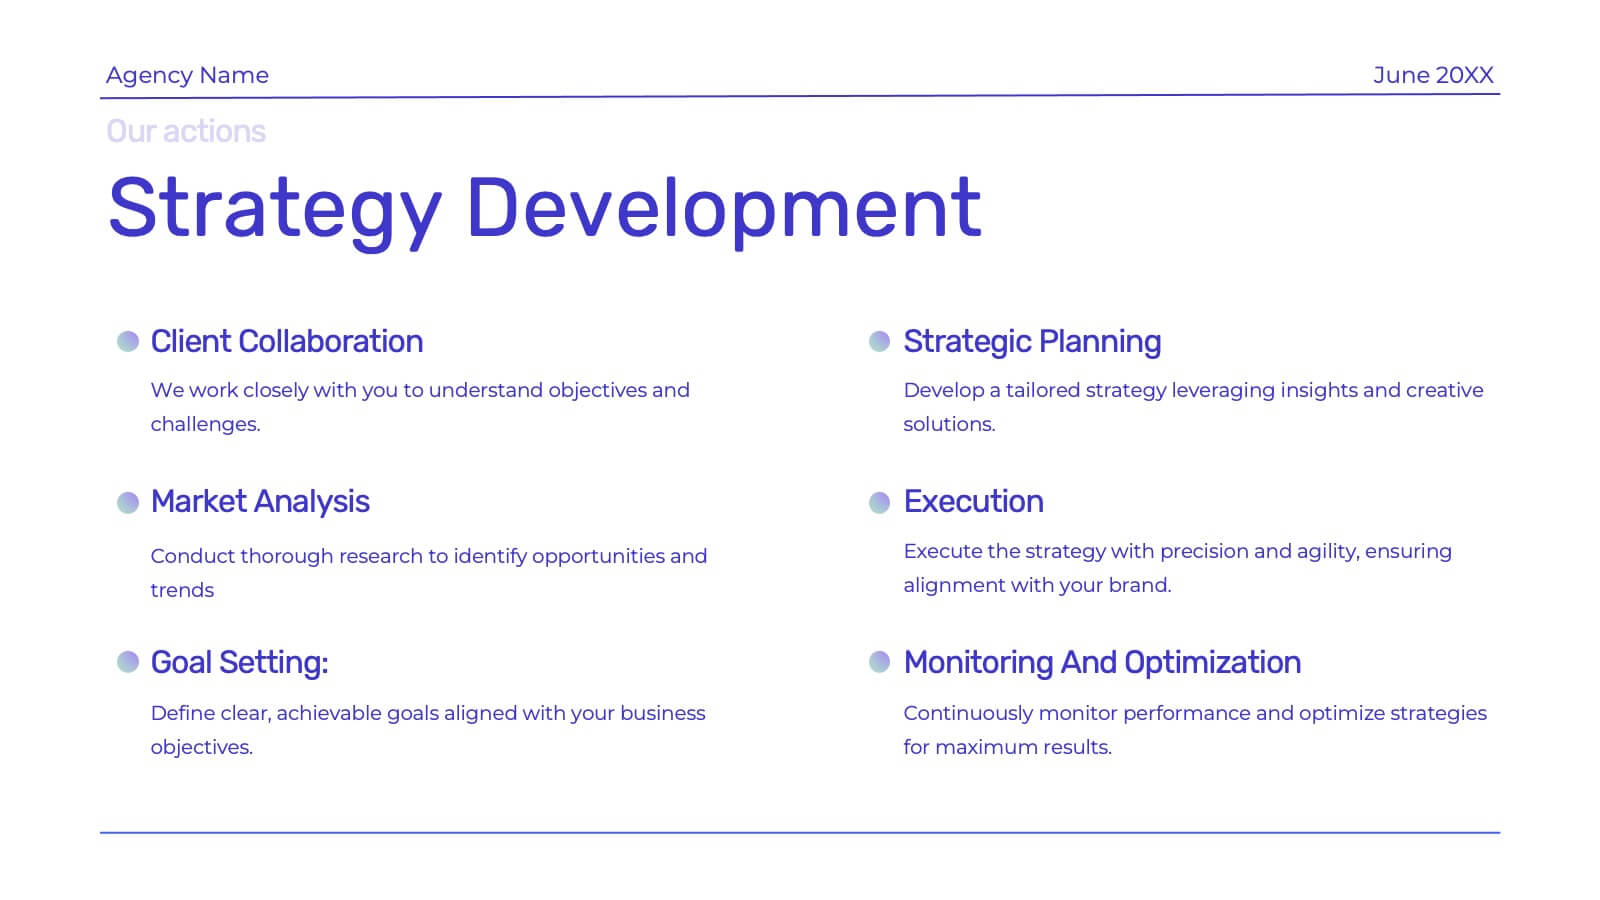
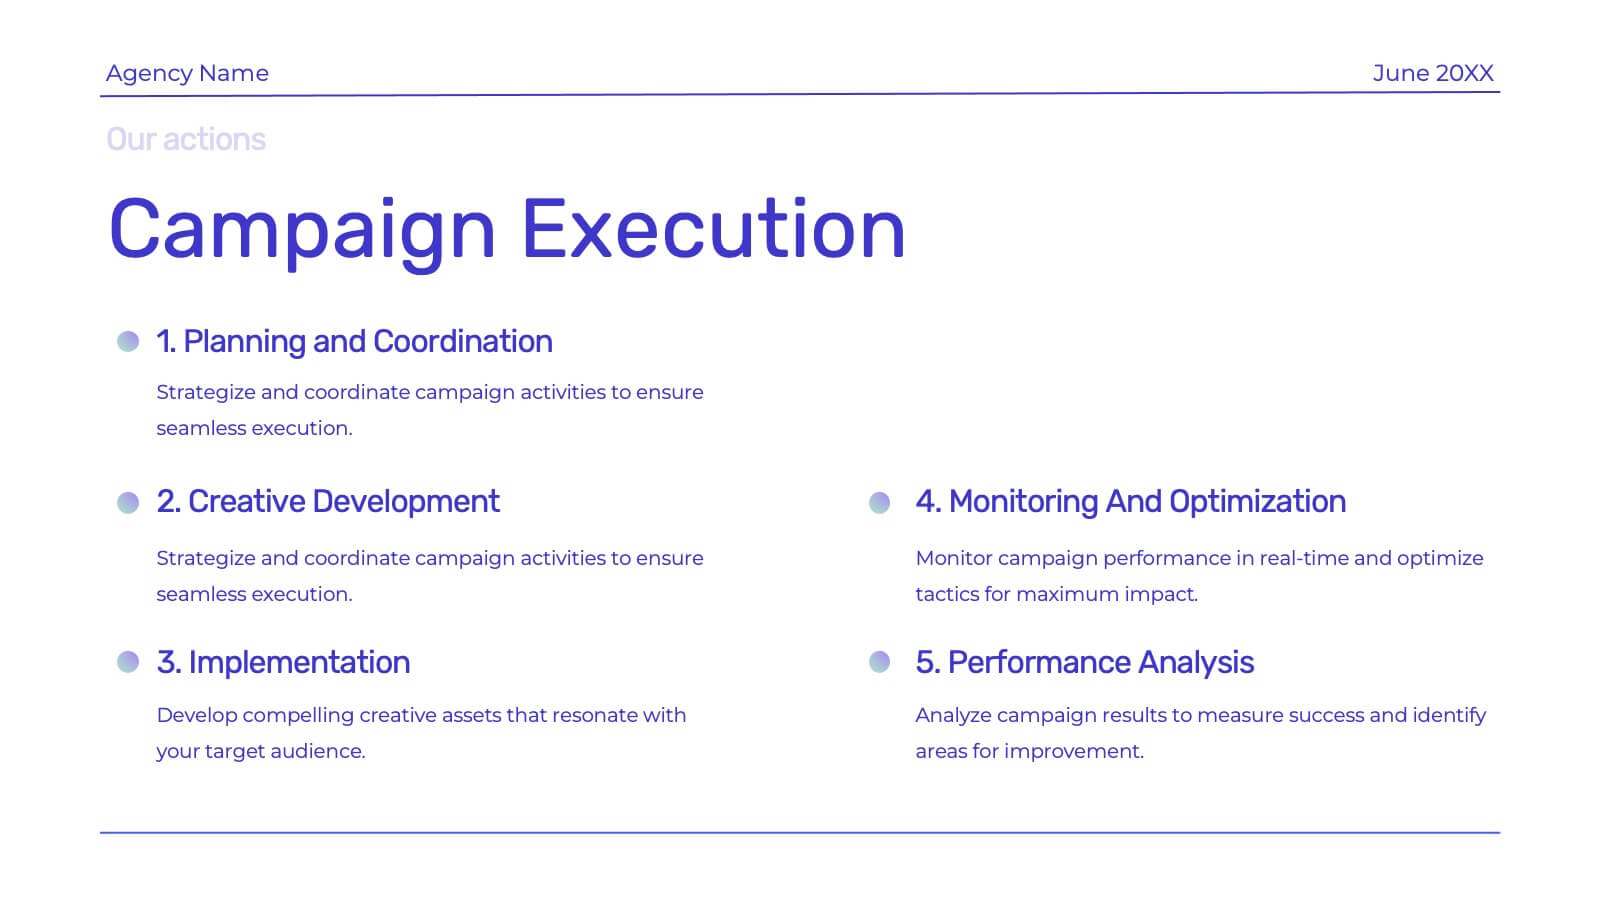
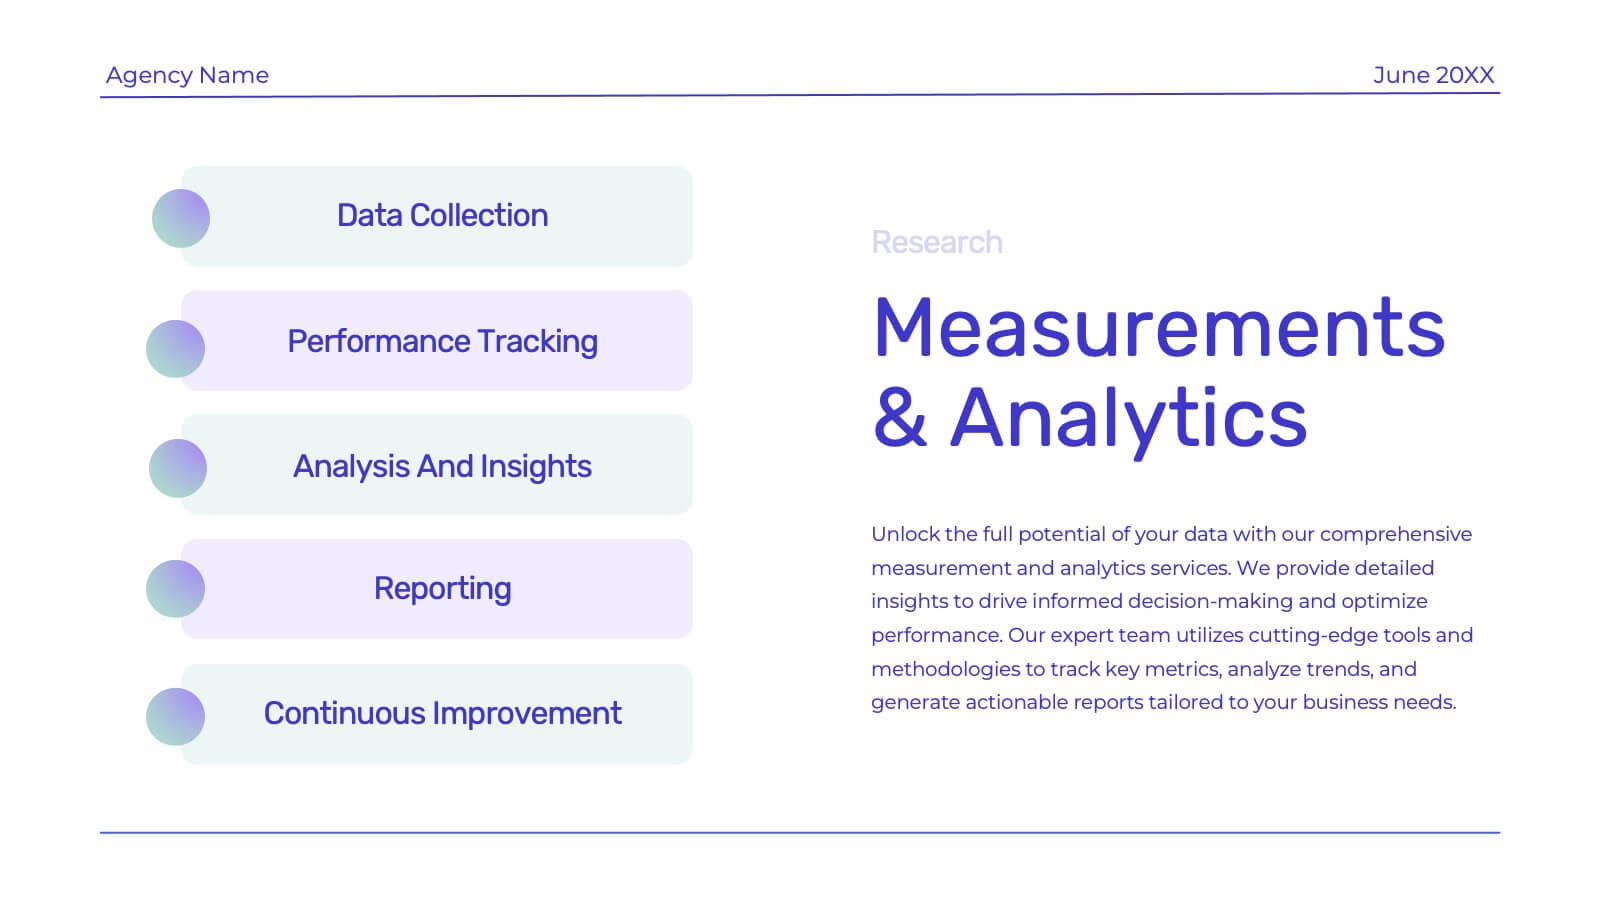
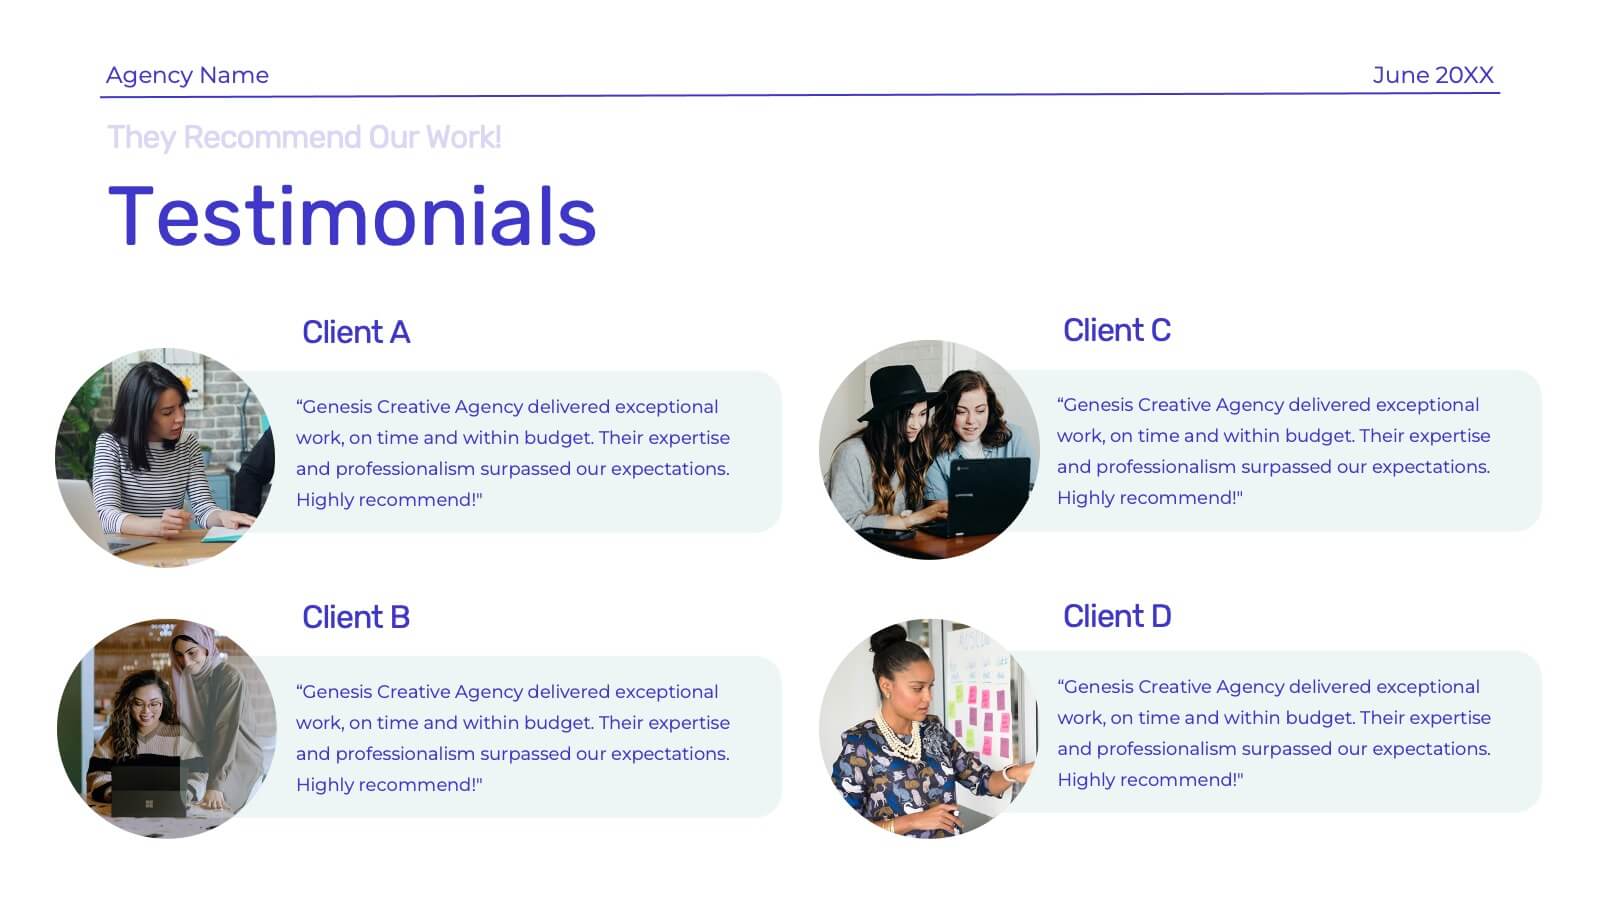
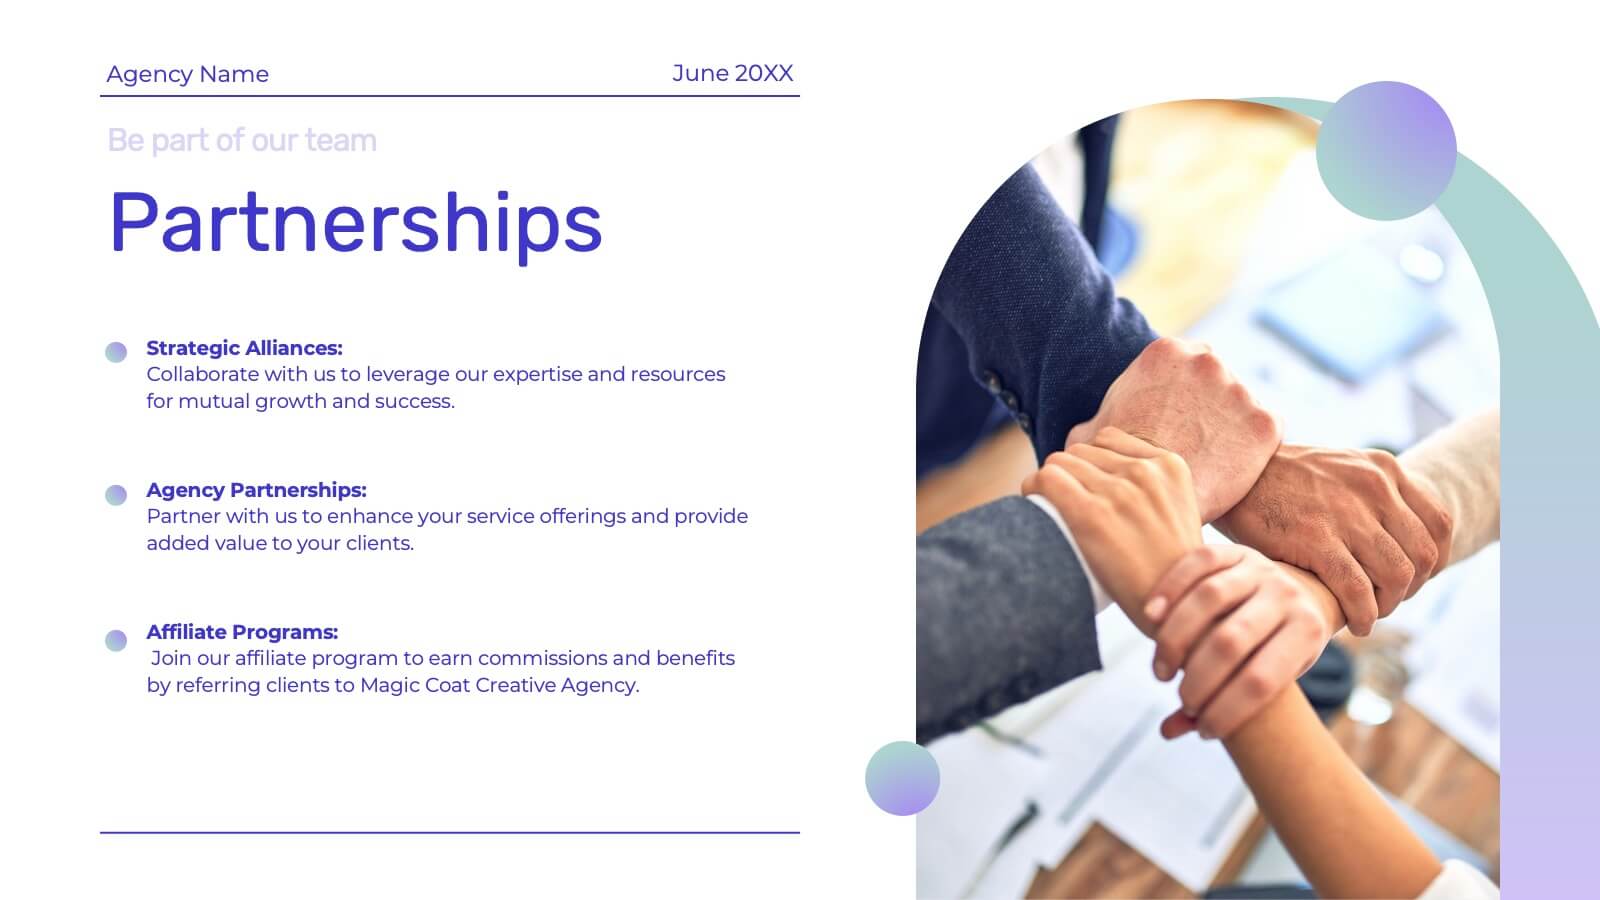
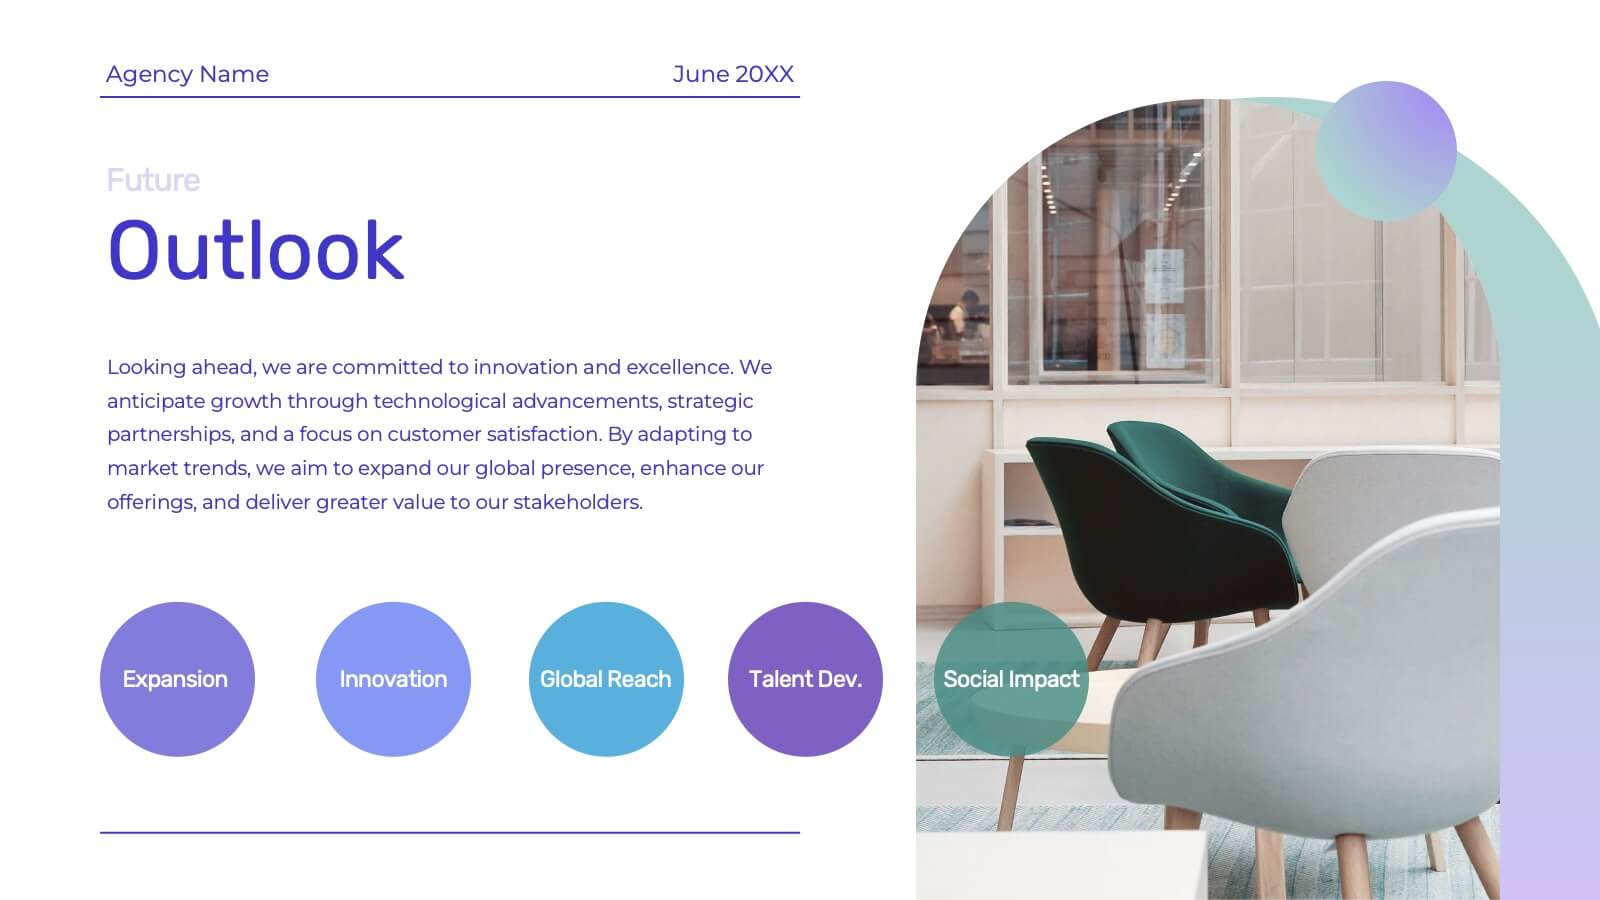
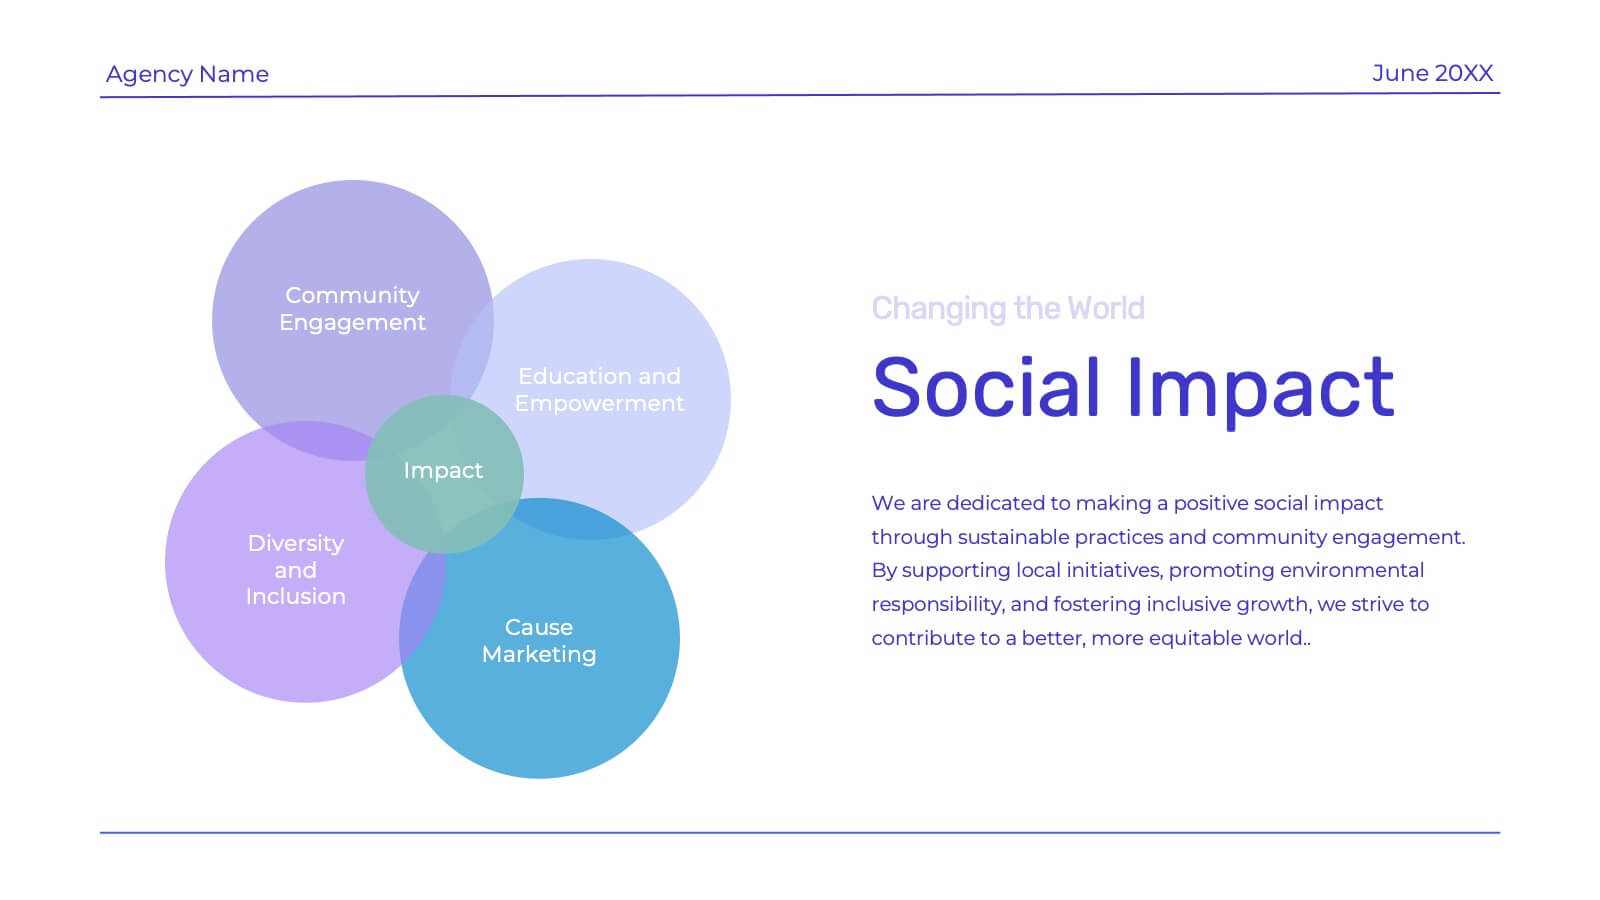
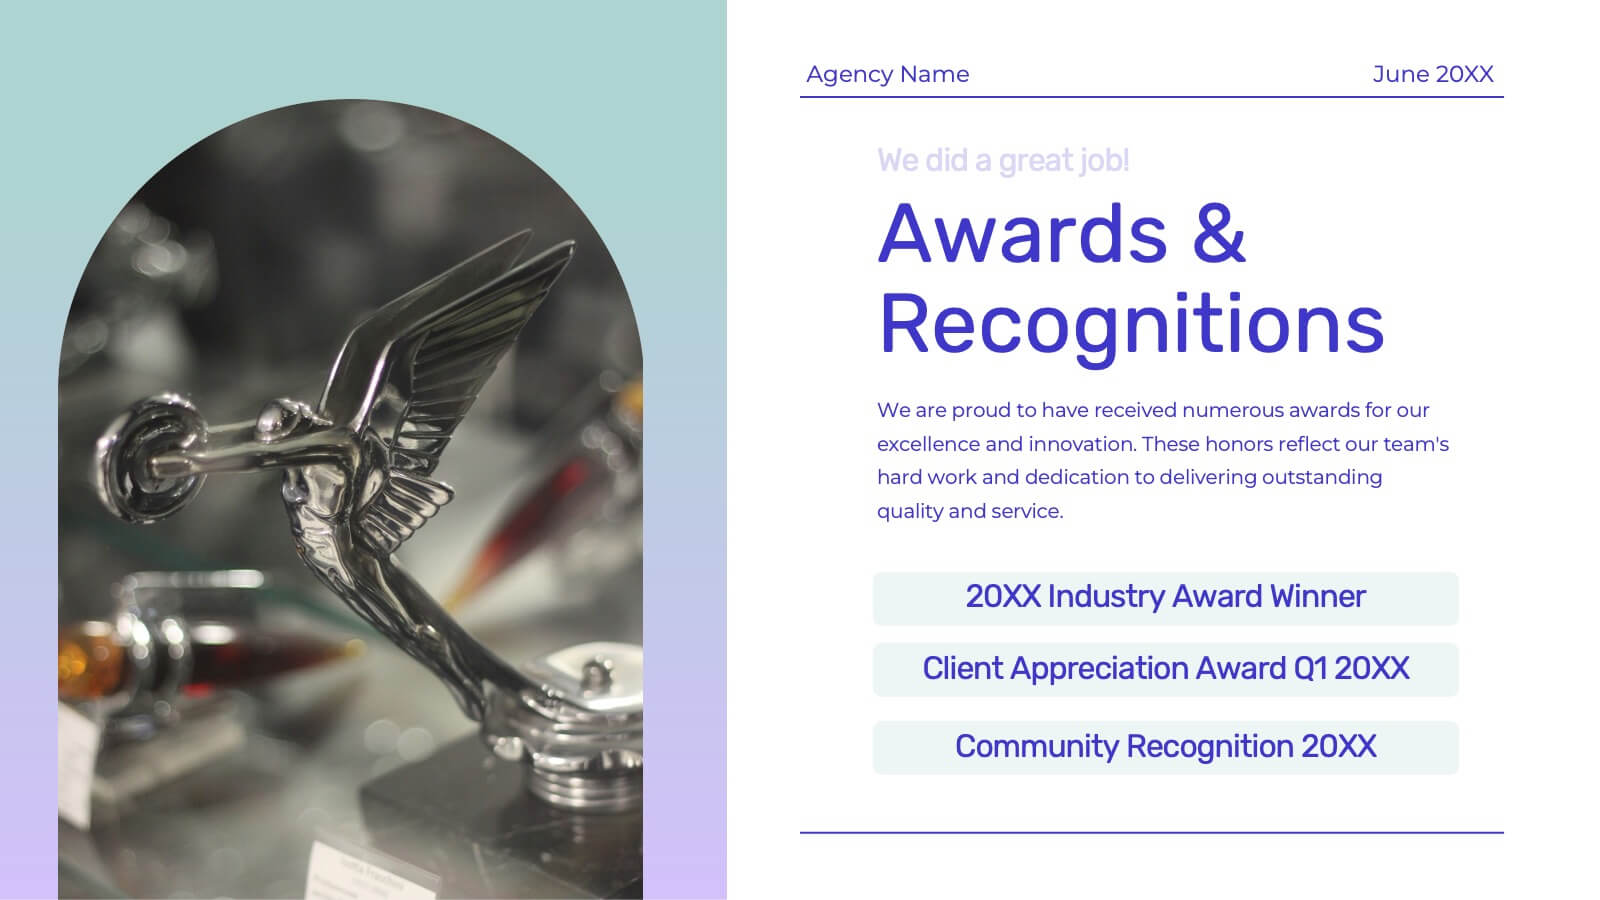
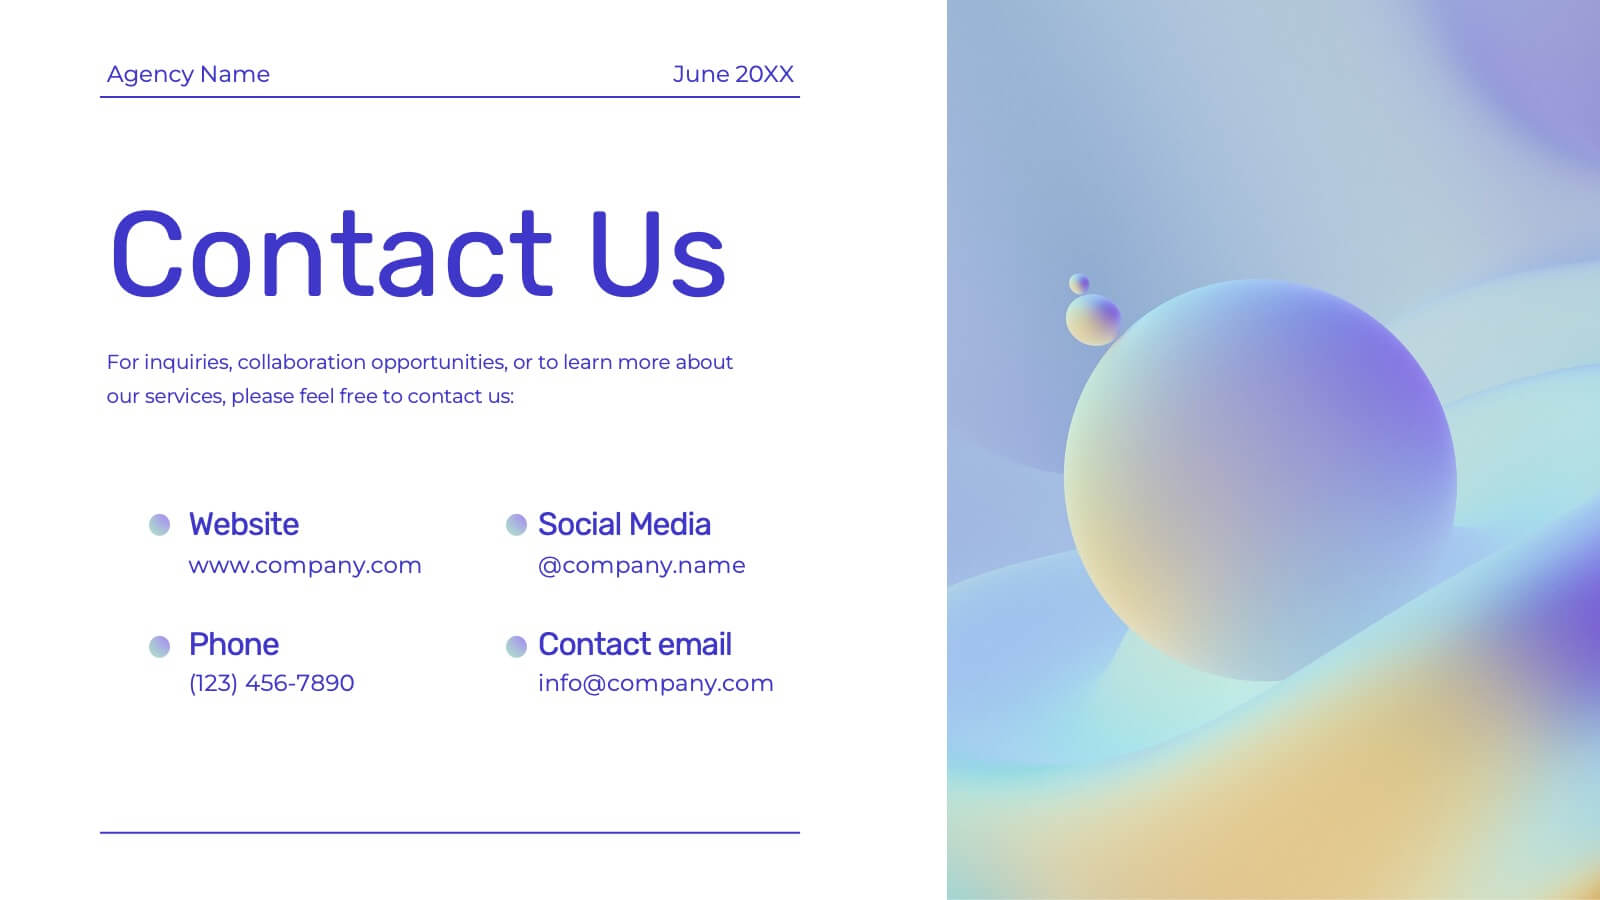
Genesis Creative Agency Pitch Deck Presentation
Showcase your creative agency’s strengths with this vibrant template. Highlight your team, services, success stories, and unique approach. Ideal for case studies, market analysis, and campaign execution. Fully compatible with PowerPoint, Keynote, and Google Slides.


9 diapositivas
Business Dashboard Infographics
A business dashboard, often referred to as a business intelligence dashboard, is a visual representation of an organization's key performance indicators and critical business metrics. Empower your business analysis and strategy with our Infographic. This dynamic template enables you to present key business metrics, performance indicators, and trends in a clear and impactful manner. Compatible with Powerpoint, Keynote, and Google Slides. This template is a powerful tool to visualize your business progress, identify opportunities, and communicate your success story to viewers, clients, or team members.


7 diapositivas
Objective Infographic Presentation Template
Our Objective Infographic template is designed to visually highlight the key points of a business plan and help you get your message across. With this template's simple layout and bold illustration, you can convey the most important parts of your plan in a way that is straightforward and compelling. This infographic template has been created to help you illustrate the key goal of your project. A clear and attractive infographic, this eye-catching template can be used to create interesting informative content. This will captivate your audience and keep them interested in what you have to say.


7 diapositivas
Feedback Control Infographic
Feedback is information, reactions, or comments given to individuals or entities regarding their performance, actions, products, services, or behaviors. This infographic template is an educational odyssey through the world of precision and control, guiding you through the principles and applications of feedback mechanisms. Compatible with Powerpoint, Keynote, and Google Slides. This template displays a target icon with decreasing error rings, illustrating the goal of minimizing errors through feedback control for optimal performance. Display icons representing sensors and actuators, emphasizing their pivotal roles in feedback control systems.


3 diapositivas
Transportation Services Workflow Presentation
Showcase your delivery process with clarity. This template tracks each transportation step—from port to truck to doorstep—with minimal, modern visuals and editable callouts. It’s perfect for workflow overviews, operations planning, or client onboarding. Use it in PowerPoint, Keynote, or Google Slides without losing style or structure.


4 diapositivas
Business Operations Office Theme Presentation
Make your workflow feel effortless with this sleek, illustrated office layout designed to simplify complex business operations. Ideal for presenting processes, responsibilities, or resource planning, the clean visuals and structured format help communicate your message clearly. Fully editable and compatible with PowerPoint, Keynote, and Google Slides for seamless customization.


7 diapositivas
Leadership Principles Infographic Presentation
A Leadership Infographic provides information about leadership principles, practices, and strategies. This template has been designed as a tool for presenting complex leadership concepts and ideas, using visual elements such as icons, charts, and diagrams. This infographics can be used to cover a wide range of topics related to leadership, including leadership styles, communication, decision-making, team building, and problem-solving. Use the text boxes and charts to provide information on the qualities and skills of effective leaders, such as empathy, vision, and strategic thinking.


4 diapositivas
Employee Performance Feedback
Showcase progress clearly with this Employee Performance Feedback presentation. Featuring skill-based metrics, productivity scores, and analysis ratings, this layout uses visual data bars to evaluate team performance at a glance. Perfect for HR reviews, team assessments, or quarterly check-ins. Fully editable in PowerPoint, Keynote, and Google Slides.


7 diapositivas
Digital Marketing Infographic
Digital marketing refers to the use of digital channels, such as the internet, social media, search engines, email, and mobile devices, to promote products, services, and brands. This infographic showcases key concepts and strategies in the field of digital marketing. It is designed to help businesses and marketers effectively communicate and educate their audience about the various aspects of digital marketing. This template can be used to cover a wide range of digital marketing topics, including social media marketing, search engine optimization, content marketing, email marketing, paid advertising, analytics, and more.


2 diapositivas
Elegant Thank You Slide
Leave a lasting impression with this modern and refined thank-you slide. Designed with clean lines, professional typography, and an image placeholder to showcase your team, workspace, or branding. Ideal for closing business decks and project presentations. Compatible with PowerPoint, Keynote, and Google Slides.


21 diapositivas
Frostfire Agile Project Plan Presentation
The Agile Project Plan Presentation Template features 21 cohesive slides including timelines, objectives, stakeholder analysis, and budget breakdowns. Its modern brown and lavender design ensures clarity and professionalism. Perfect for project managers and teams, it’s fully customizable and compatible with PowerPoint, Keynote, and Google Slides for seamless collaboration and presentations.


4 diapositivas
Value Innovation with Blue Ocean Strategy Presentation
Showcase the balance between value creation and innovation using this dual puzzle layout. Perfect for comparing customer benefits and strategic actions side by side. Each piece is icon-supported for clarity and visual appeal. Fully editable in PowerPoint, Keynote, and Google Slides—ideal for strategy, business development, or executive briefings.


4 diapositivas
Innovative Business Solution Strategy
Present fresh, impactful ideas with this innovative business solution strategy slide. Featuring a creative lightbulb design, this template helps you showcase strategic solutions, key initiatives, or breakthrough concepts in a visually organized way. Perfect for startups, innovation workshops, and business growth meetings. Fully editable and compatible with PowerPoint, Keynote, and Google Slides.


6 diapositivas
Demographic Data Analysis
Visualize key population insights with this Demographic Data Analysis slide, designed as a segmented pie chart with icon-based representation. Perfect for showcasing audience breakdowns, customer profiles, or survey results across five demographic categories. Fully editable in PowerPoint, Keynote, and Google Slides.

23 diapositivas
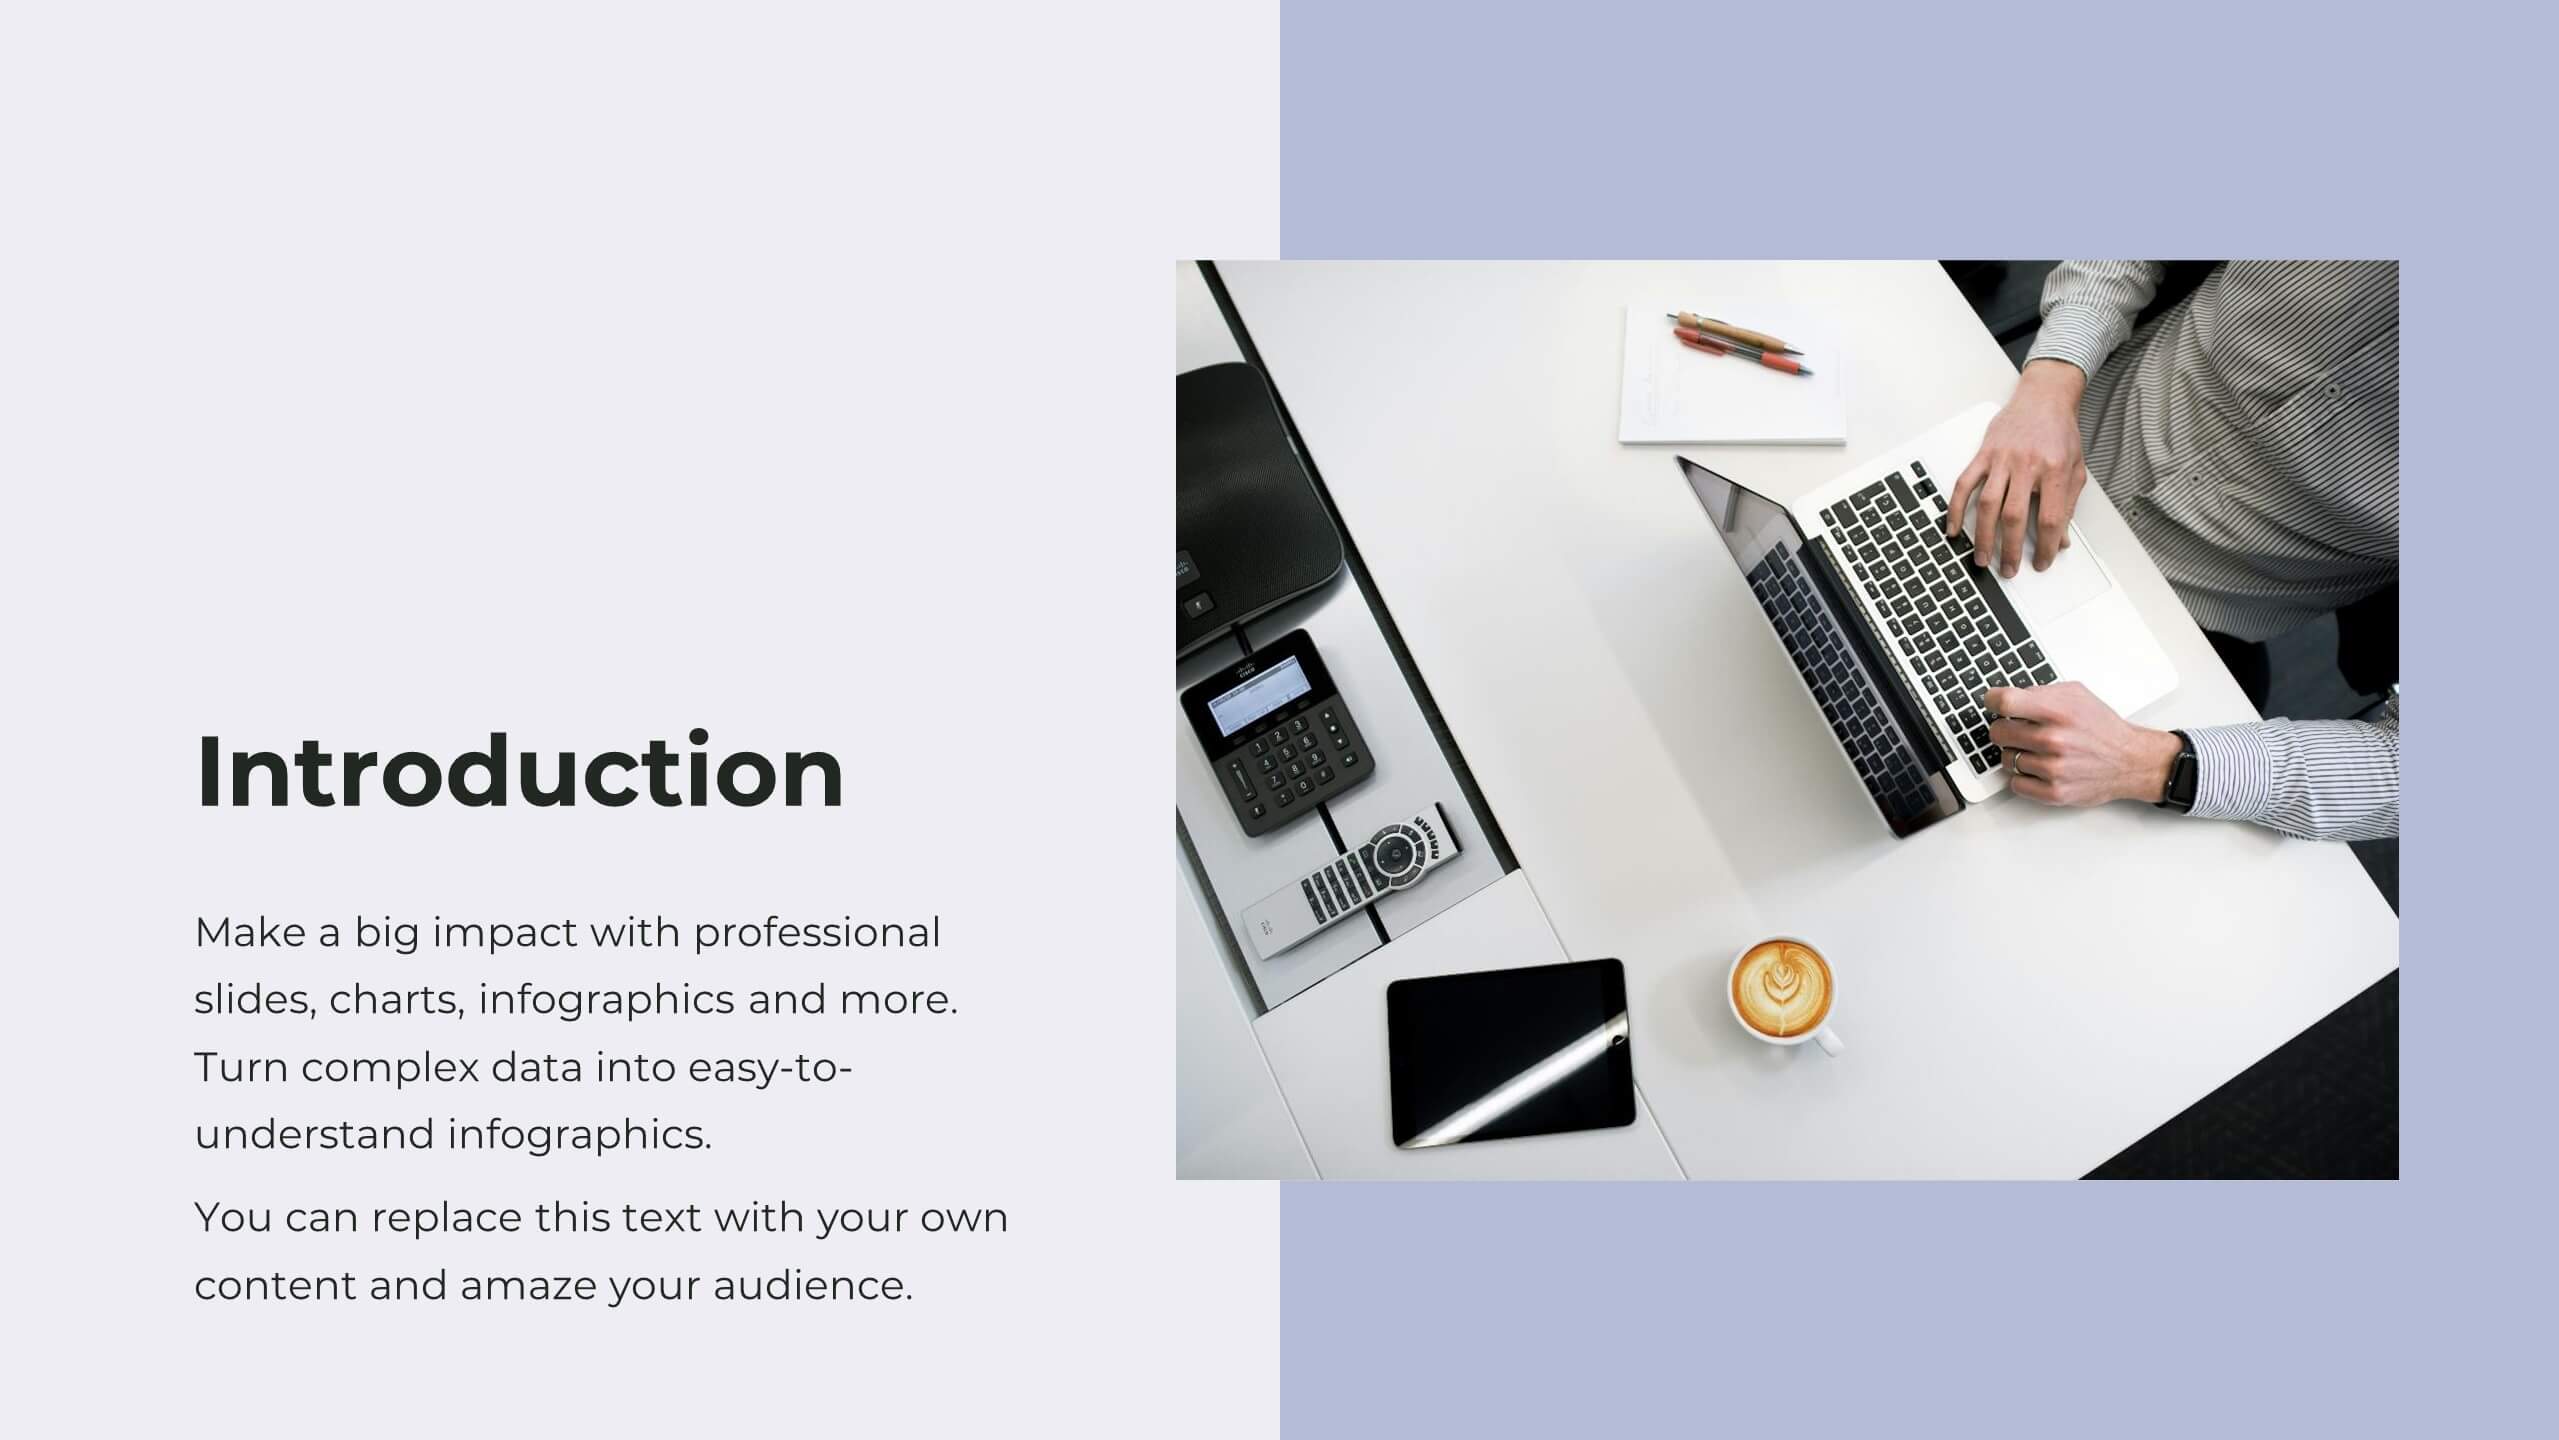
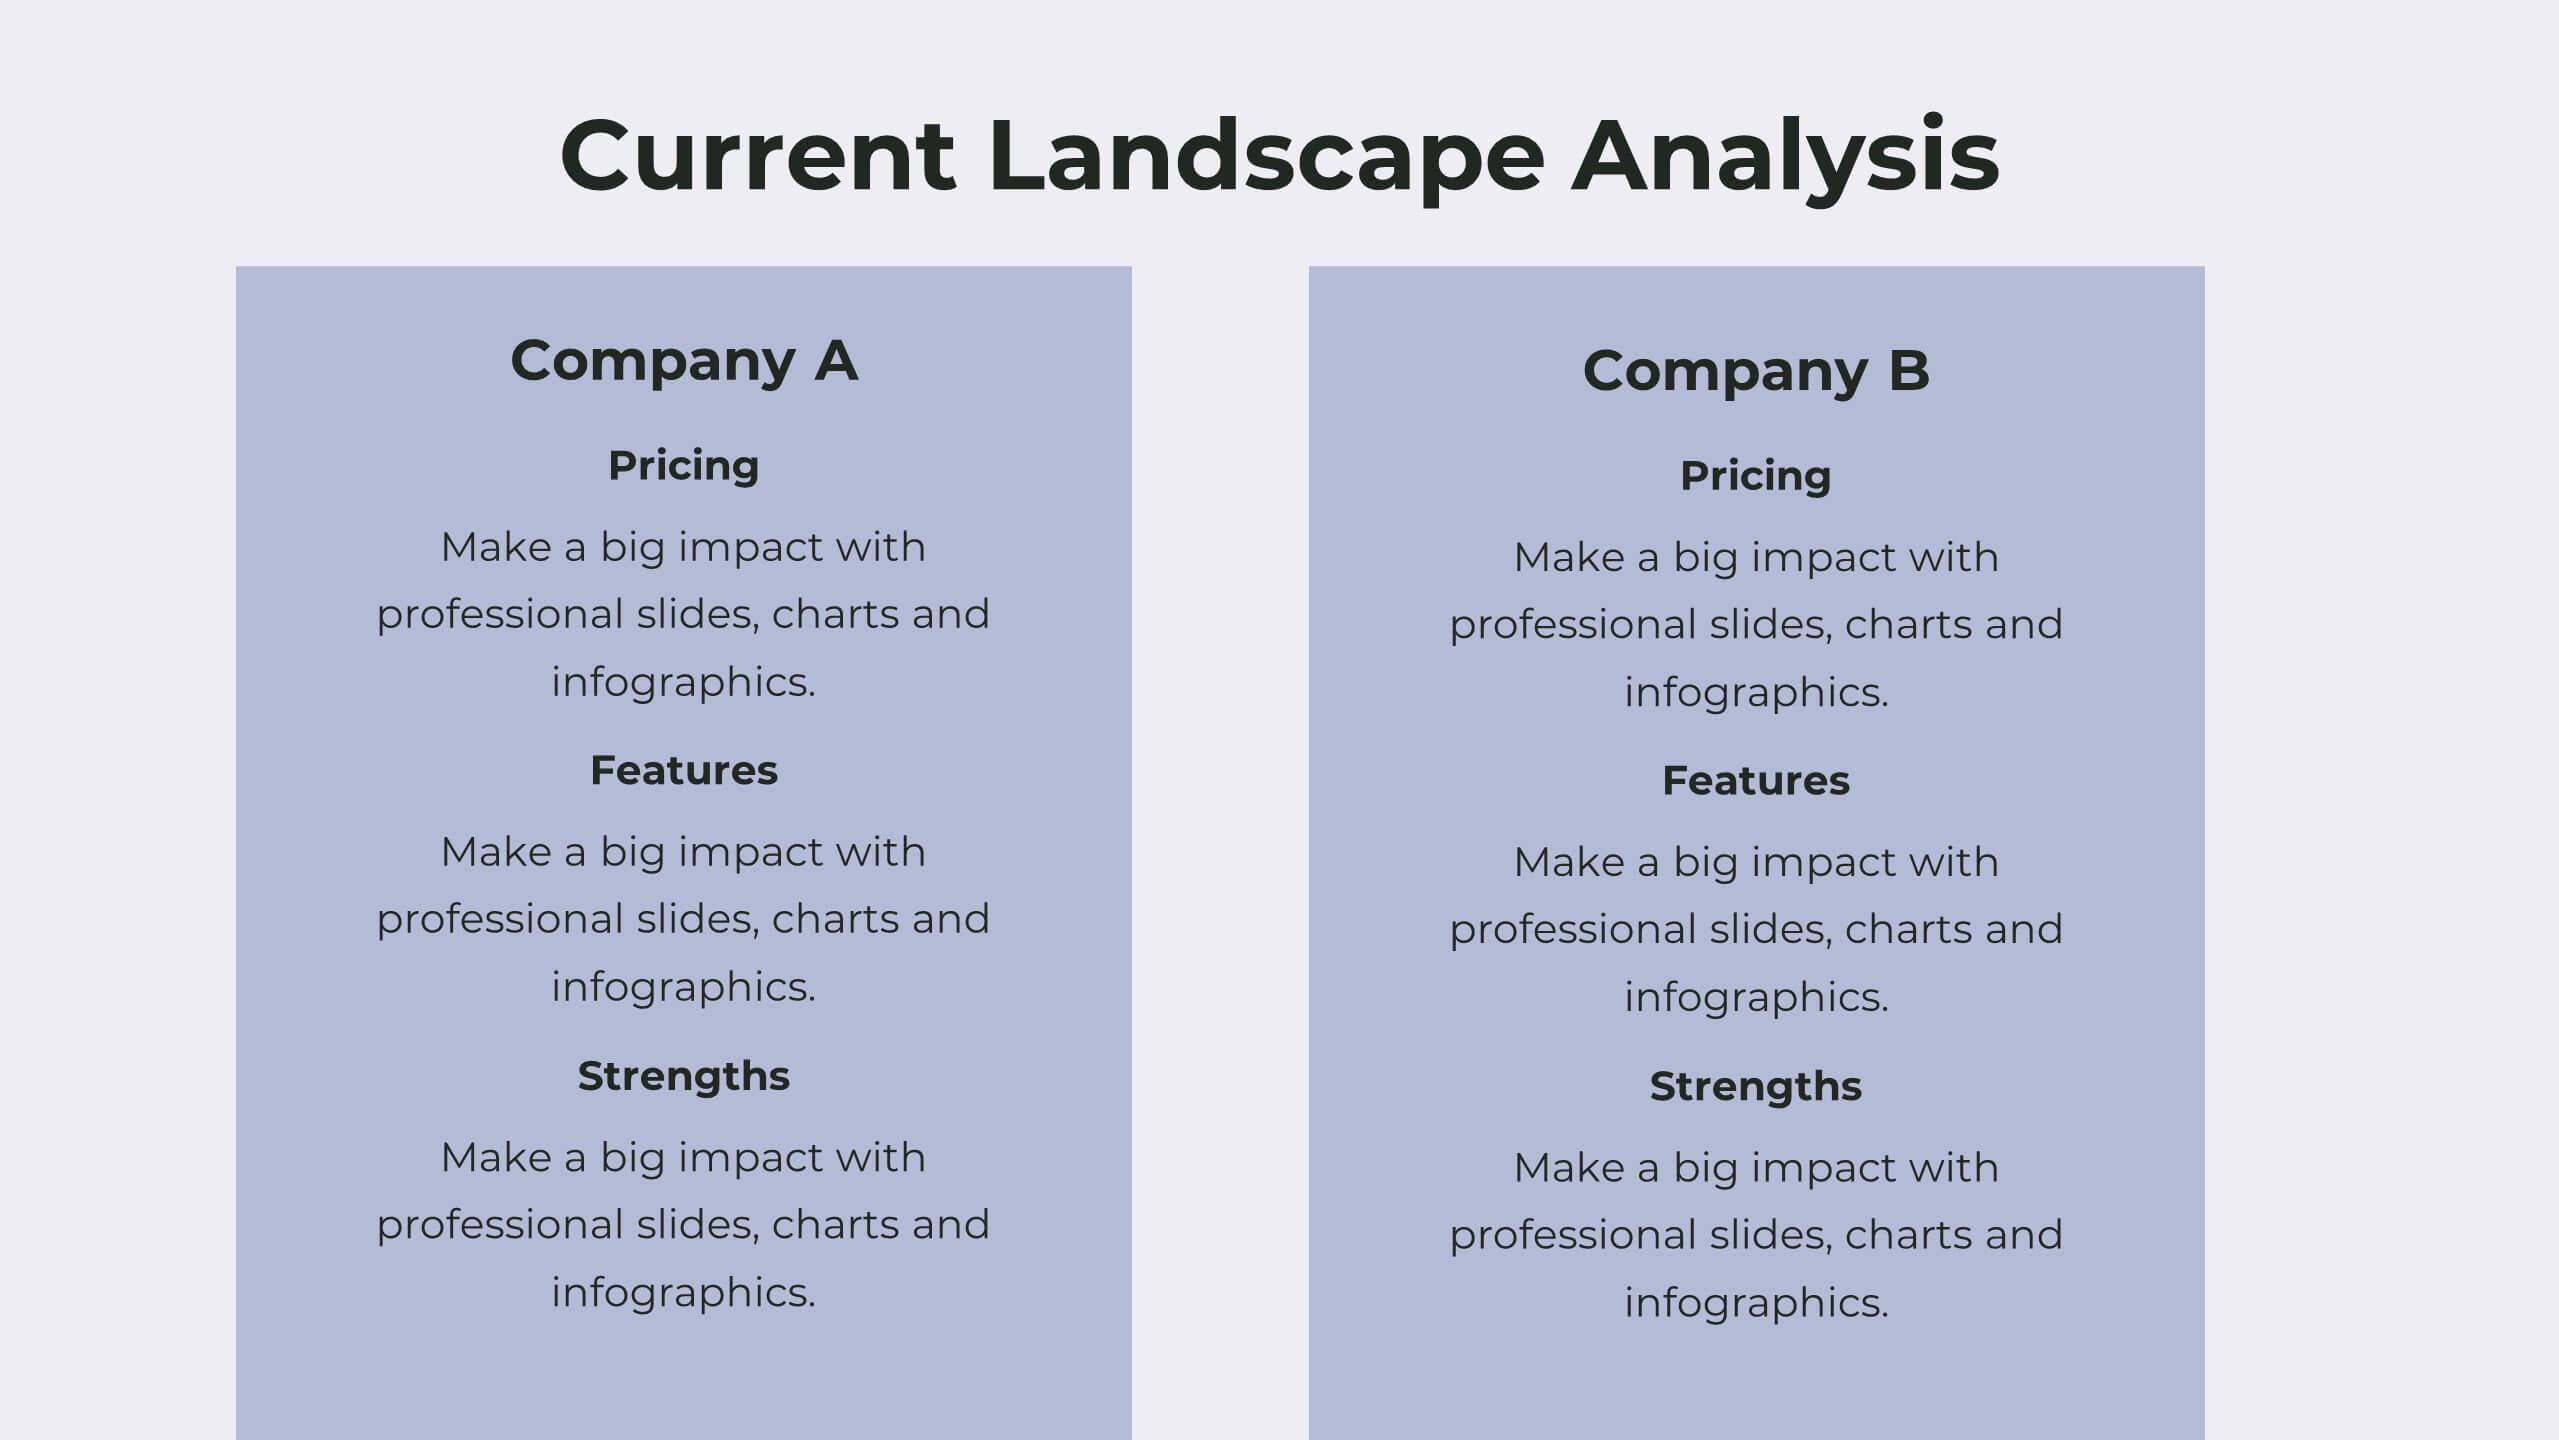
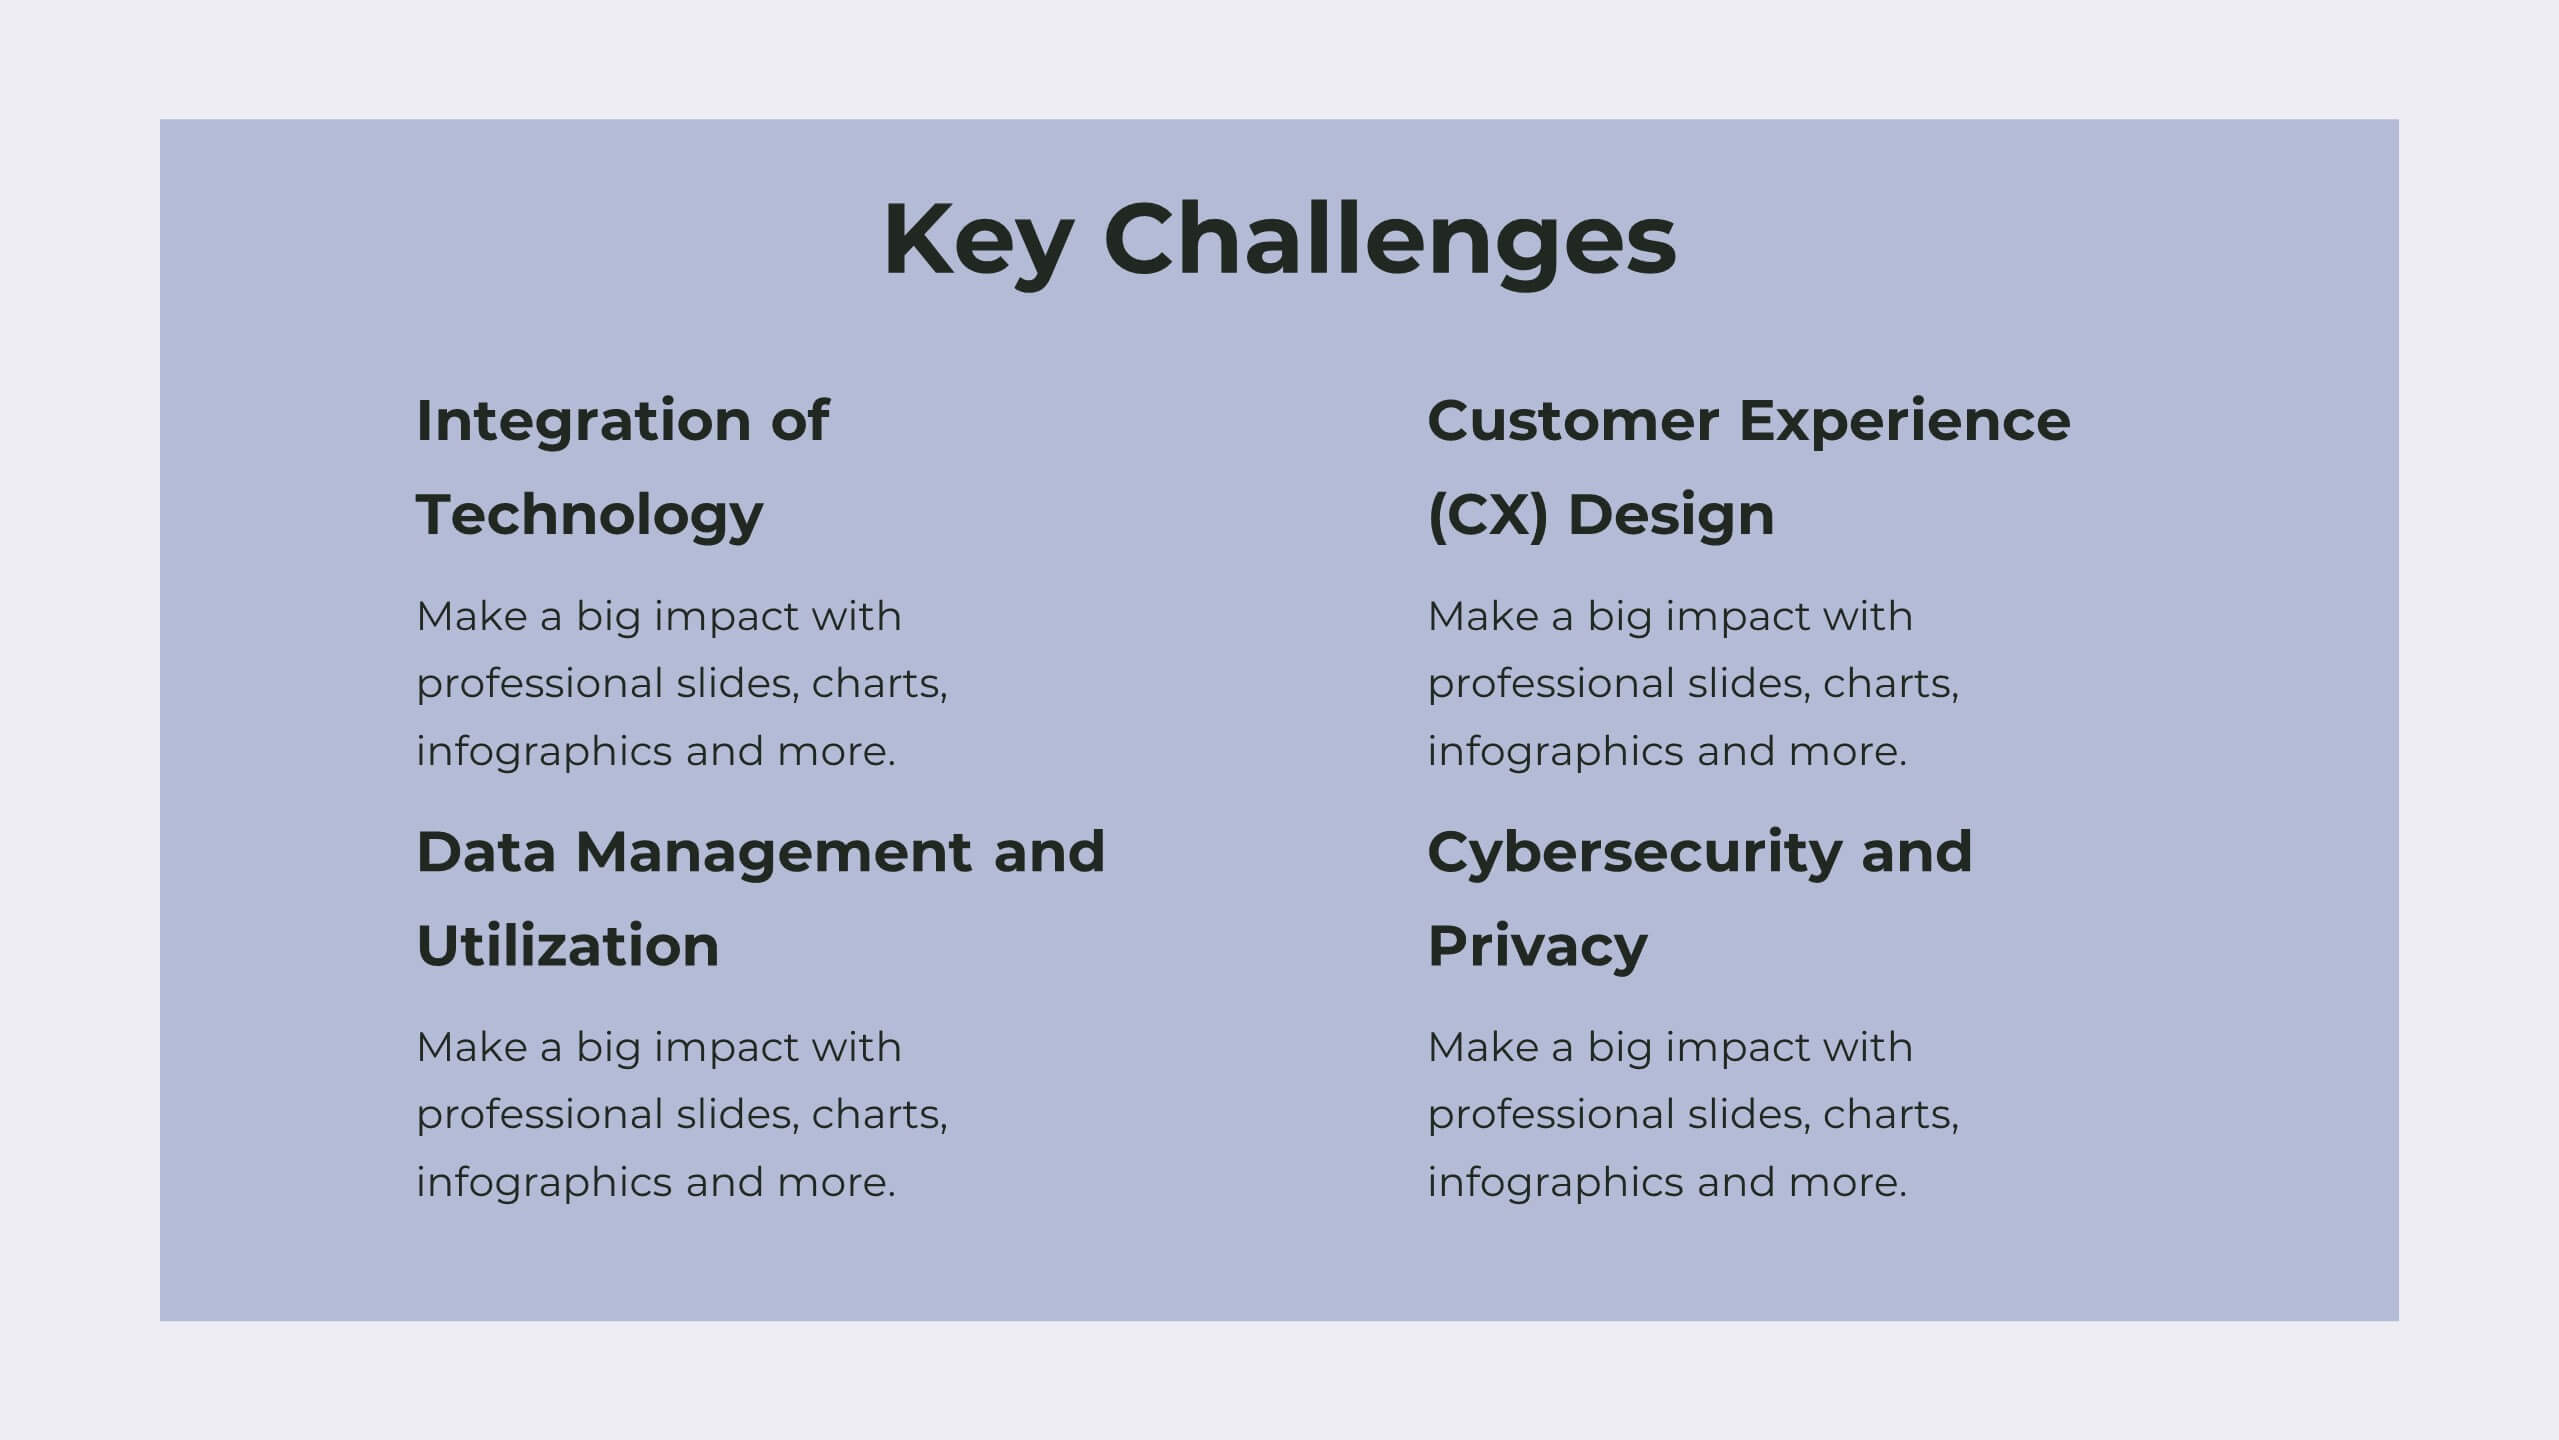
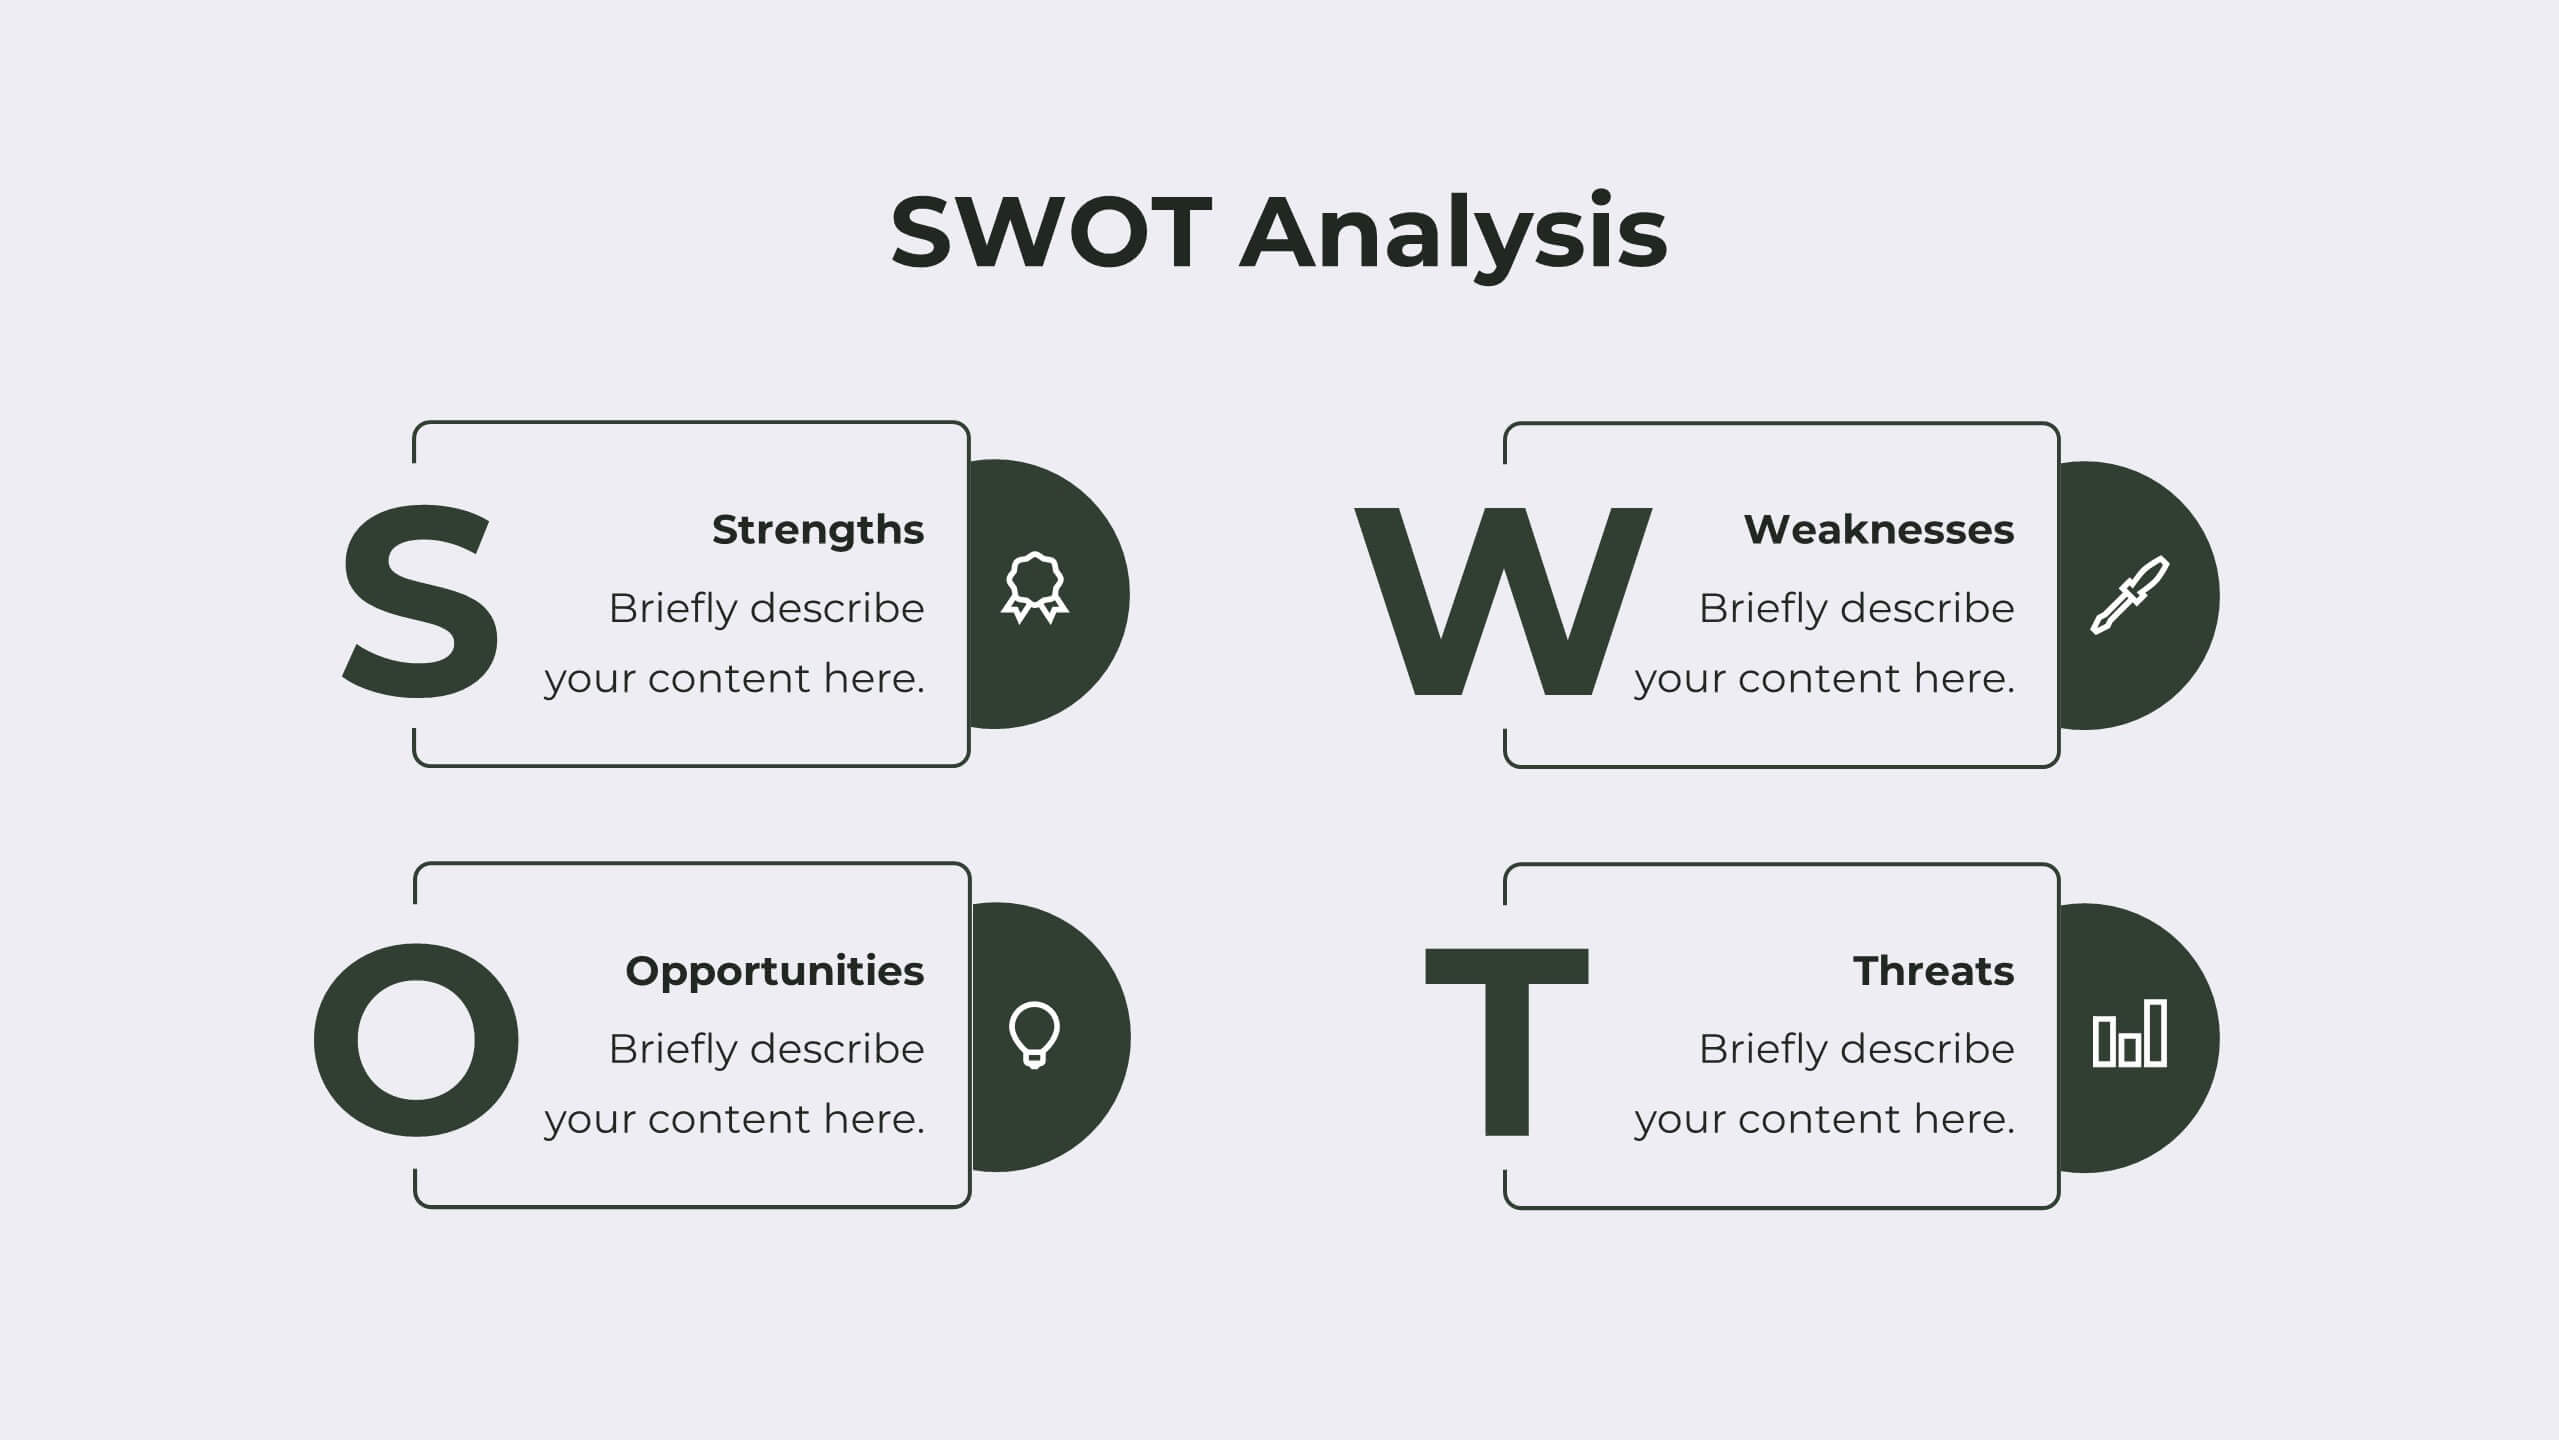
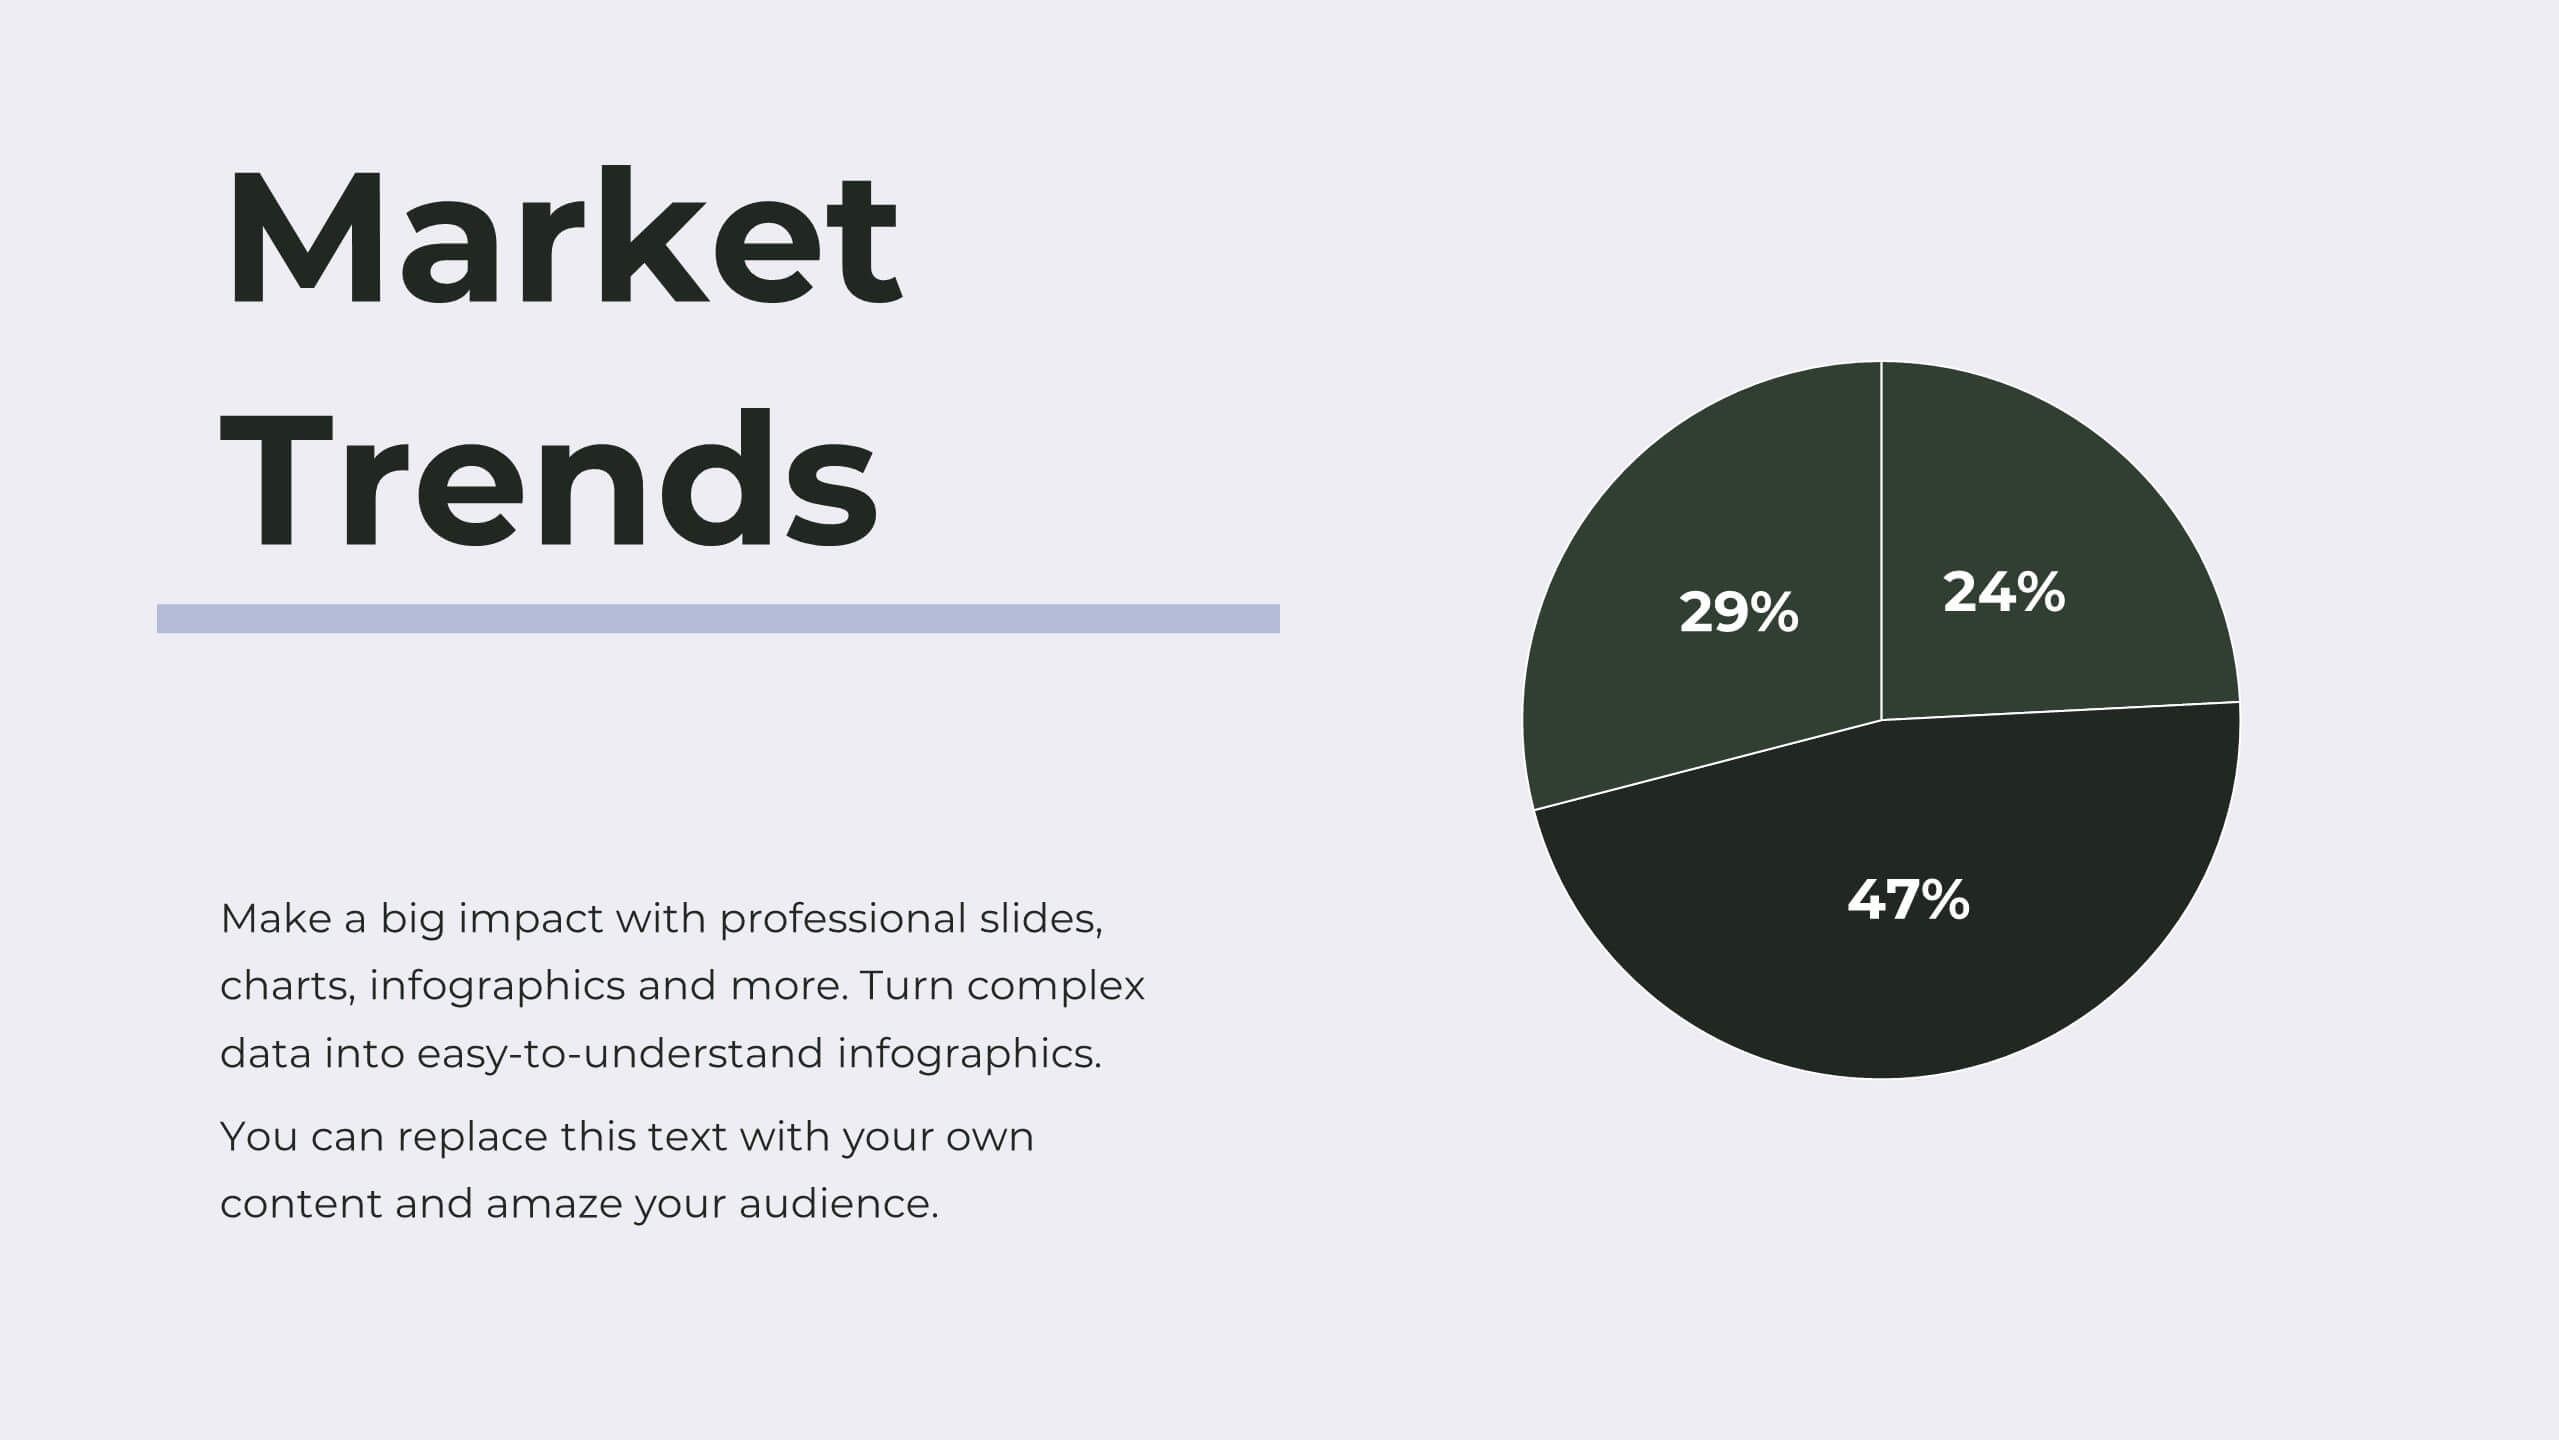
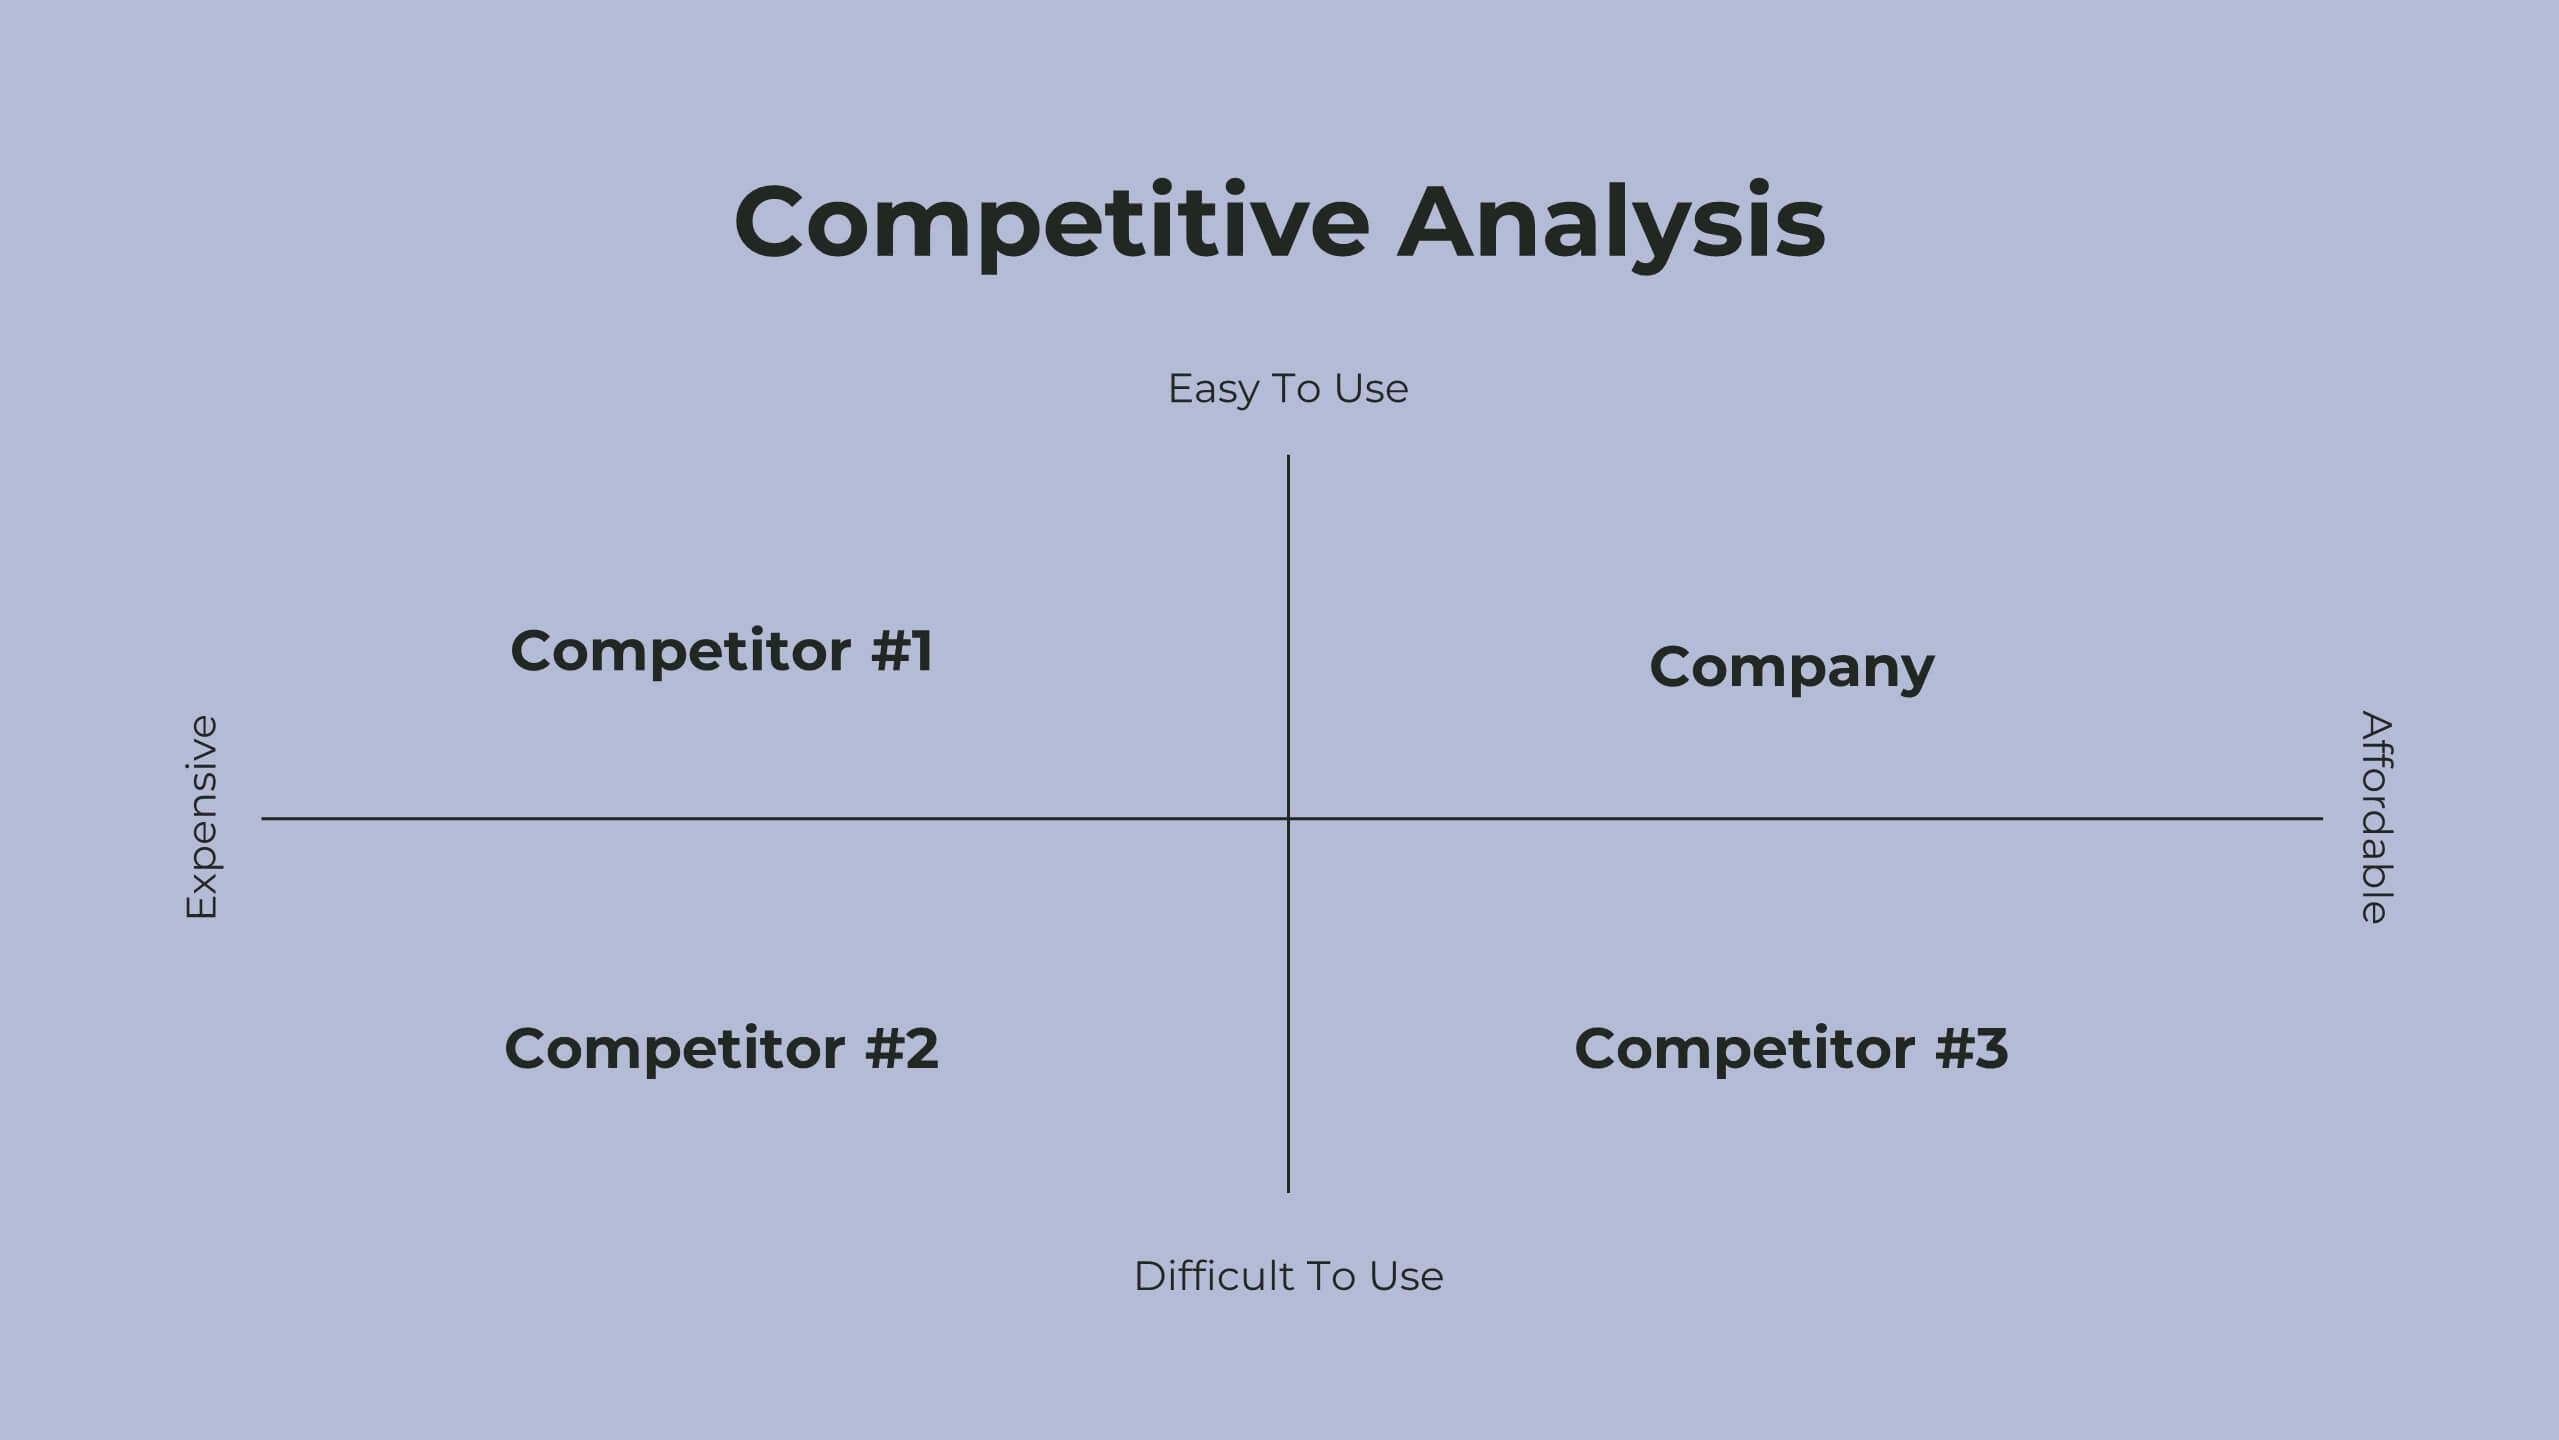
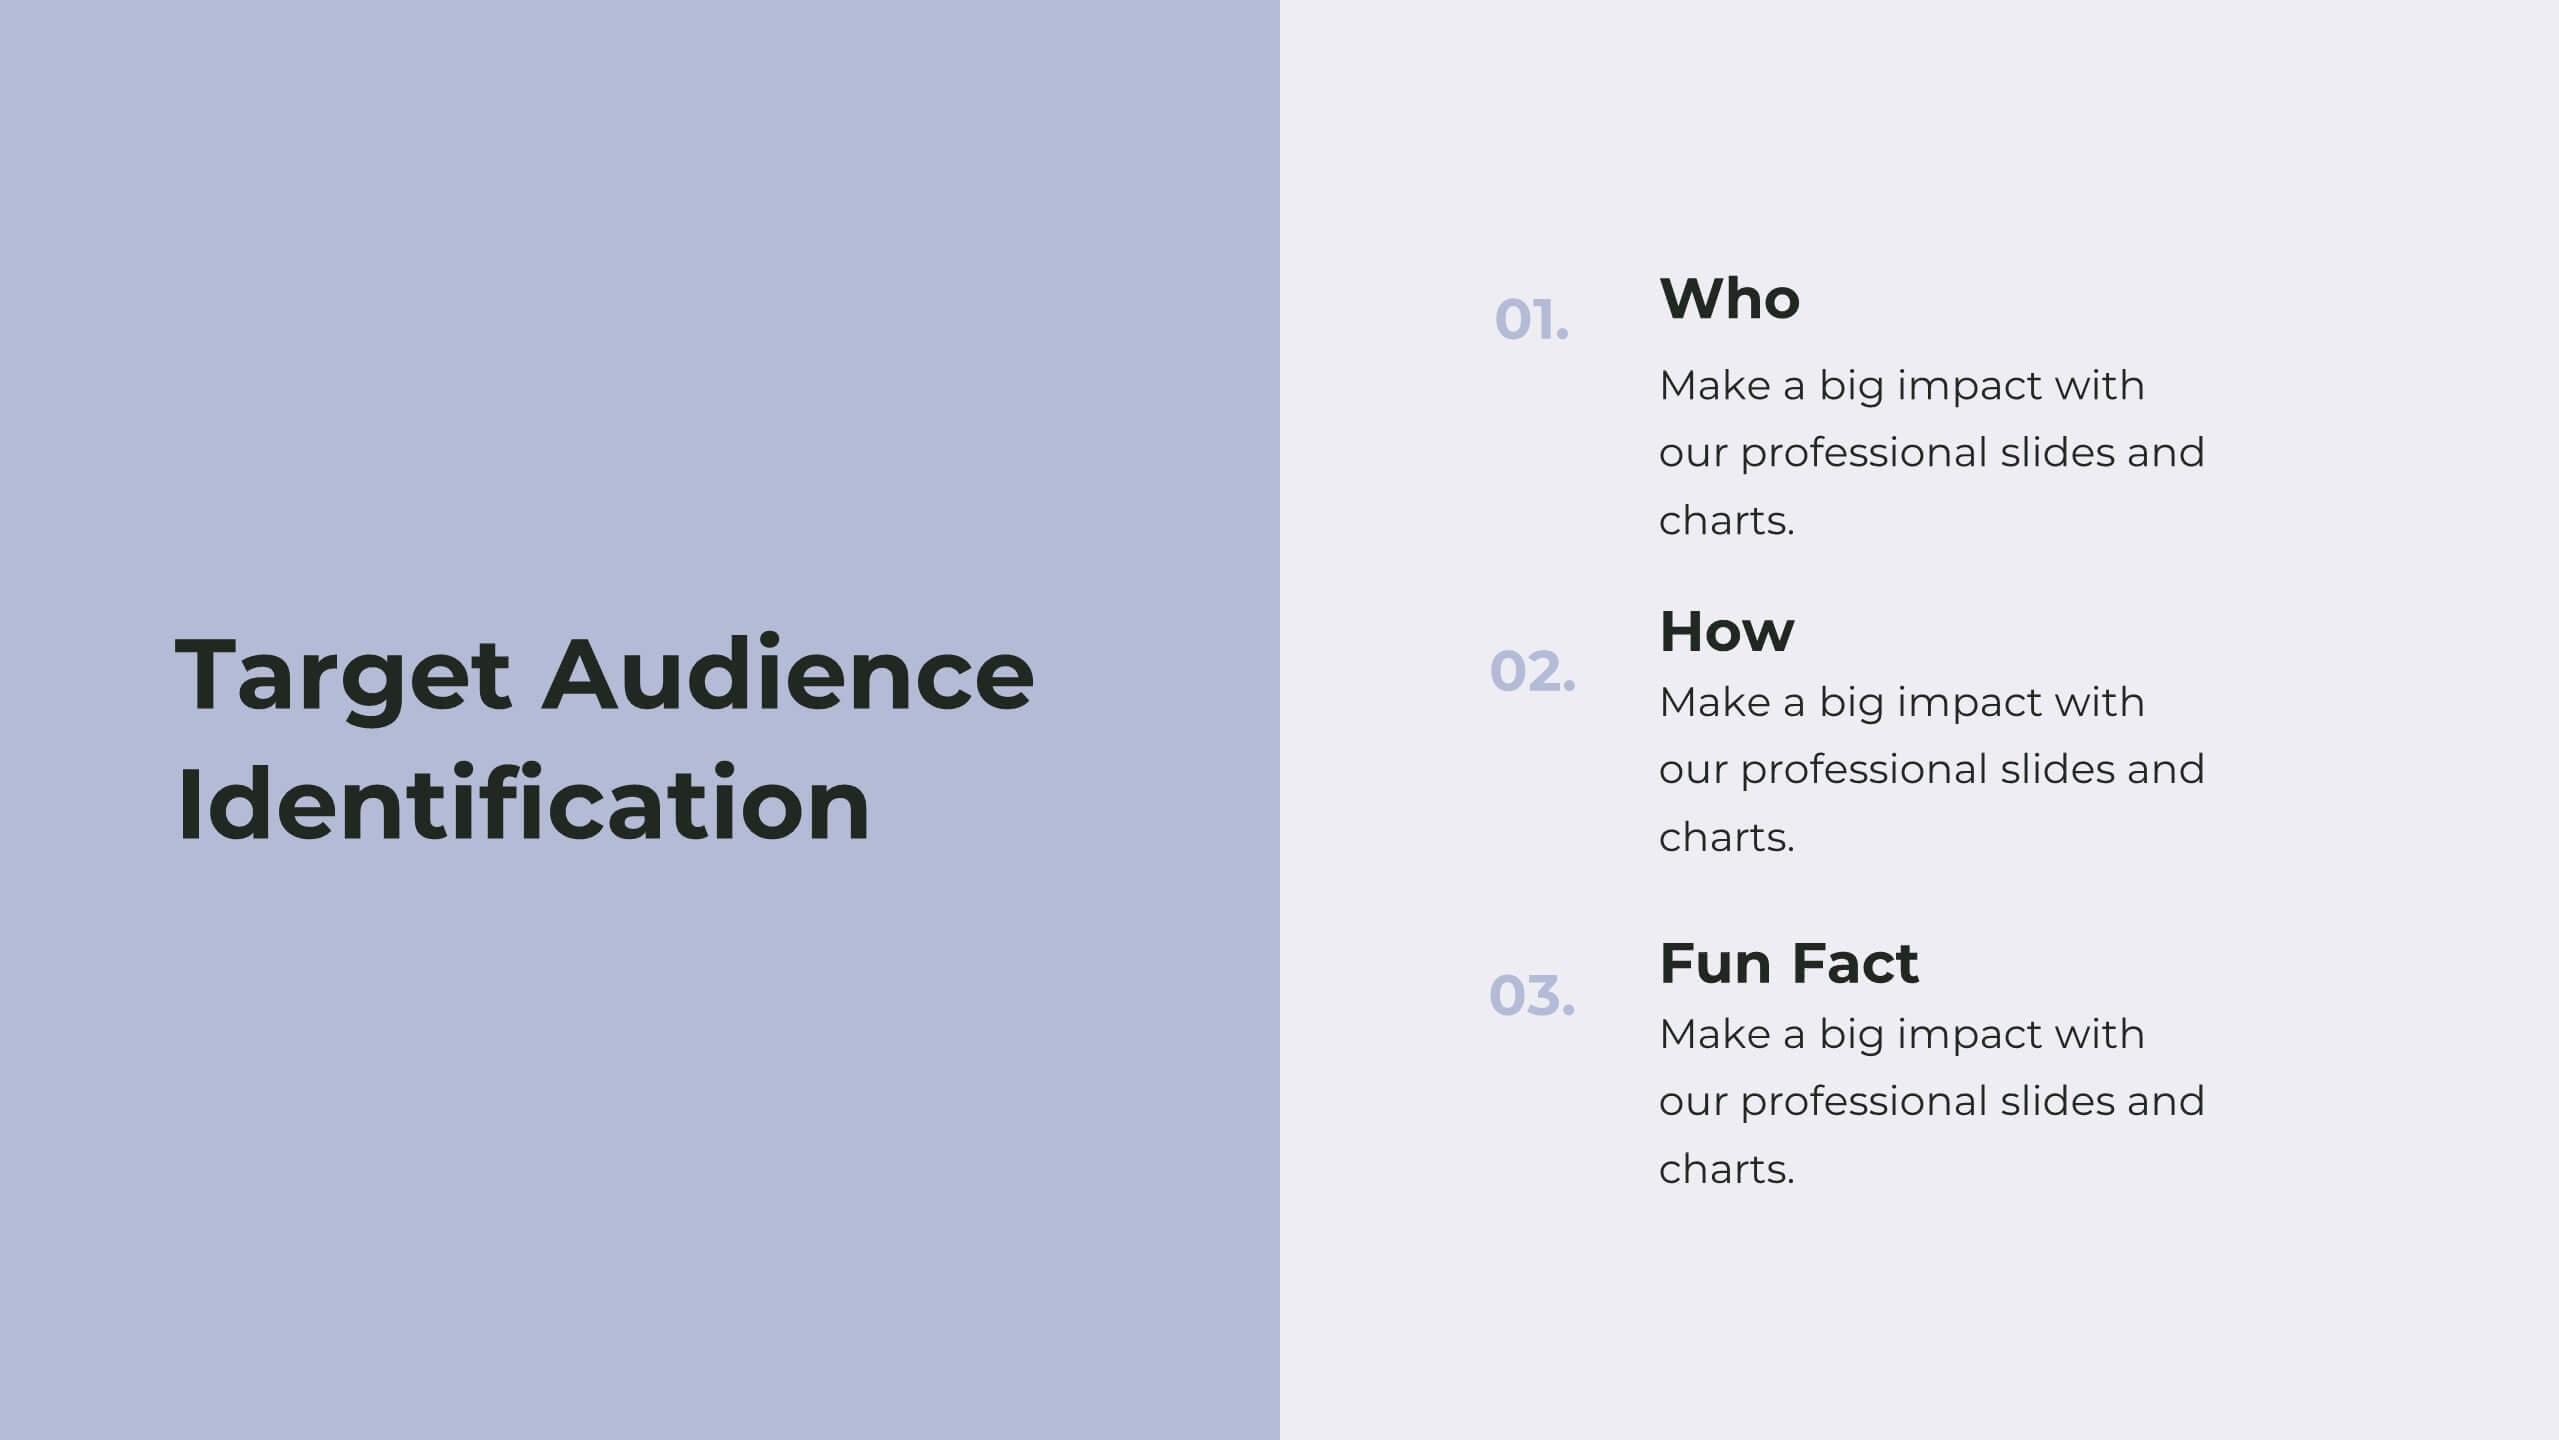
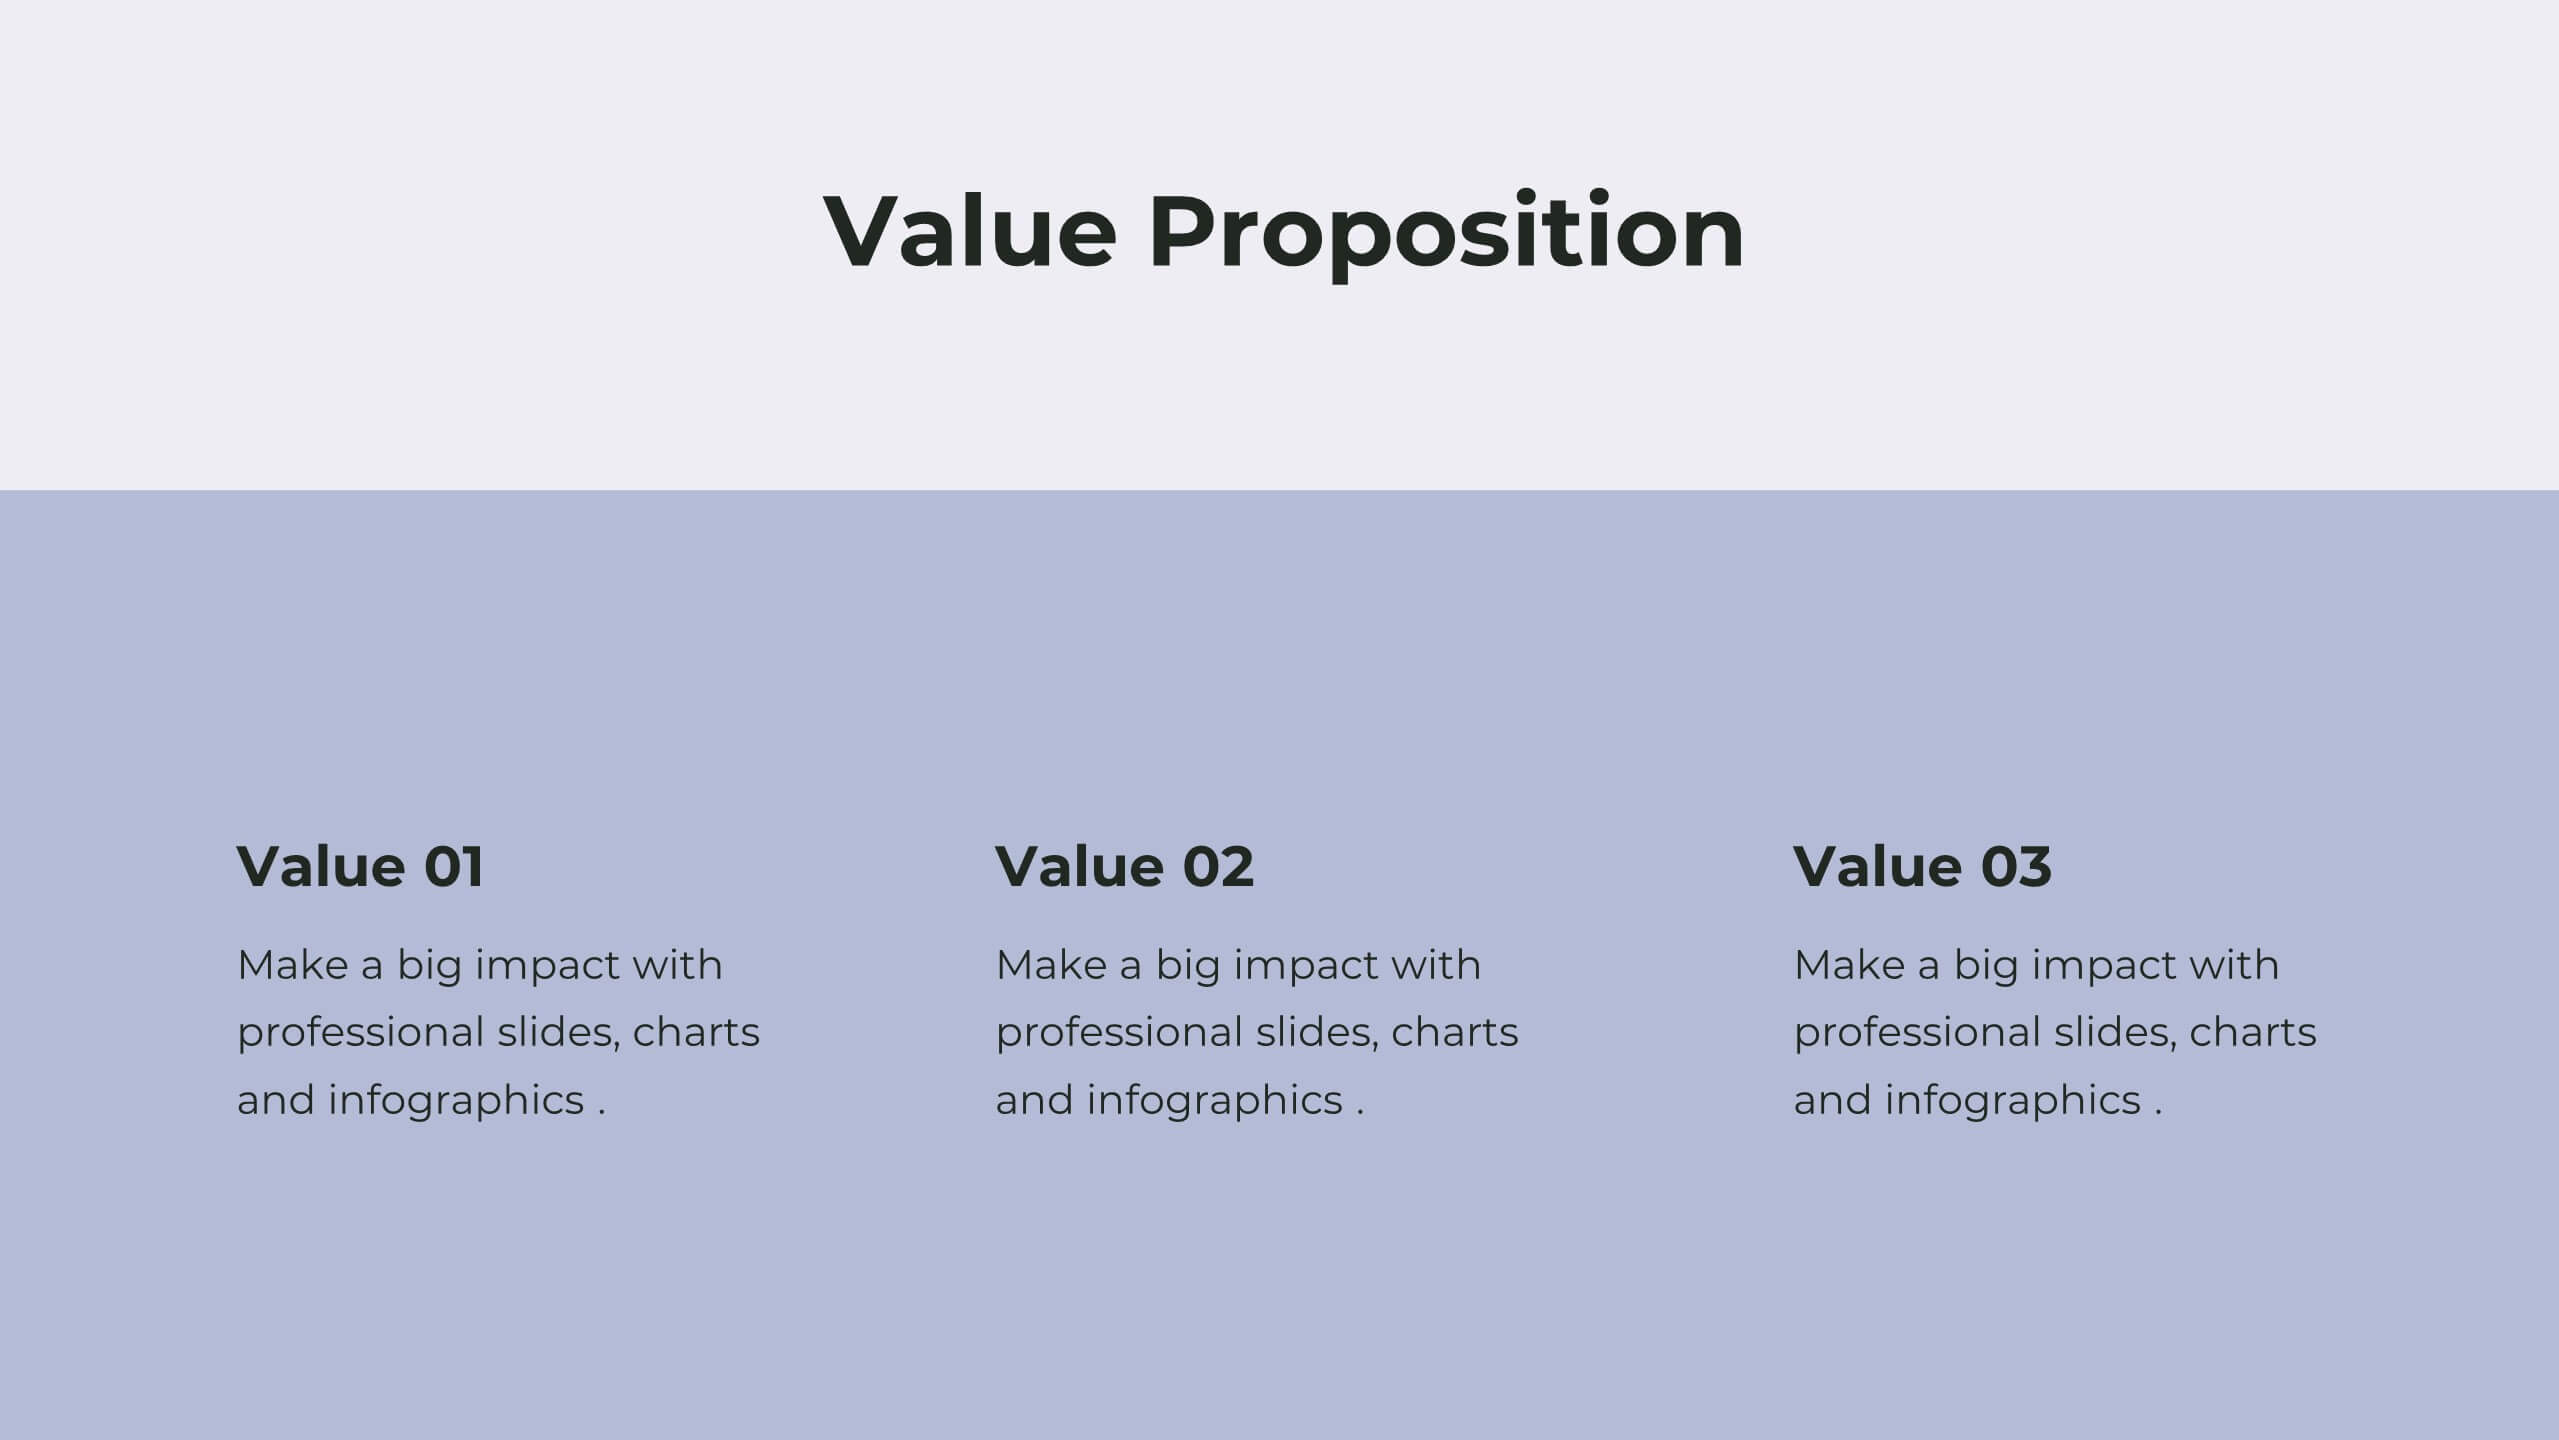
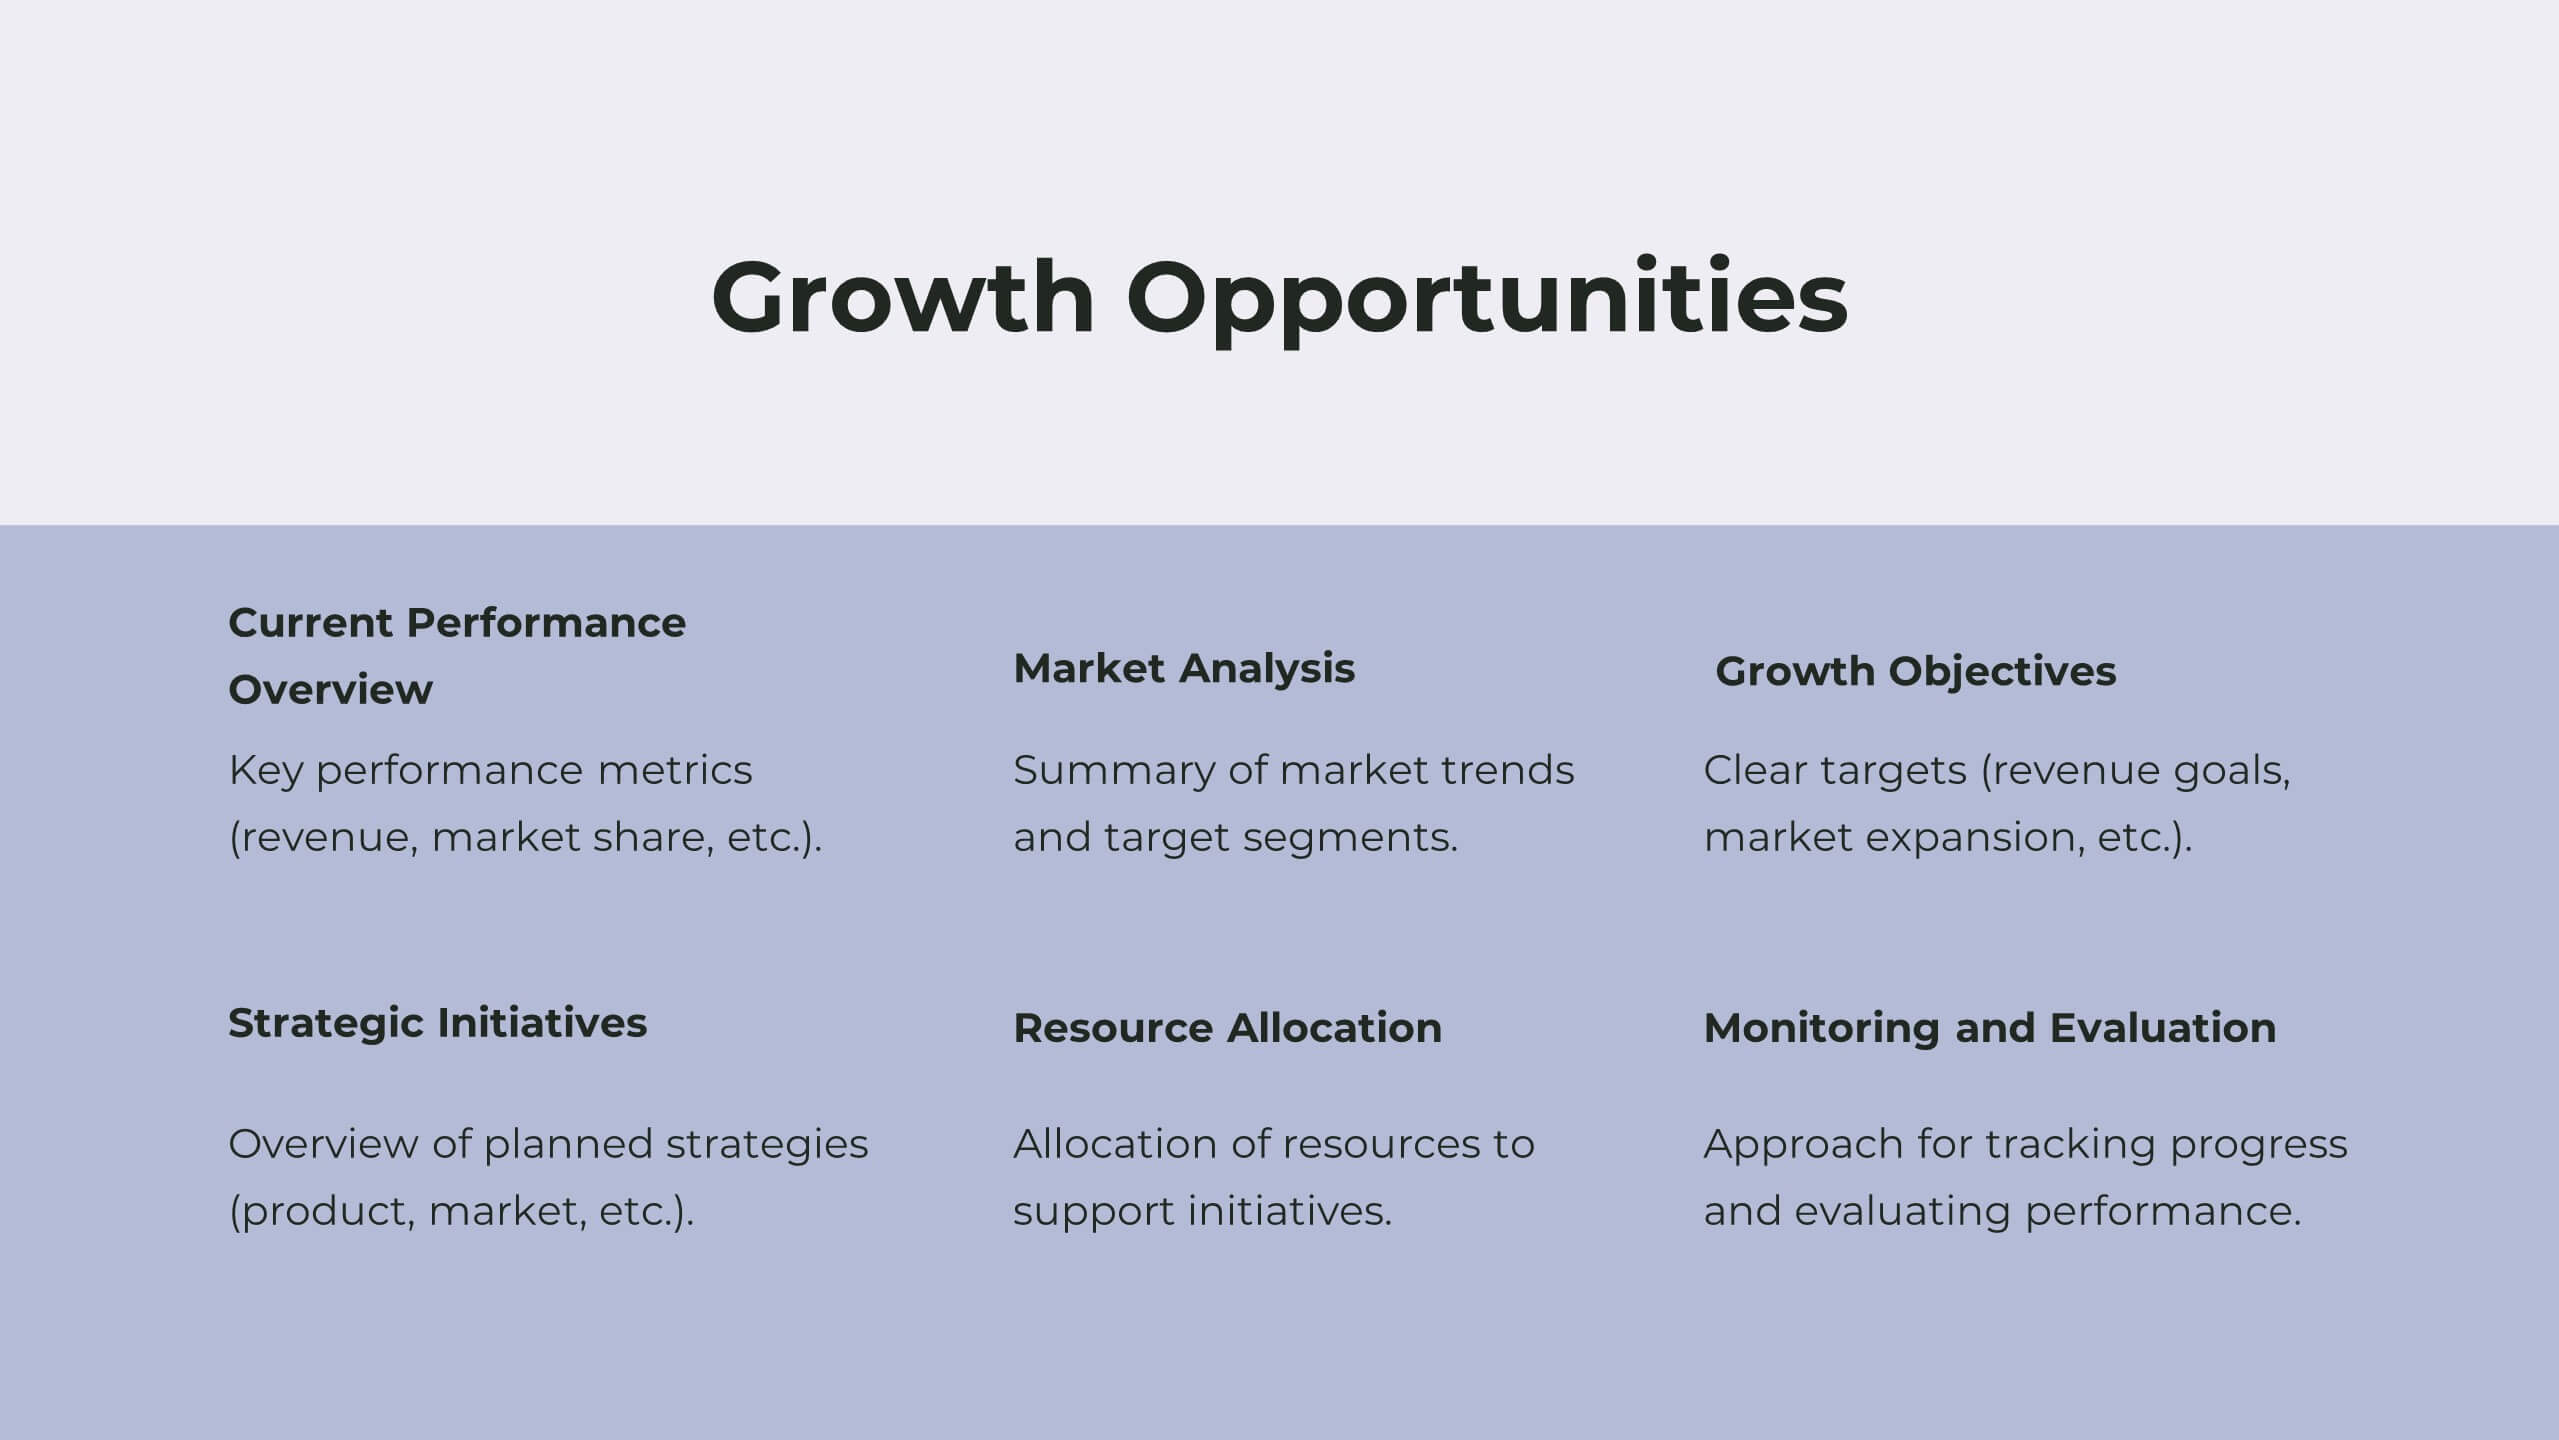
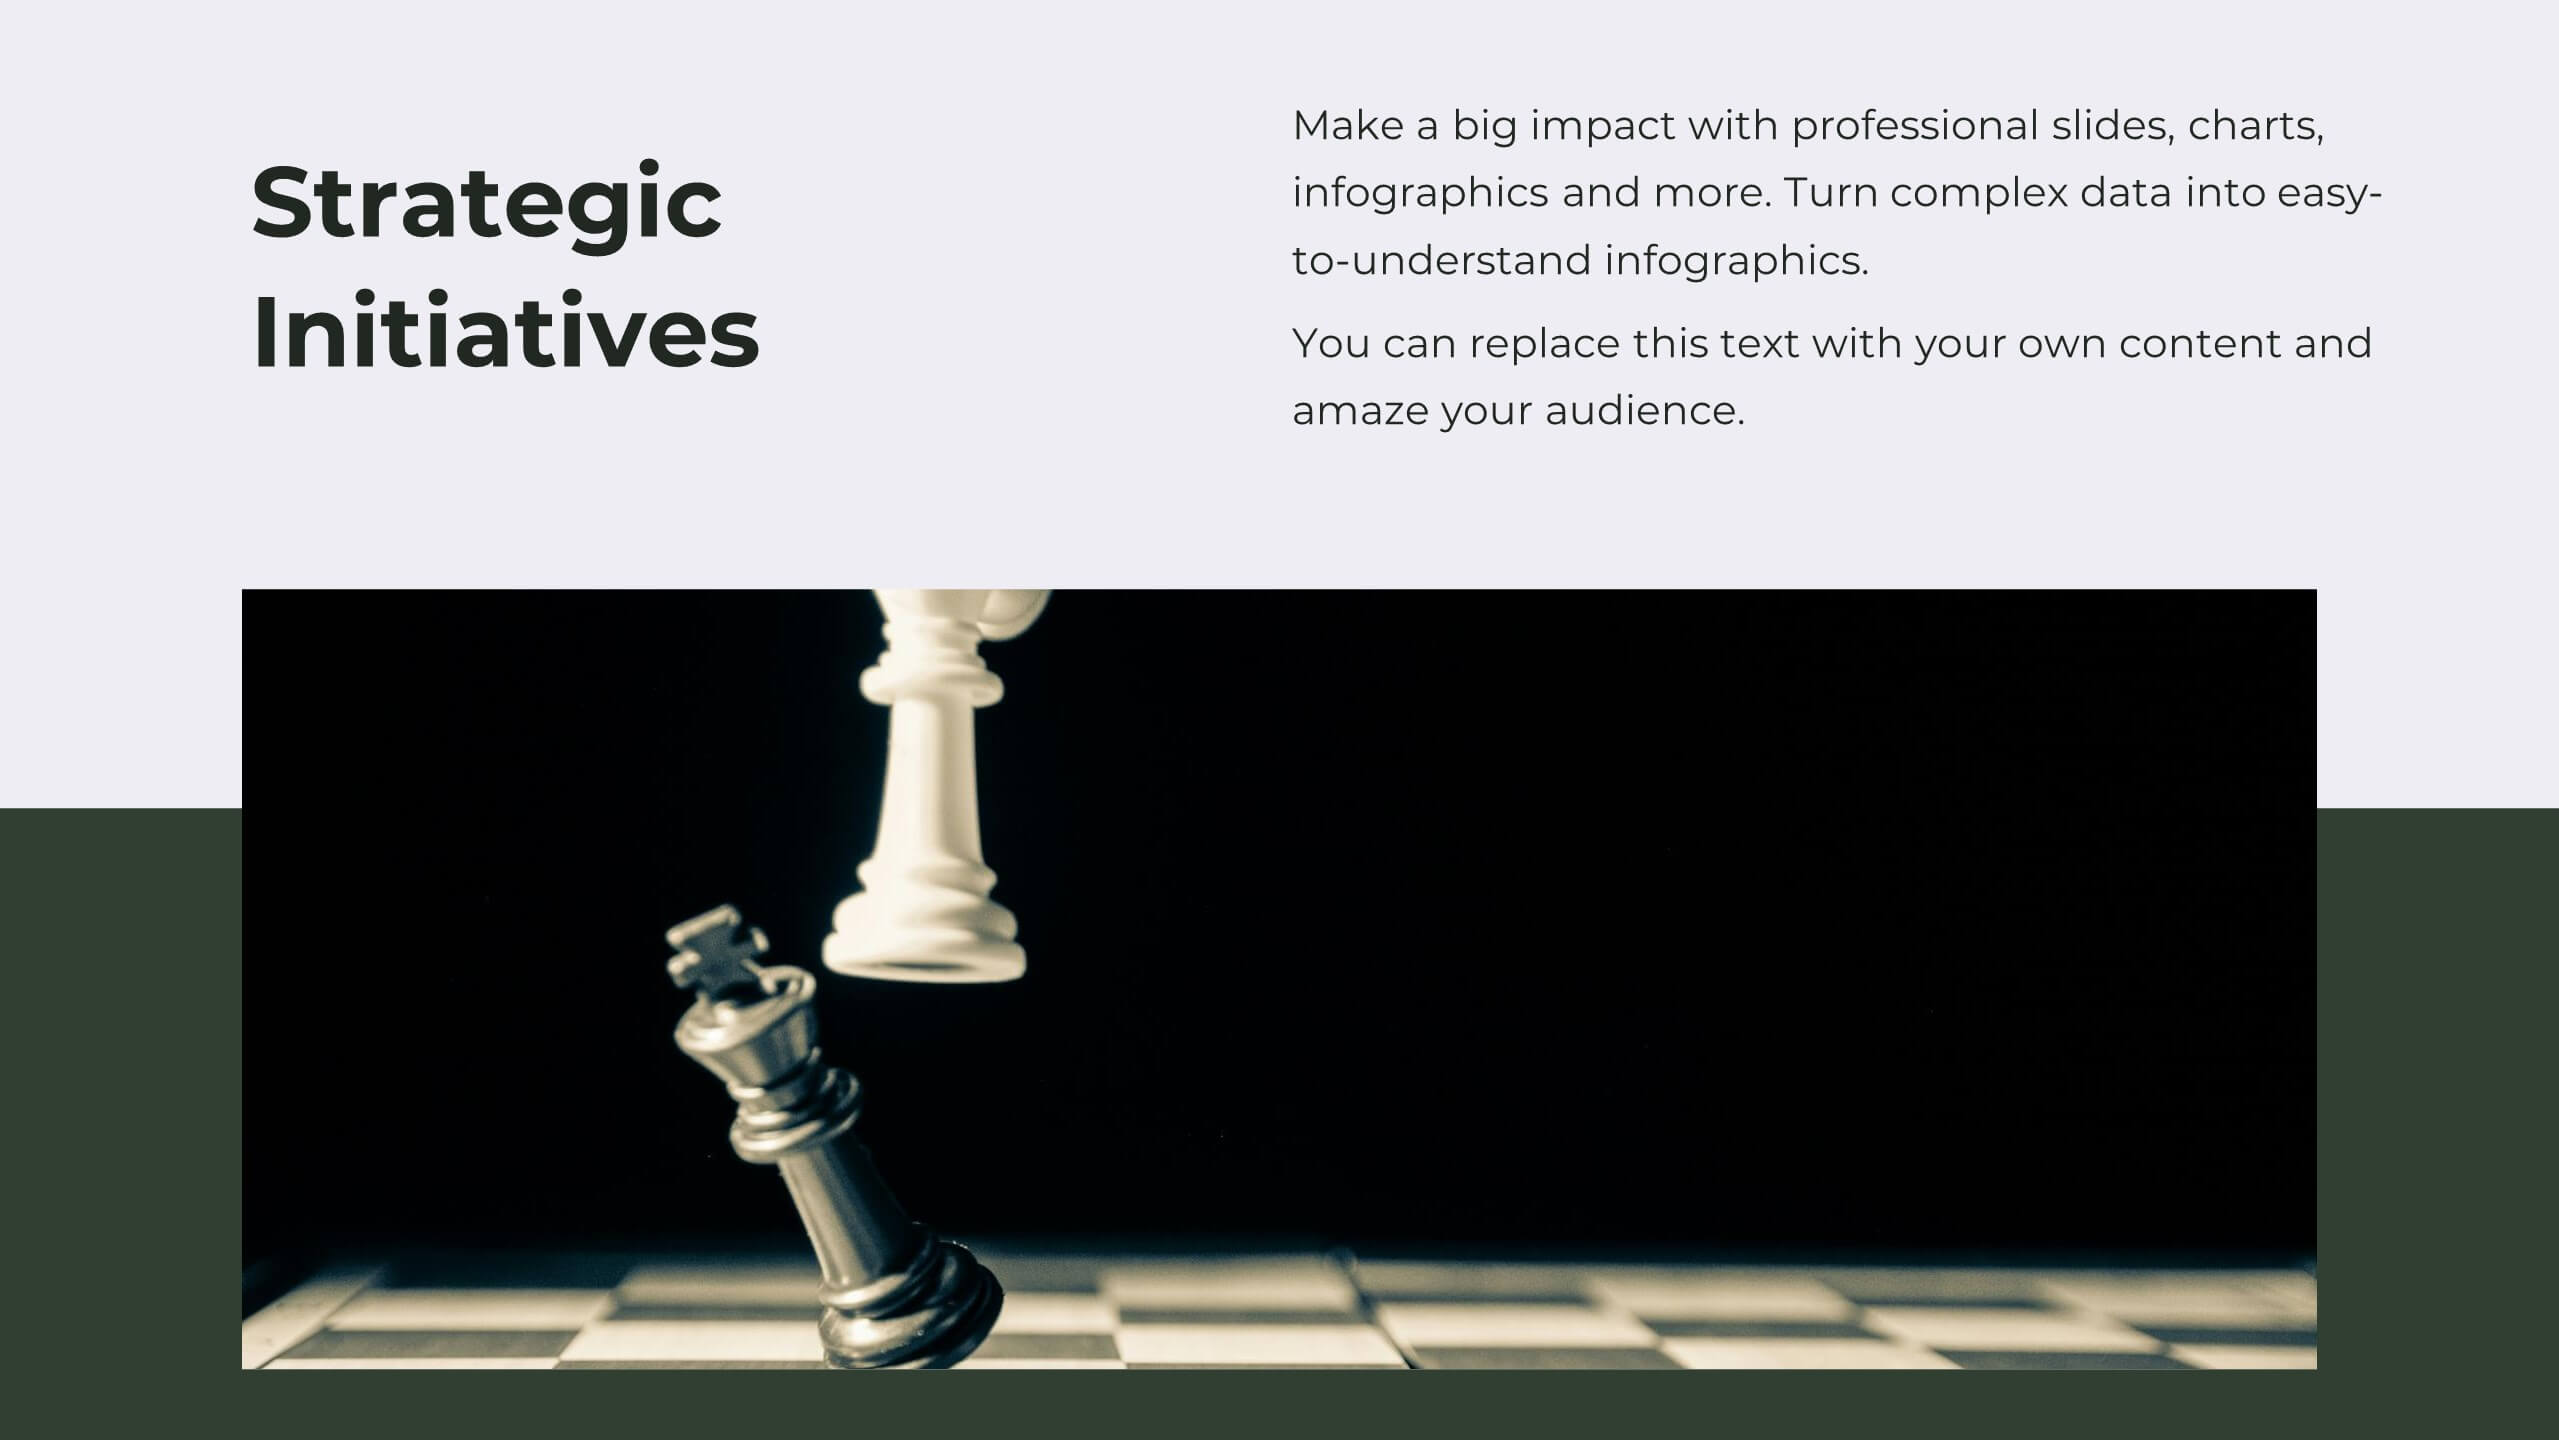
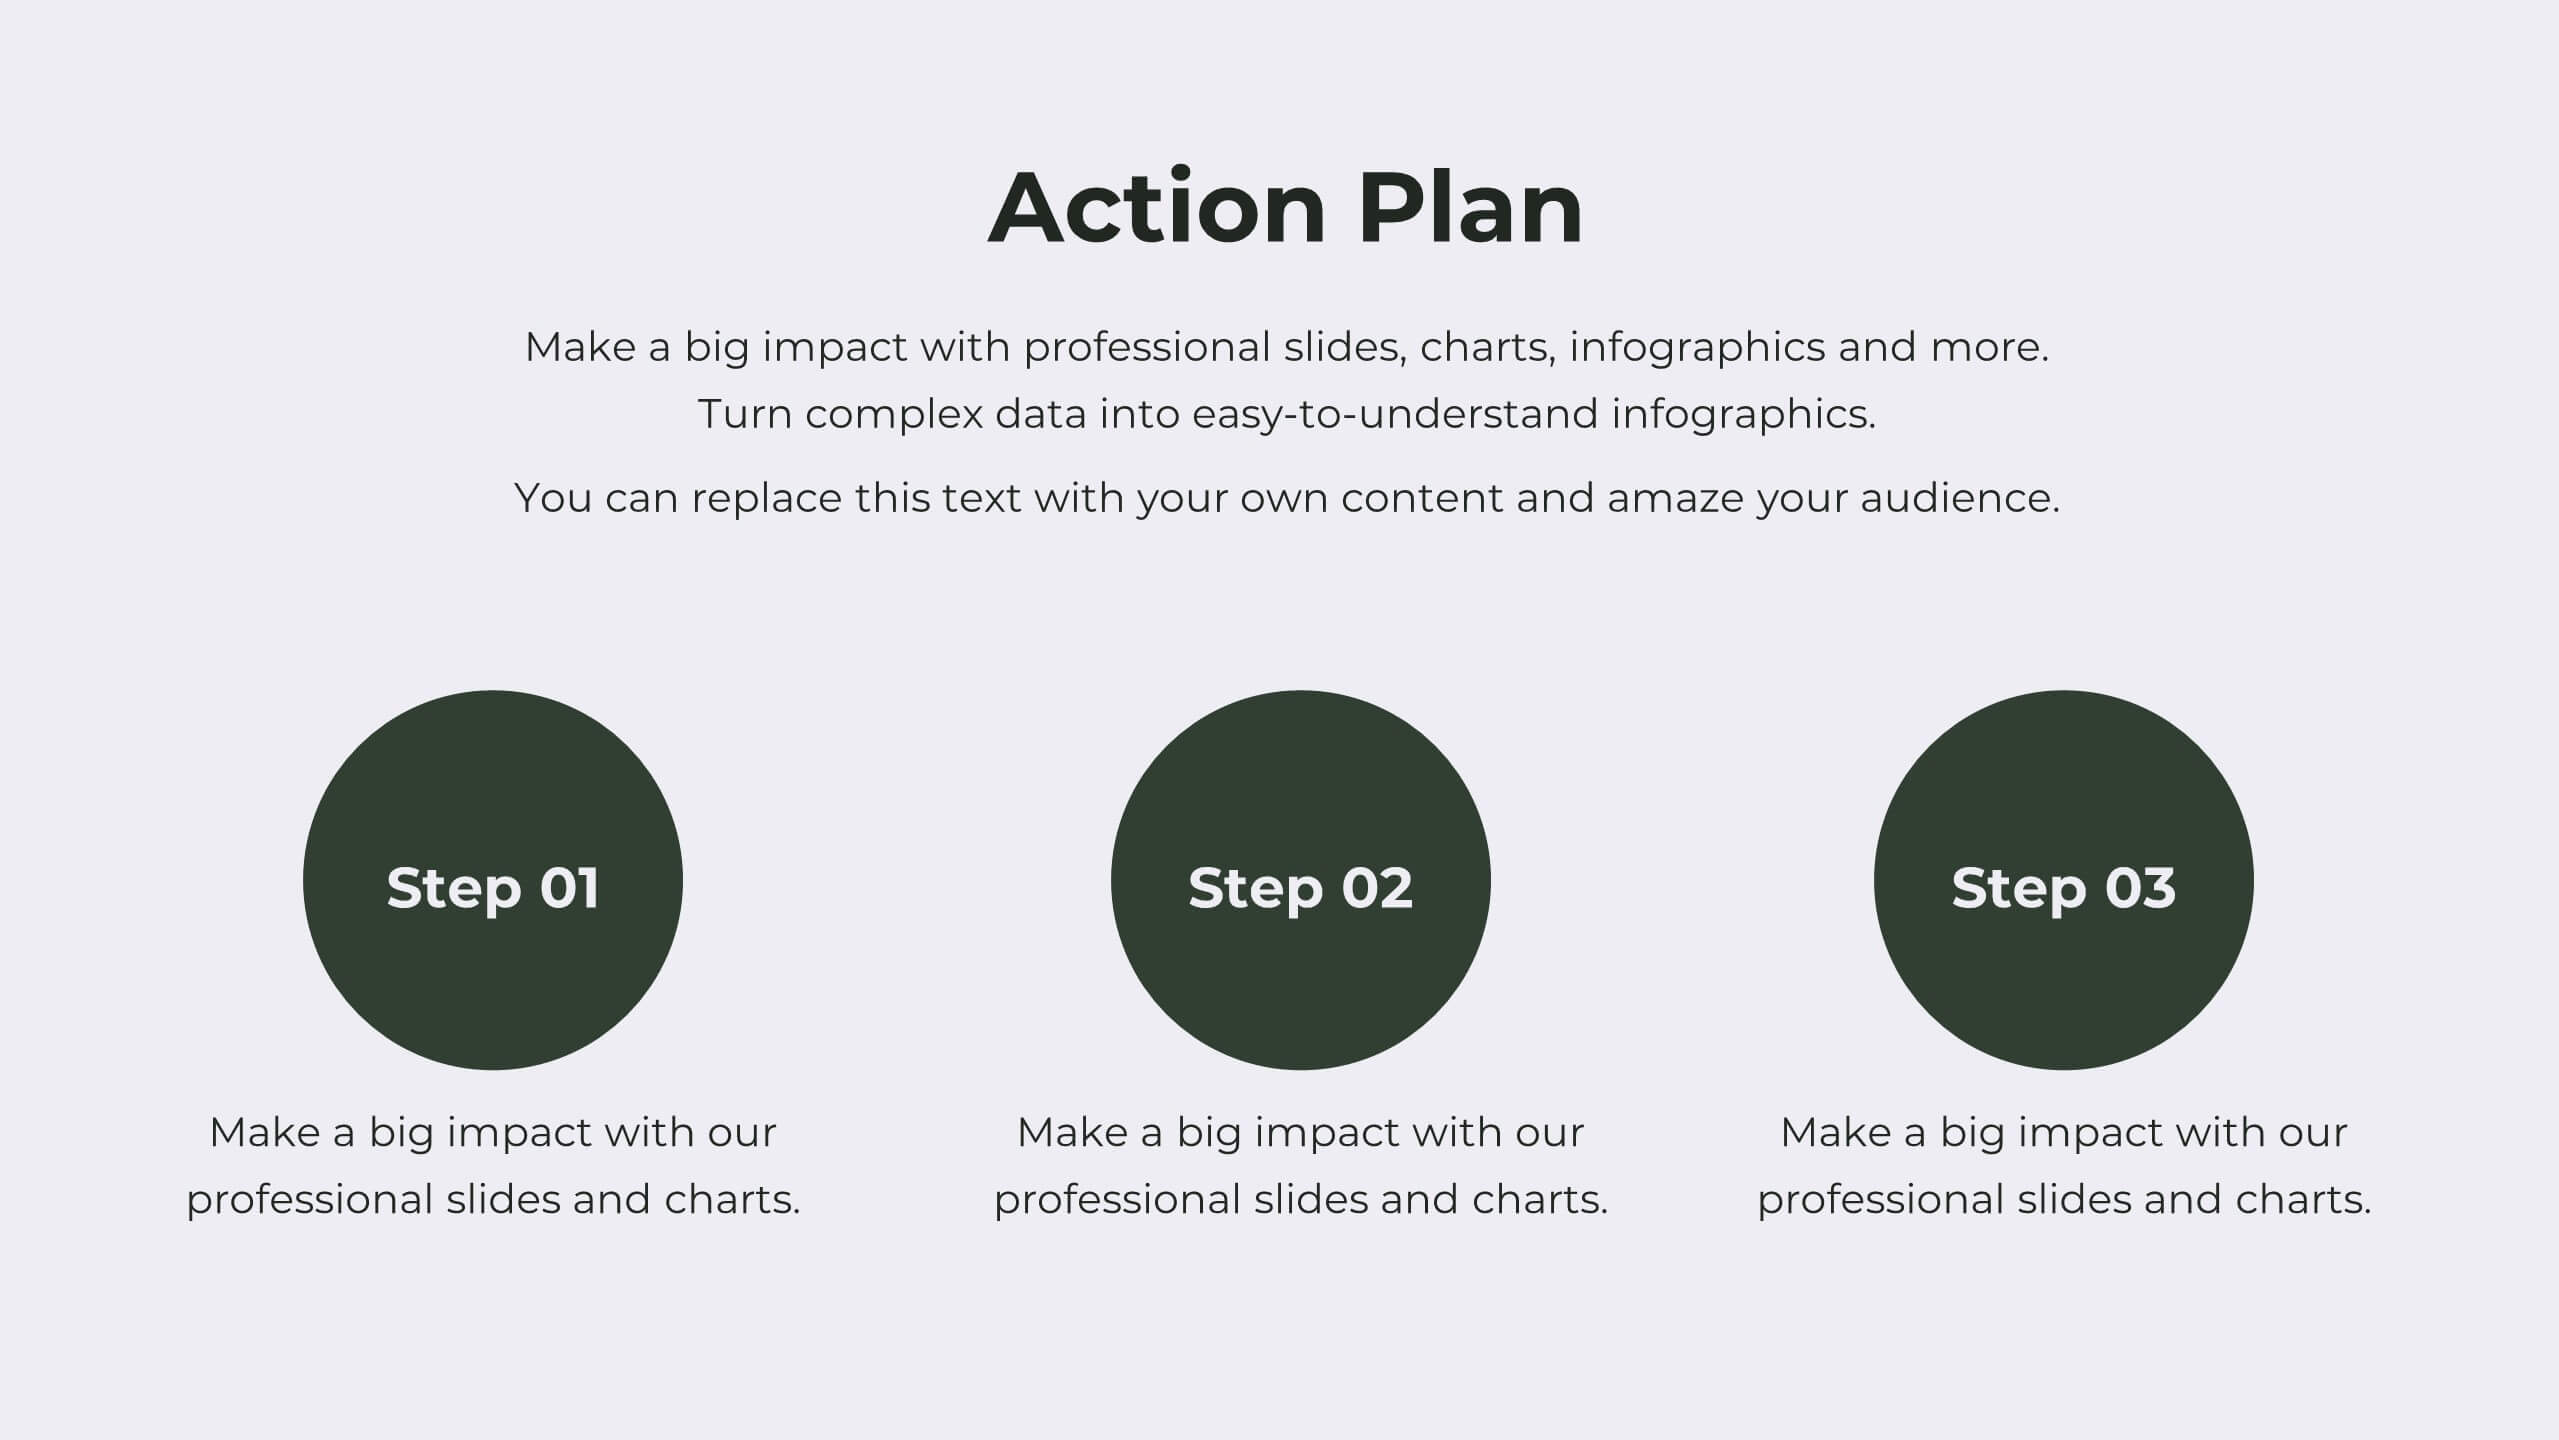
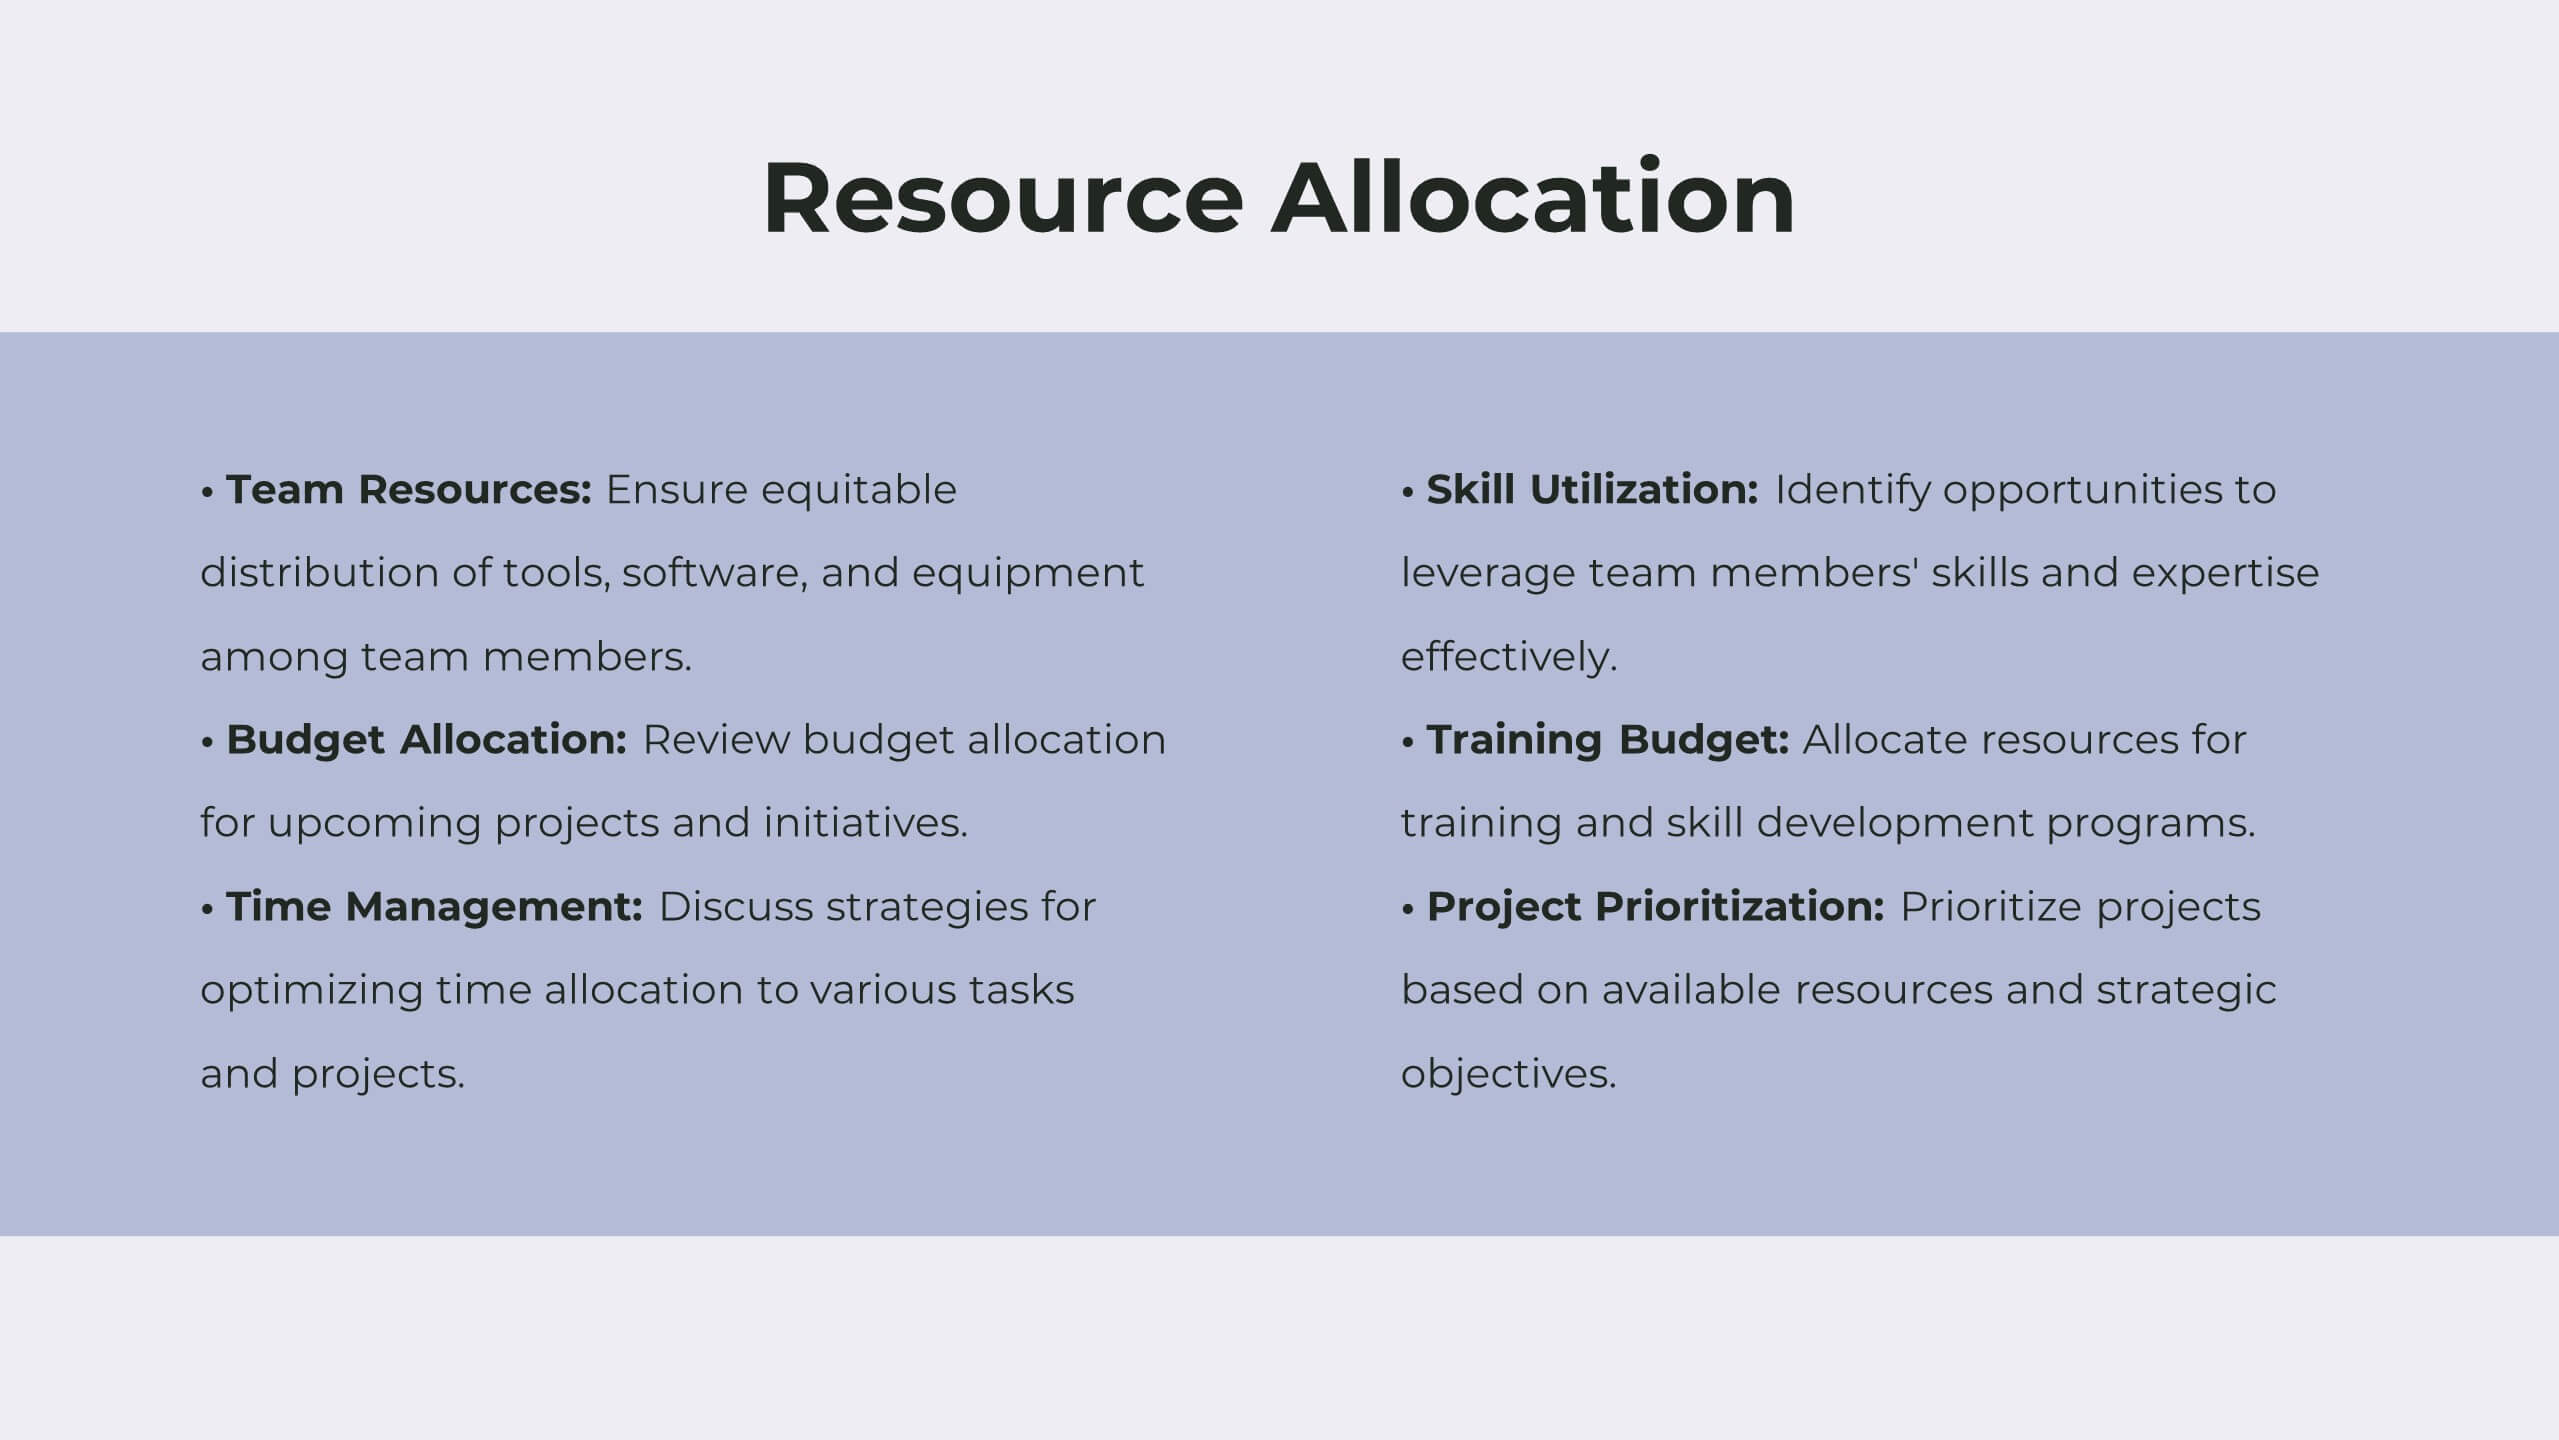
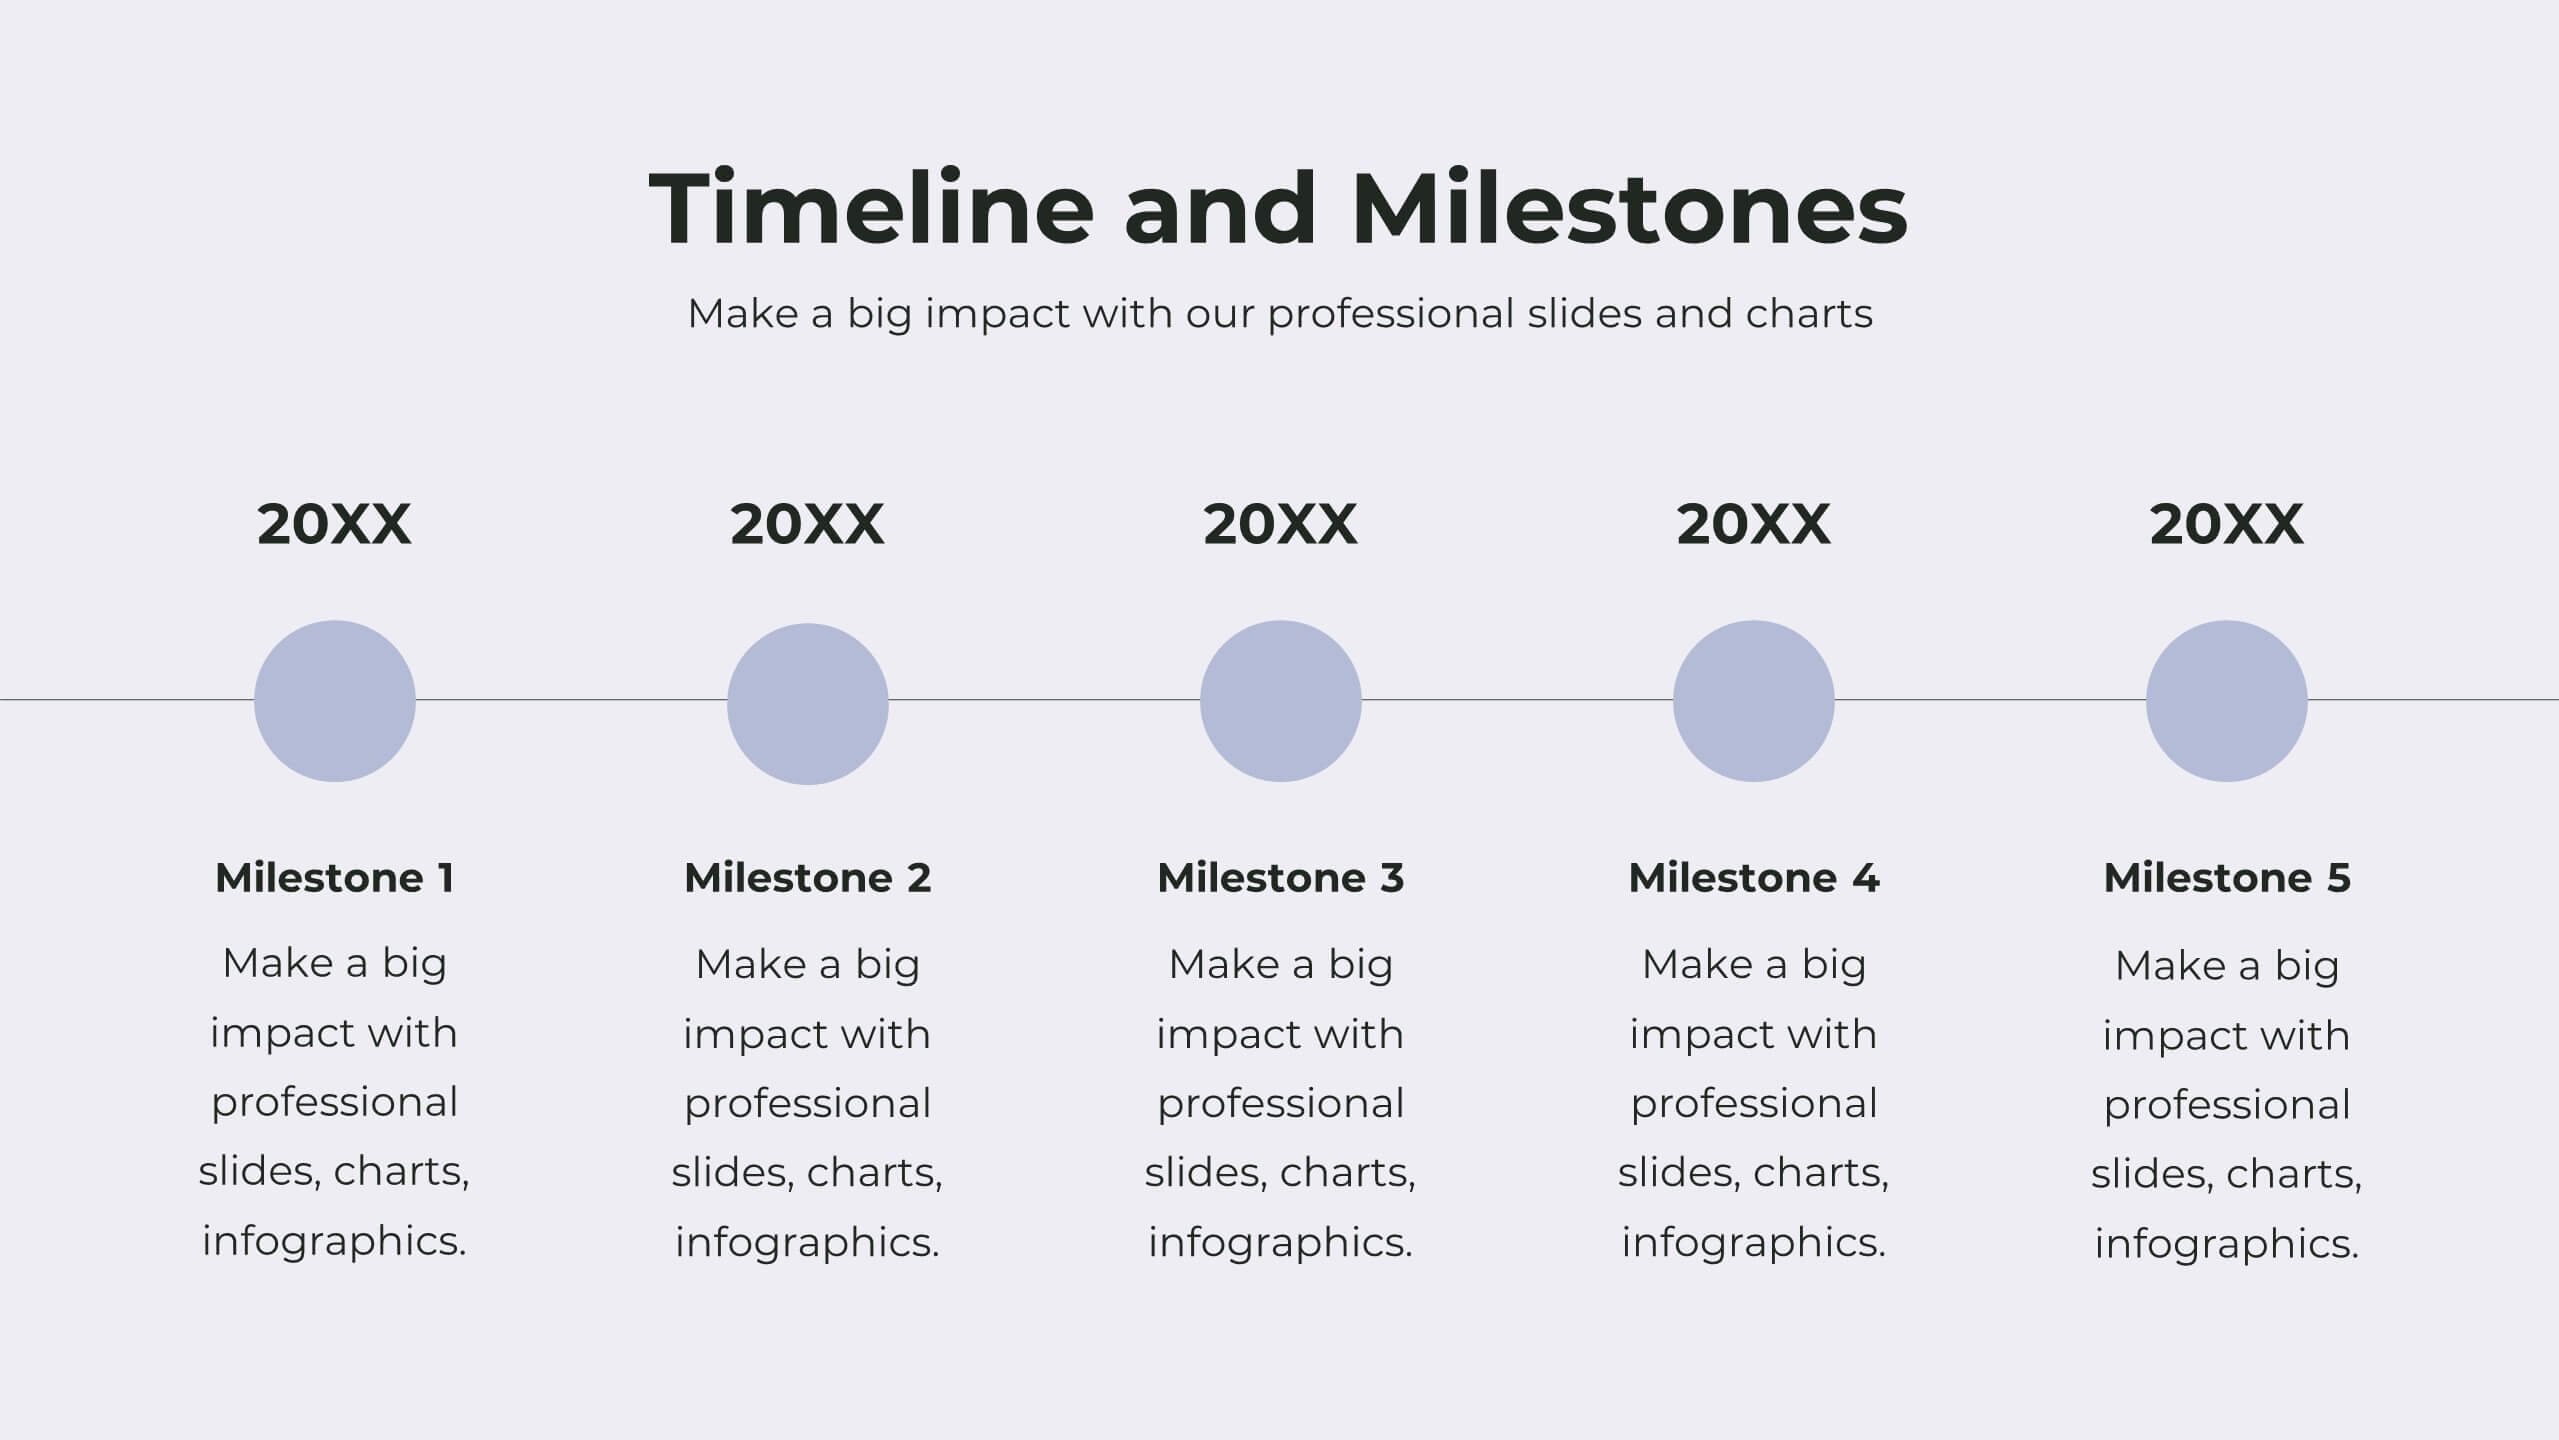
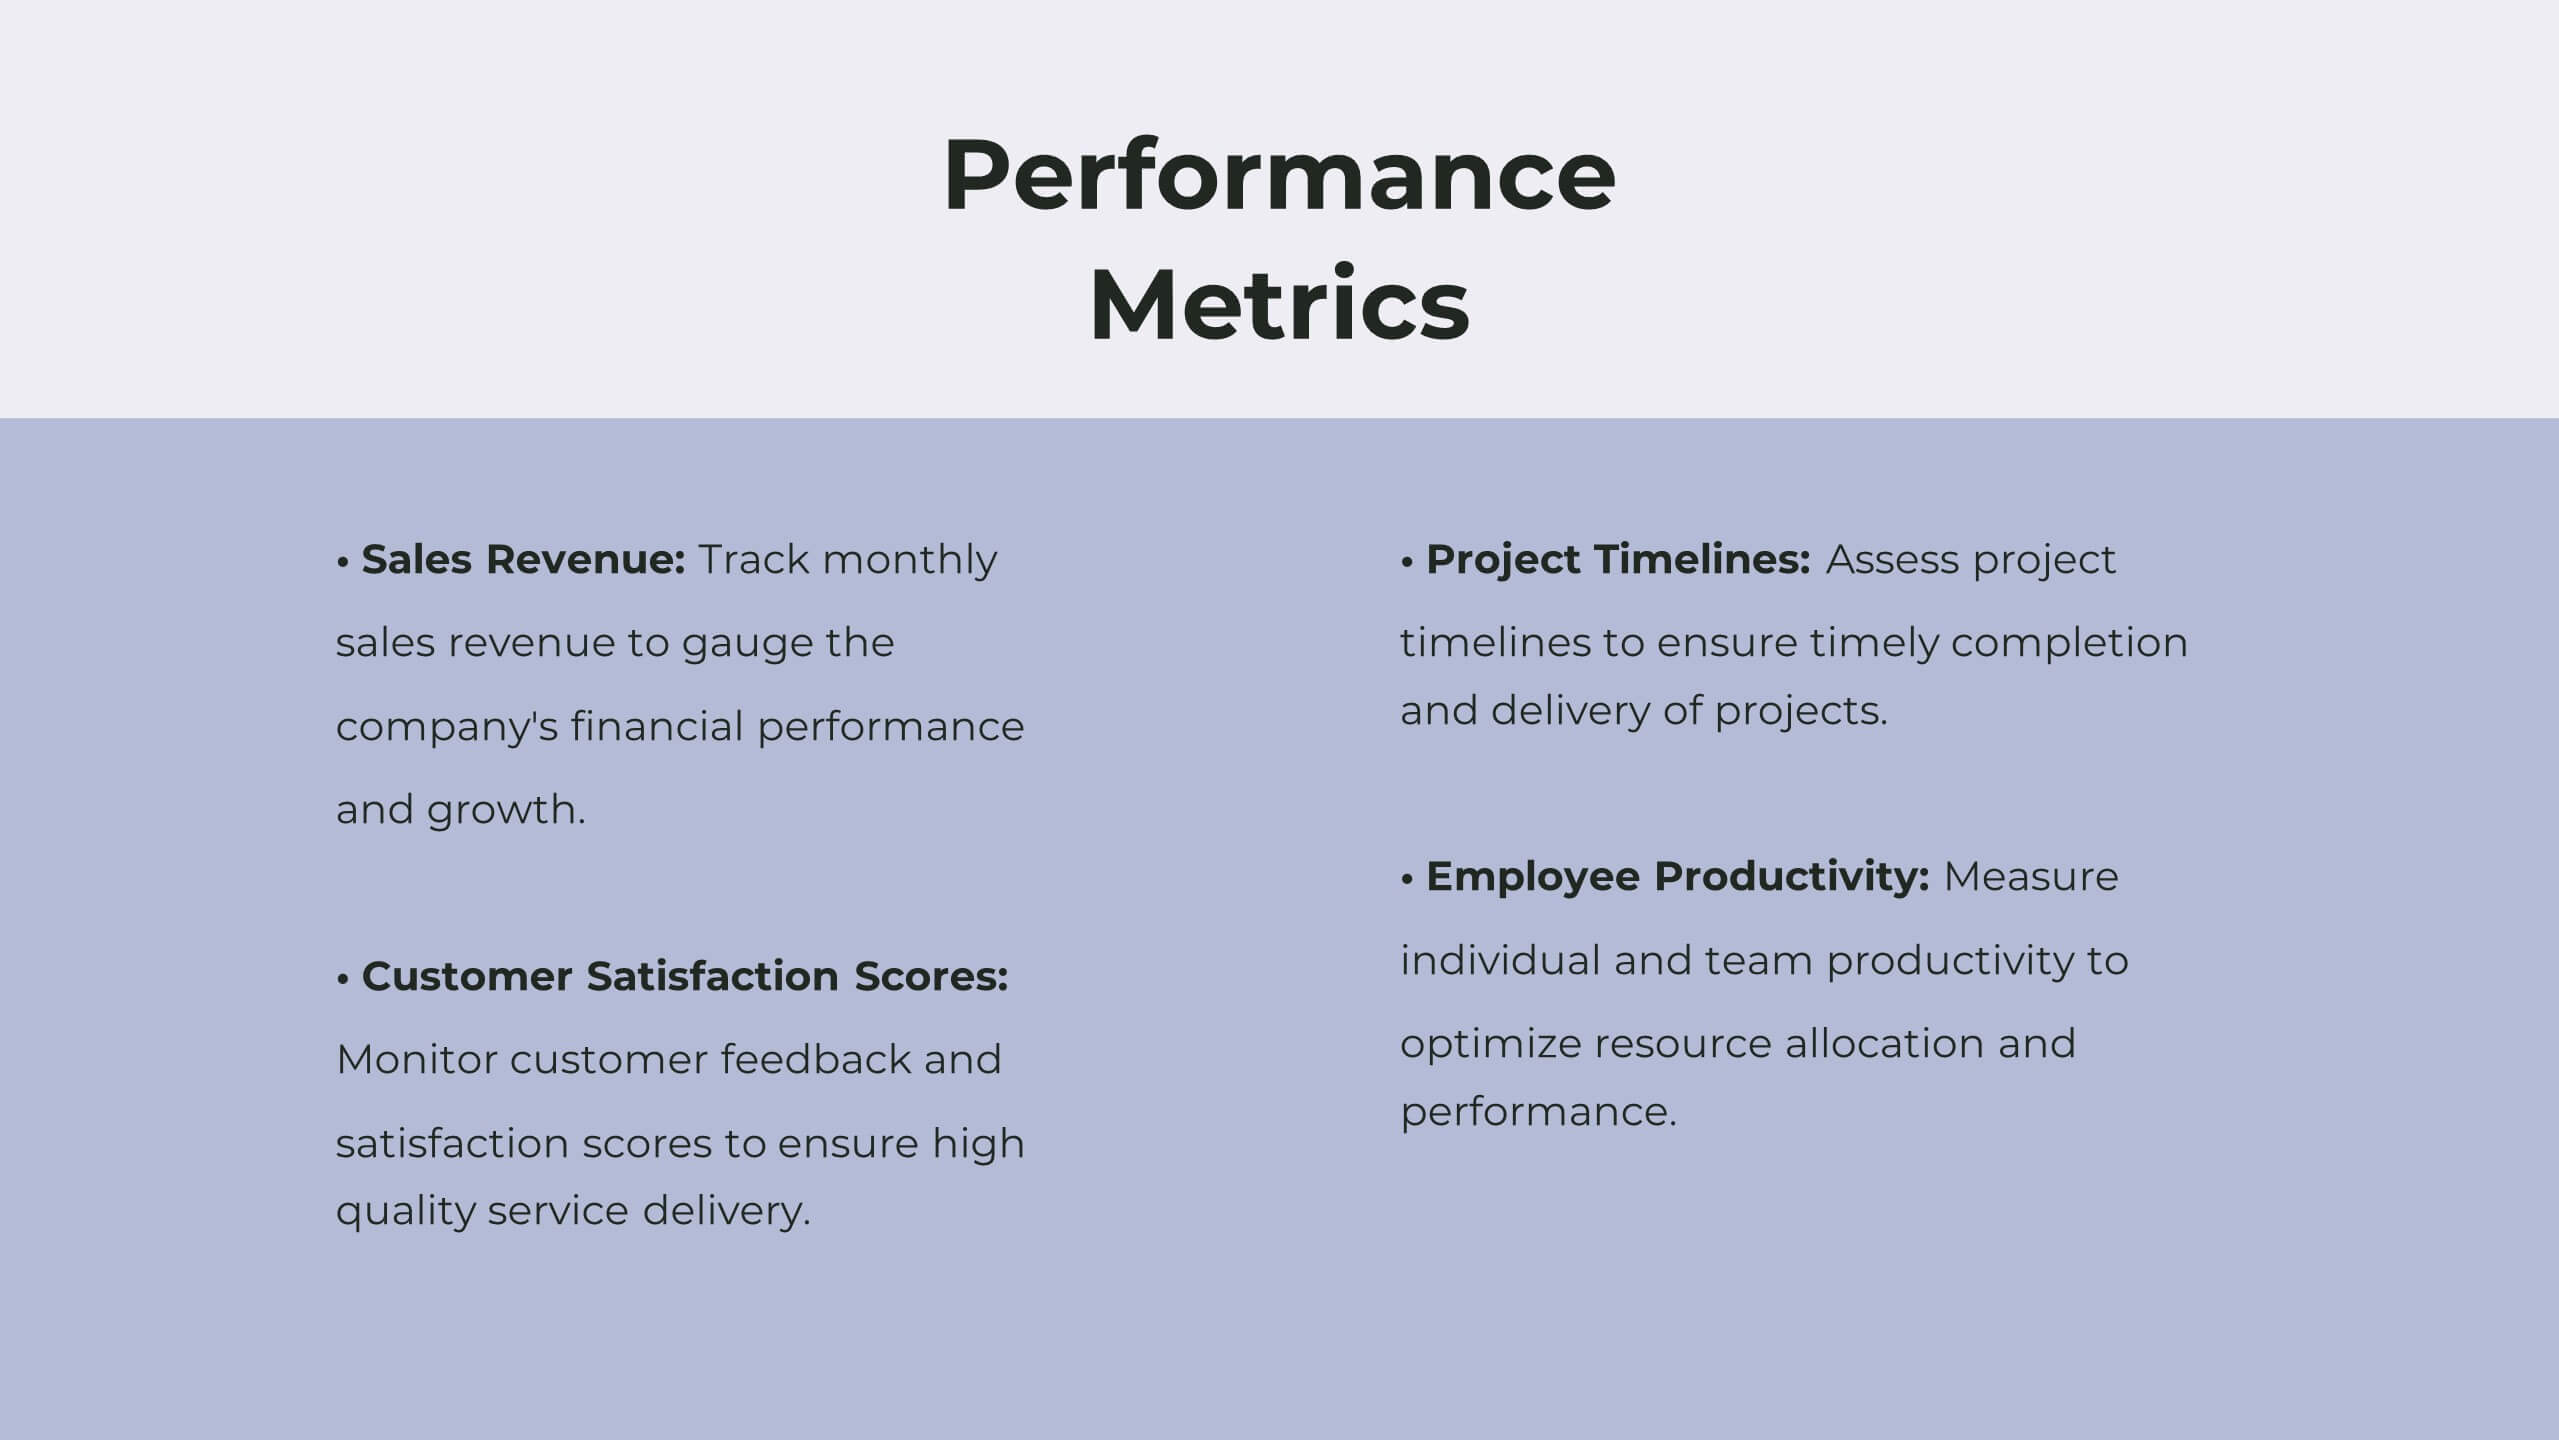
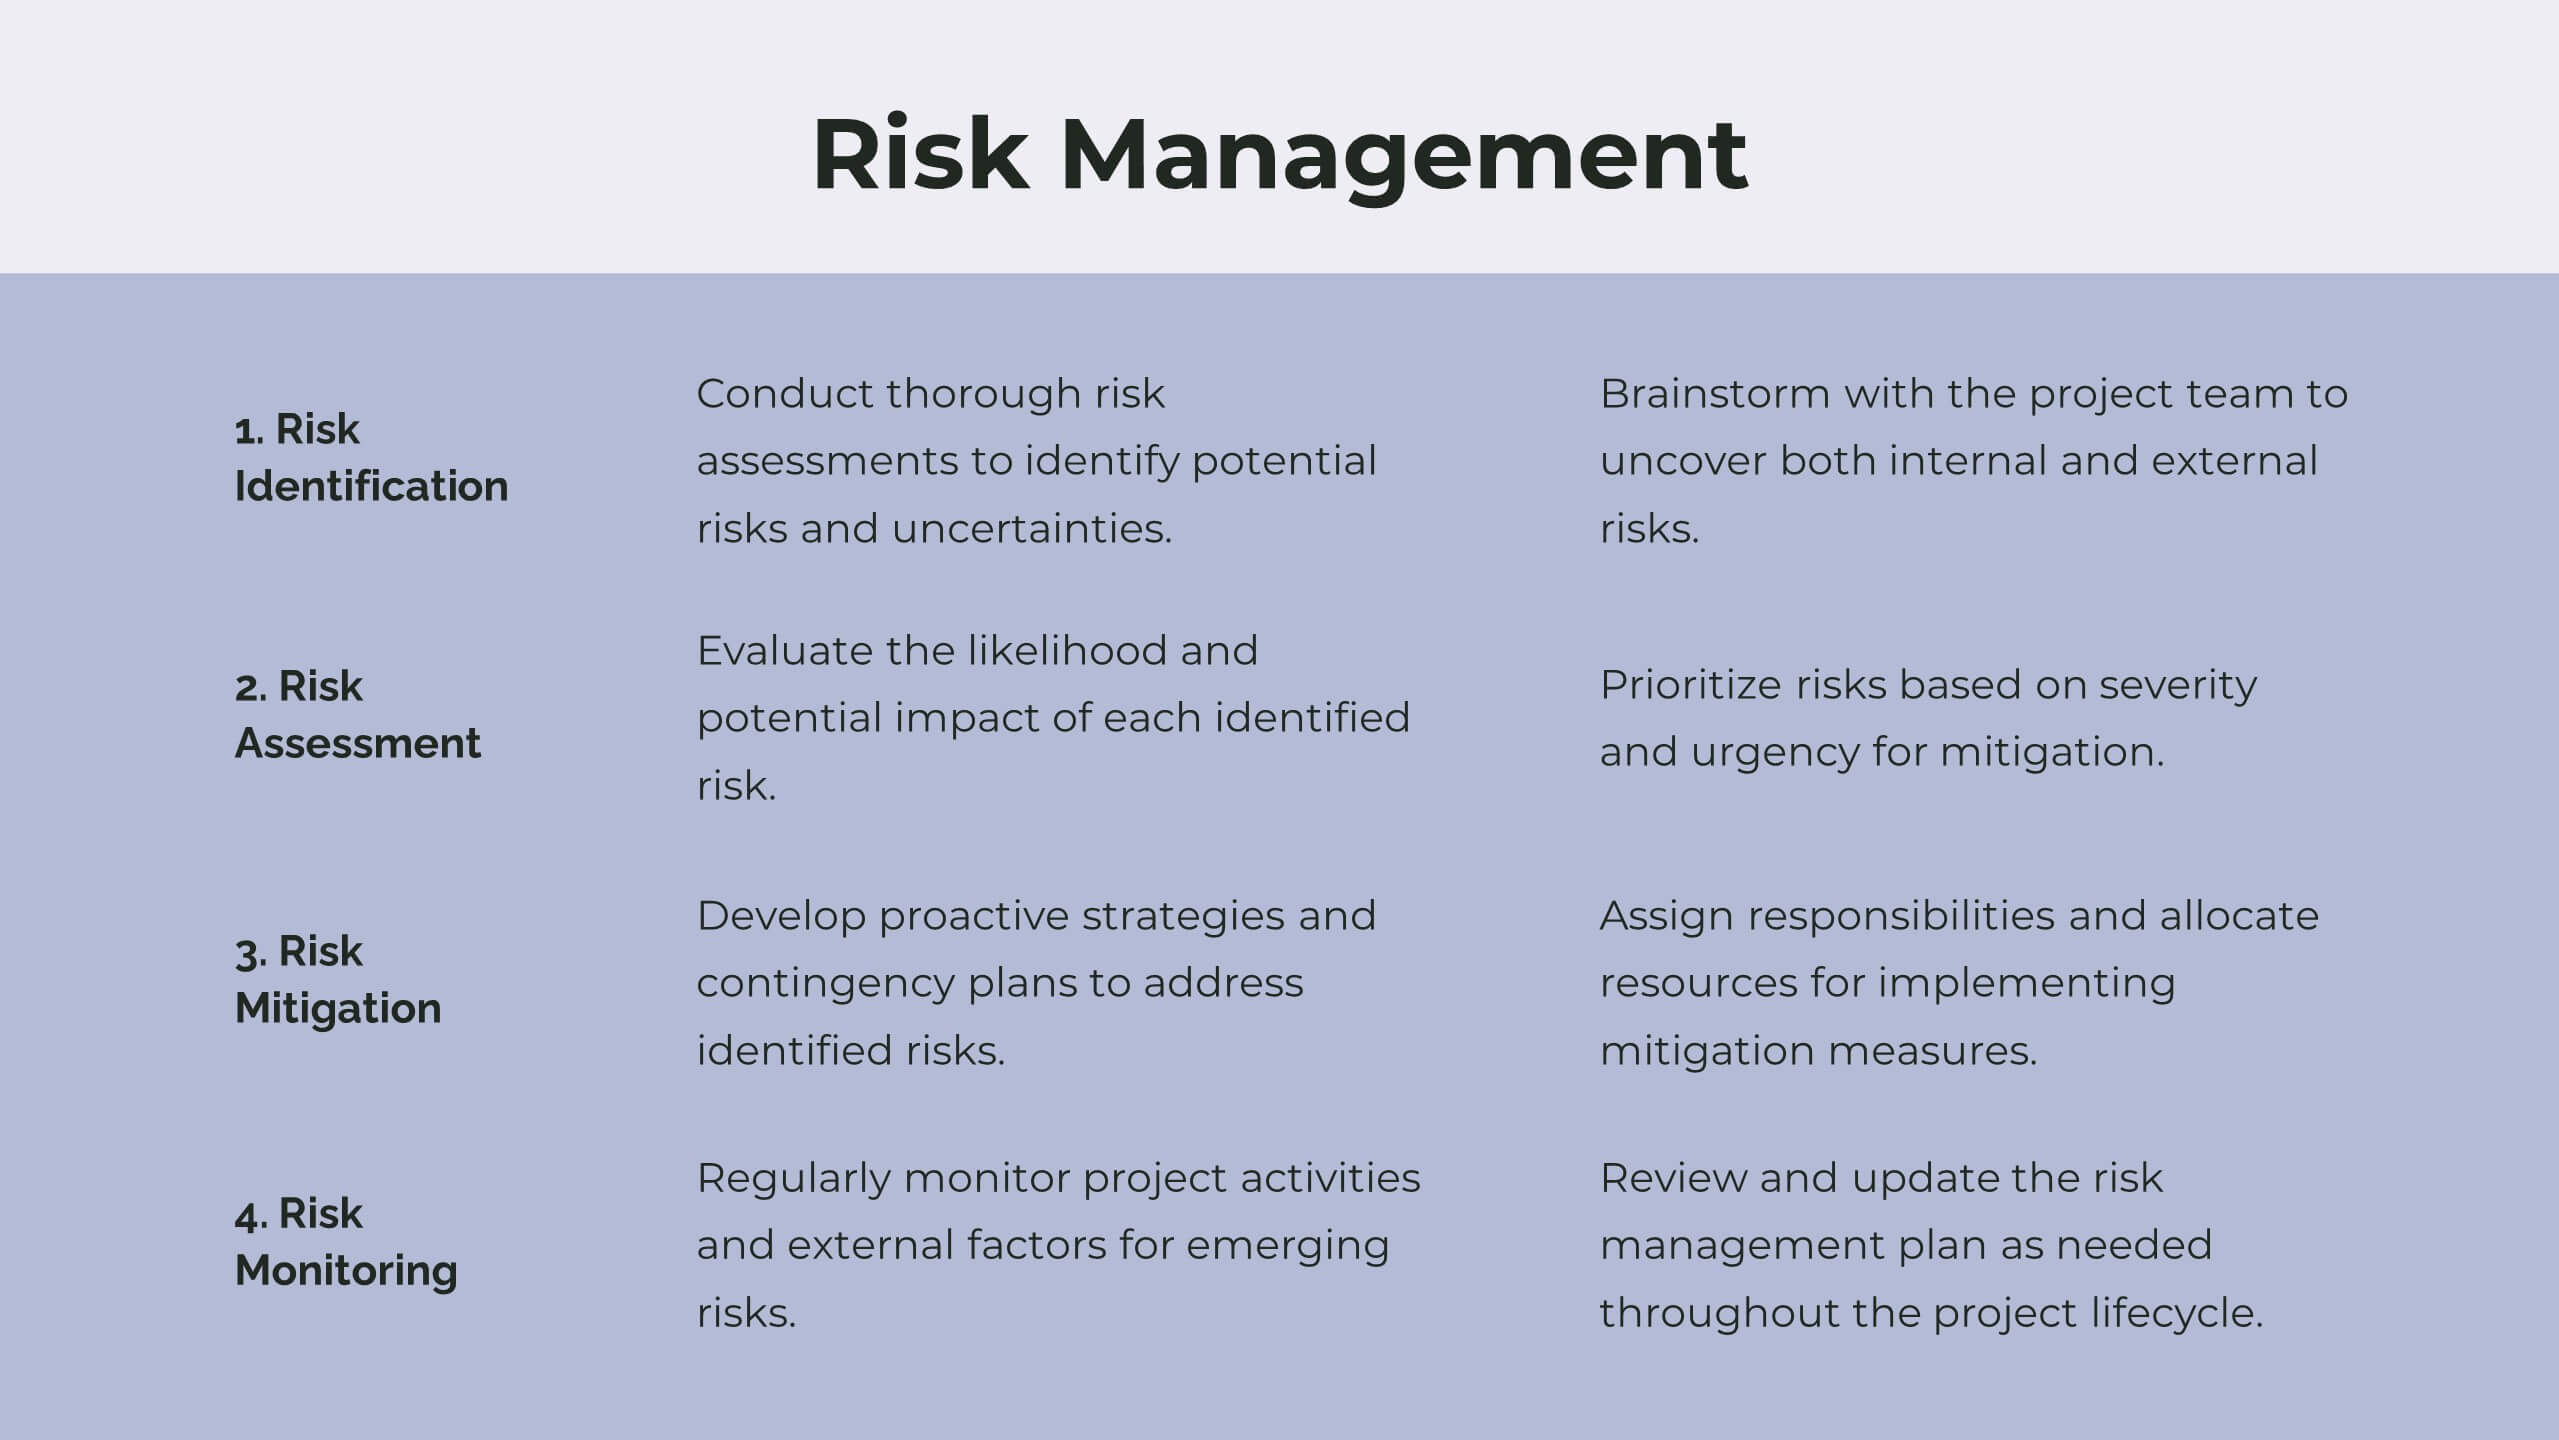
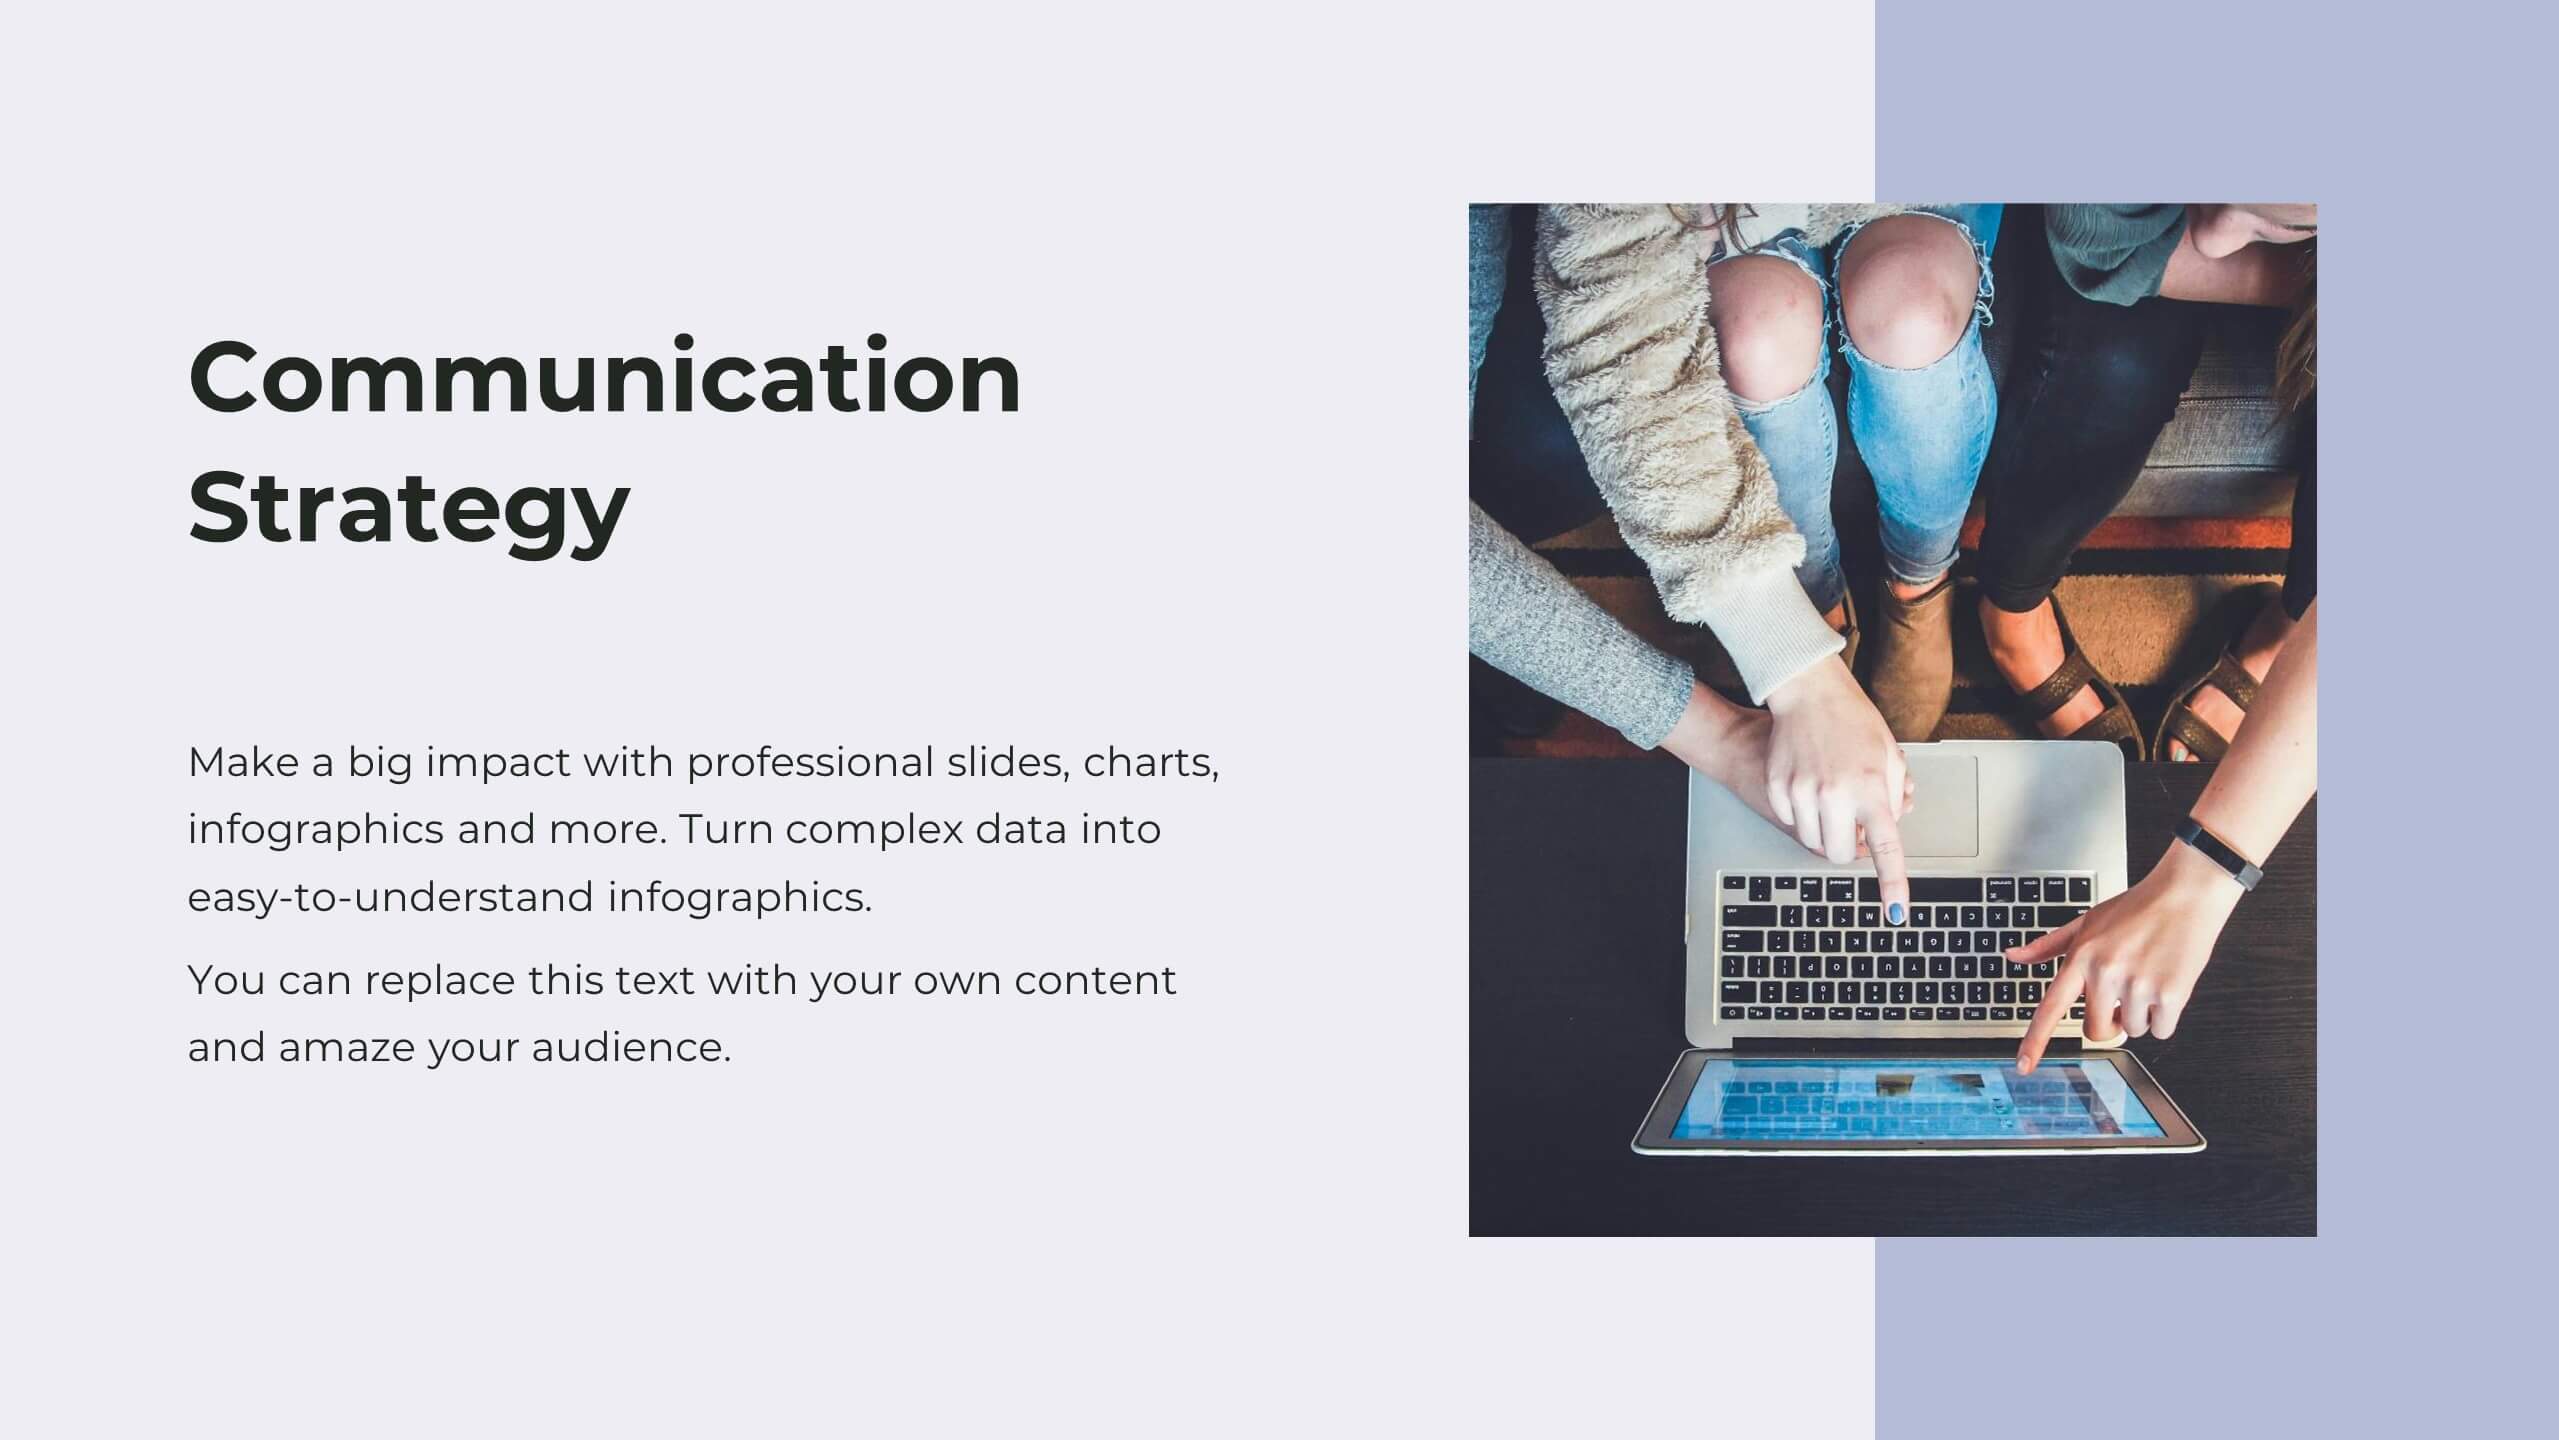
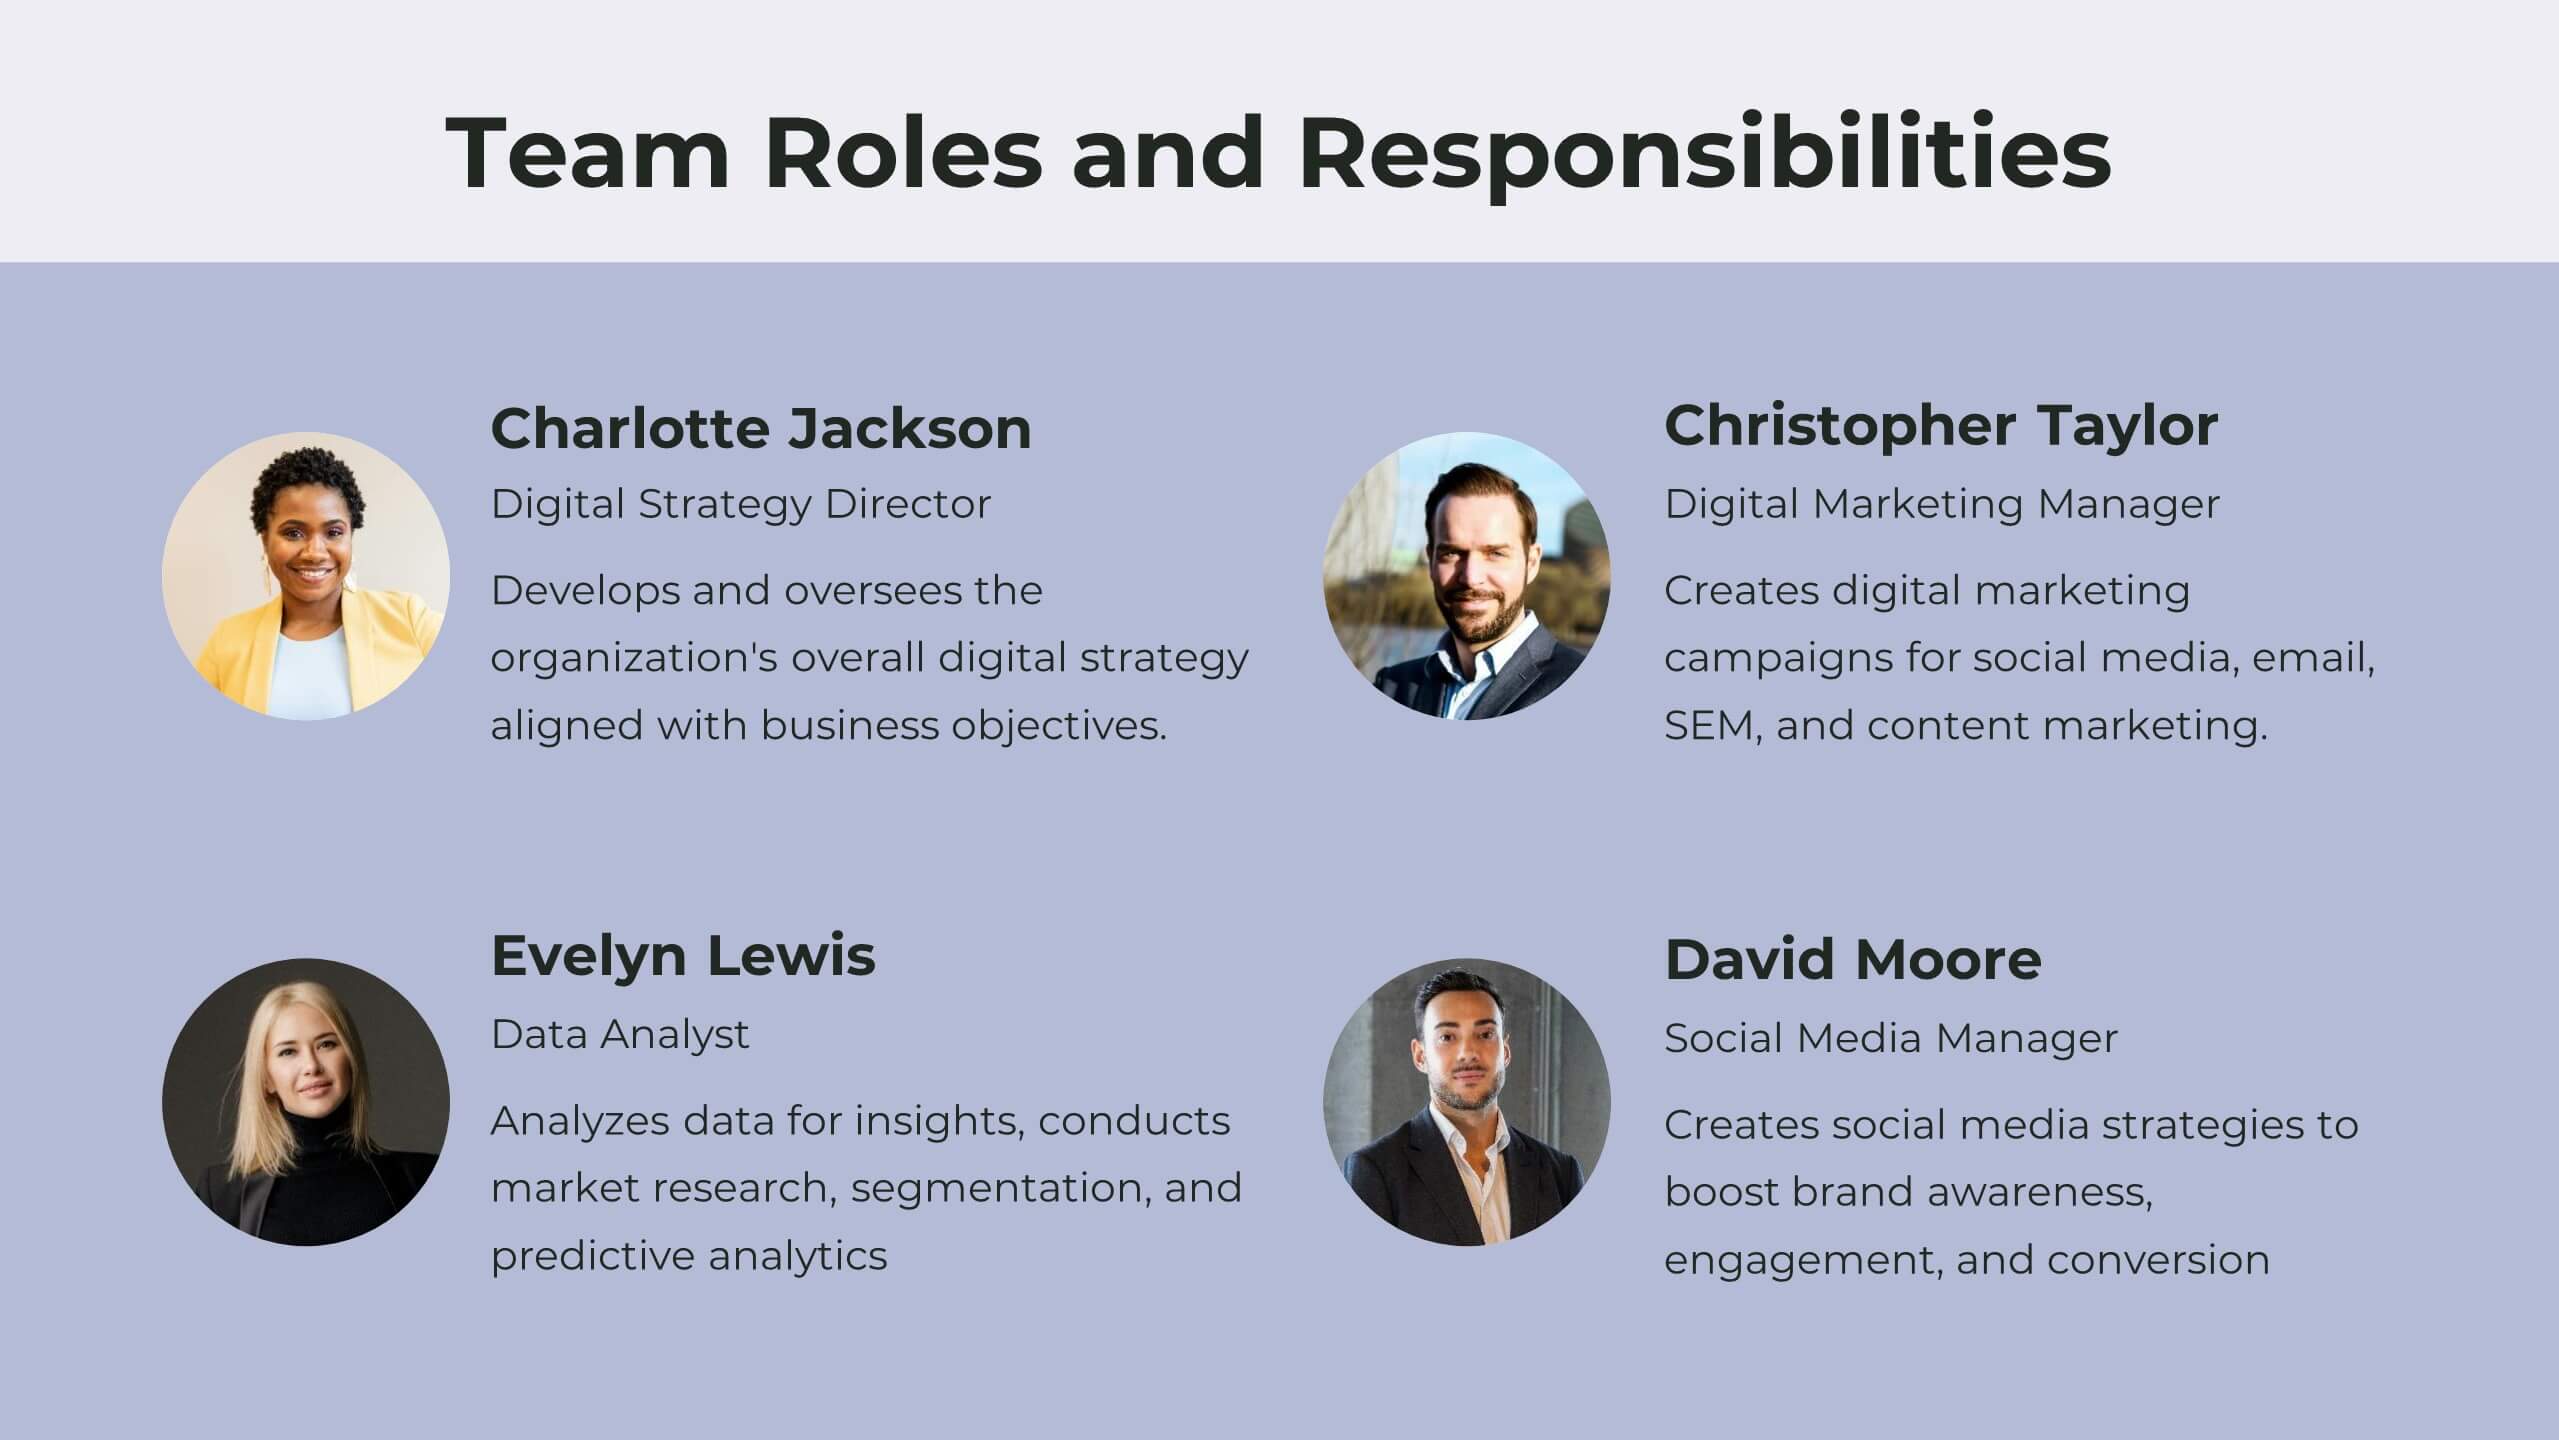
Tranquil Corporate Strategy Proposal Presentation
Drive your business forward with this elegant corporate strategy proposal template! Ideal for outlining strategic objectives, competitive analysis, and growth opportunities, it includes slides for SWOT analysis, resource allocation, and performance metrics. Impress stakeholders with clear visuals and structured content. Compatible with PowerPoint, Keynote, and Google Slides for seamless presentations on any platform.


6 diapositivas
Efficient Scheduling and Time Management Presentation
Stay on time and on target with the Efficient Scheduling and Time Management presentation slide. Designed with smartwatch graphics showing time progression, this layout visually emphasizes planning, deadlines, and time-based tasks. Ideal for outlining agendas, productivity methods, or resource allocation strategies. Each time block includes editable text fields for key milestones or steps. Compatible with PowerPoint, Keynote, and Google Slides.