


Características


¿Tienes alguna pregunta?
Recomendar


7 diapositivas
Blue Ocean Strategy Infographic Presentation Template
The Blue Ocean strategy is a highly practical, step-by-step process for leaders to create uncontested market space and make the competition irrelevant. With this template you will be able to identify and capitalize on the growth opportunities your company has been overlooking or avoiding due to industry constraints. Our template is designed to help you identify market opportunities and formulate your strategy to avoid the threat of competition. Use this as a graphic organizer to help you think about how you can best compete in the marketplace. This template is perfect for your next presentation!


22 diapositivas
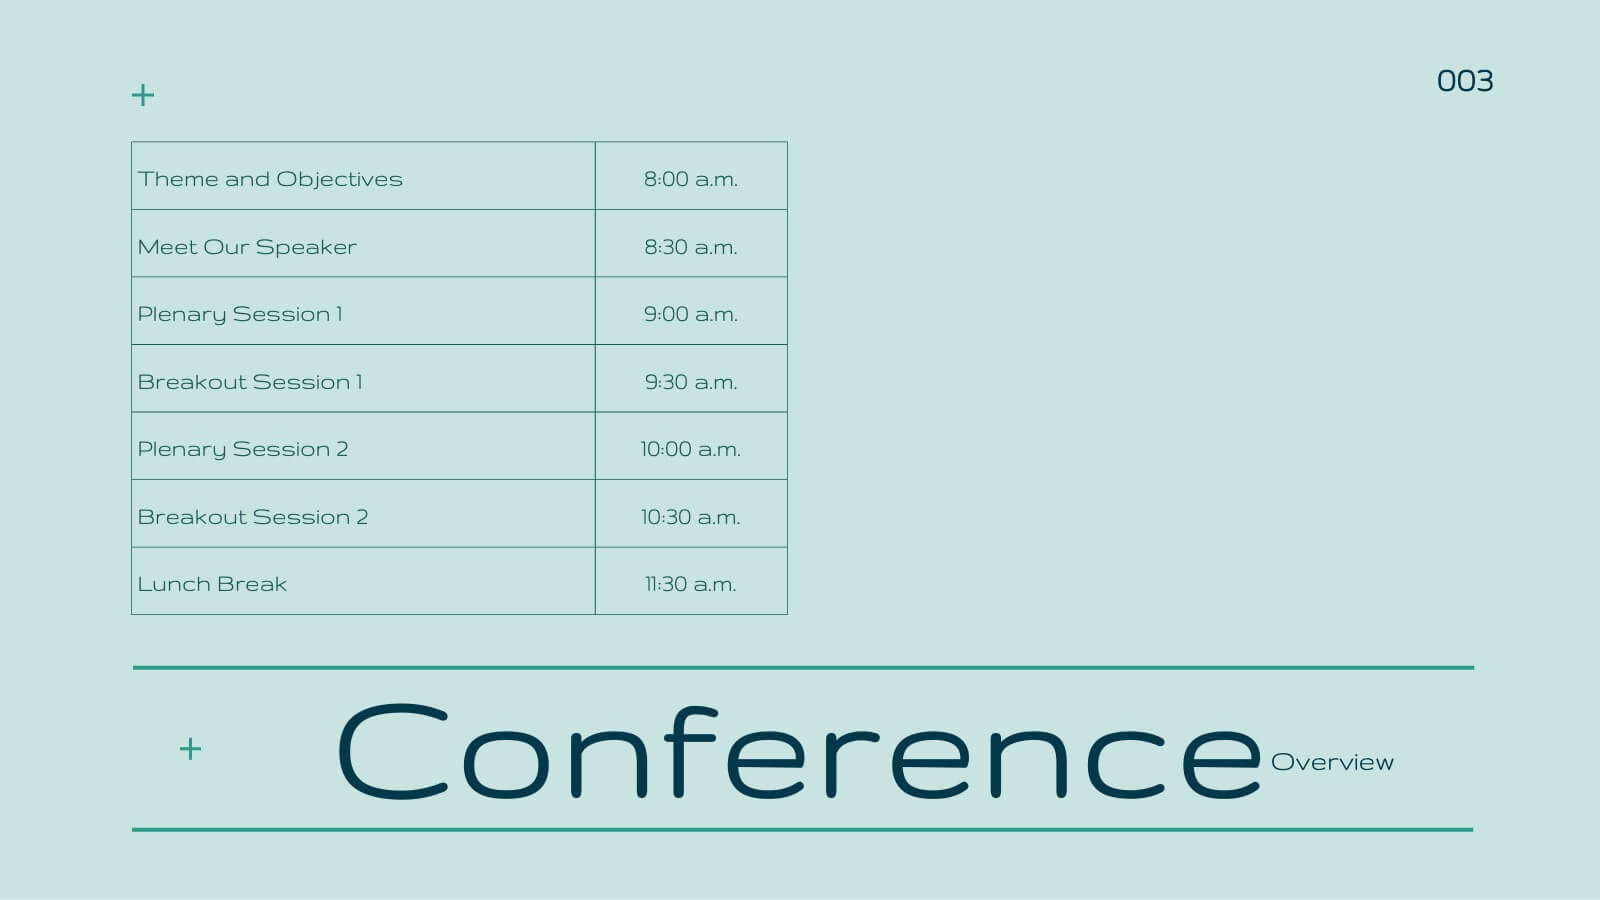
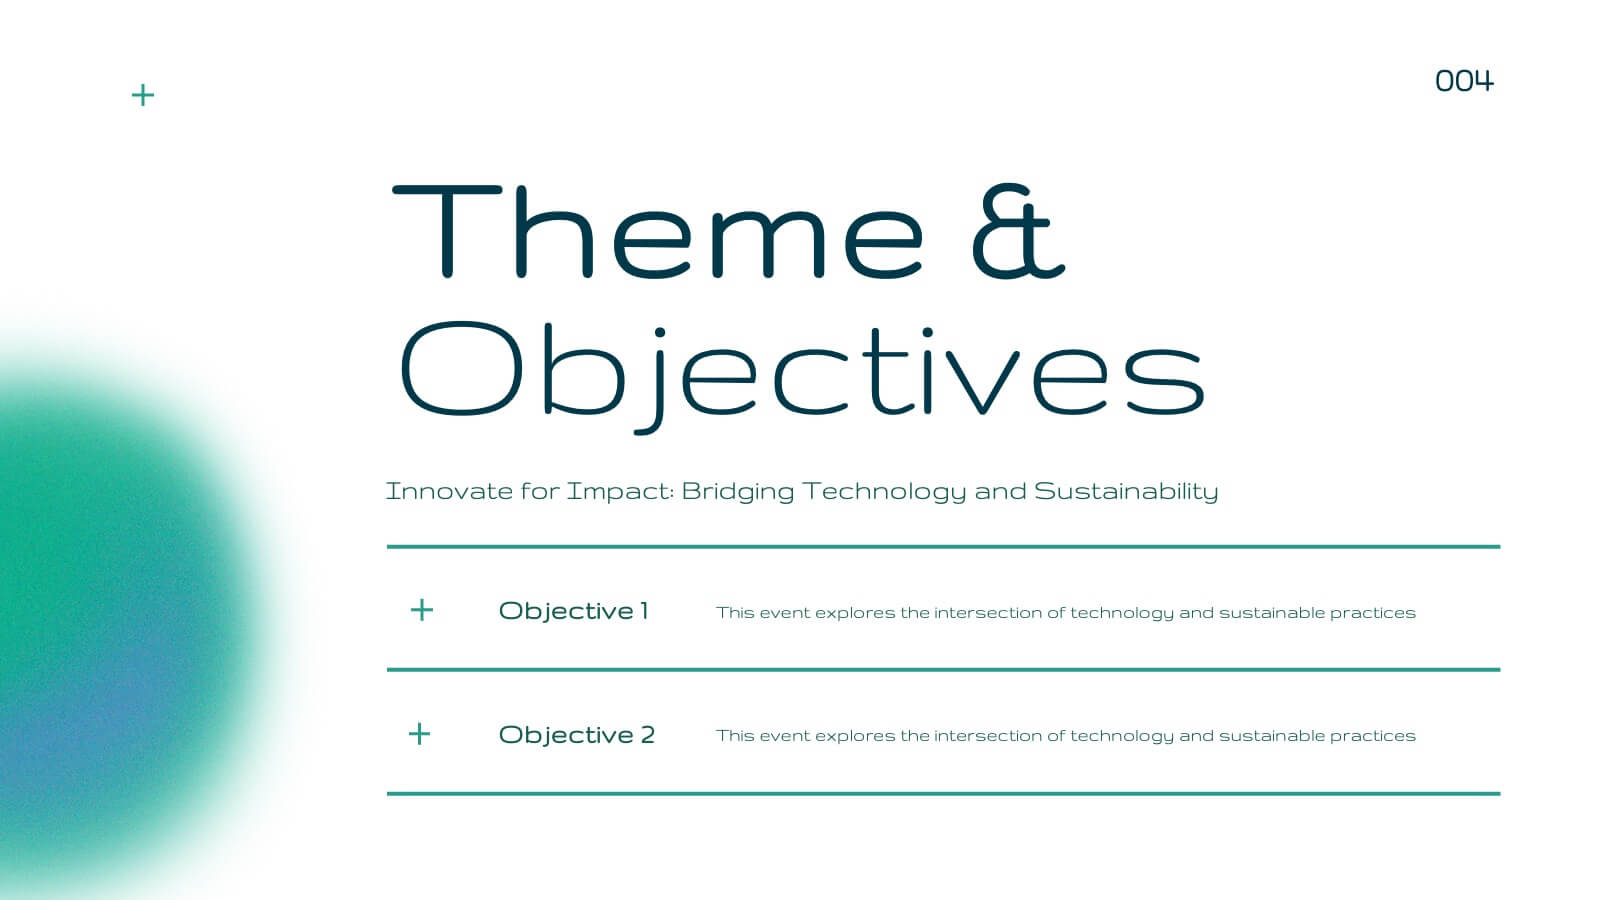
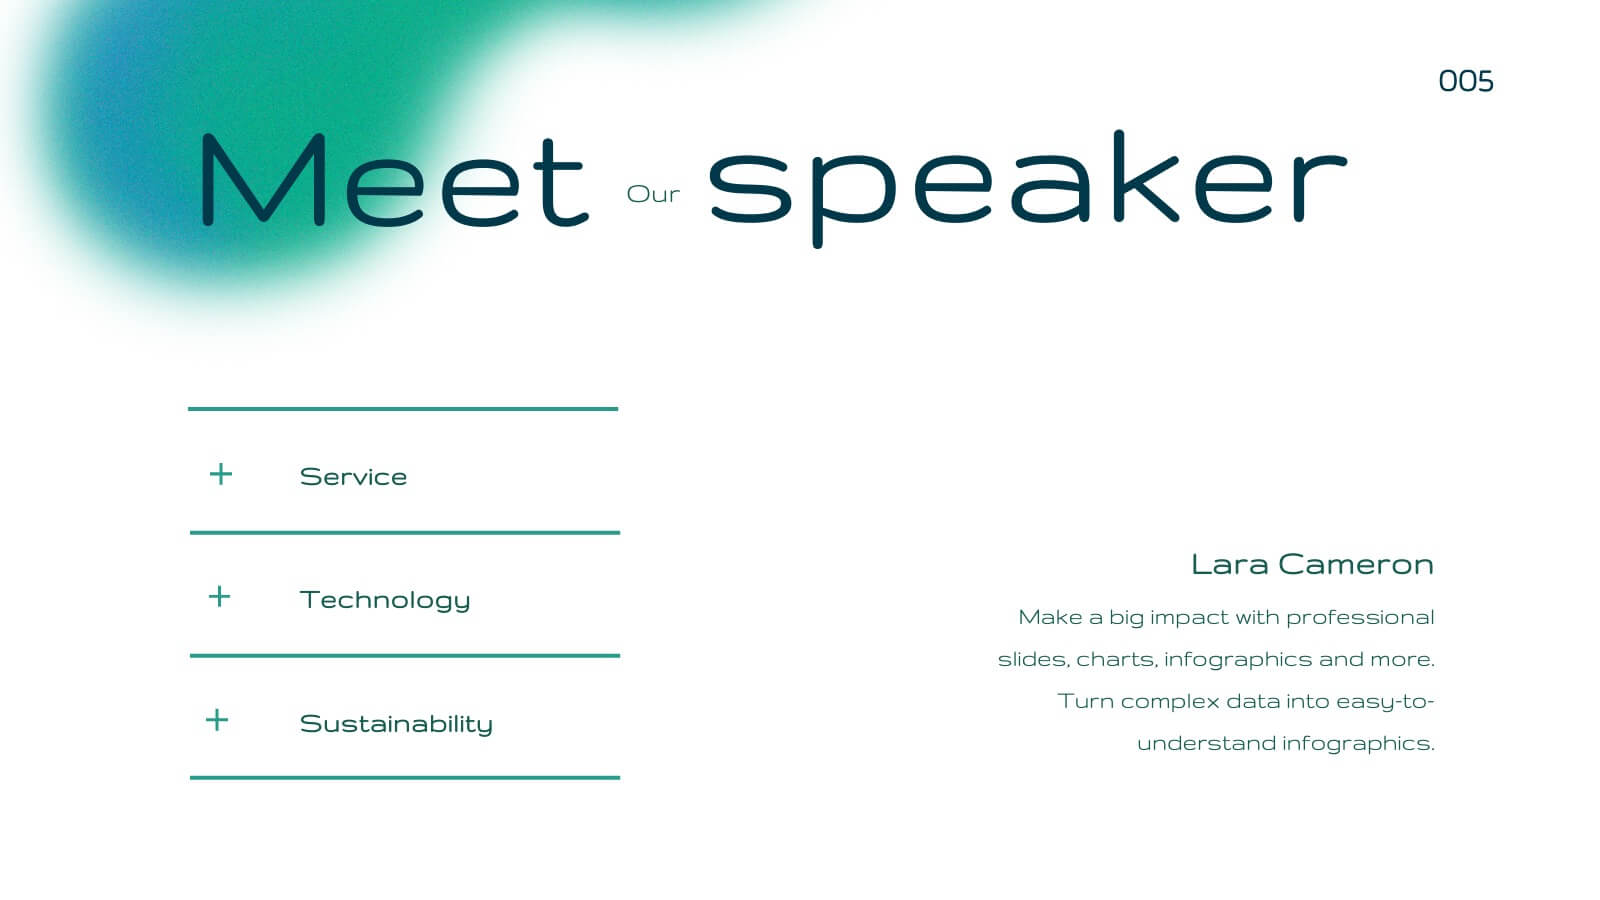
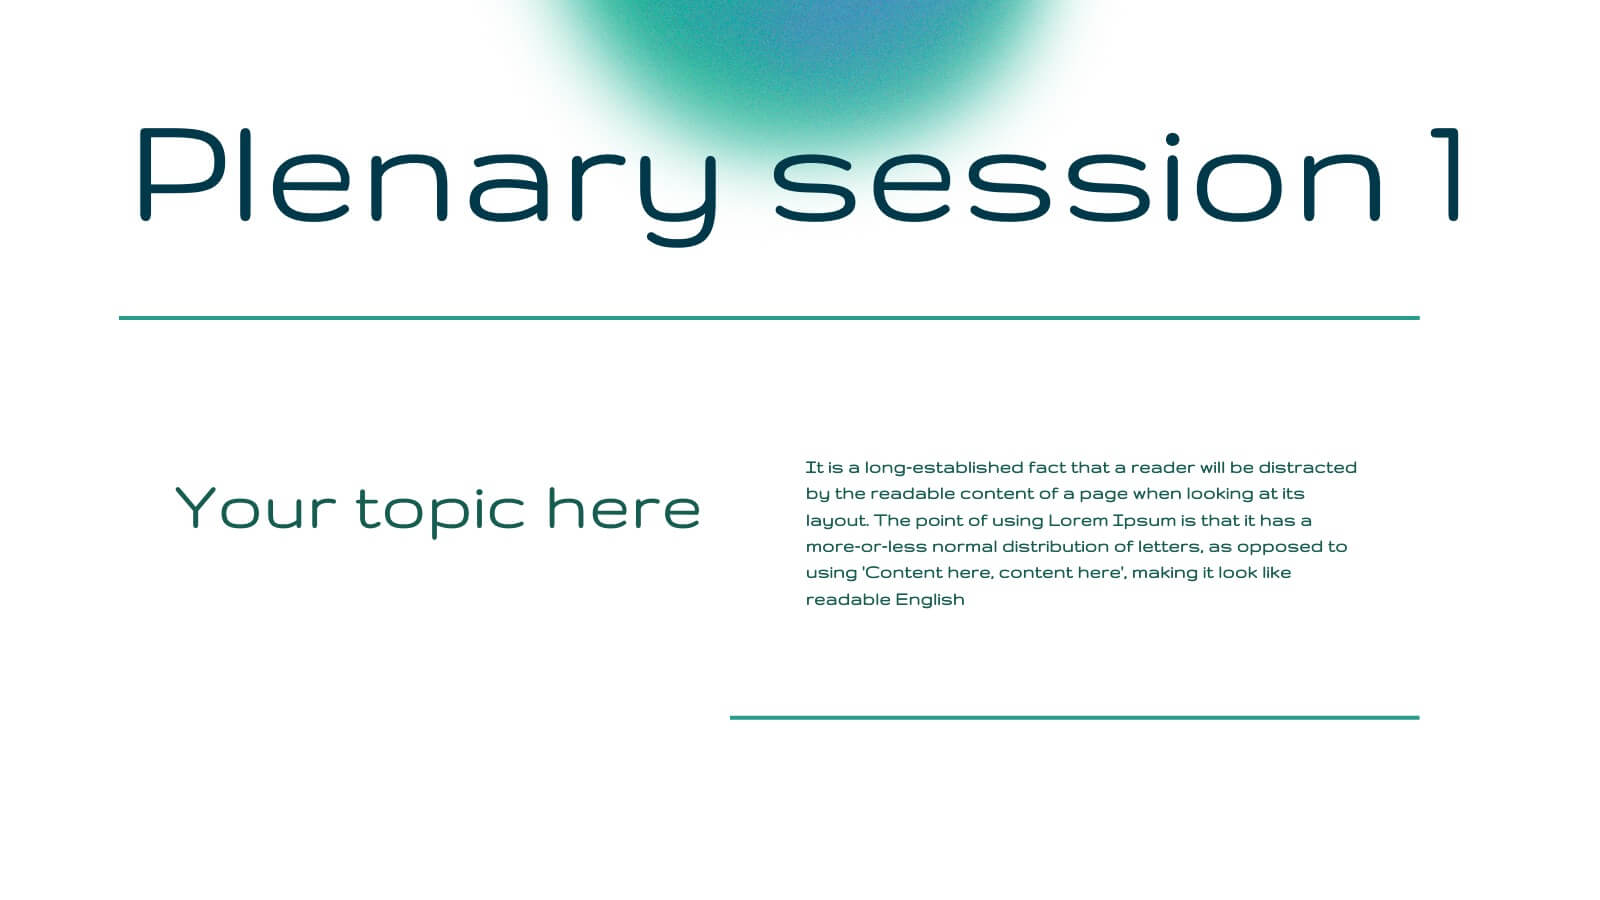
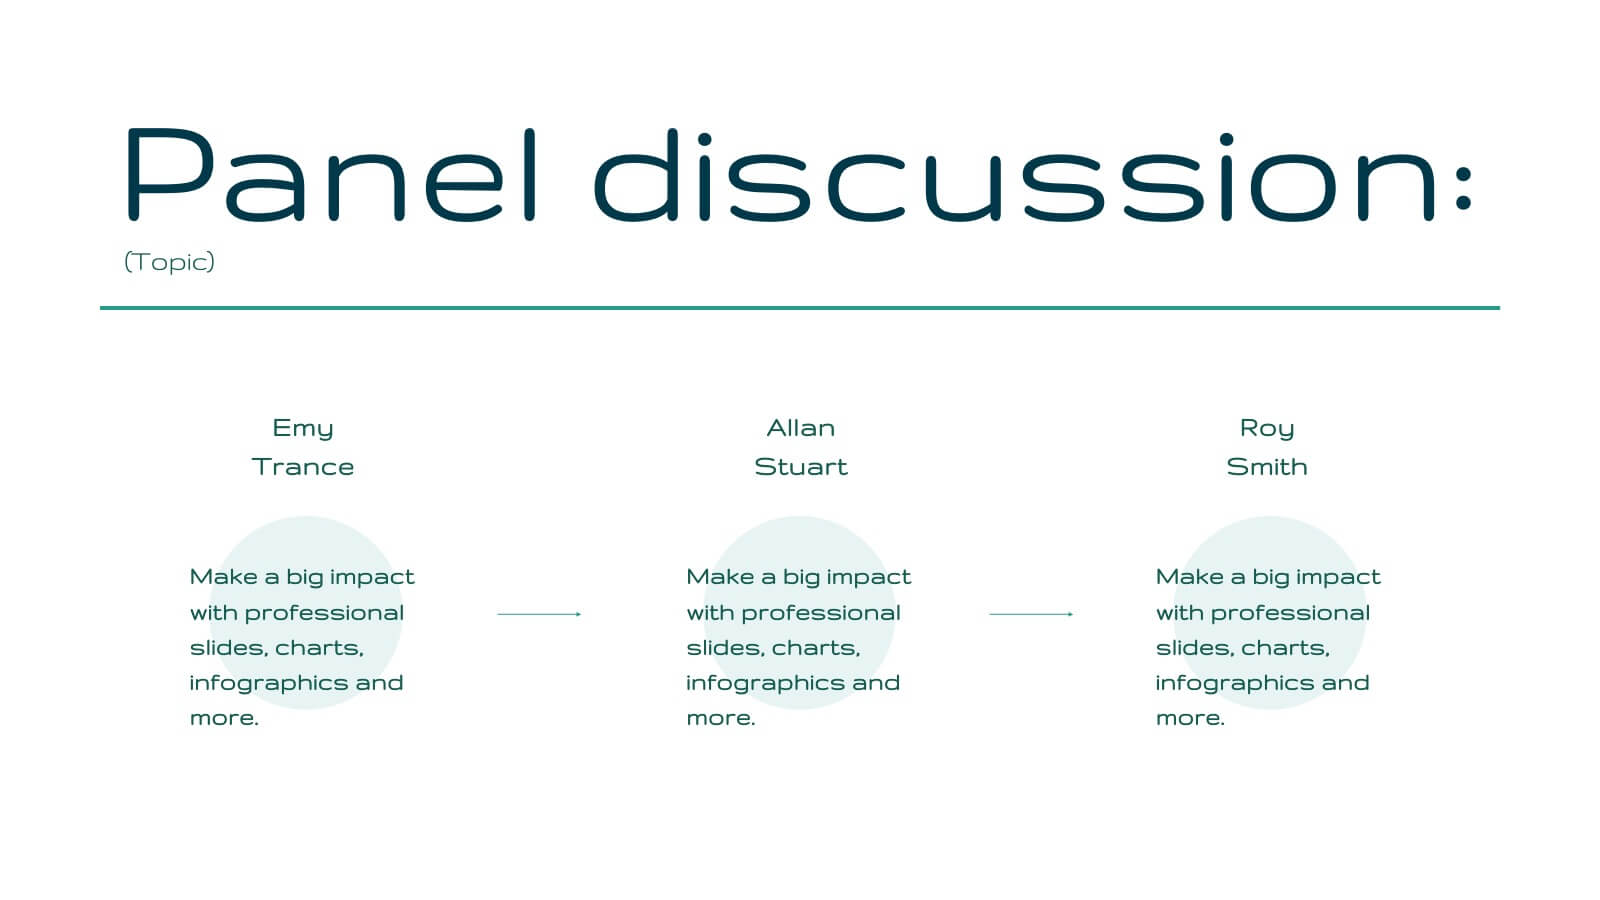
Blaze Business Operations Plan Presentation
Elevate your business presentations with this elegant, modern template designed for comprehensive business operations. Perfect for covering themes, objectives, workshops, and panel discussions, it ensures a professional and engaging delivery. The clean design and structured layout enhance clarity and impact. Compatible with PowerPoint, Keynote, and Google Slides, it’s versatile for any platform.


6 diapositivas
Experience-Based Smile Indicator Slide
Visualize customer sentiment with the Experience-Based Smile Indicator Slide Presentation. Featuring a clean horizontal scale of five emotive icons—from delighted to dissatisfied—this slide is ideal for summarizing user experience, support ratings, or service feedback. Fully customizable in PowerPoint, Keynote, and Google Slides, it's a smart, visual way to display satisfaction levels.


8 diapositivas
Financial Year in Review Annual Report
Showcase your company’s financial performance with clarity using this Financial Year in Review Annual Report slide. Featuring a dynamic line graph, currency visuals, and segmented insights, this slide is perfect for summarizing revenue trends and year-end highlights. Fully customizable in PowerPoint, Keynote, and Google Slides.


7 diapositivas
Customer Success Journey Infographic
A customer journey infographic is a visual representation of your customer's experience with your company. It can help you gain insight into where they're struggling and how they feel about your product or service. This infographic template will help you understand the top factors that influence your customers' decisions, including the most common problems they face. With this template you'll also learn how their behaviors change over time—and how to structure marketing campaigns that stay with them throughout their journey. Fully customizable and compatible with Powerpoint, Keynote, and Google Slides.


6 diapositivas
Data Visualization Pie Chart Presentation
Present data with clarity using the Data Visualization Pie Chart Presentation template. This professional and fully customizable slide deck is designed for business analysts, marketers, and data scientists to showcase key insights in an engaging and visually impactful way. Featuring a modern pie chart layout, it simplifies complex information for clear communication. Compatible with PowerPoint, Keynote, and Google Slides.


21 diapositivas
Delta Marketing Campaign Presentation
This dynamic Marketing Campaign template covers everything from market presence to target audience and financial highlights. With a sleek, professional design, it helps you showcase your brand’s unique selling points and industry recognition. Compatible with PowerPoint, Keynote, and Google Slides for easy, impactful presentations.


34 diapositivas
MVP Startup
An MVP Startup is a type of business that focuses on developing and launching a minimal version of their product or service with the basic features required to test its viability in the market and gather feedback. This template is designed with a bold and dynamic red color palette, perfect for start-ups that want to convey a sense of passion, innovation, and urgency. It features a range of customizable slides that are specifically tailored for start-up presentations to showcase your MVP concept, market validation, and growth strategy. Compatible with Powerpoint, Keynote, and Google slides, all 34 slides are fully editable.


6 diapositivas
5-Level Risk Assessment Diagram Presentation
Simplify complex risk analysis with a clean, layered design that walks your audience through five key levels of impact and probability. Perfect for corporate reports, project management, or strategic planning, this presentation ensures clarity and engagement. Fully compatible with PowerPoint, Keynote, and Google Slides for easy customization.


21 diapositivas
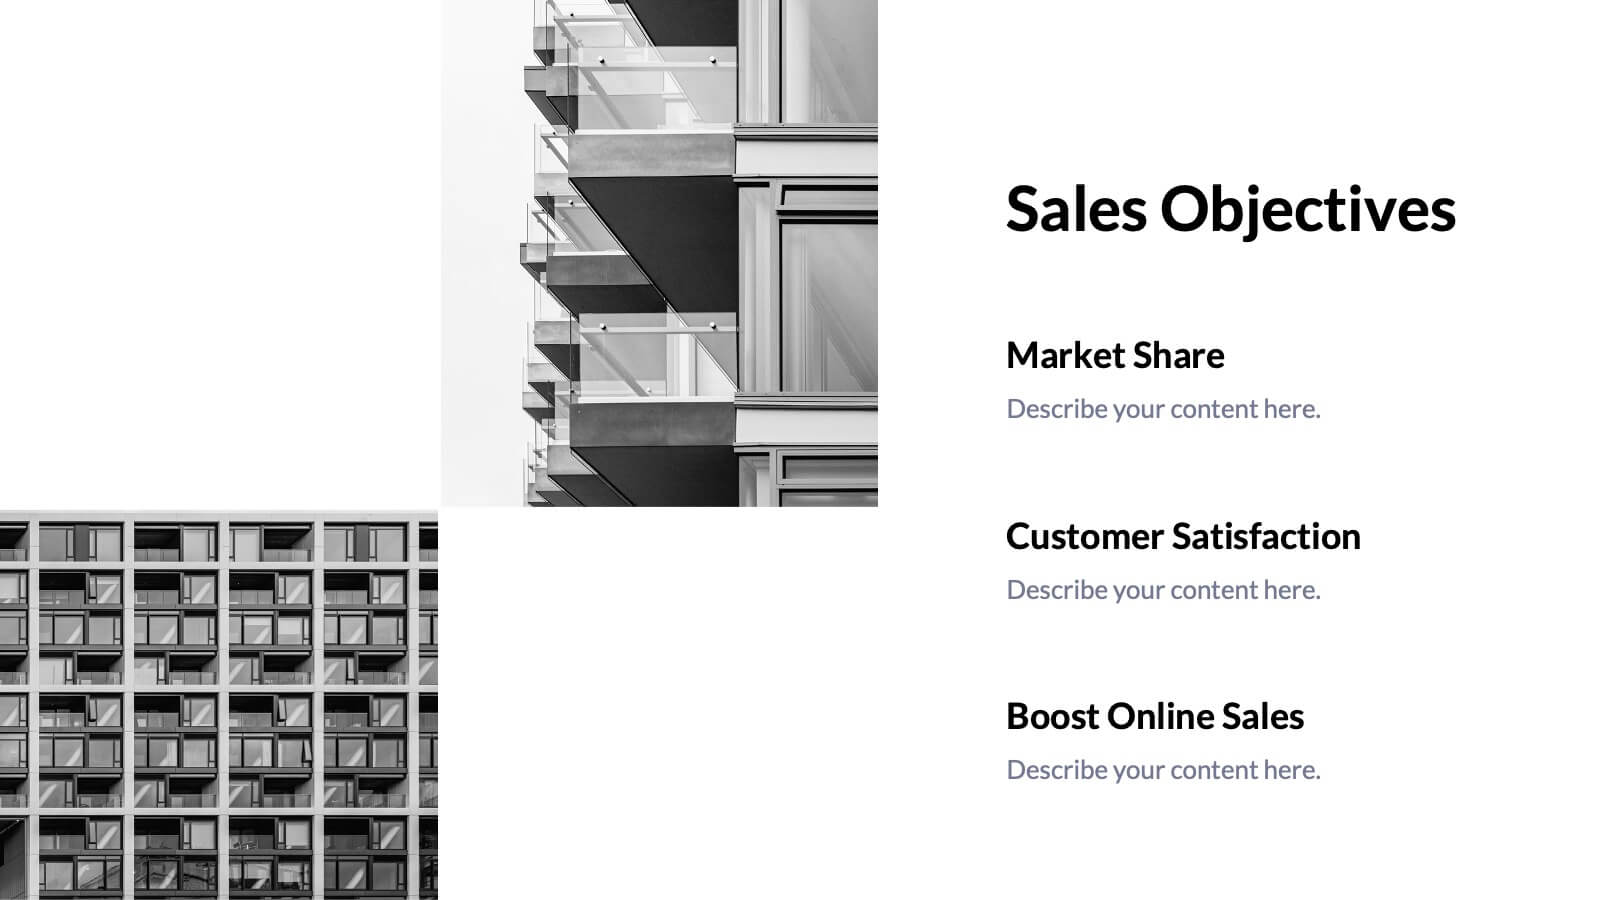
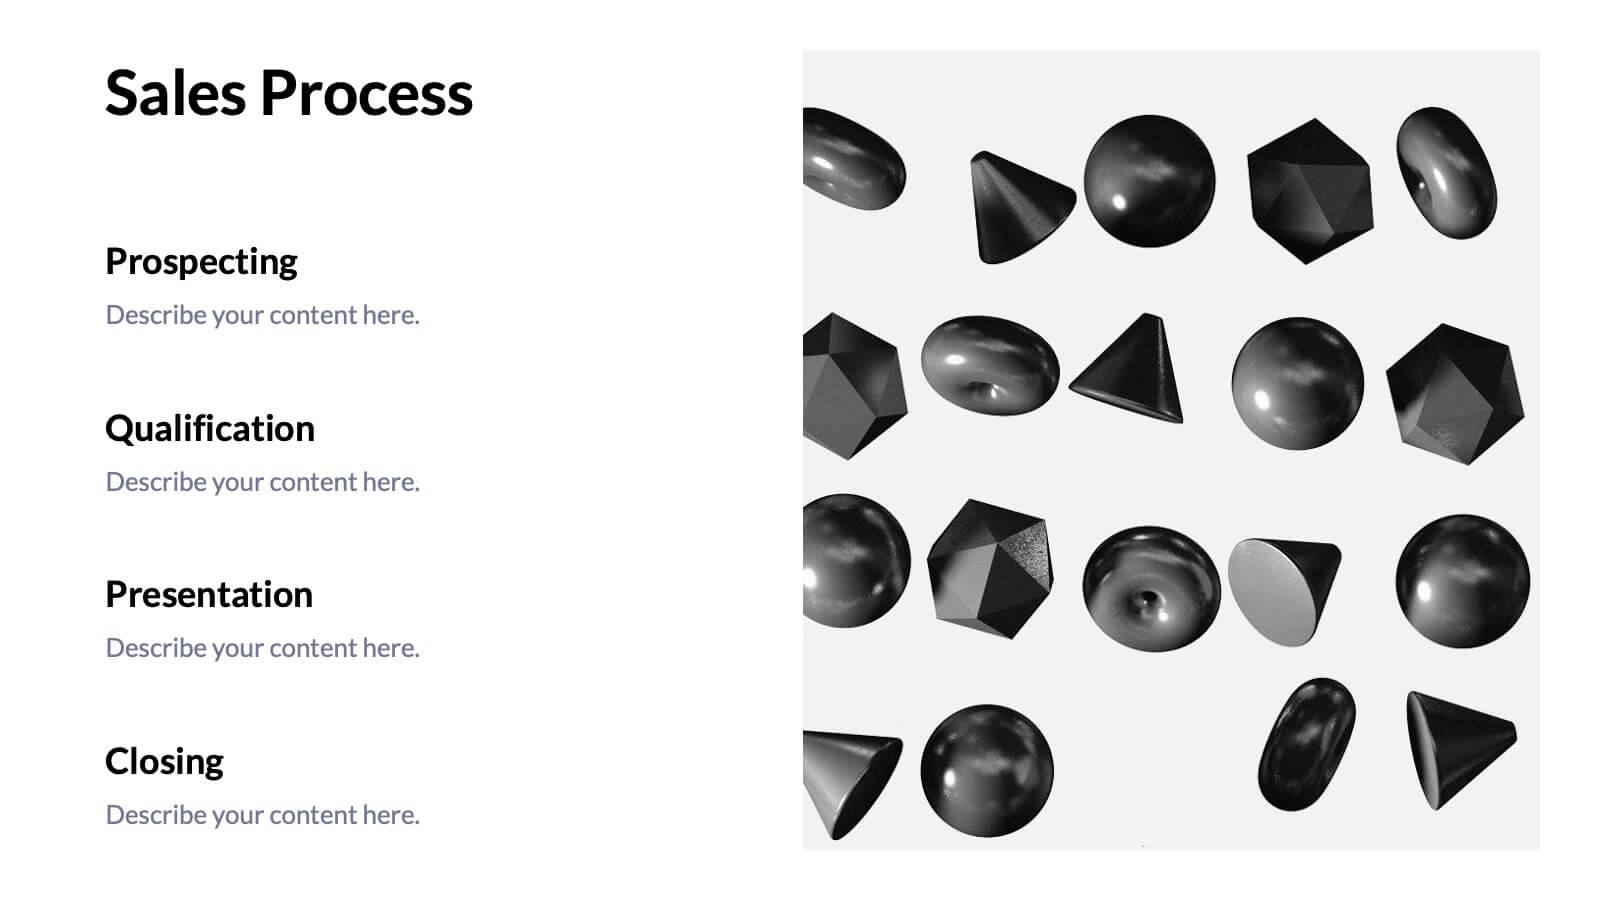
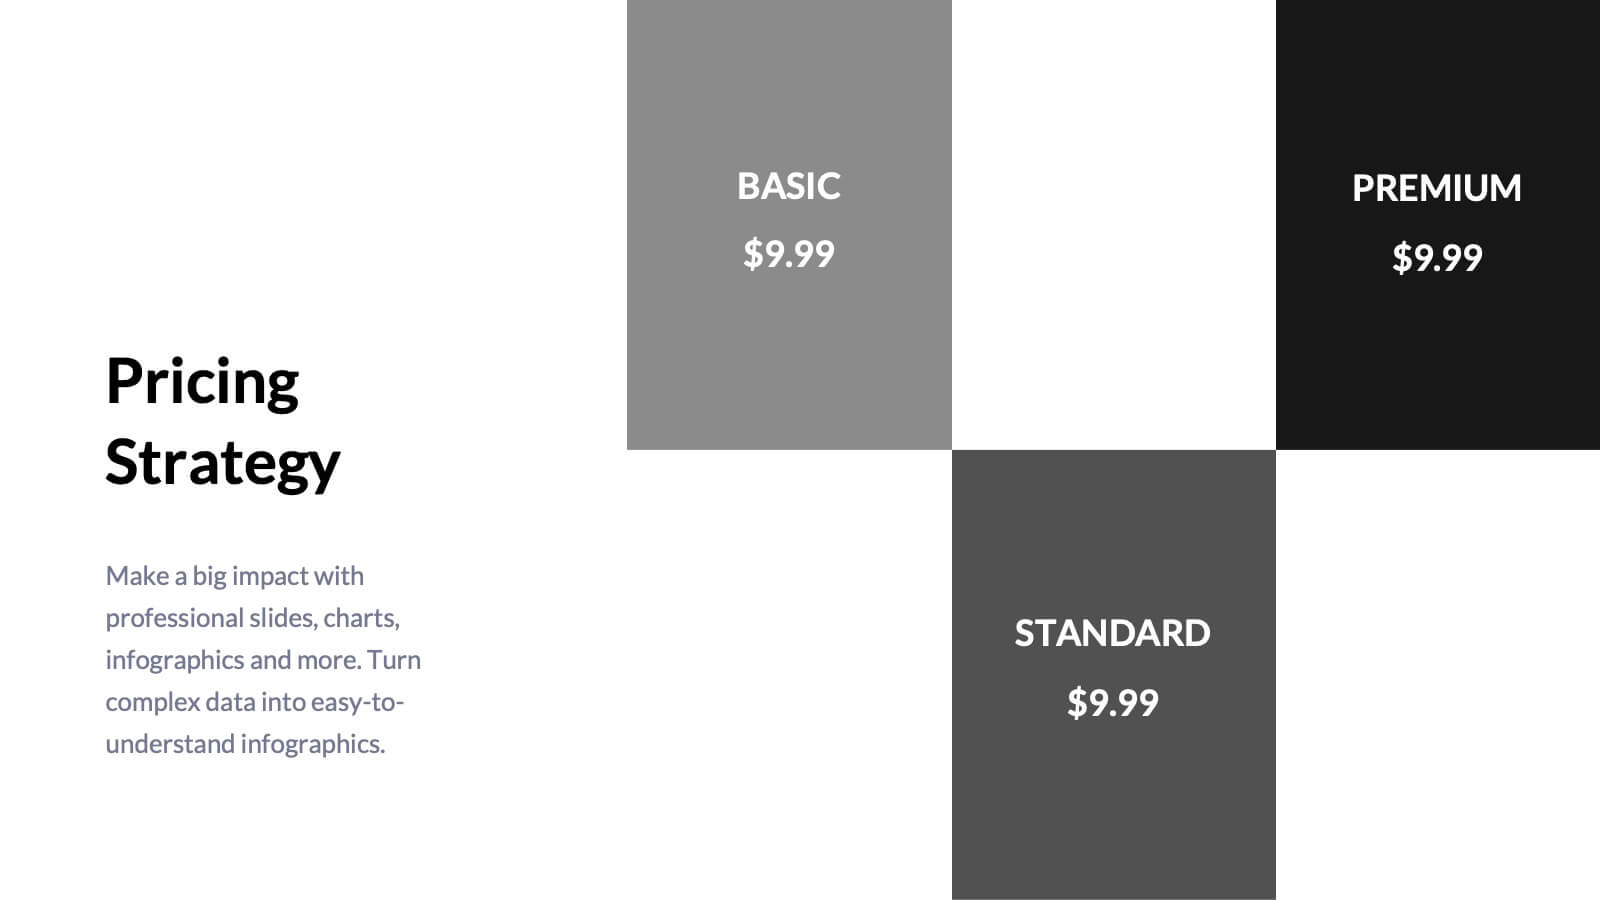
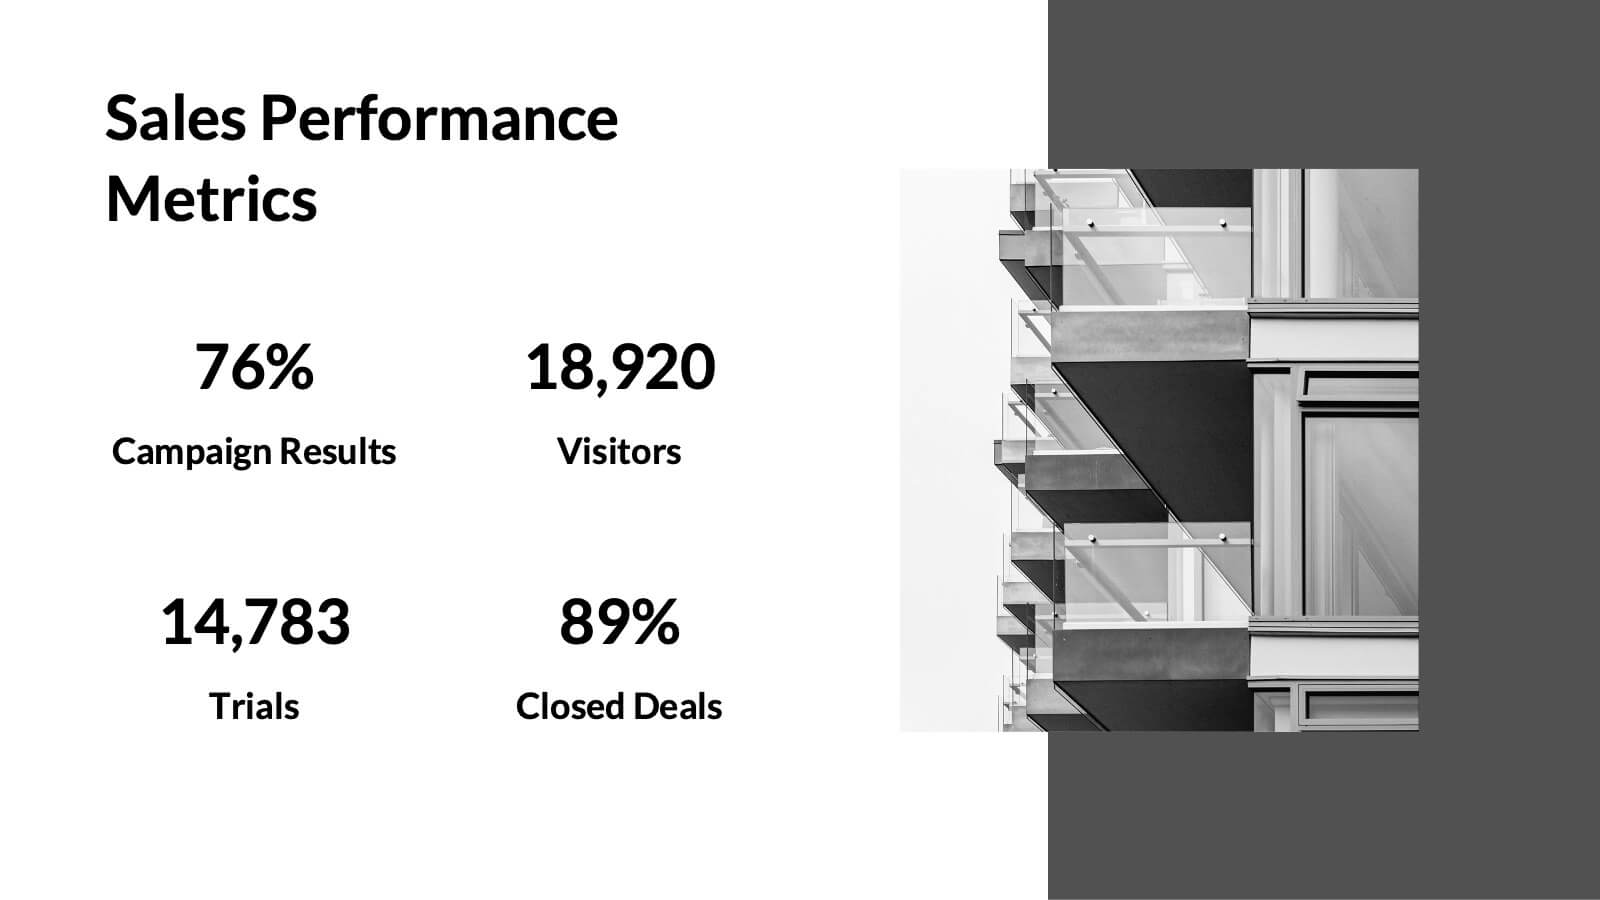
Tempest Sales Performance Report Presentation
Supercharge your sales presentations with this sleek, professional template. Perfect for outlining sales objectives, processes, and performance metrics, it features a clean, minimalist design that enhances clarity and impact. Highlight key elements like competitive analysis, pricing strategy, and future opportunities to captivate your audience. Compatible with PowerPoint, Keynote, and Google Slides, it ensures seamless presentations on any platform.


8 diapositivas
Business Strategy Planning Presentation
Strategize with Impact using this Business Strategy Planning Presentation template. This slide provides a visually compelling roadmap to outline key business strategies, objectives, and growth plans in an easy-to-follow format. Perfect for corporate meetings, executive briefings, and business planning sessions, this template ensures your business vision is communicated clearly and effectively. Fully editable and available for PowerPoint, Keynote, and Google Slides for seamless customization.


8 diapositivas
Political, Economic, Social Analysis Presentation
Highlight key external influences with the Political, Economic, Social Analysis Presentation. This clean, hexagon-based layout offers a simple yet impactful way to break down PEST factors for strategy planning, market entry, or business reports. Fully editable in PowerPoint, Canva, and Google Slides for fast, polished presentations.


6 diapositivas
Executive Summary of Findings Presentation
Summarize your key insights with clarity using this Executive Summary of Findings slide. Designed with a centered target icon and surrounding data points, it’s ideal for spotlighting major conclusions. Fully editable in PowerPoint, Keynote, and Google Slides.


21 diapositivas
Mystara Project Status Report Presentation
Keep stakeholders informed with this clean and professional project status report template. Cover key areas such as performance metrics, financial summaries, team productivity, and future priorities. Perfect for tracking progress and making data-driven decisions. Fully customizable for PowerPoint, Keynote, and Google Slides.


8 diapositivas
Sales Funnel AIDA Strategy Presentation
Streamline your marketing approach with the Sales Funnel AIDA Strategy Presentation template. Designed to visualize the Attention, Interest, Desire, and Action (AIDA) Model, this engaging funnel graphic effectively illustrates how to guide potential customers through the sales journey. Ideal for marketers, sales teams, and business strategists, this fully customizable template is compatible with PowerPoint, Keynote, and Google Slides.


5 diapositivas
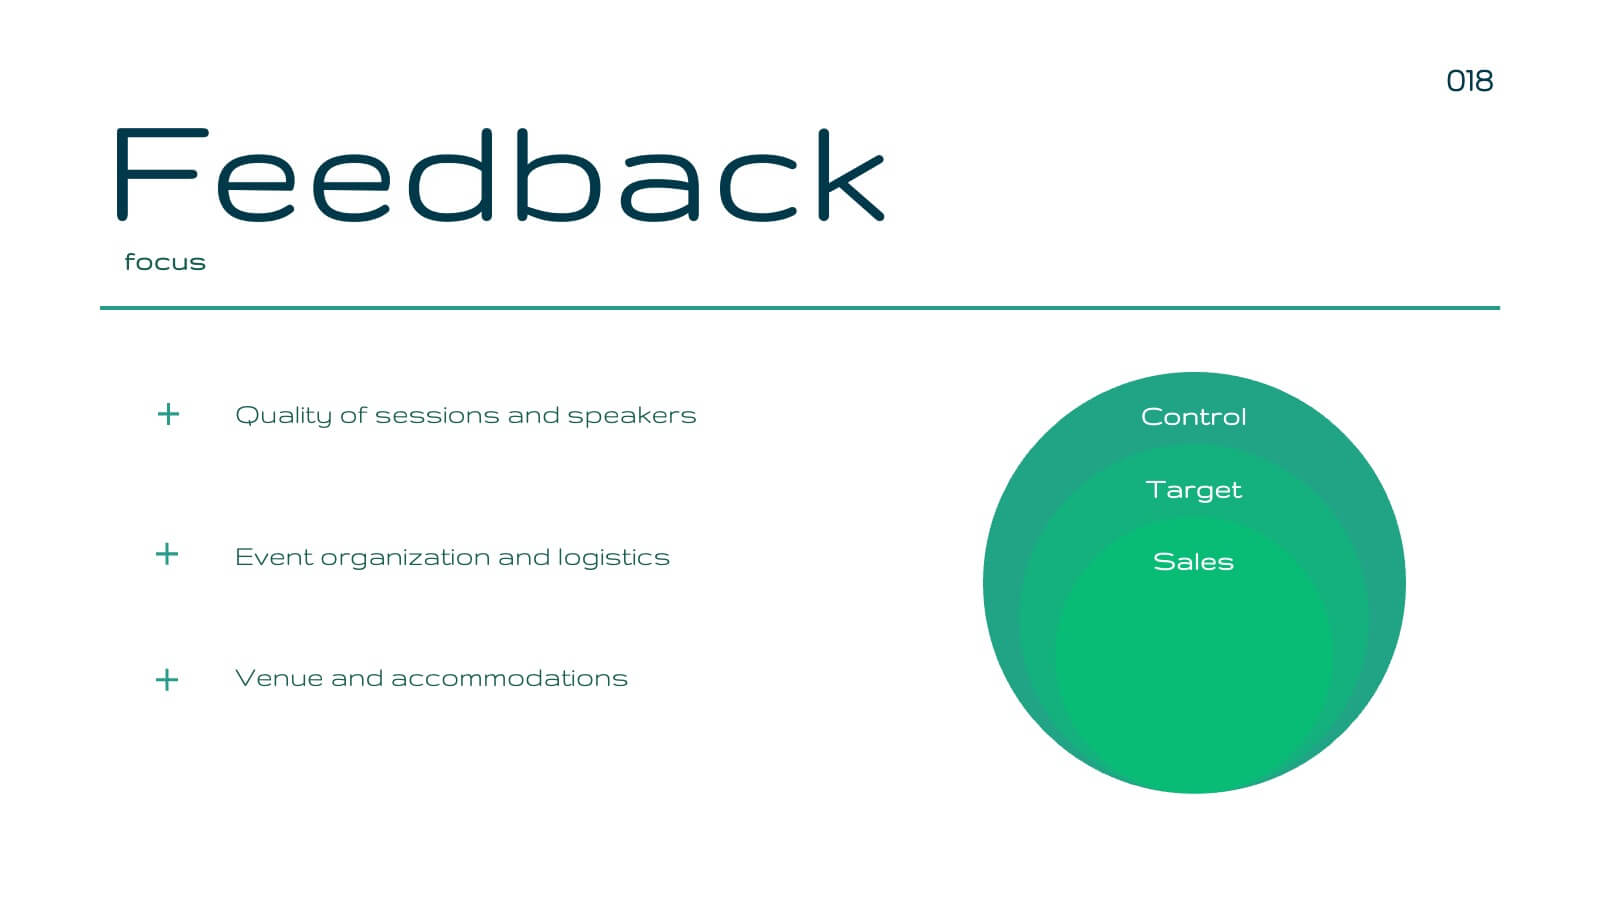
Sales Pipeline and Forecast Overview Presentation
Keep your sales strategy clear and forward-focused with the Sales Pipeline and Forecast Overview Presentation. This sleek, icon-based slide walks viewers through five key stages—each represented by a bold, color-coded ring and customizable title. Perfect for showcasing sales funnels, forecasting performance, or illustrating workflow phases. Fully editable in Canva, PowerPoint, and Google Slides.


7 diapositivas
Agriculture Infographics Presentation Template
Our Agriculture Infographic template is a great way to present your information about the structure, process and procedures of agricultural. This template includes a set of slides with illustrations and charts that will help you make an eye-catching presentation in just minutes. This template has been designed for use in PowerPoint, and is well-suited for both personal and business use. This infographic template is a perfect choice for presenting the statistical data about agriculture, such as product and service, market share and revenue, production levels and other information.