


Características


¿Tienes alguna pregunta?
Recomendar


7 diapositivas
Business People Infographic Presentation Template
This Business People infographic template is perfect for a business handbook, corporate presentation and briefing. This template is designed with subtle colors and textures, the clean layout makes it easy to highlight important data and the many components that can be used for different purposes. This is a great, clean and simple way for you to display all the information about your business. This infographic can effectively communicate complex information in a simple and easy-to-understand format, making it an ideal medium for exploring the topic of business people and the business world.


8 diapositivas
Corporate Office Scenes Illustrations Presentation
Bring workplace communication to life with this slide featuring an illustrated office meeting scene and a four-point list layout. Each segment is color-coded with accompanying icons, making it ideal for presenting corporate strategies, team roles, or process workflows. Designed for clarity and visual appeal, this slide is perfect for business reports, training decks, or client briefings. Easily customizable in PowerPoint, Keynote, and Google Slides.


6 diapositivas
Effective Leadership Decision-Making Presentation
Enhance decision-making clarity with this Effective Leadership Decision-Making template. Designed for managers, executives, and strategists, this slide visually represents decision paths, prioritization, and leadership impact. Featuring color-coded options and engaging graphics, it helps illustrate the influence of choices on business outcomes. Fully compatible with PowerPoint, Keynote, and Google Slides, making it a seamless addition to your presentations.


5 diapositivas
Relationship Mapping Diagram Presentation
Bring clarity to complex connections with this clean and modern visual layout designed to map relationships, processes, or ideas effortlessly. Perfect for presentations that require structure and flow, it balances simplicity with professionalism. Fully customizable and compatible with PowerPoint, Keynote, and Google Slides for seamless design flexibility.


7 diapositivas
KPI Sales Dashboard Infographic
A KPI (Key Performance Indicator) Dashboard is a visual tool or interface that provides a real-time snapshot of an organization's or a specific department's key performance indicators. Empower your sales team with our KPI sales dashboard infographic template. This visually striking and insightful template allows you to present key performance indicators and metrics in an easily understandable and engaging format. Compatible with Powerpoint, Keynote, and Google Slides. This template will transform your sales data into a dynamic, easy-to-understand dashboard, helping your team stay informed, motivated, and focused on achieving sales targets.


7 diapositivas
Creative Tables Of Content Infographic
A creative table of contents is a visually appealing and innovative way of presenting the structure and contents of a document, report, book, or any written work. Our infographic template is an aesthetically pleasing and insightful map to your content landscape. This infographic is not just a guide; it's a visually engaging journey through your ideas and topics, promising a delightful and organized user experience. Fully customizable and compatible with Powerpoint, Keynote, and Google Slides. This creative table of contents uses design elements, colors, typography, and graphics to make it engaging and eye-catching.


2 diapositivas
Blue Ocean Strategy Map Presentation
Make your message stand out with a clean, visual map that instantly clarifies where opportunities lie. This presentation helps you compare value factors side-by-side, reveal market gaps, and highlight strategic advantages in a simple, structured format. Fully customizable and compatible with PowerPoint, Keynote, and Google Slides.


7 diapositivas
Roadmap Guide Infographic
A roadmap guide is a visual representation of the steps you need to take in order to reach your destination. A roadmap infographic is a great way to show your clients what the future will look like. Use this template to create an infographic that's high-energy, enthusiastic, and engaging. This infographic is designed to help guide you by showing where you are now, what direction you're going, and where you need to go next. This template is fully customizable and compatible with Powerpoint, Keynote, and Google Slides. Break down complex plans into easily digestible visual elements.


10 diapositivas
Agile Sprint Planning with Scrum Board Presentation
Plan and track your sprints effectively with this Agile Scrum Board Template. Featuring customizable “Stories,” “To Do,” “In Progress,” and “Testing” columns, this layout helps visualize workflow and team tasks clearly. Perfect for scrum masters and agile teams. Compatible with PowerPoint, Keynote, and Google Slides for easy editing.


21 diapositivas
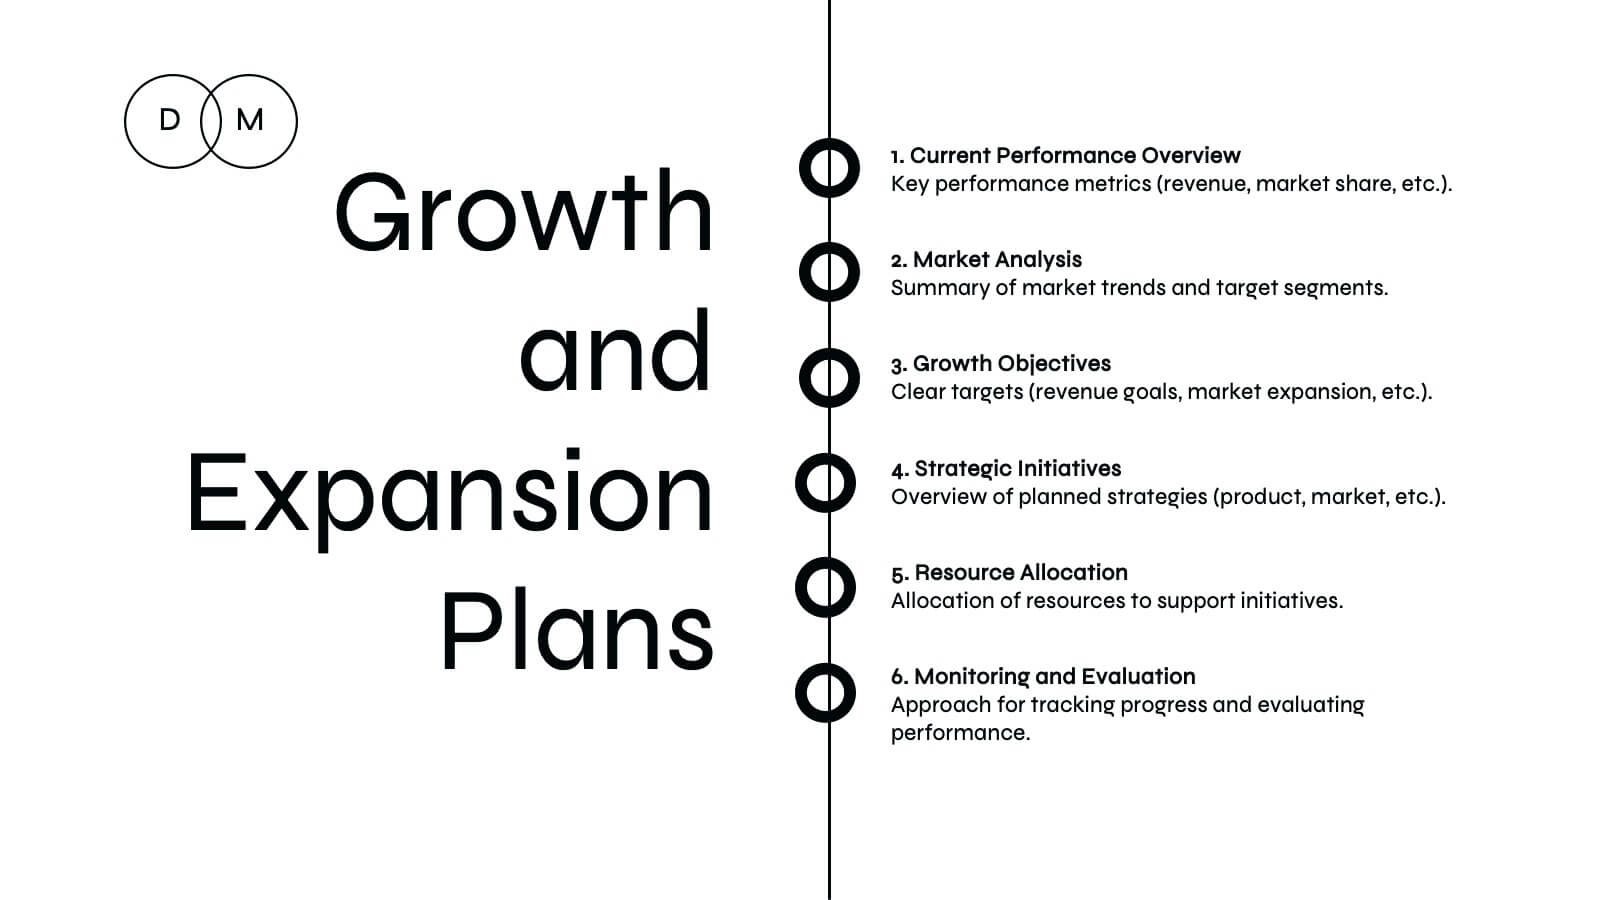
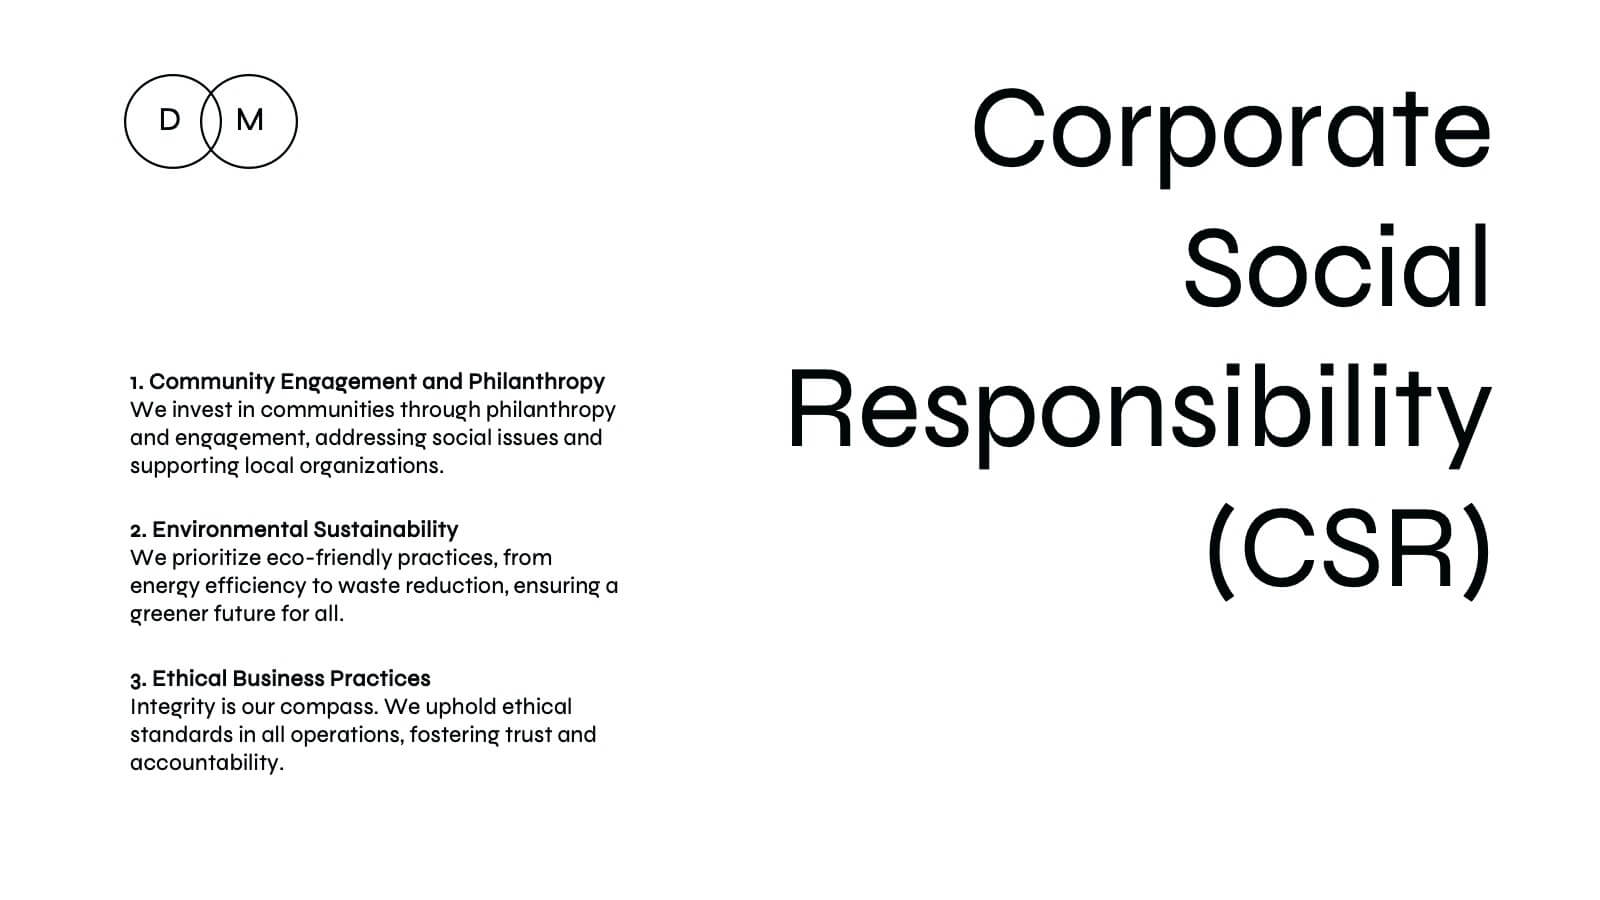
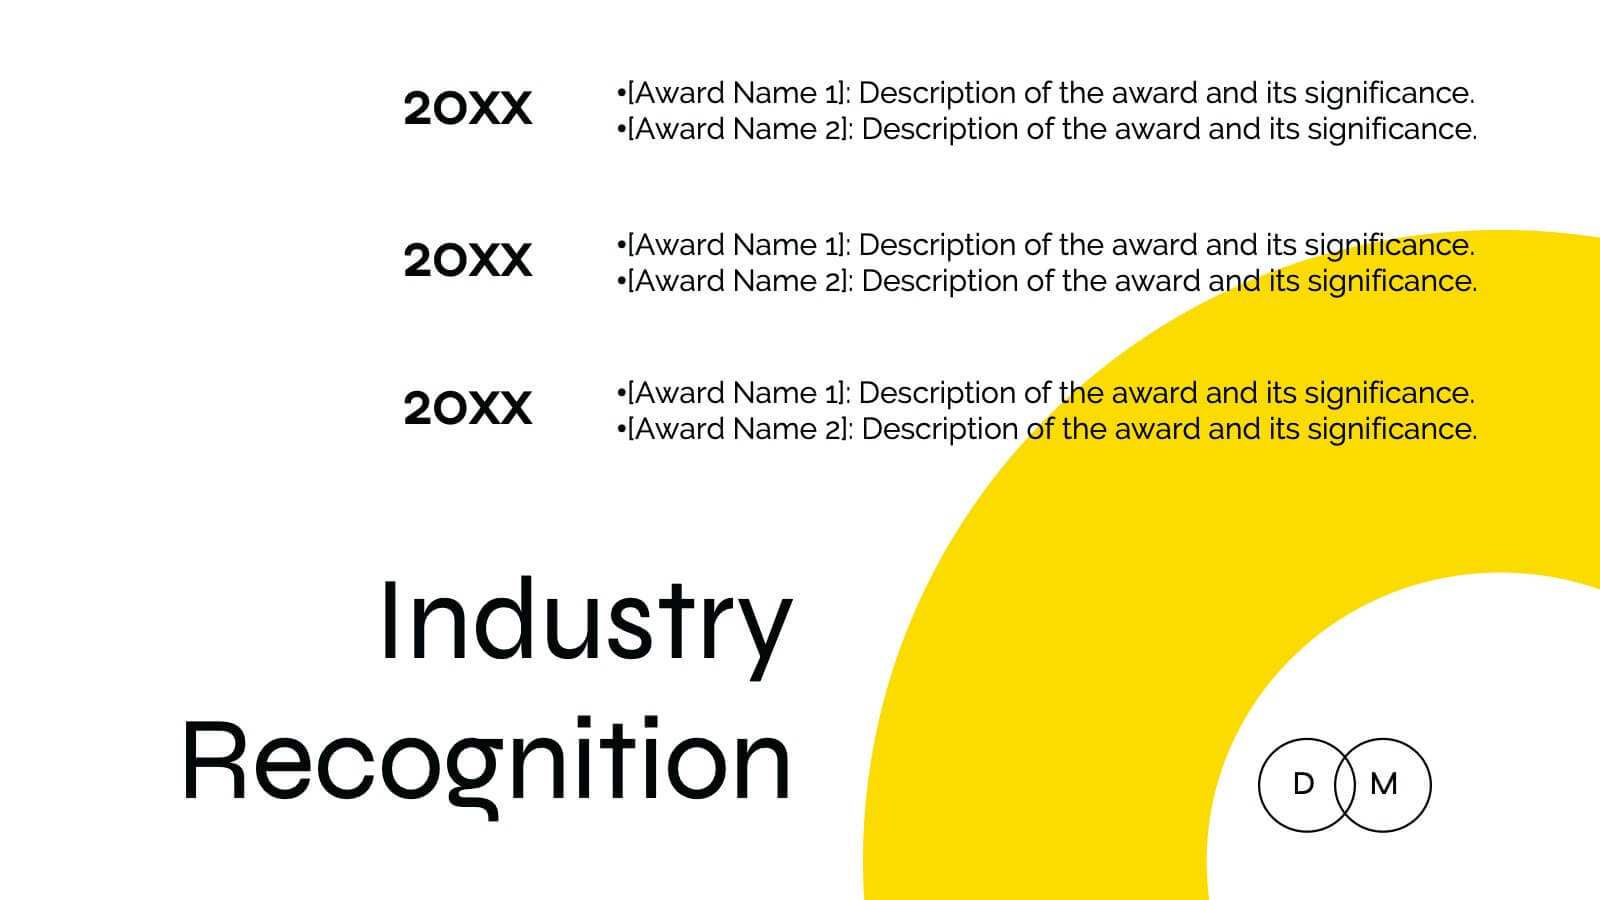
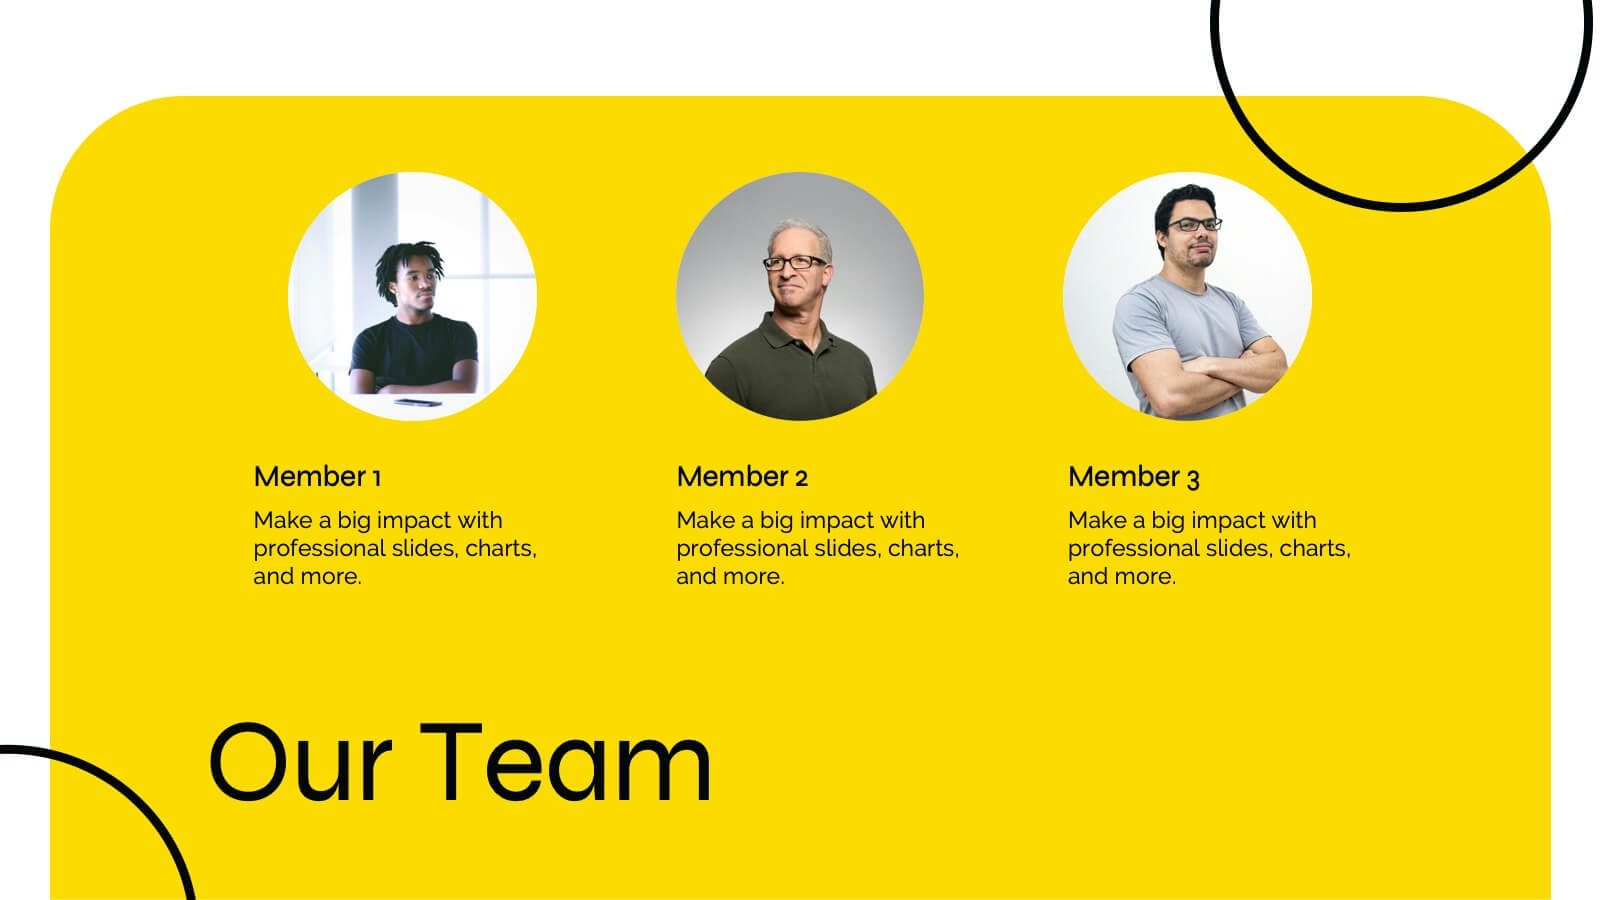
Novaeon Corporate Strategy Proposal Presentation
A sleek and professional presentation template designed for strategy proposals. Includes slides for SWOT analysis, growth opportunities, strategic initiatives, and performance metrics. Fully customizable to fit any corporate need, ensuring impactful communication. Compatible with PowerPoint, Keynote, and Google Slides for seamless presentations.


4 diapositivas
Side by Side Comparison Presentation
Enhance your presentations with our "Side by Side Comparison Presentation" template. Designed for clarity, this infographic facilitates effective comparison of key business insights across multiple categories using a side-by-side layout. Color-coded arrows distinctly mark each comparison point, ensuring easy navigation and comprehension. Ideal for strategic reviews, product comparisons, or competitive analyses, this template helps present complex data clearly and engagingly. Its structured format is perfect for professionals looking to articulate differences and similarities effectively. Fully compatible with PowerPoint, Keynote, and Google Slides, it's an indispensable tool for those needing to present comparative data succinctly and persuasively.


5 diapositivas
Ecological Impact Reduction Strategies Presentation
Present your sustainability efforts with the Ecological Impact Reduction Strategies Presentation. This tree-inspired layout is perfect for outlining key eco-friendly initiatives, from waste management to energy efficiency. Clean visuals and editable elements make it easy to adapt for environmental proposals, reports, or team planning. Fully customizable in Canva, PowerPoint, or Google Slides.


5 diapositivas
Types of Photography Infographics
There are various types of photography that cater to different subjects, styles, and purposes. These vertical infographics are designed to serve as a comprehensive guide for individuals interested in exploring different genres and styles of photography. These will allow you to provide an overview of different genres and types of photography. They aim to inform viewers about the diverse fields of photography, allowing them to explore various styles and find their areas of interest. Whether used in photography workshops, educational materials, or creative presentations, this template provides valuable insights and inspiration for individuals passionate about the art of photography.


22 diapositivas
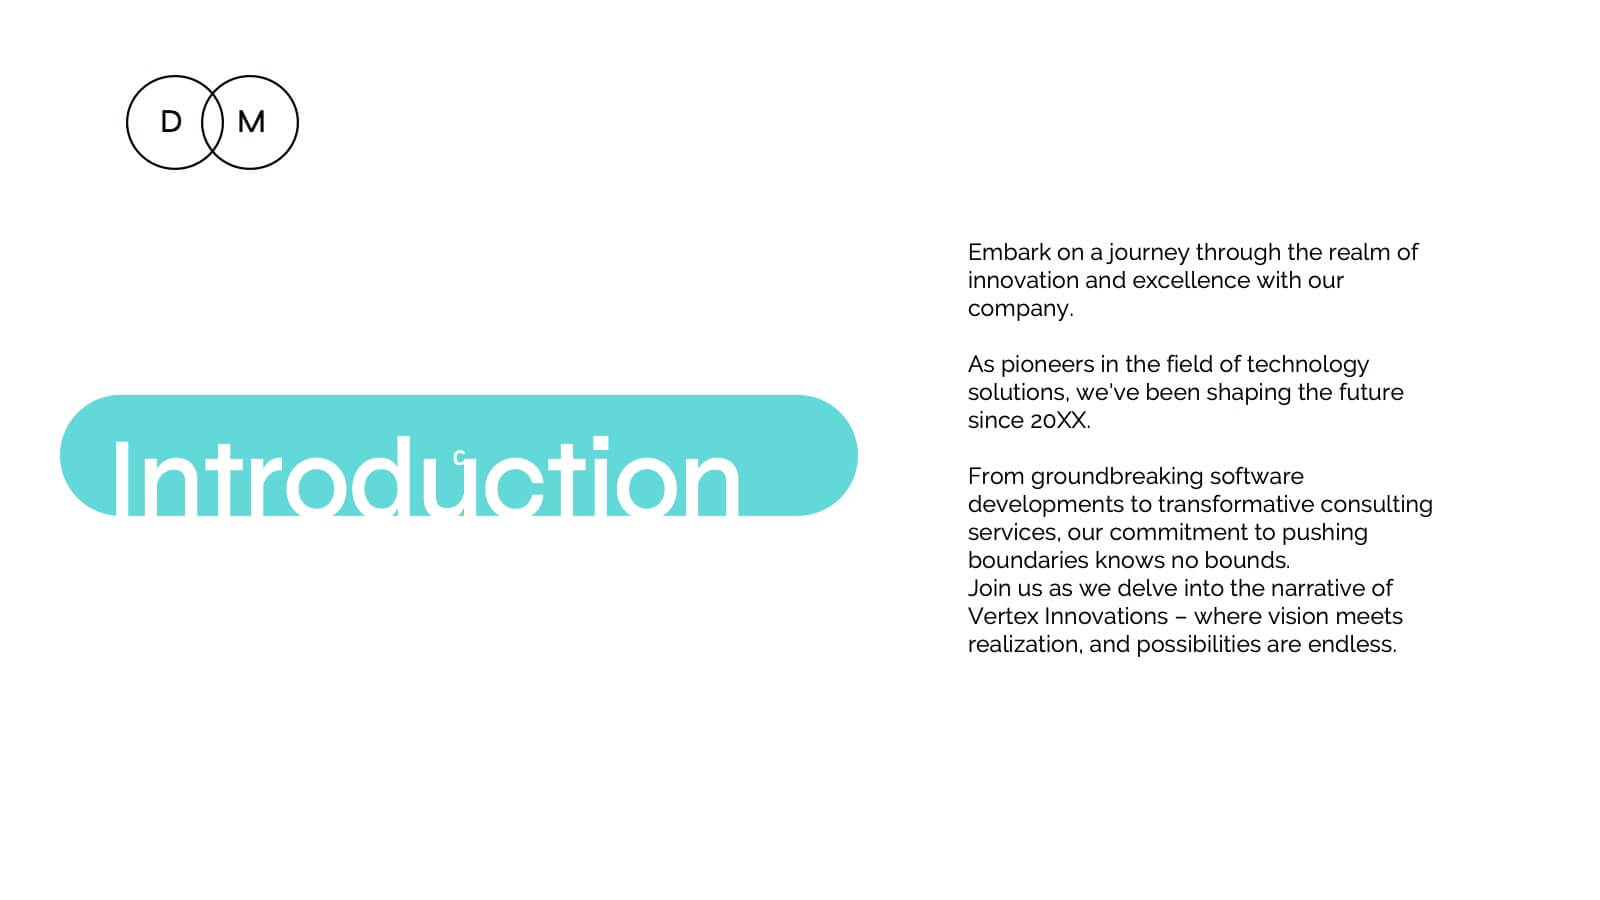
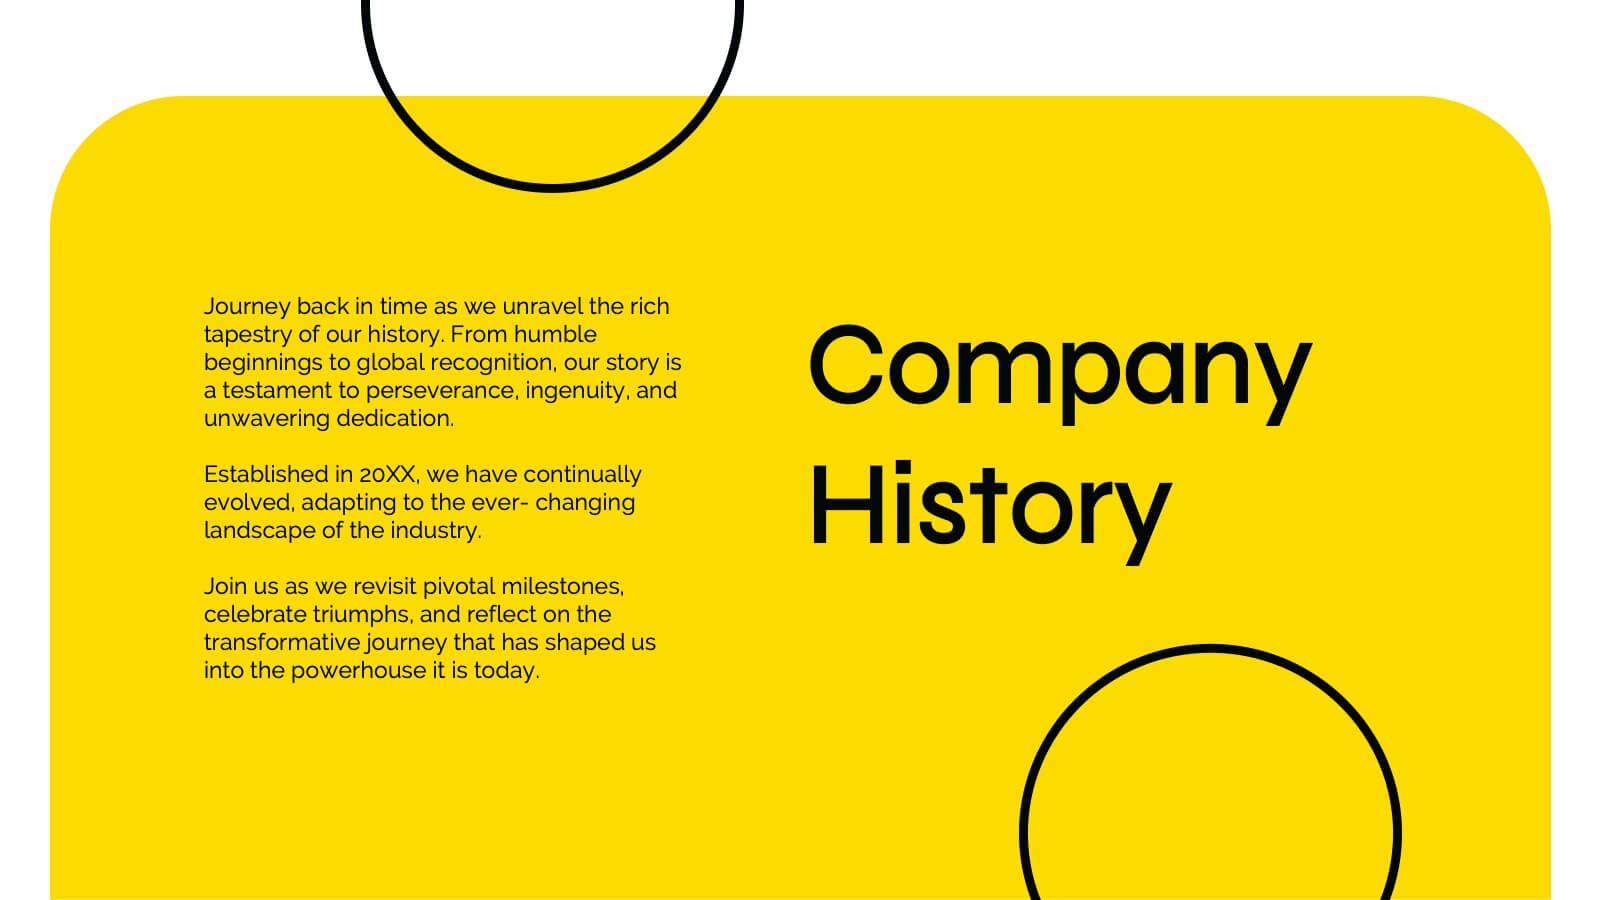
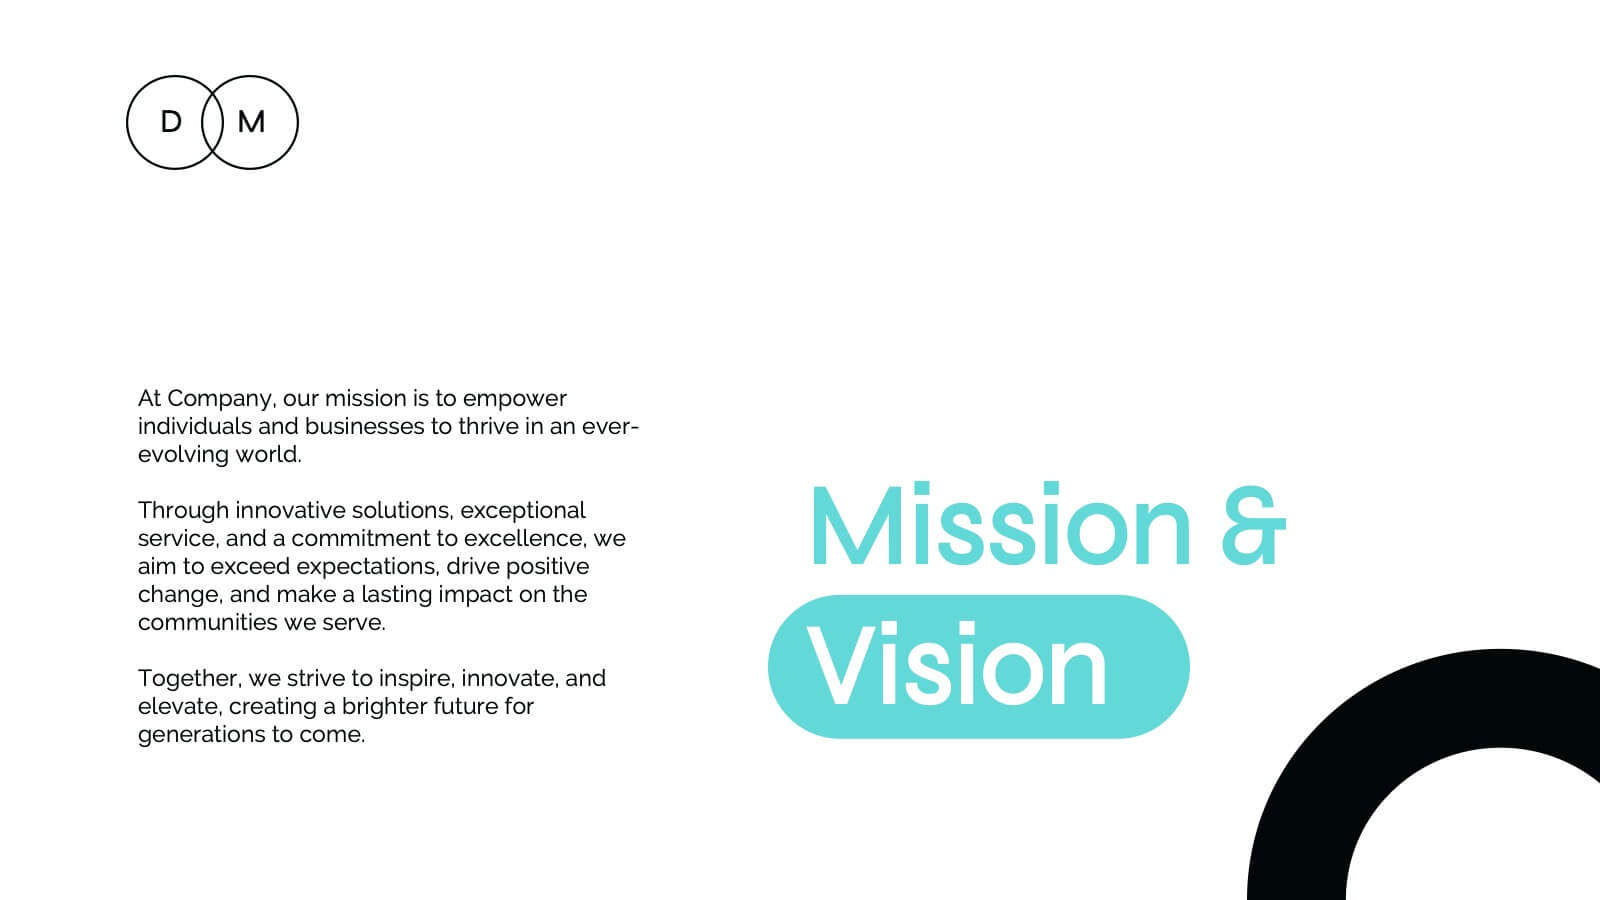
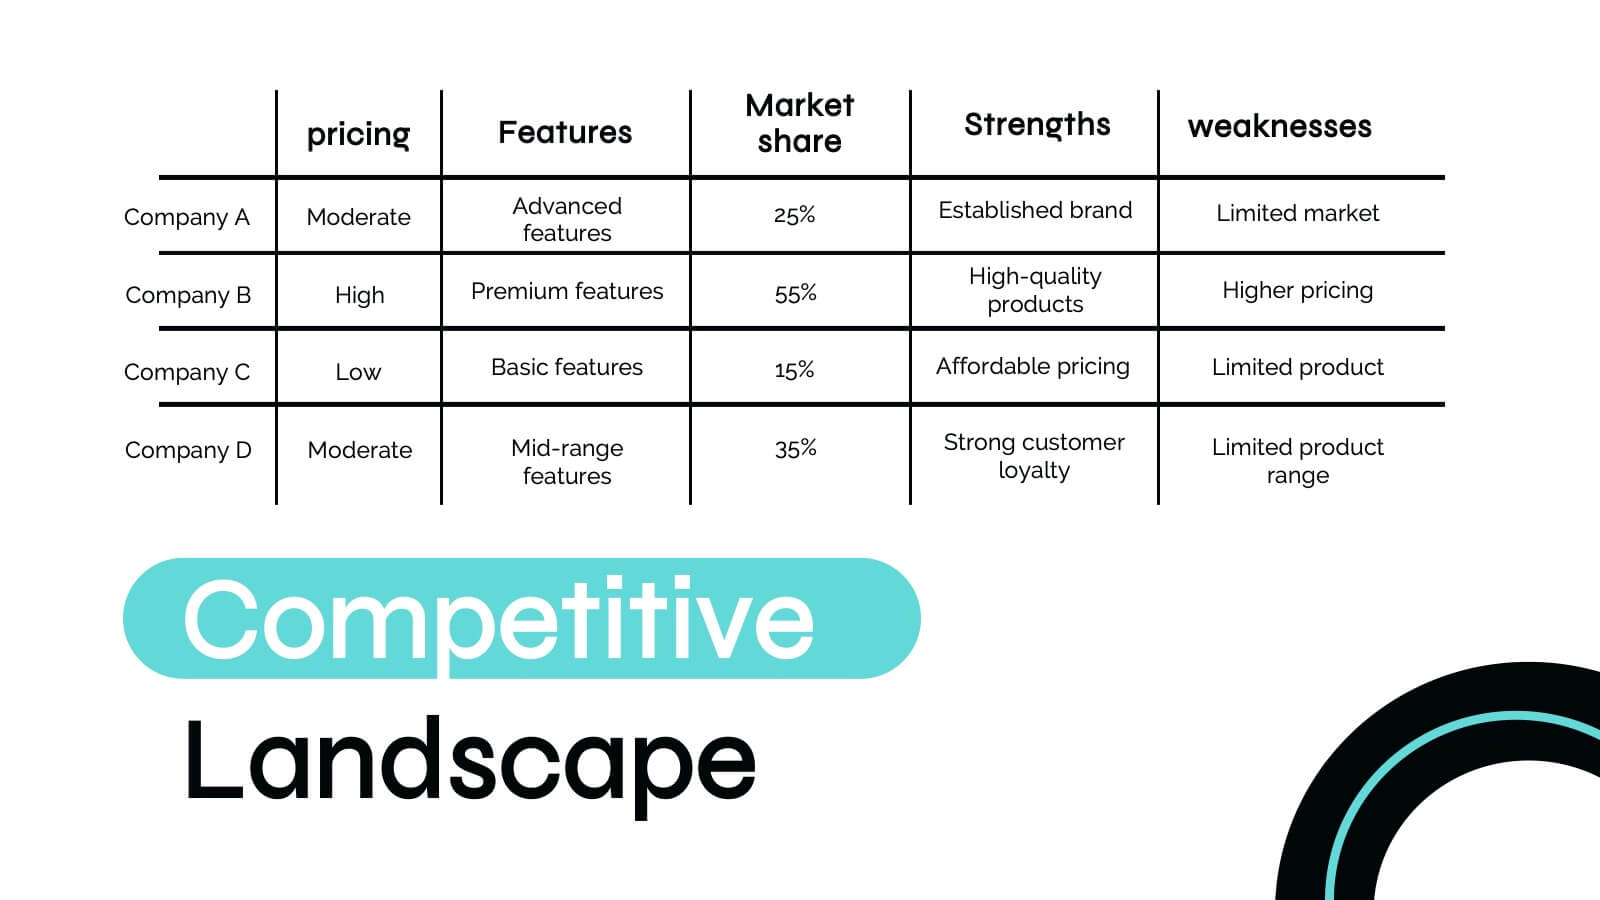
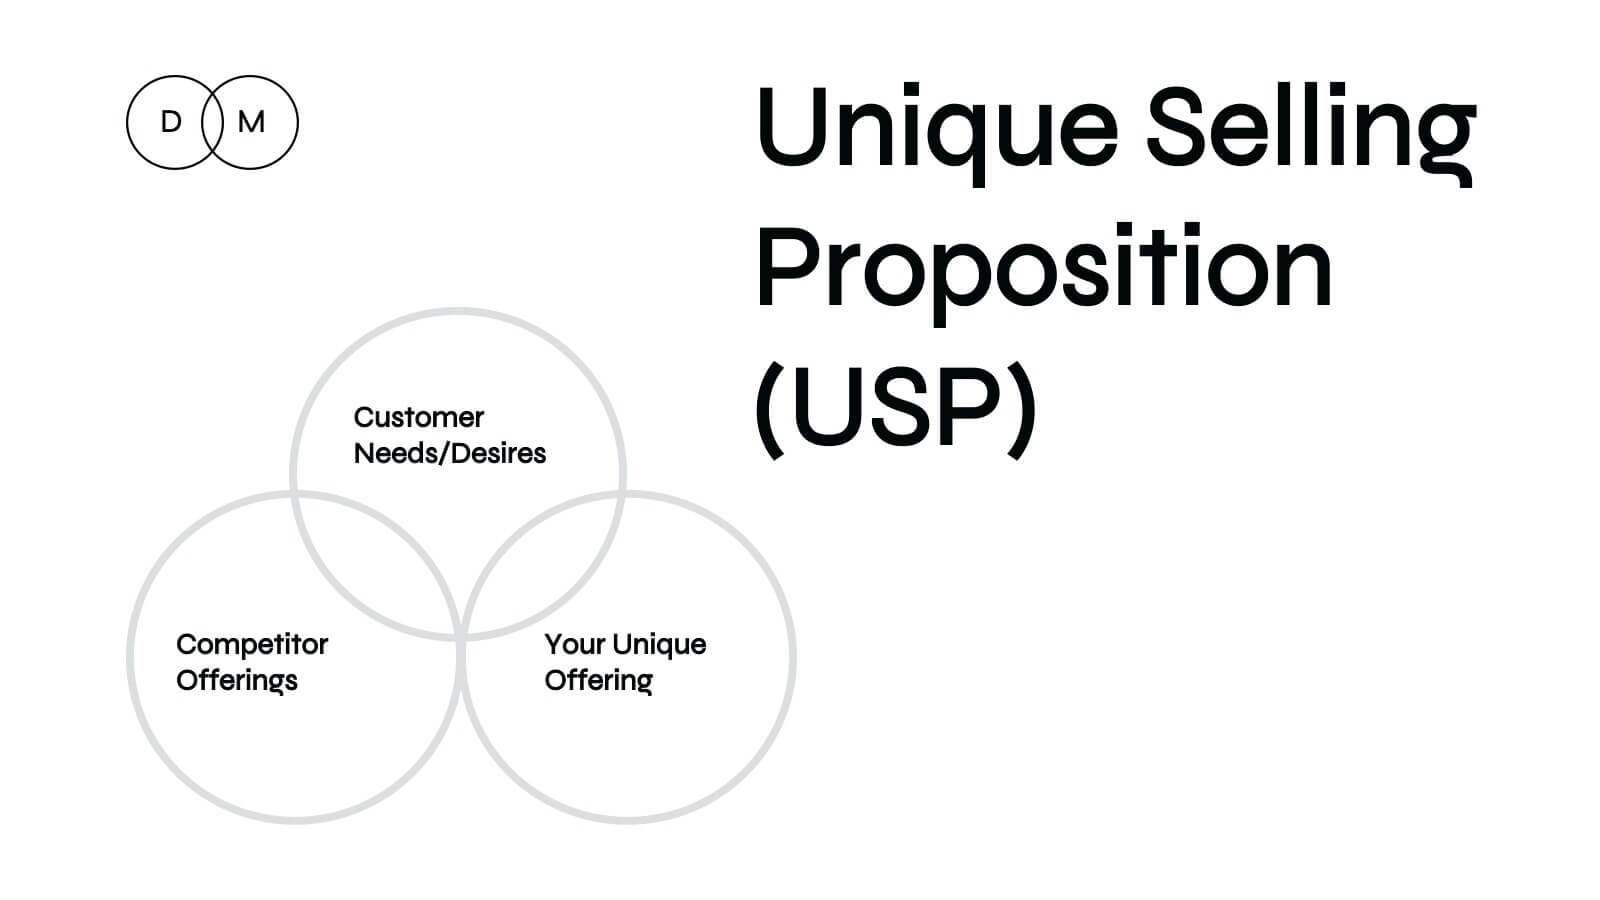
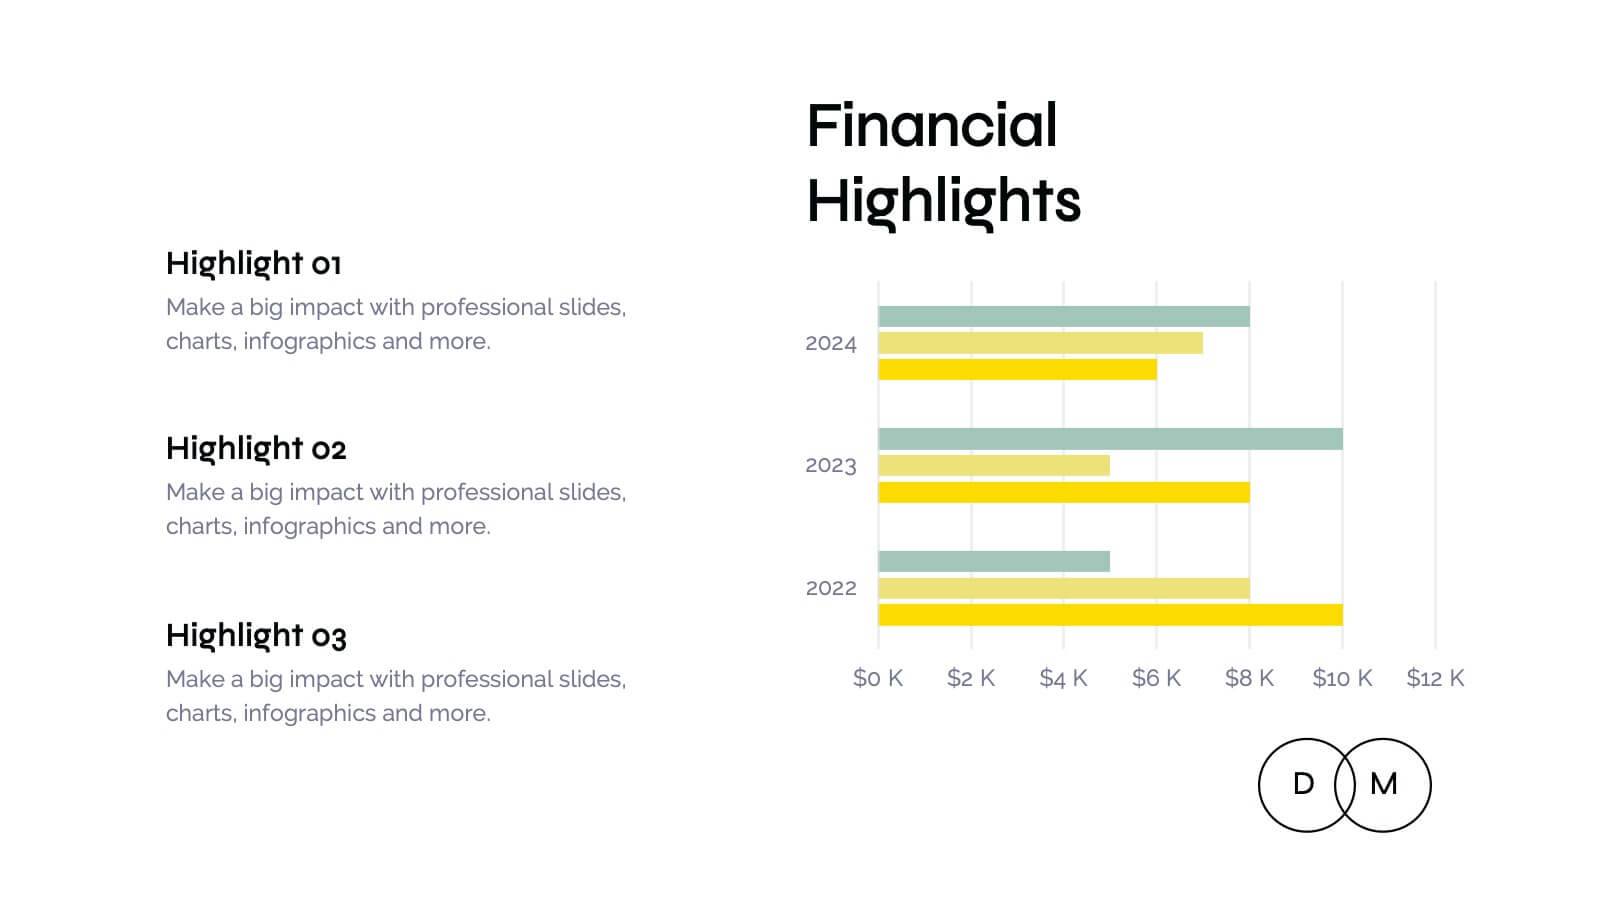
Hercules Digital Marketing Strategy Plan Presentation
Ignite your next marketing presentation with this bold, dynamic template that showcases every key element of your marketing strategy! From company history and target audience insights to competitive landscape analysis, this design makes presenting your marketing message a breeze. Perfect for professionals, it’s fully compatible with PowerPoint, Keynote, and Google Slides for seamless usage across platforms.


6 diapositivas
Workforce Development Strategy Presentation
Enhance your workforce development strategies with our "Workforce Development Strategy Presentation" template. This infographic effectively displays essential workforce statistics and initiatives, organizing data into visually distinct segments for clarity. It covers various demographics and departmental roles, color-coded to differentiate data points like gender distribution and participation rates. Ideal for HR professionals and corporate trainers, this template supports strategic decisions in talent management and training. It simplifies complex information, making it accessible for all stakeholders. Compatible with PowerPoint, Keynote, and Google Slides, this template is essential for delivering impactful and strategic human resource presentations.


7 diapositivas
Pricing Comparison Table Infographic
Dive into the strategic world of pricing with our intricately designed pricing table infographic. Imbued with the trustworthiness of blue, the crisp clarity of white, the optimism of yellow, and the urgency of red, our template visualizes pricing strategies in an engaging manner. Furnished with detailed infographics, distinct icons, and adaptable image placeholders, it translates complex pricing data into an easy-to-grasp format. Seamlessly crafted for Powerpoint, Keynote, or Google Slides. A vital asset for business analysts, marketers, sales professionals, or any brand strategizing its pricing model. Engage your audience; let every slide be a value proposition.


7 diapositivas
Break Even Analysis Infographics Presentation Template
Break Even Analysis is a type of cost accounting, It's a critical tool for all businesses from start-ups to established firms. It allows you to evaluate how changes in the level of sales affect your total profit, or the number of purchases that must be made before the company or product makes a profit. This is also known as a break even point. Use this template to analyze your break-even point, the volume and price at which you will begin to earn a profit. This template comes with graphs and charts that will allow you to track the volume of your sales, monthly revenues, and variable expenses.