


Características


¿Tienes alguna pregunta?
Recomendar


5 diapositivas
Wedding Itinerary Infographics
A Wedding Itinerary is a detailed schedule or timeline that outlines the events and activities planned for a wedding day. These infographic templates aim to assist couples in creating a visually appealing and informative itinerary for their wedding events. These infographics are perfect for preparing a presentation for guests, sharing details with the wedding party, or showcasing wedding planning services, this template will help you create a memorable and well-organized wedding experience. This is compatible with PowerPoint, Keynote, and Google Slides making it easily editable to personalize the template with your information.


4 diapositivas
Creative Thinking and Brain Functions Presentation
Illuminate cognitive processes with the Creative Thinking and Brain Functions Presentation. Featuring a clean mind map-style layout with illustrated heads and title blocks, this slide is ideal for showcasing mental models, decision paths, or concept relationships. Fully editable in PowerPoint, Canva, and Google Slides for effortless customization.


5 diapositivas
Corporate Teamwork and People Focus
Show how every team member powers success with this people-centered visual designed to highlight collaboration, roles, and interconnected efforts. Ideal for HR briefings, corporate values, or teamwork strategies, this gear-inspired layout places individuals at the heart of progress. Fully compatible with PowerPoint, Keynote, and Google Slides.


8 diapositivas
Editable SWOT Infographic Presentation
Analyze your business strategy with the Editable SWOT Infographic Presentation. This modern and professional template highlights Strengths, Weaknesses, Opportunities, and Threats in a visually structured format. Perfect for business planning, competitive analysis, and decision-making, it allows for easy customization of colors, text, and layout. Fully compatible with PowerPoint, Keynote, and Google Slides, ensuring seamless editing and presentation.

20 diapositivas
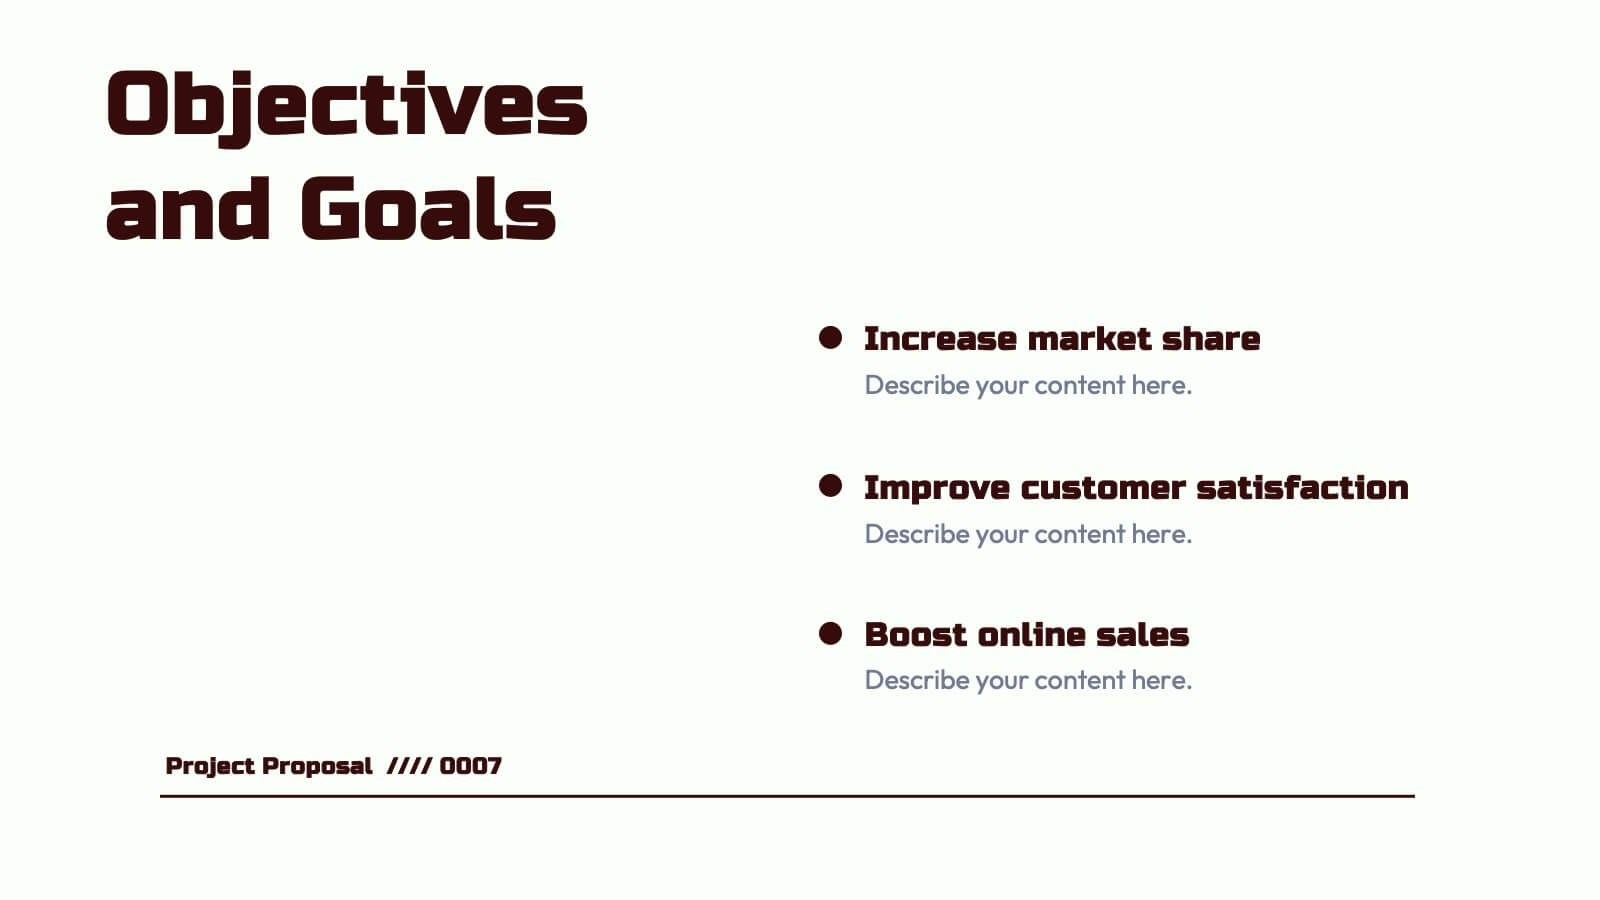
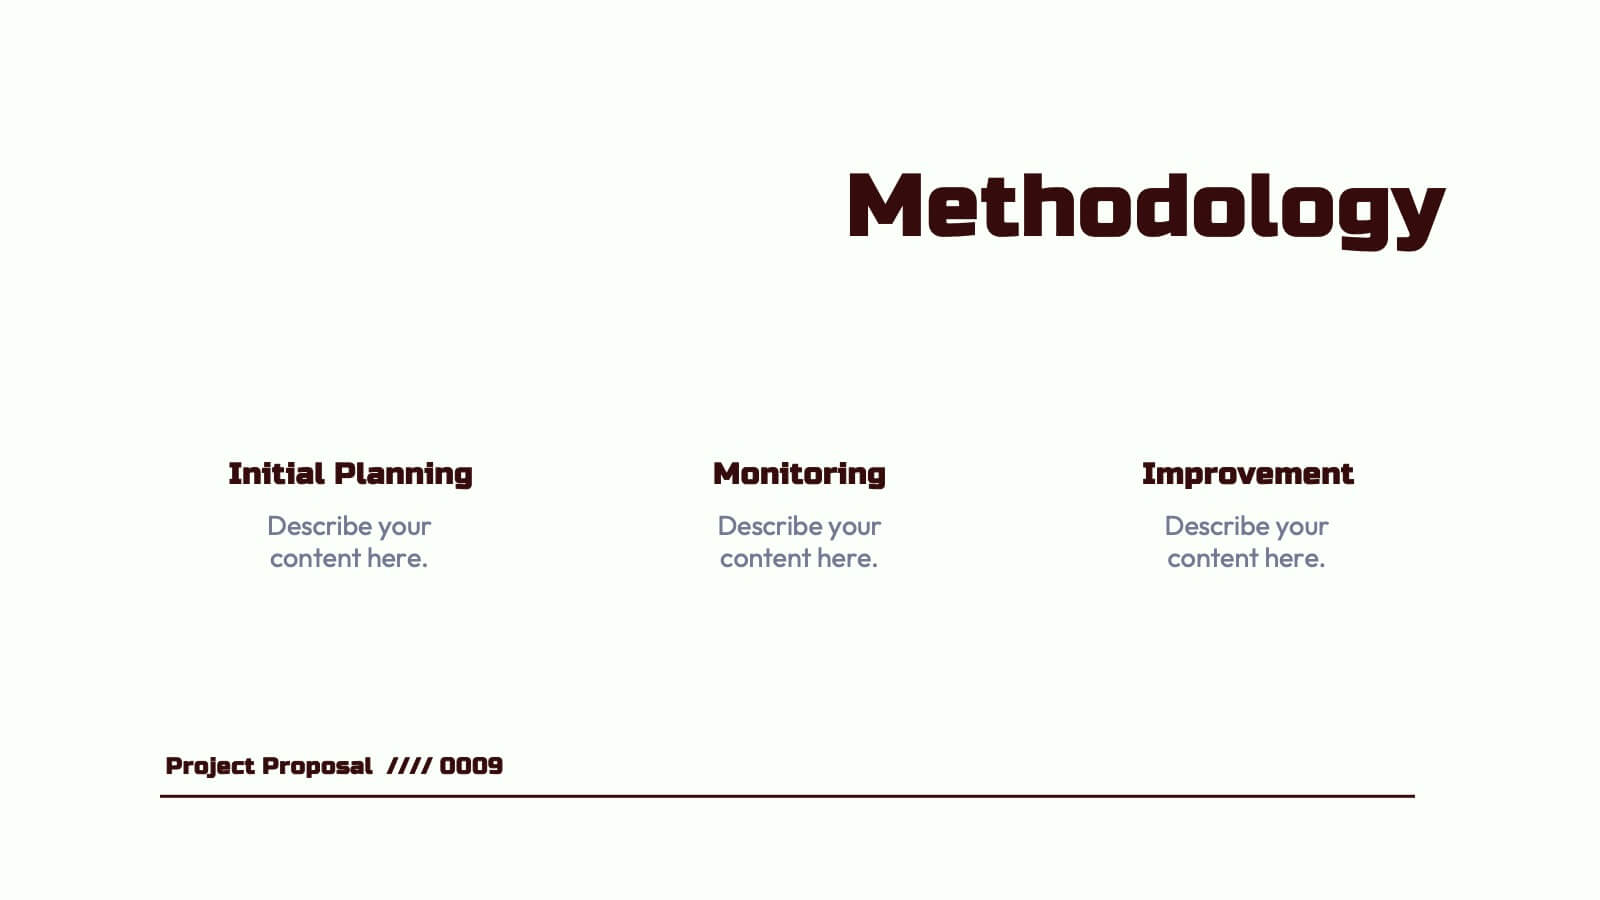
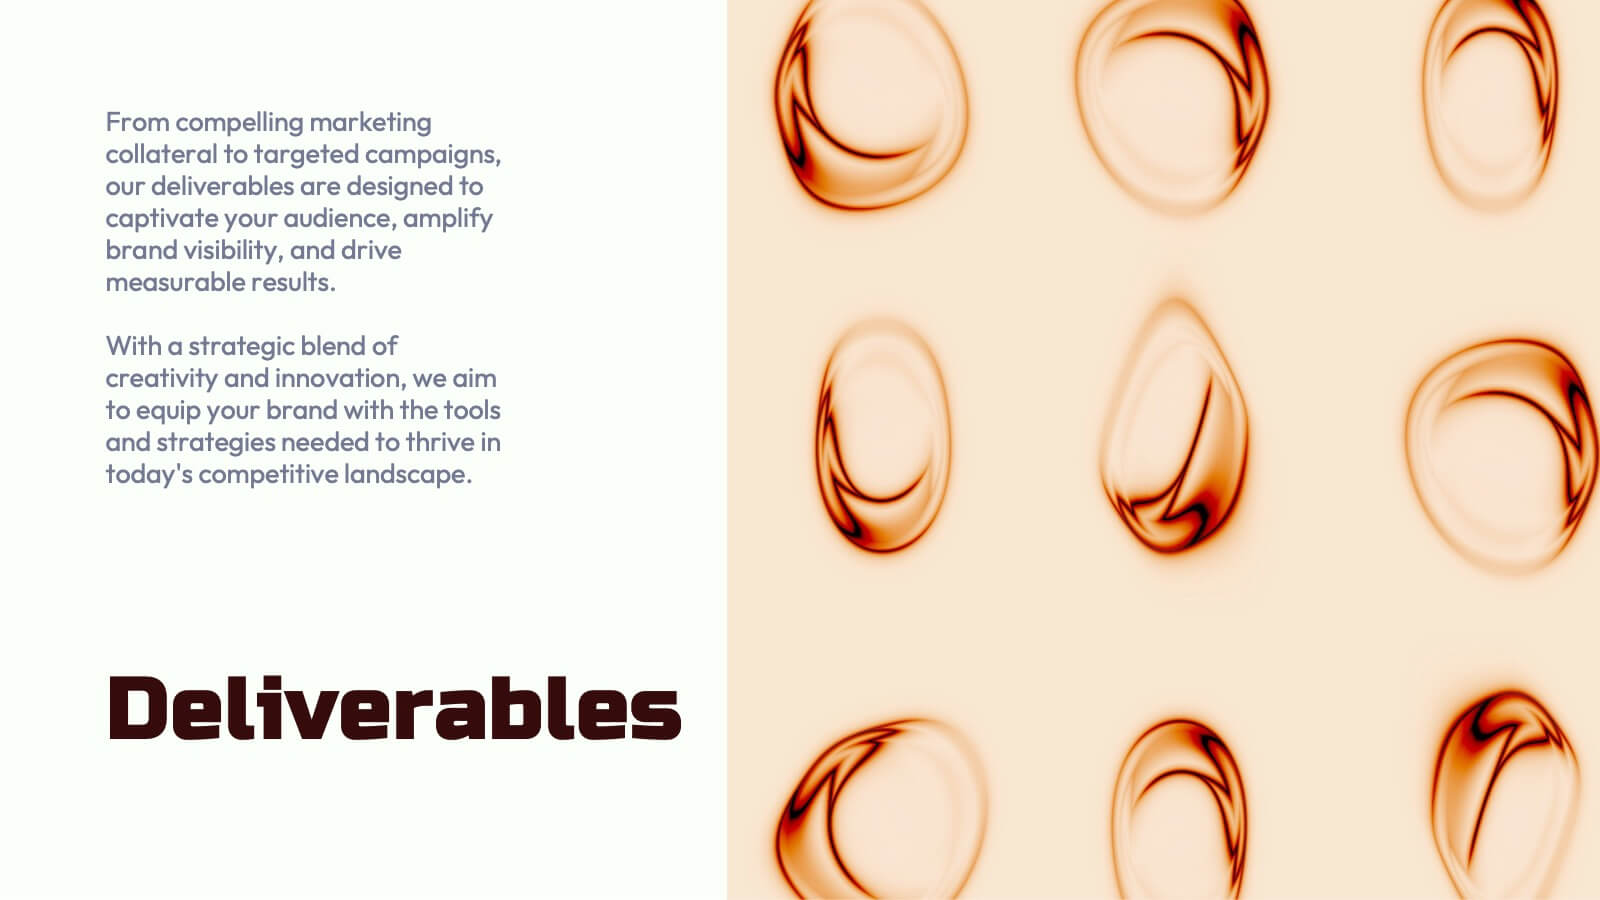
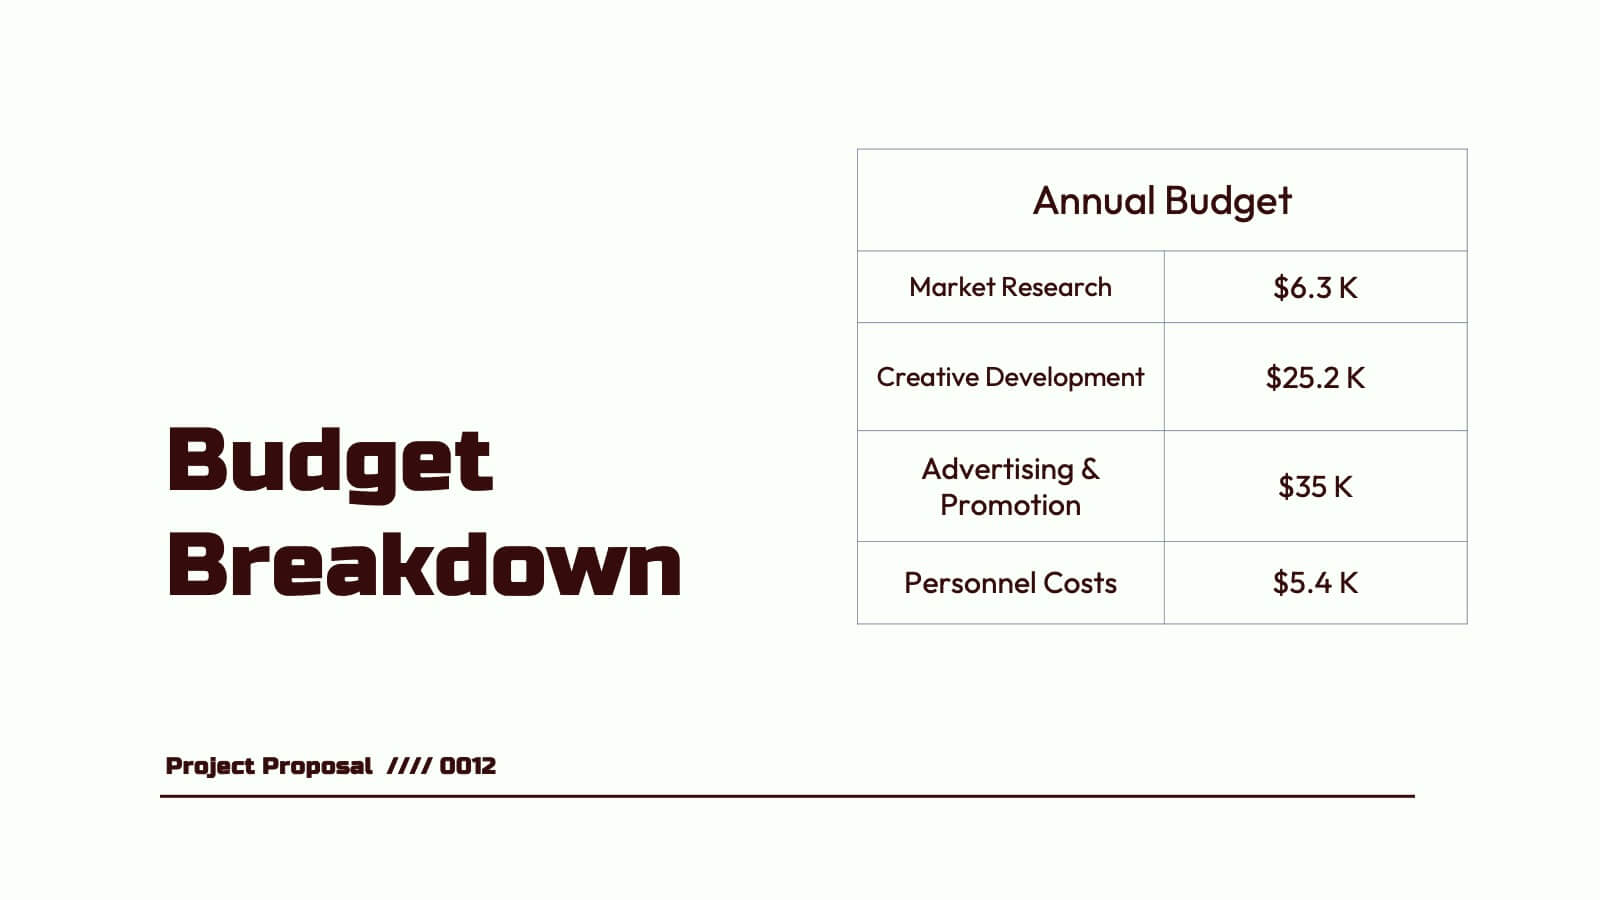
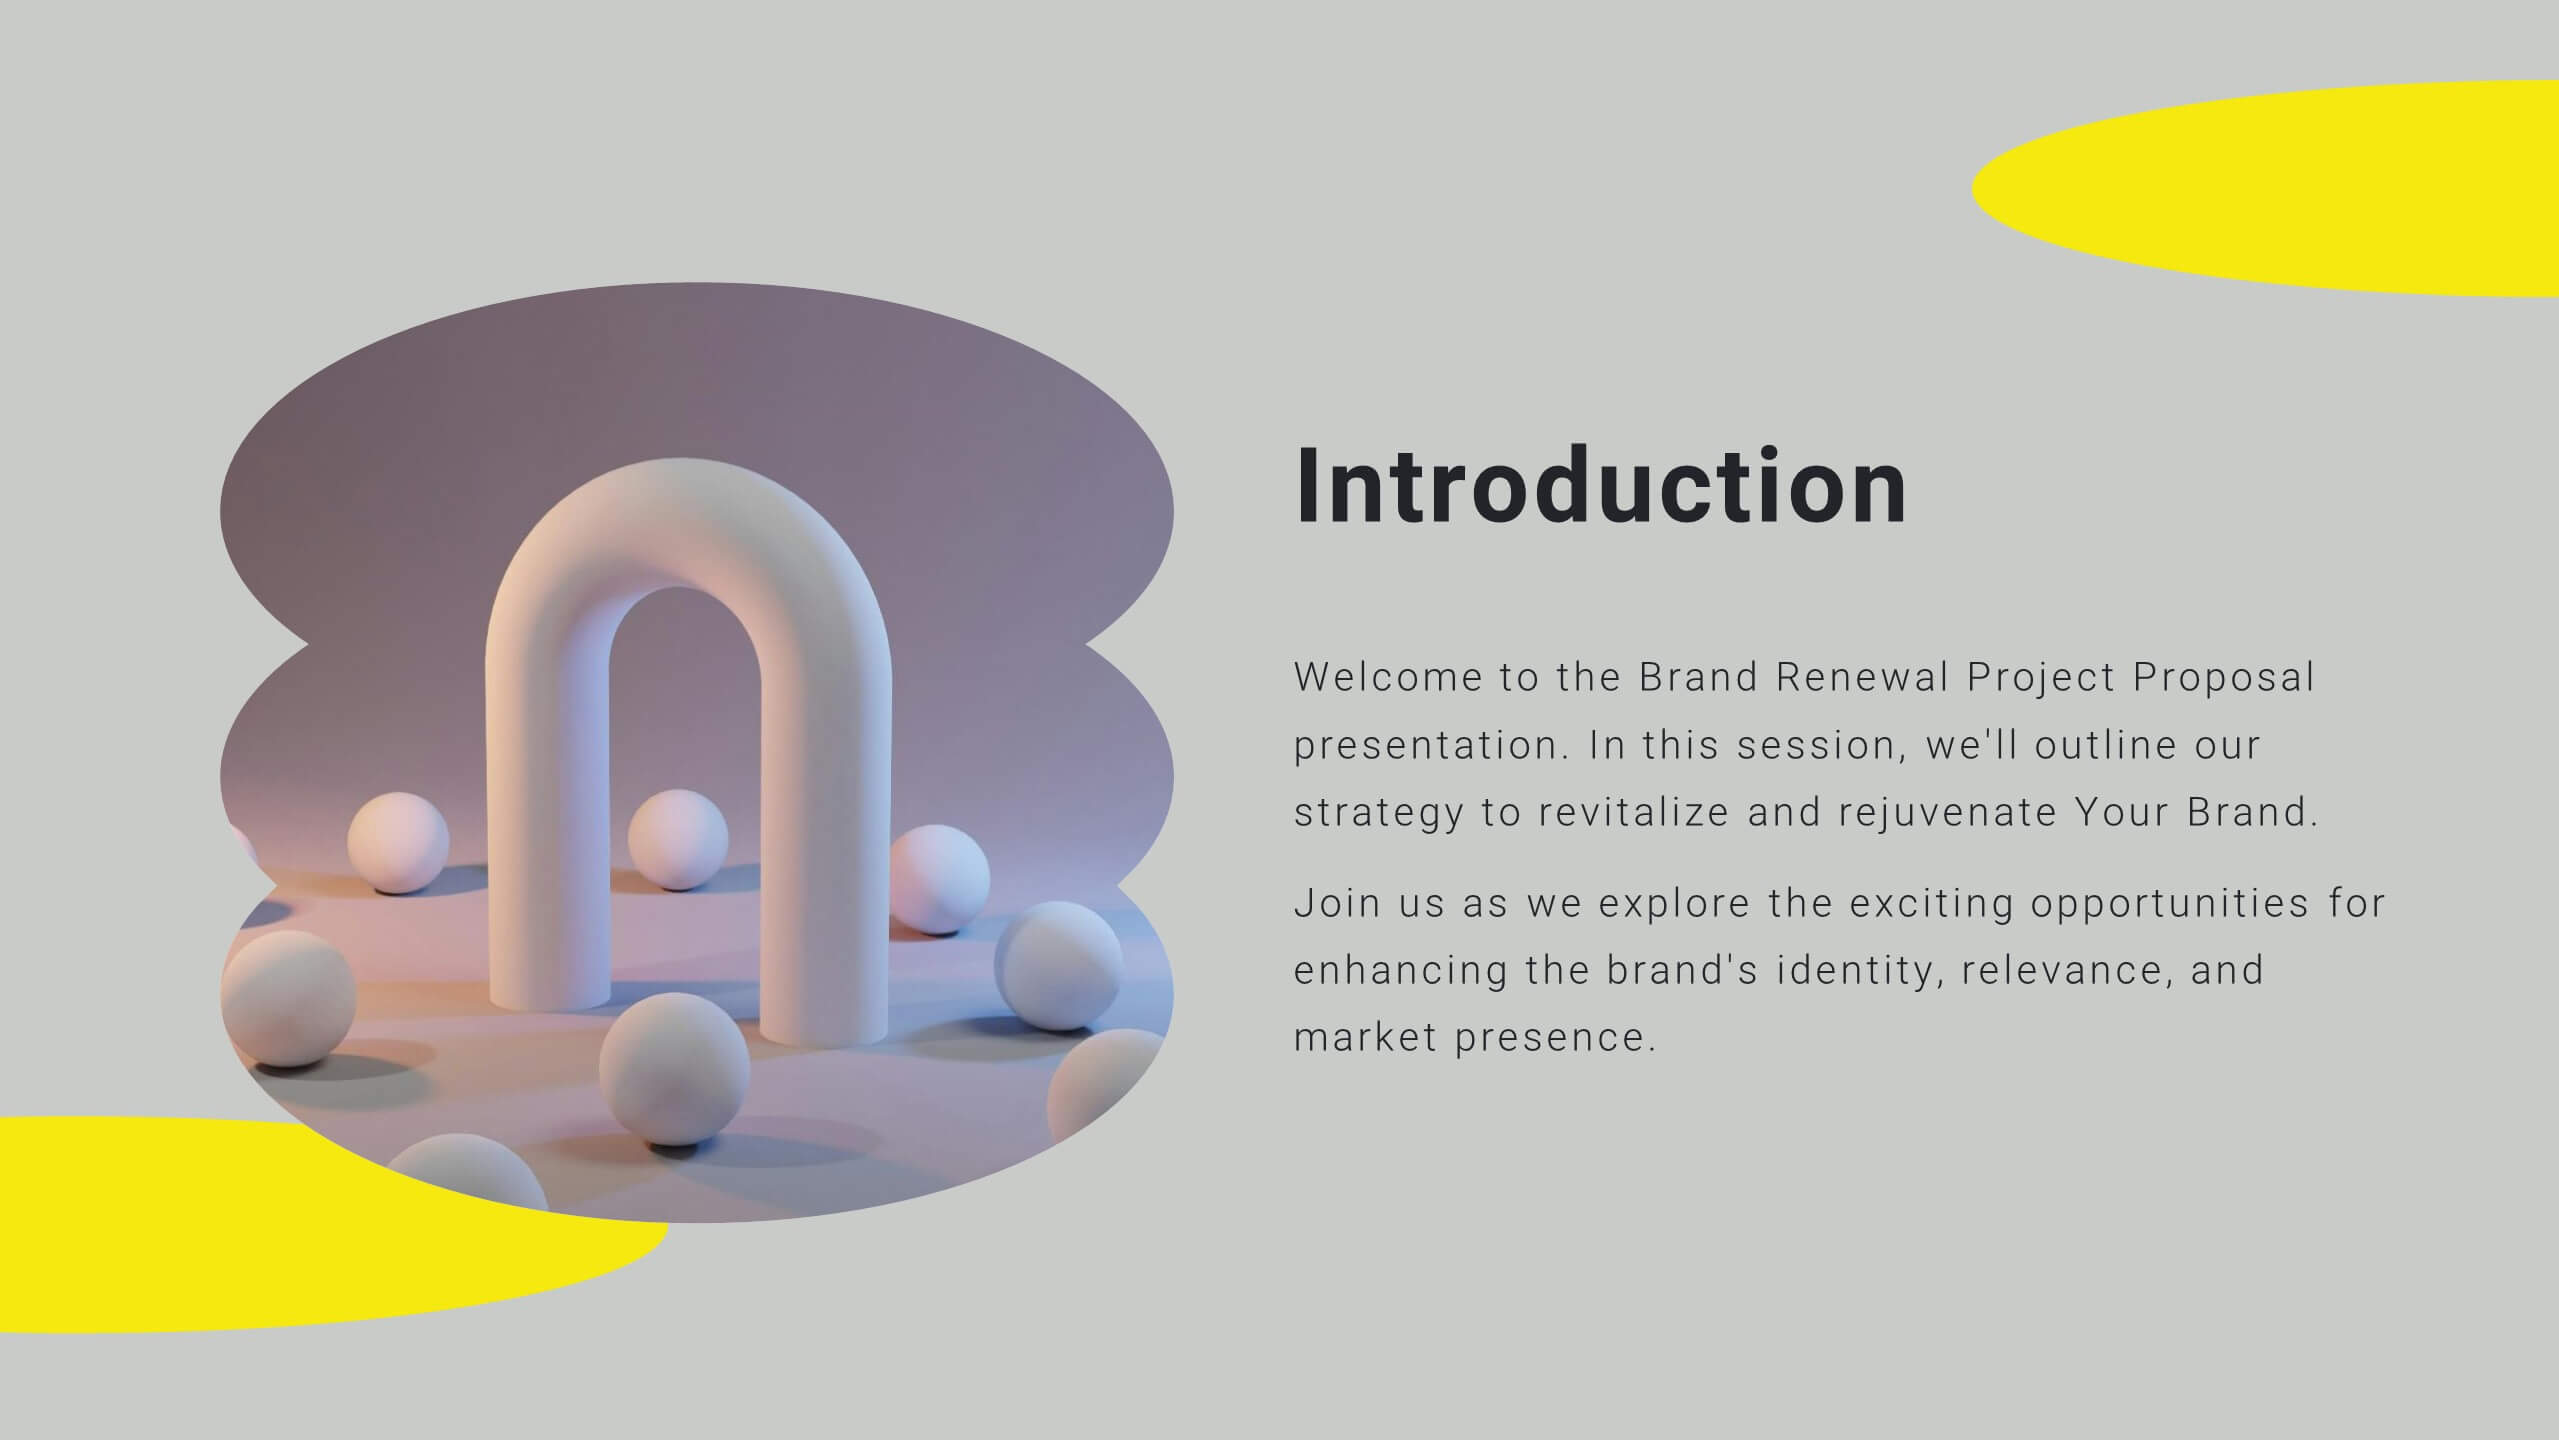
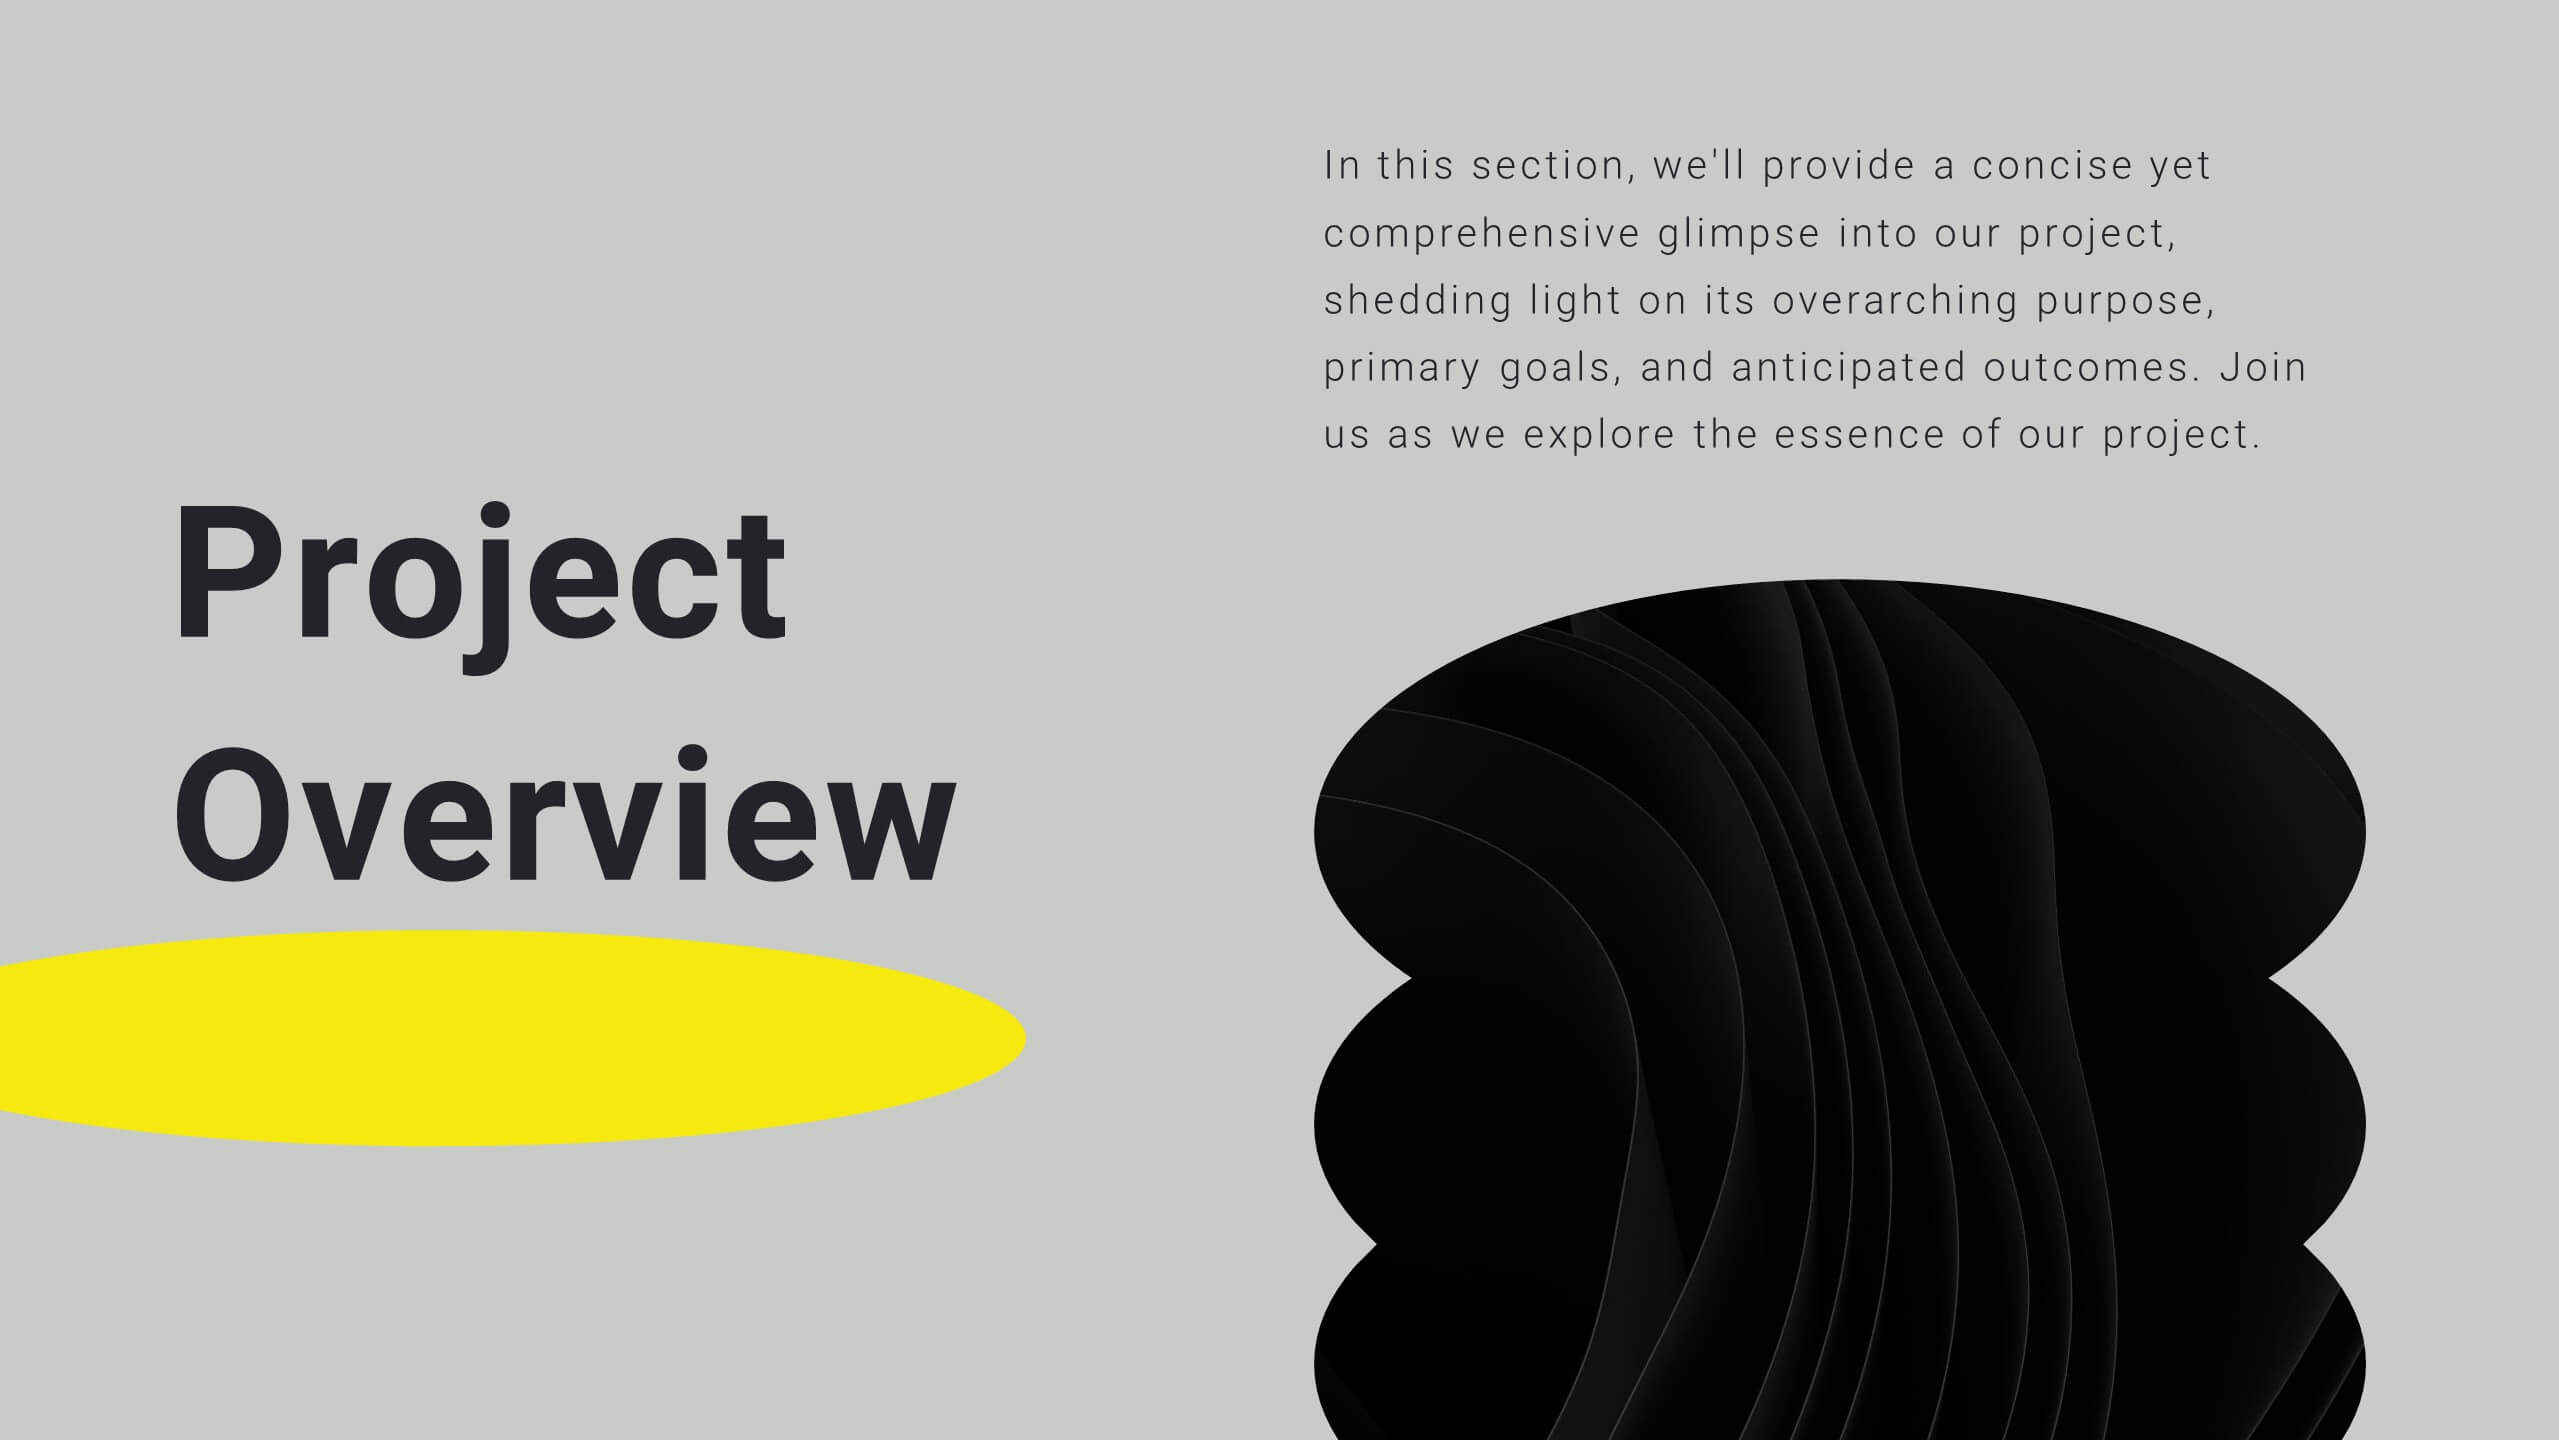
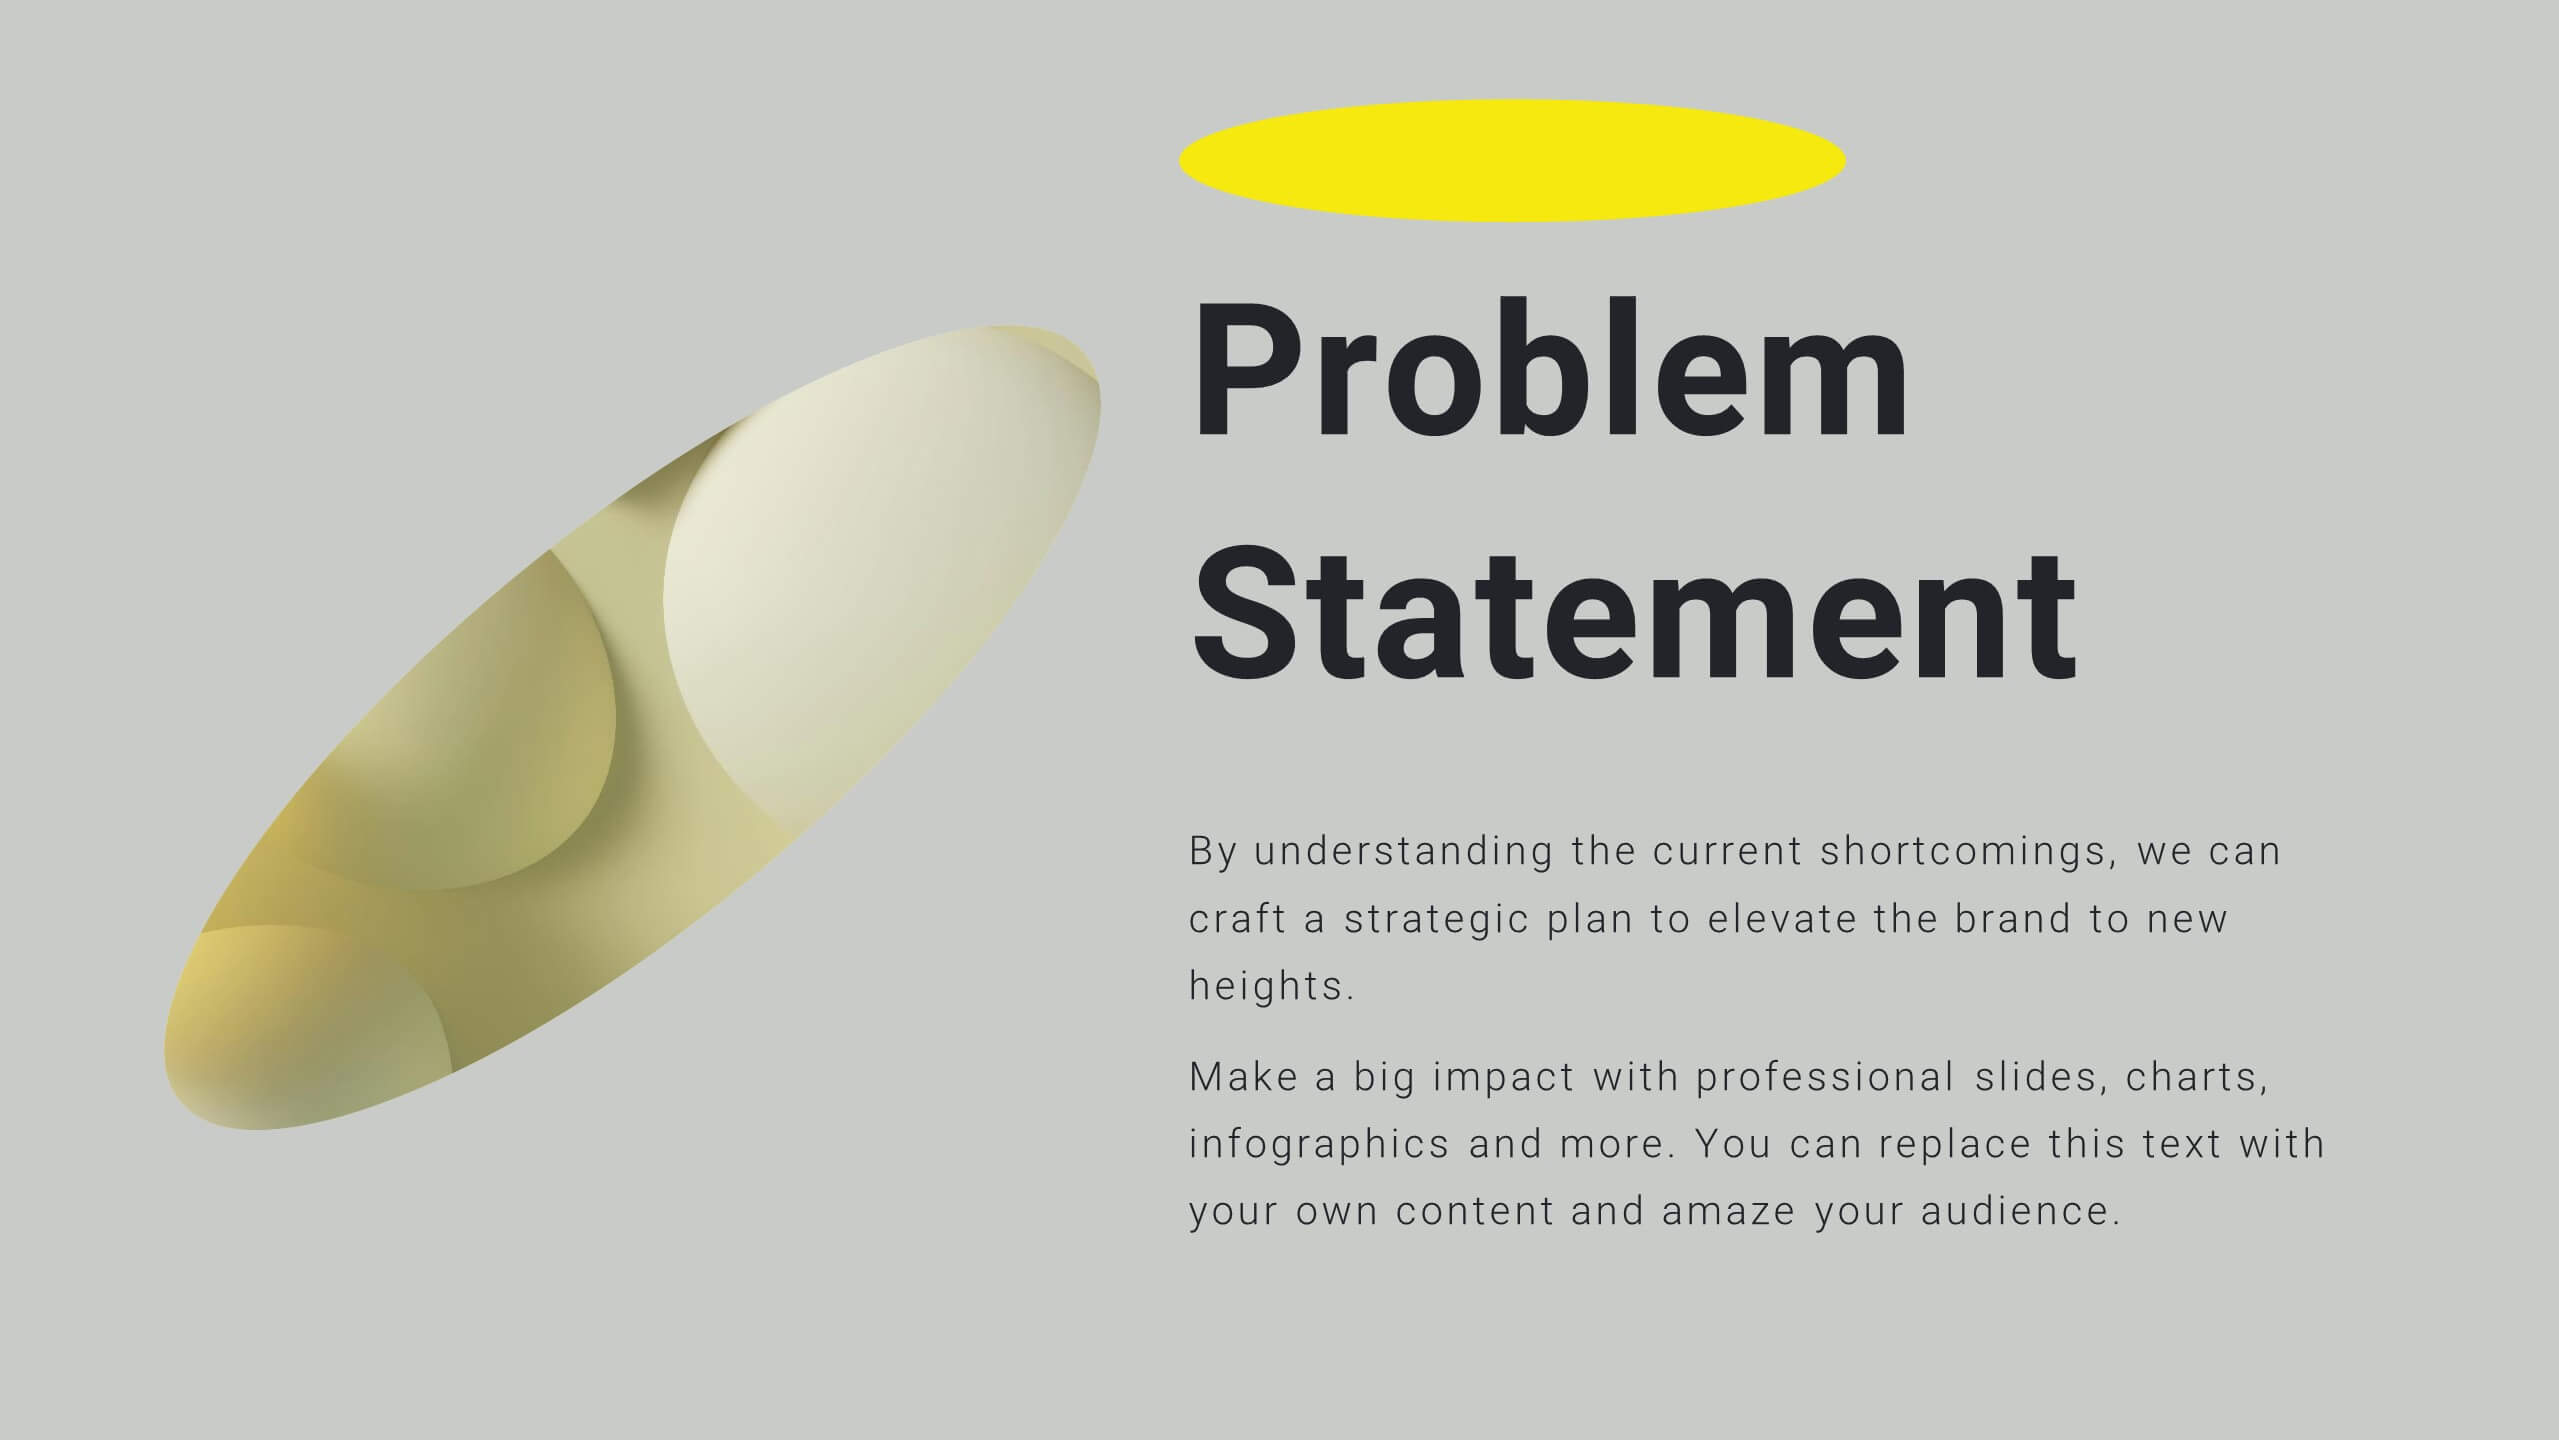
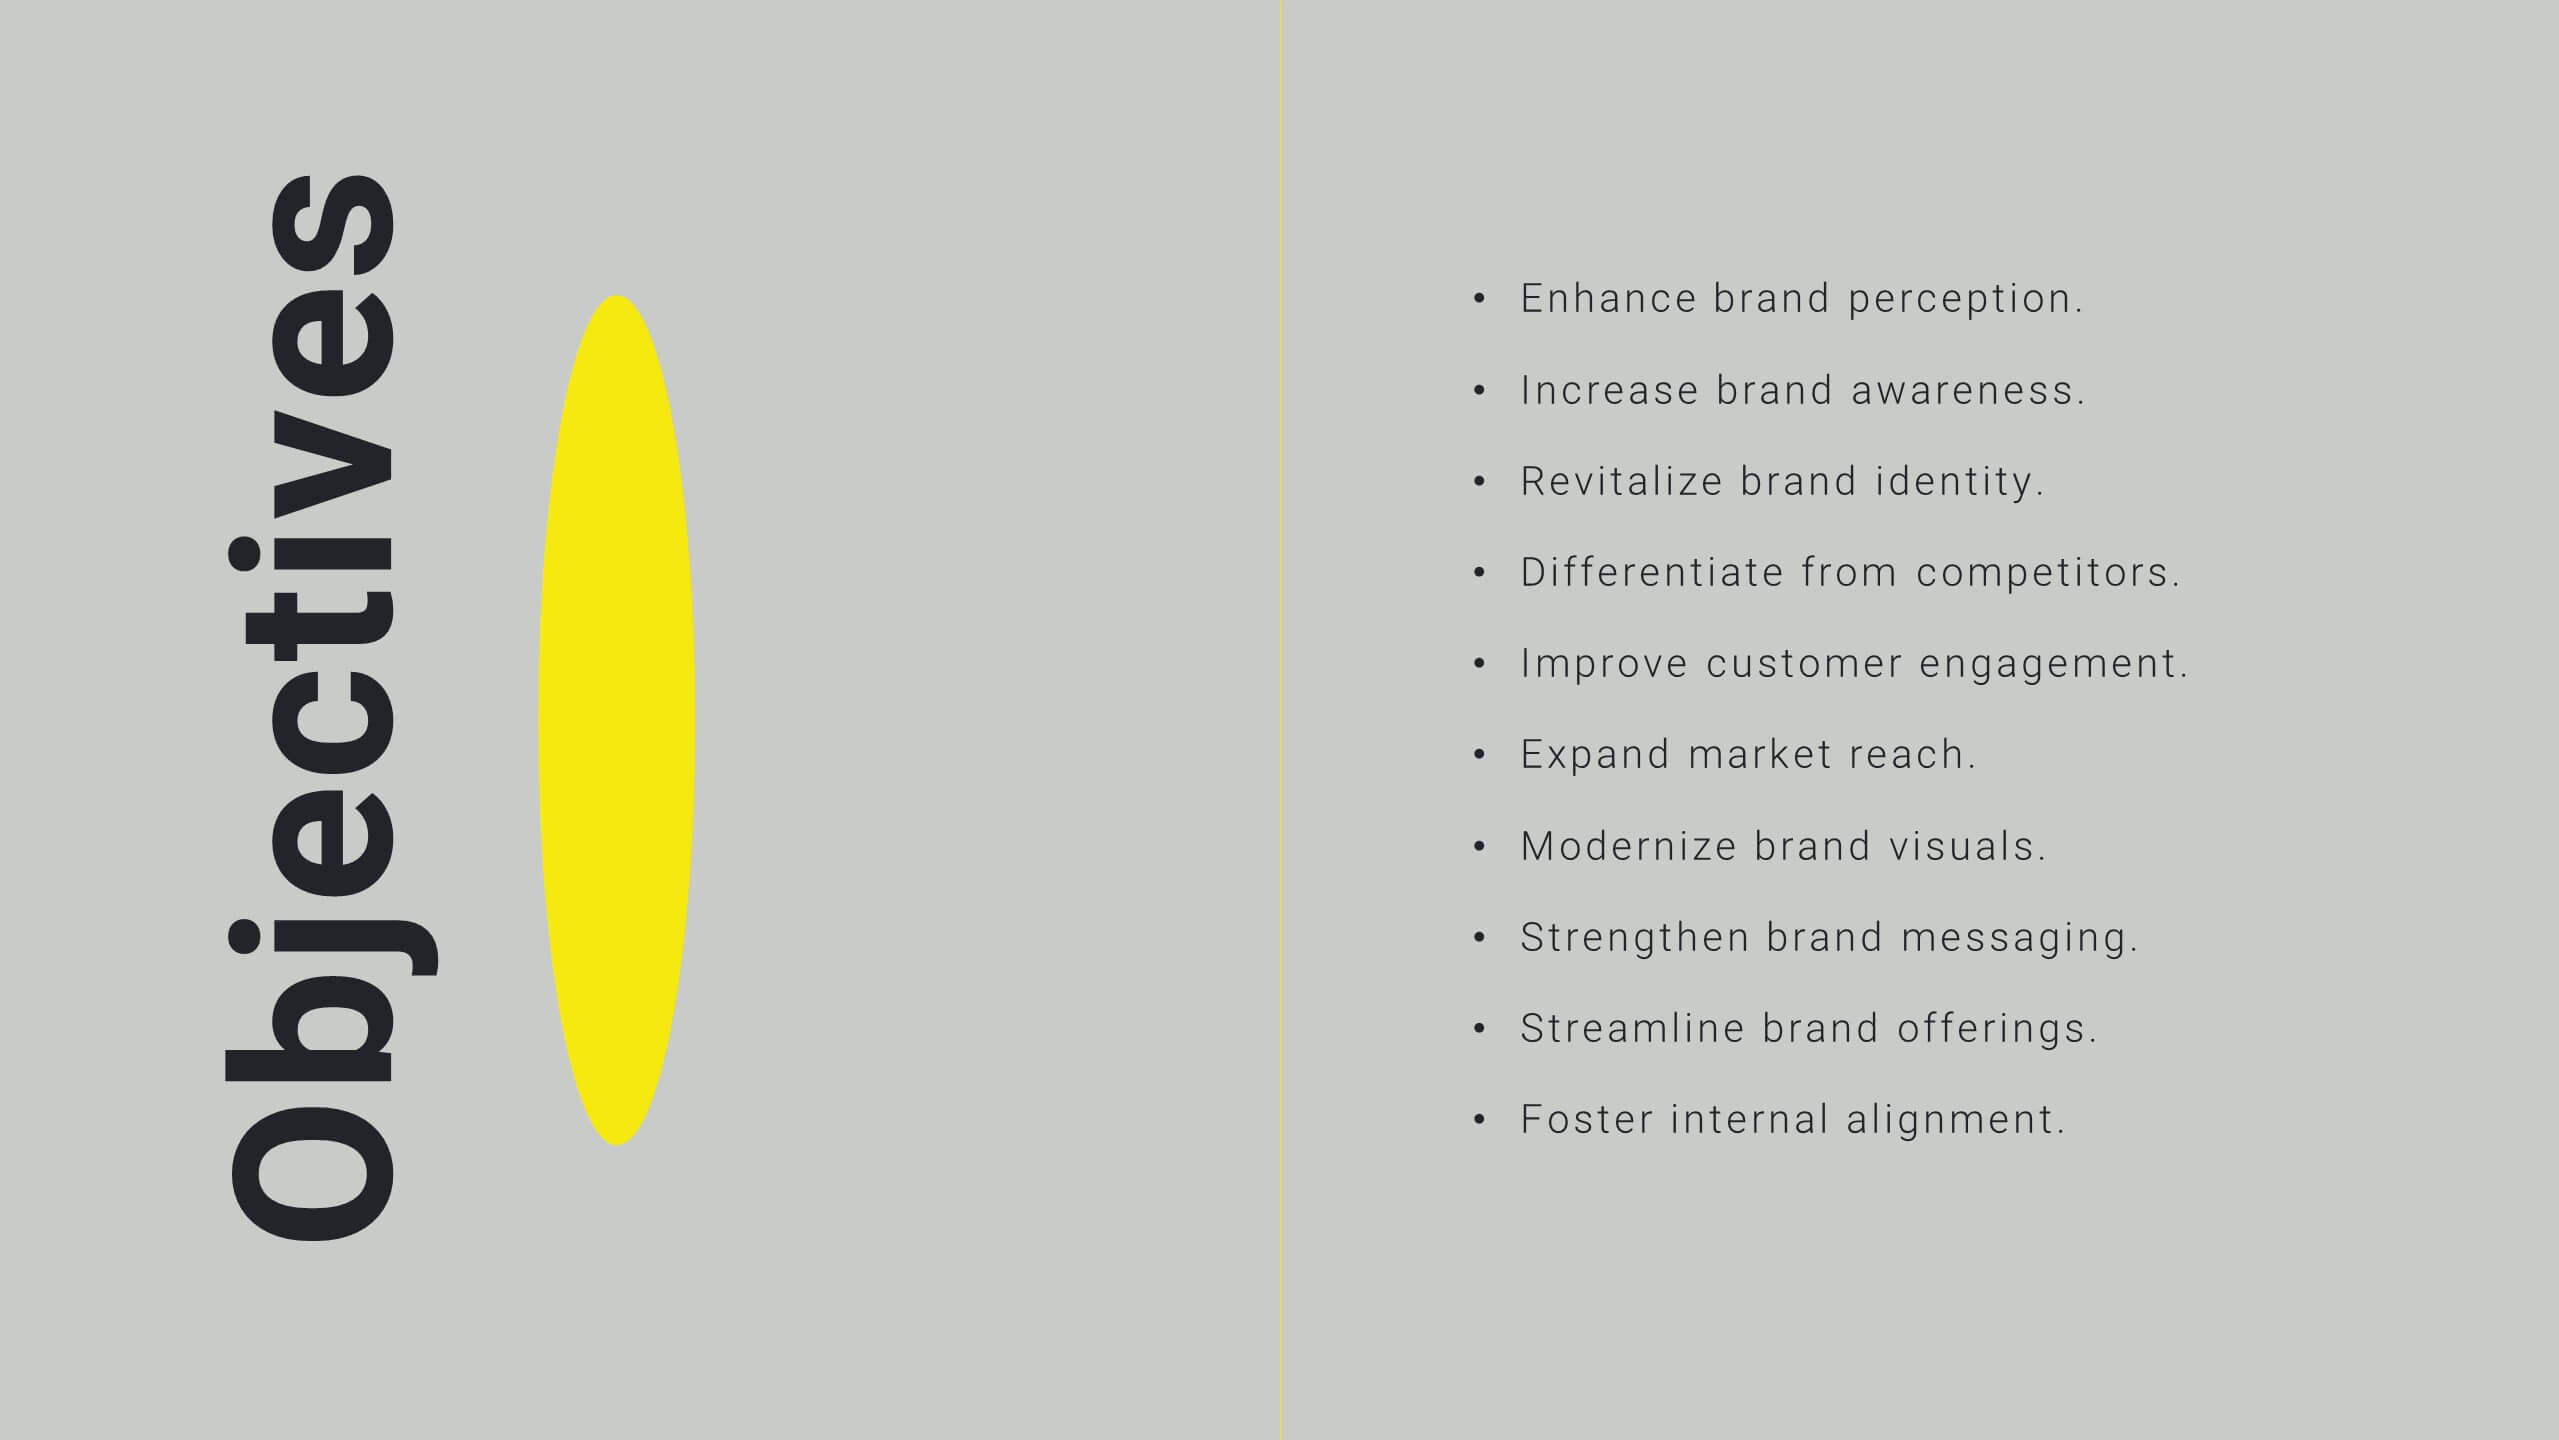
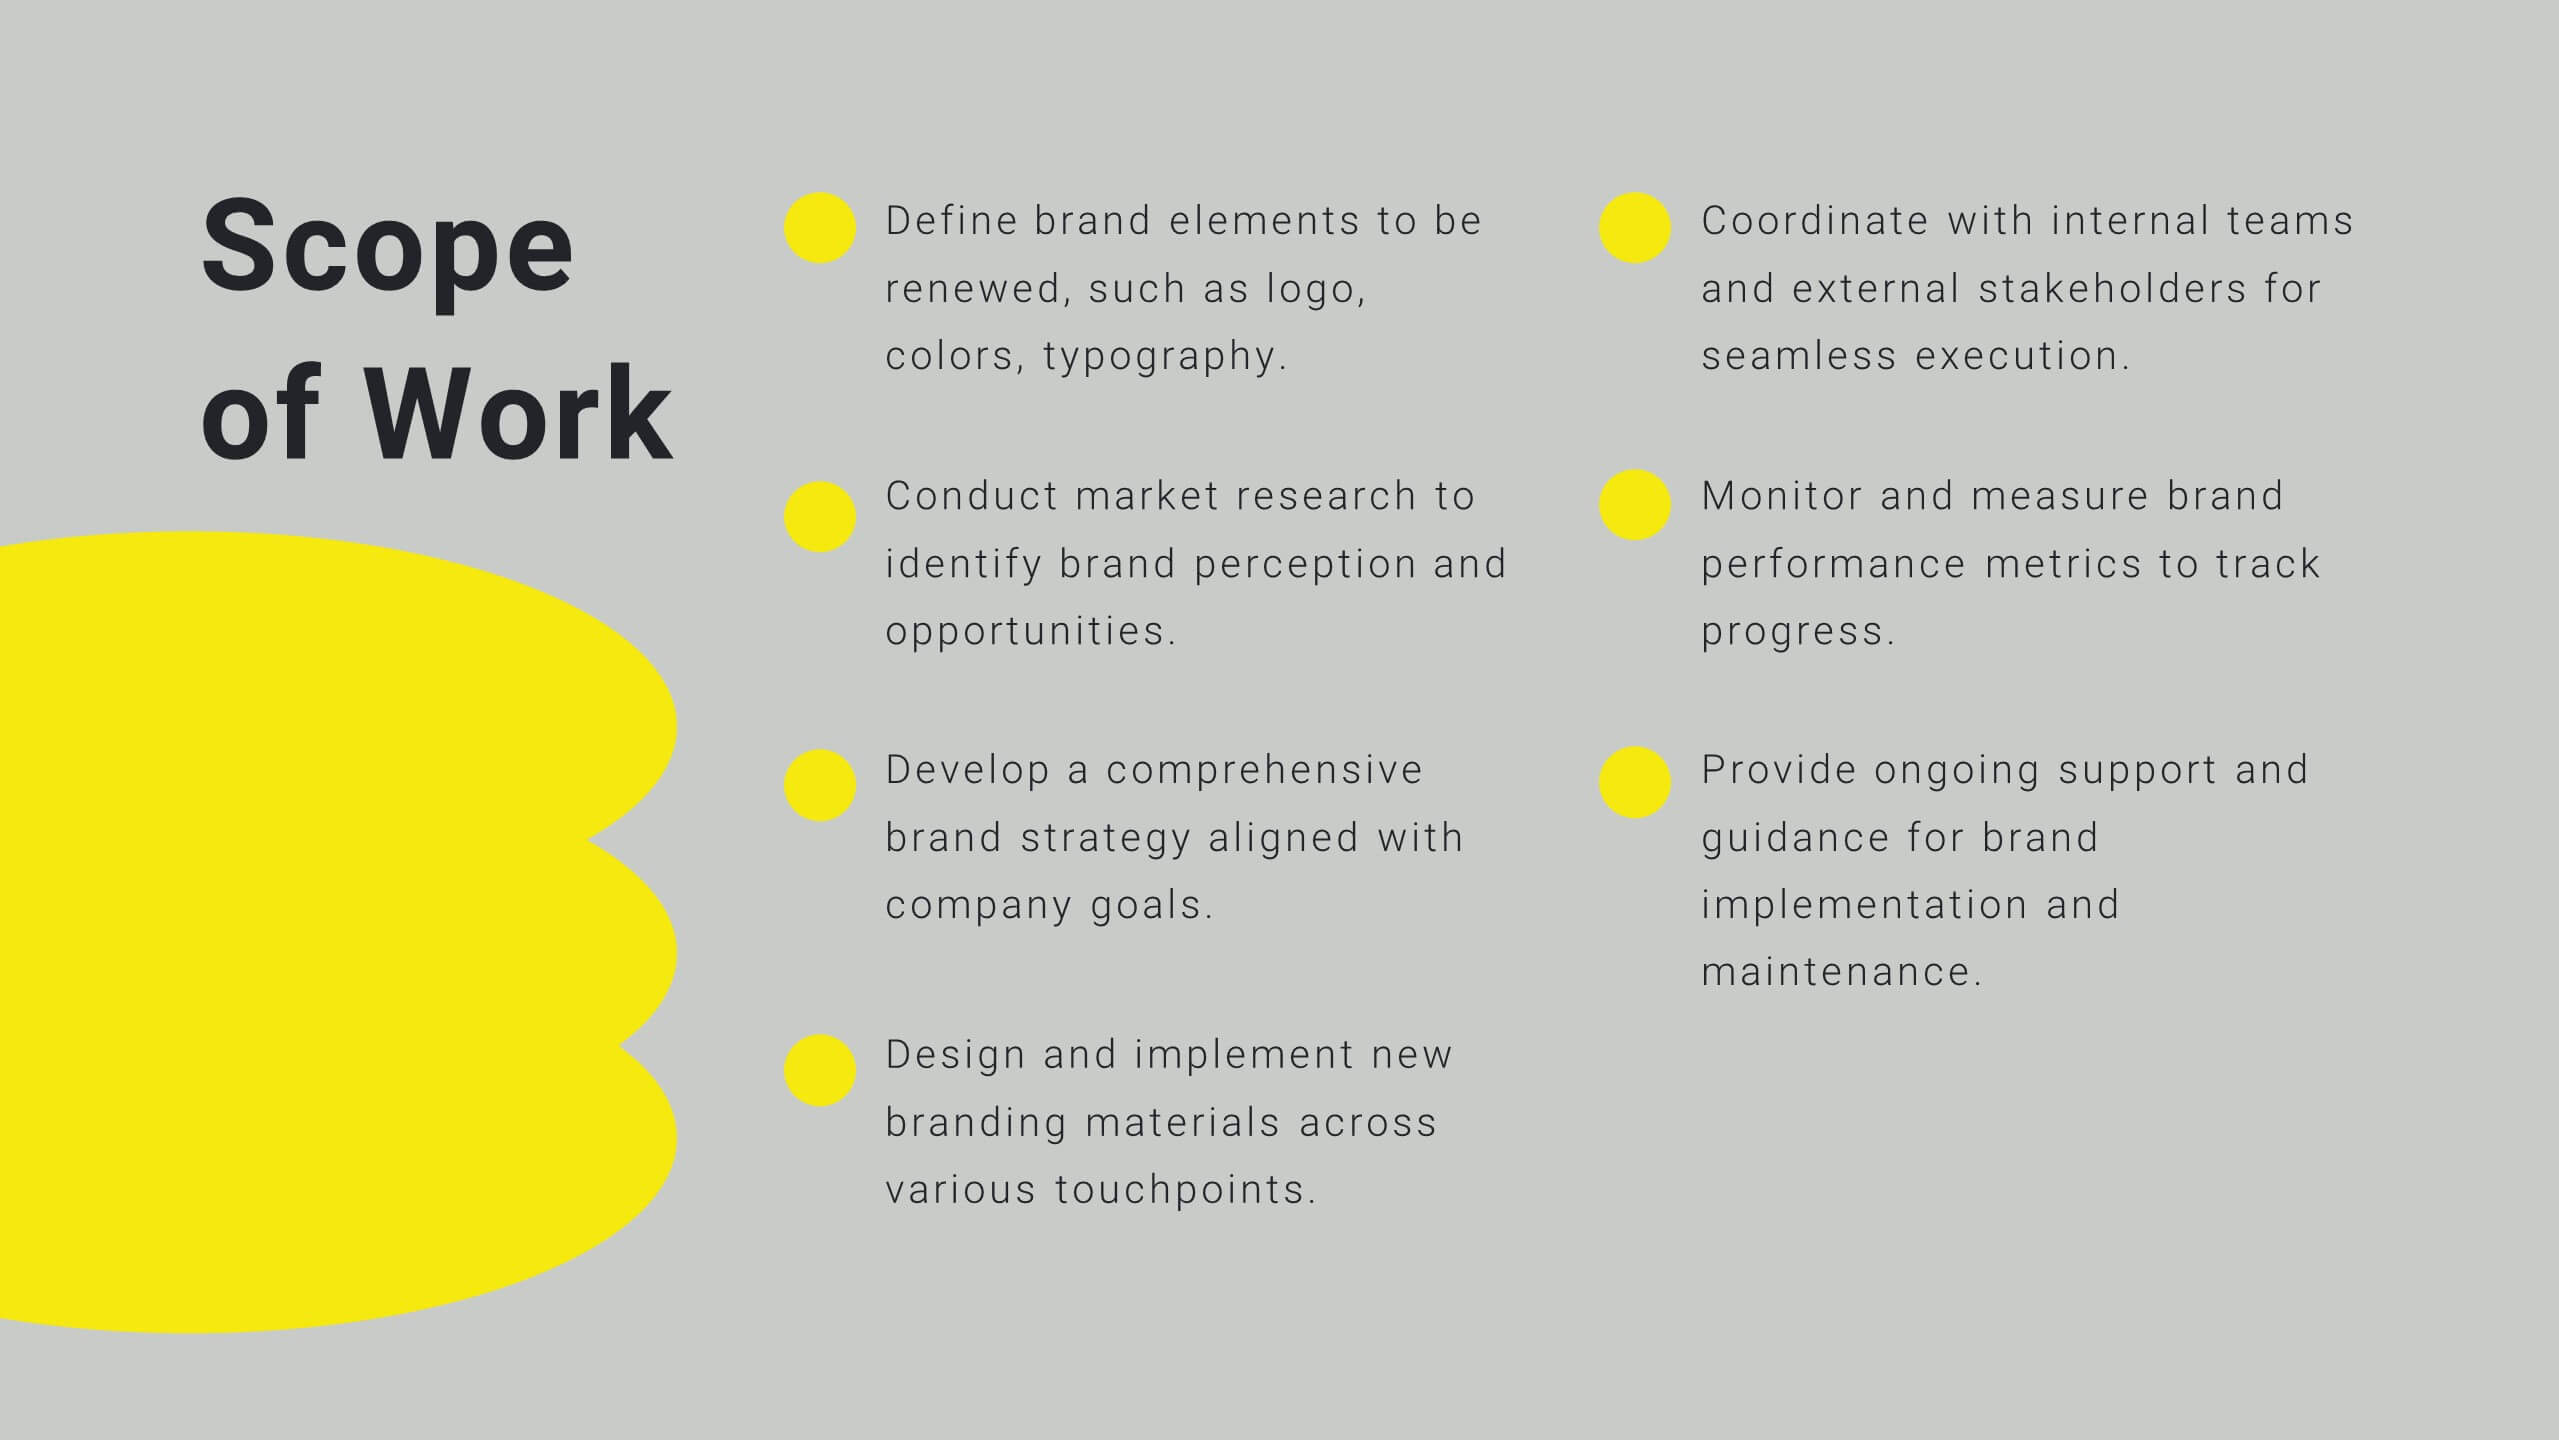
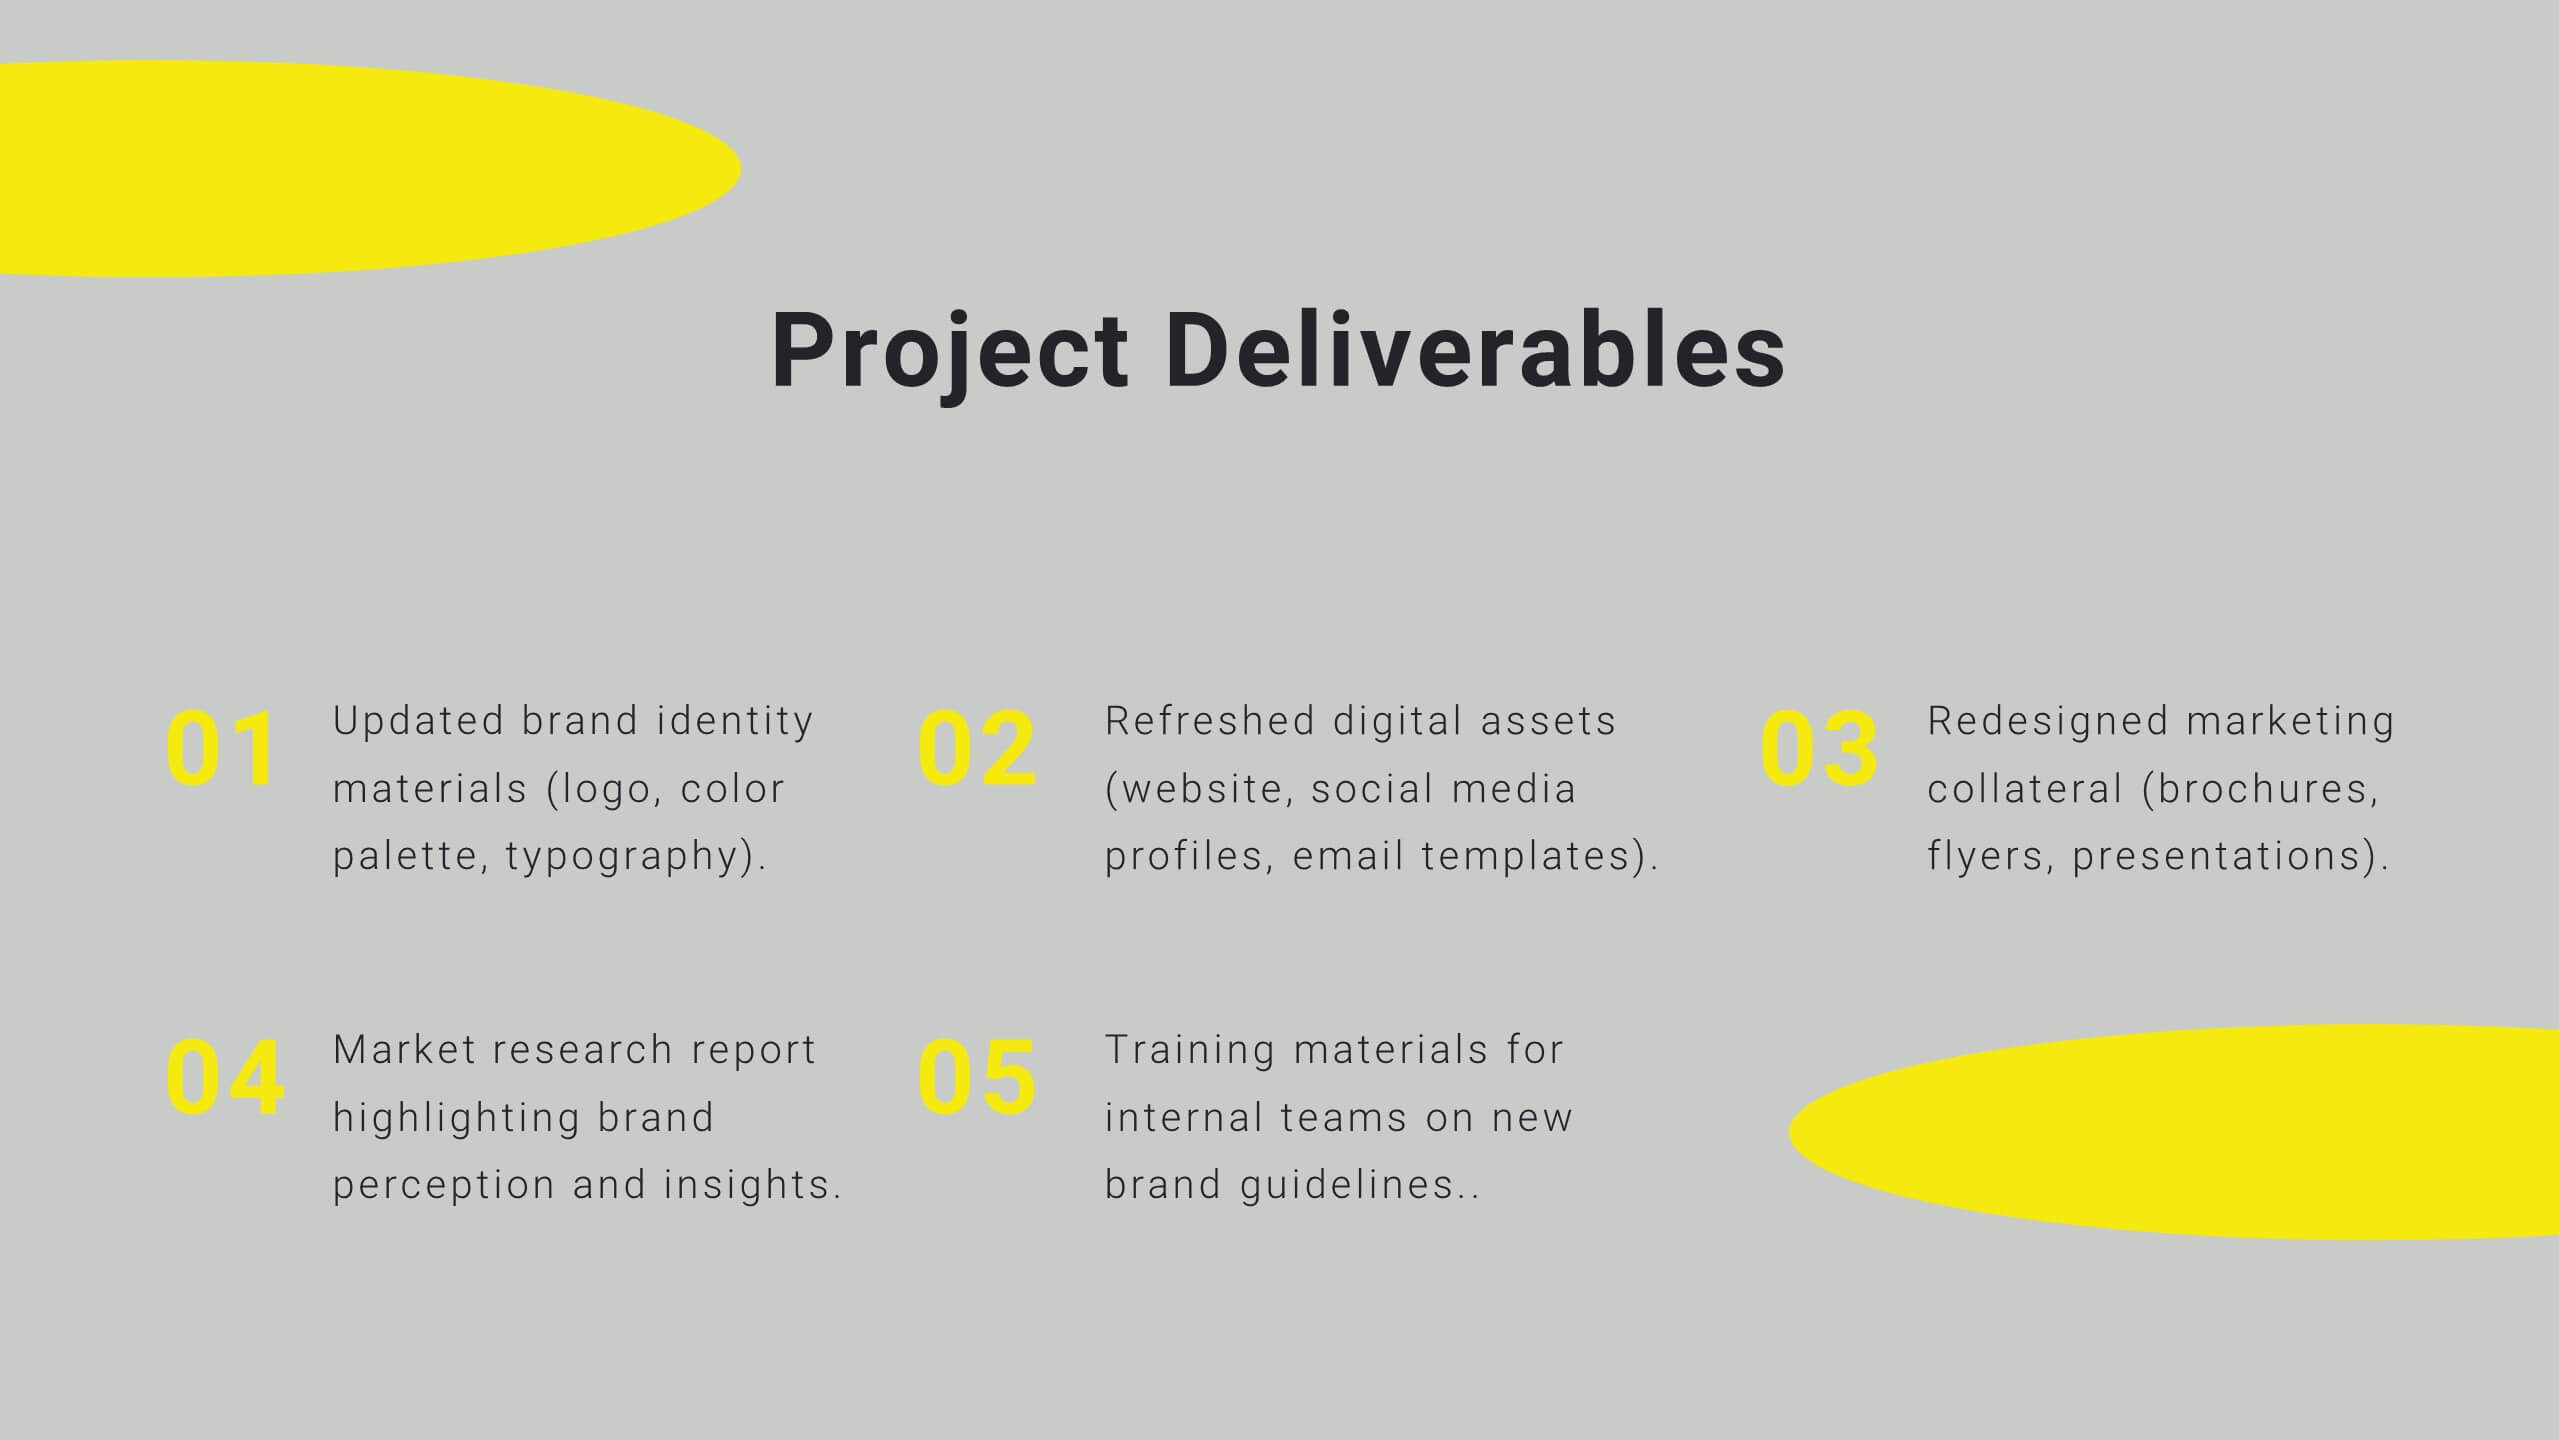
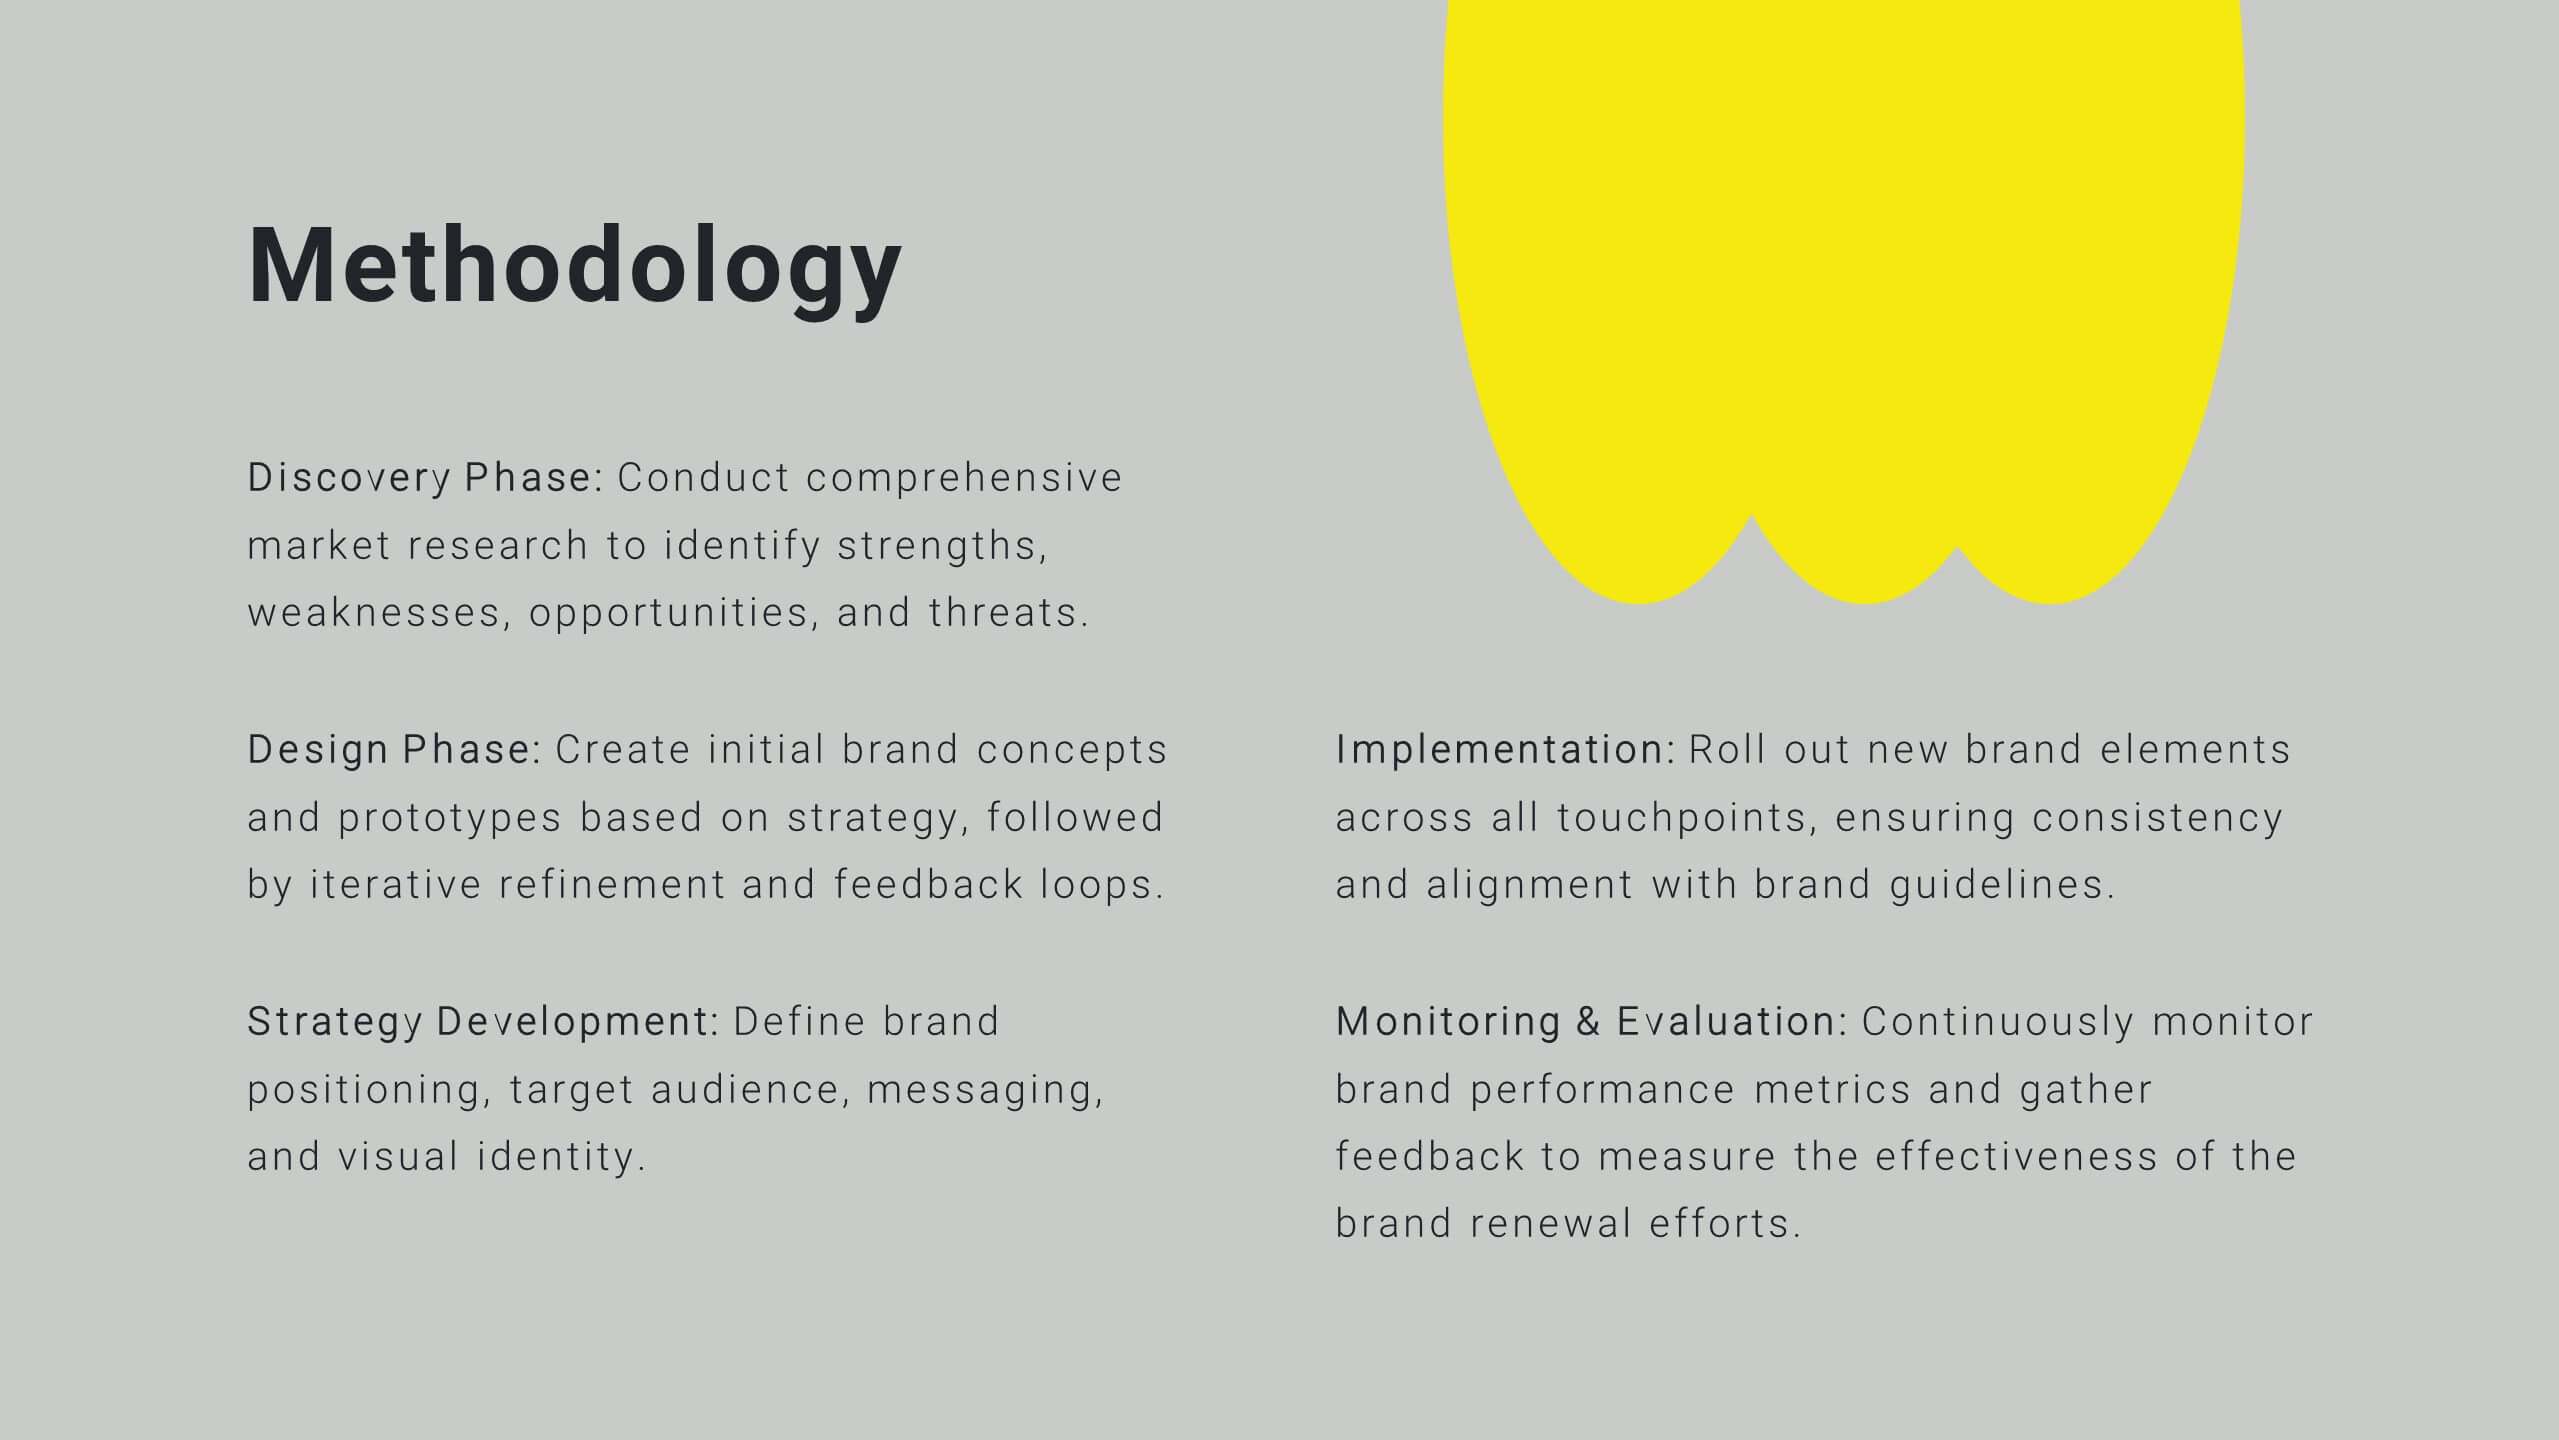
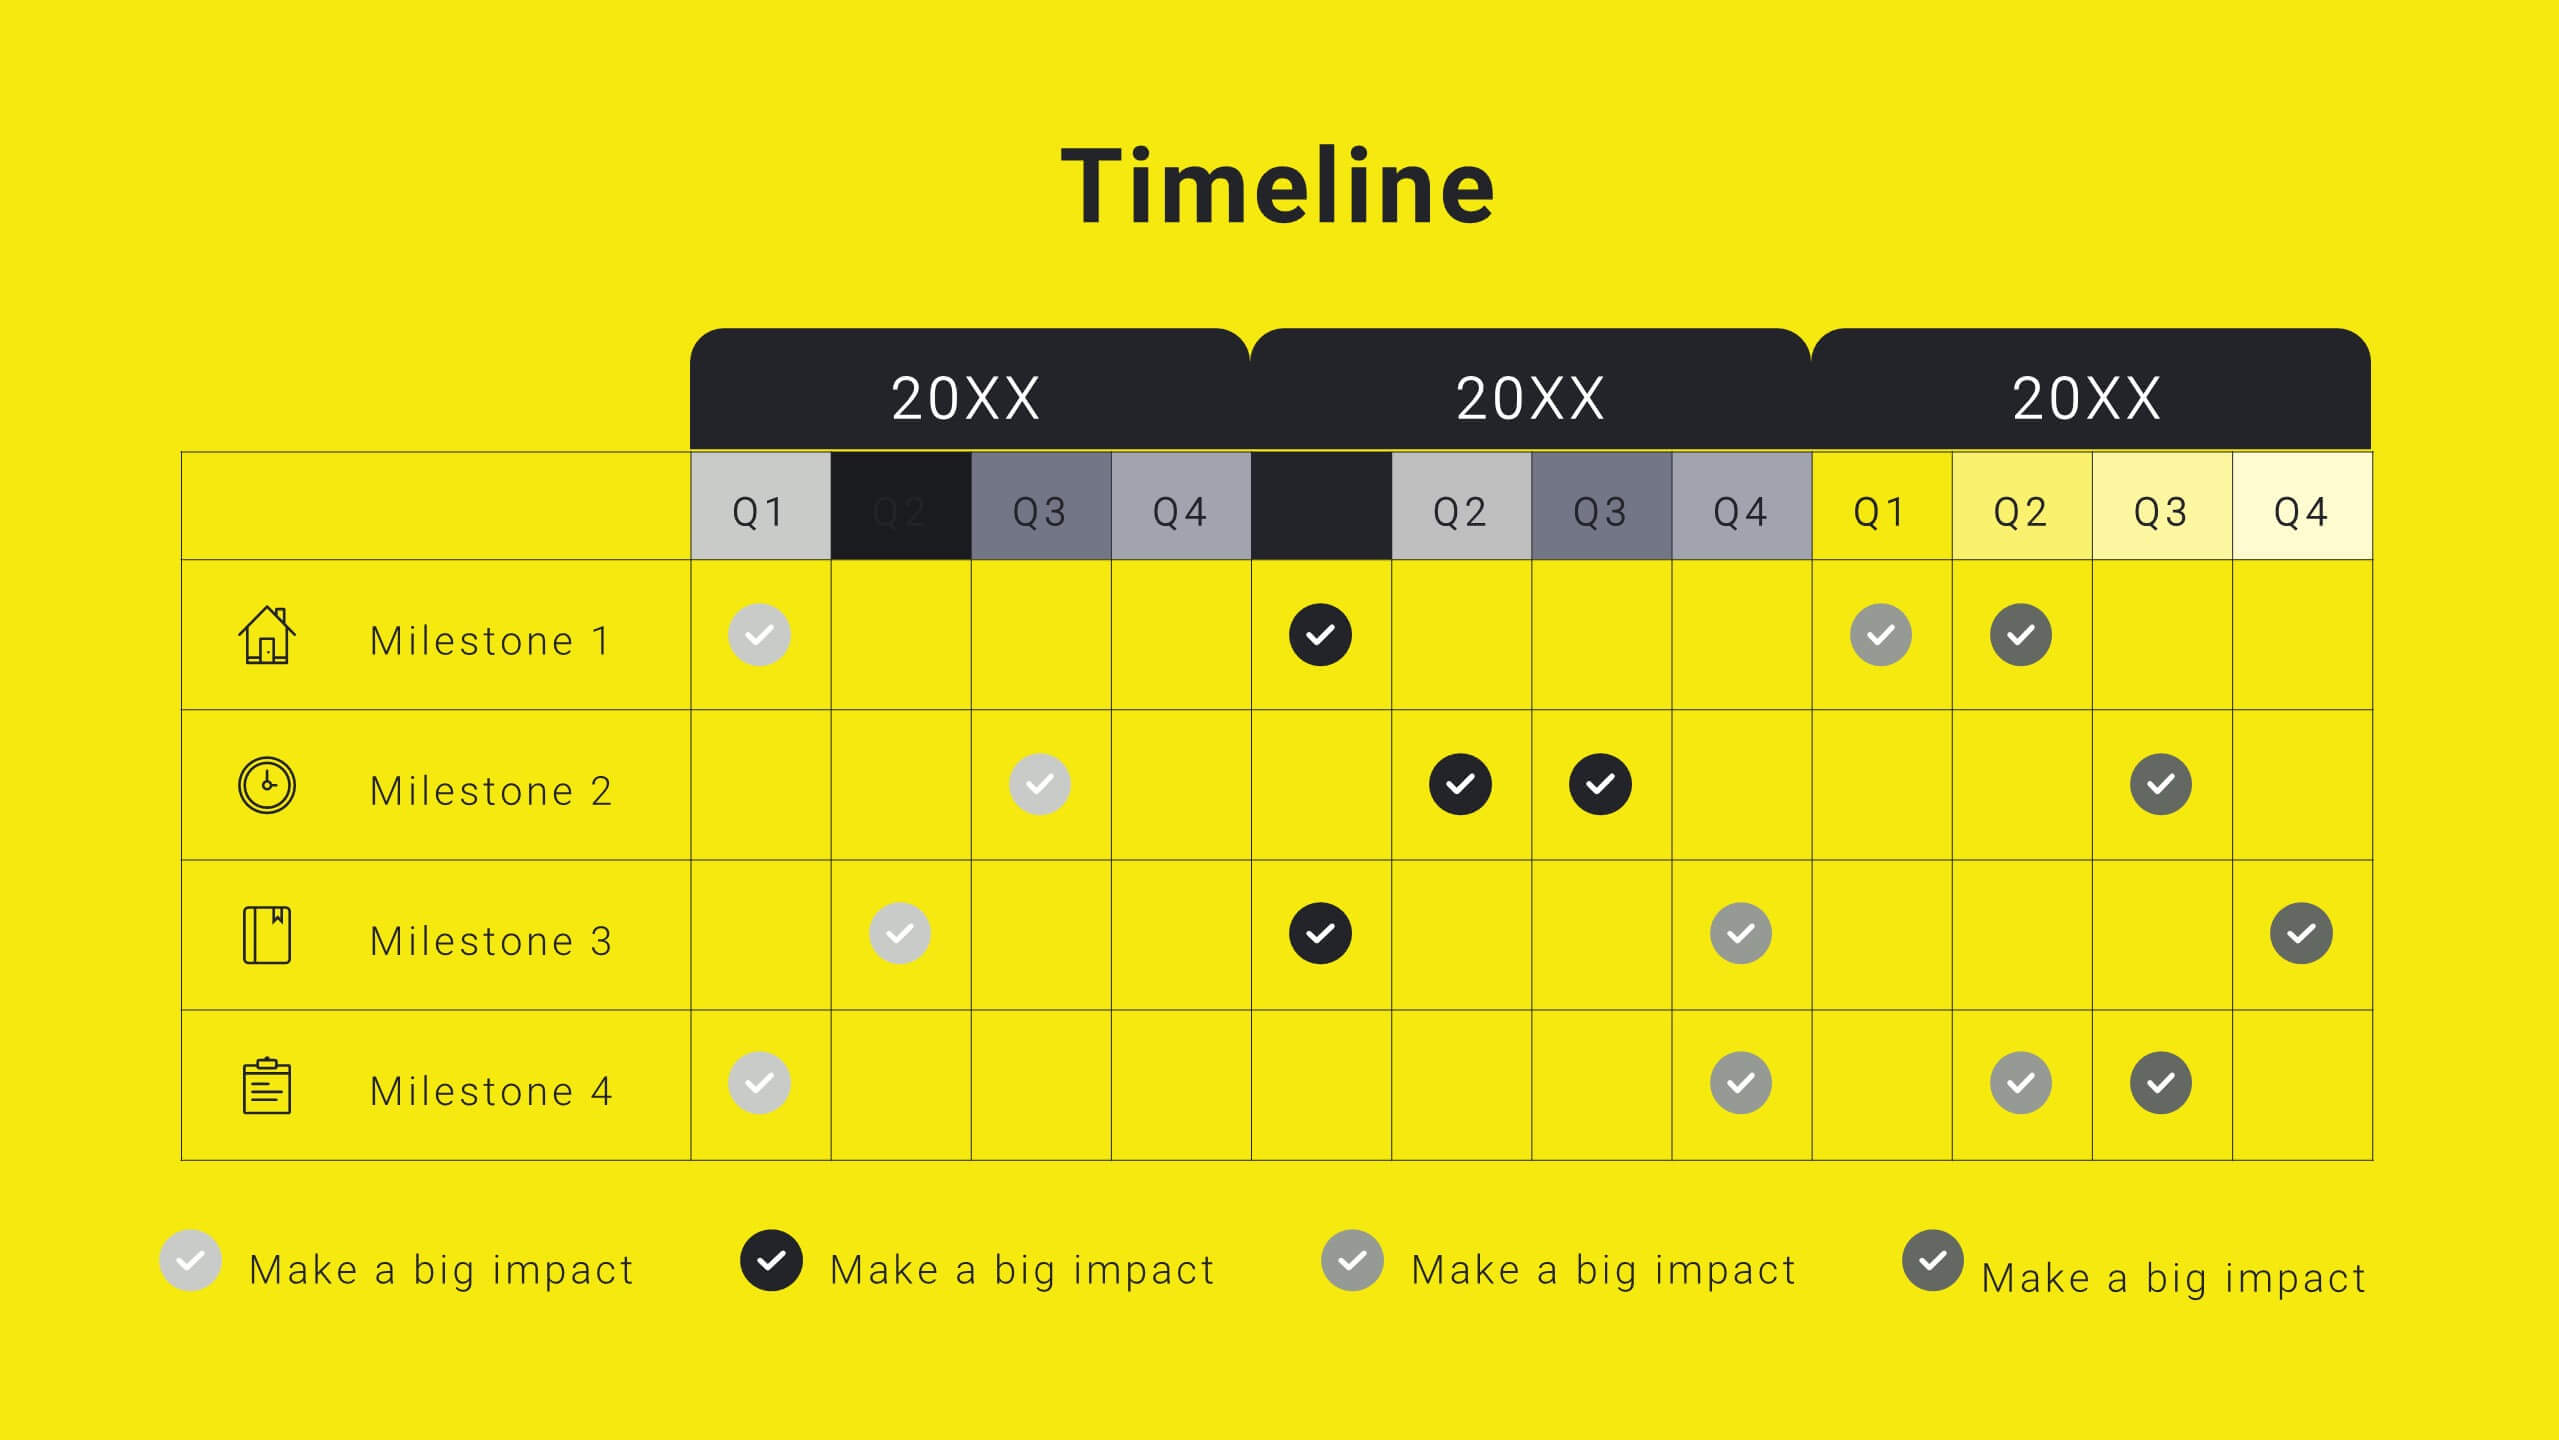
Nebula Project Proposal Presentation
Create a compelling project proposal with this structured, professional template! It includes sections for problem statements, proposed solutions, goals, timelines, and pricing. Perfect for organizing your ideas clearly and professionally, it's fully customizable and compatible with PowerPoint, Keynote, and Google Slides. This template makes it easy to present your proposals effectively and win clients.


10 diapositivas
Product Development Empathy Mapping Presentation
Enhance Product Development with Empathy Mapping! This Product Development Empathy Mapping template provides a structured framework to visualize user insights, emotions, and needs. Featuring a quadrant-based layout, it allows product managers, UX designers, and business strategists to analyze user experiences and make informed decisions. Fully customizable in PowerPoint, Keynote, and Google Slides, this template ensures a professional and engaging approach to customer-centric design.


4 diapositivas
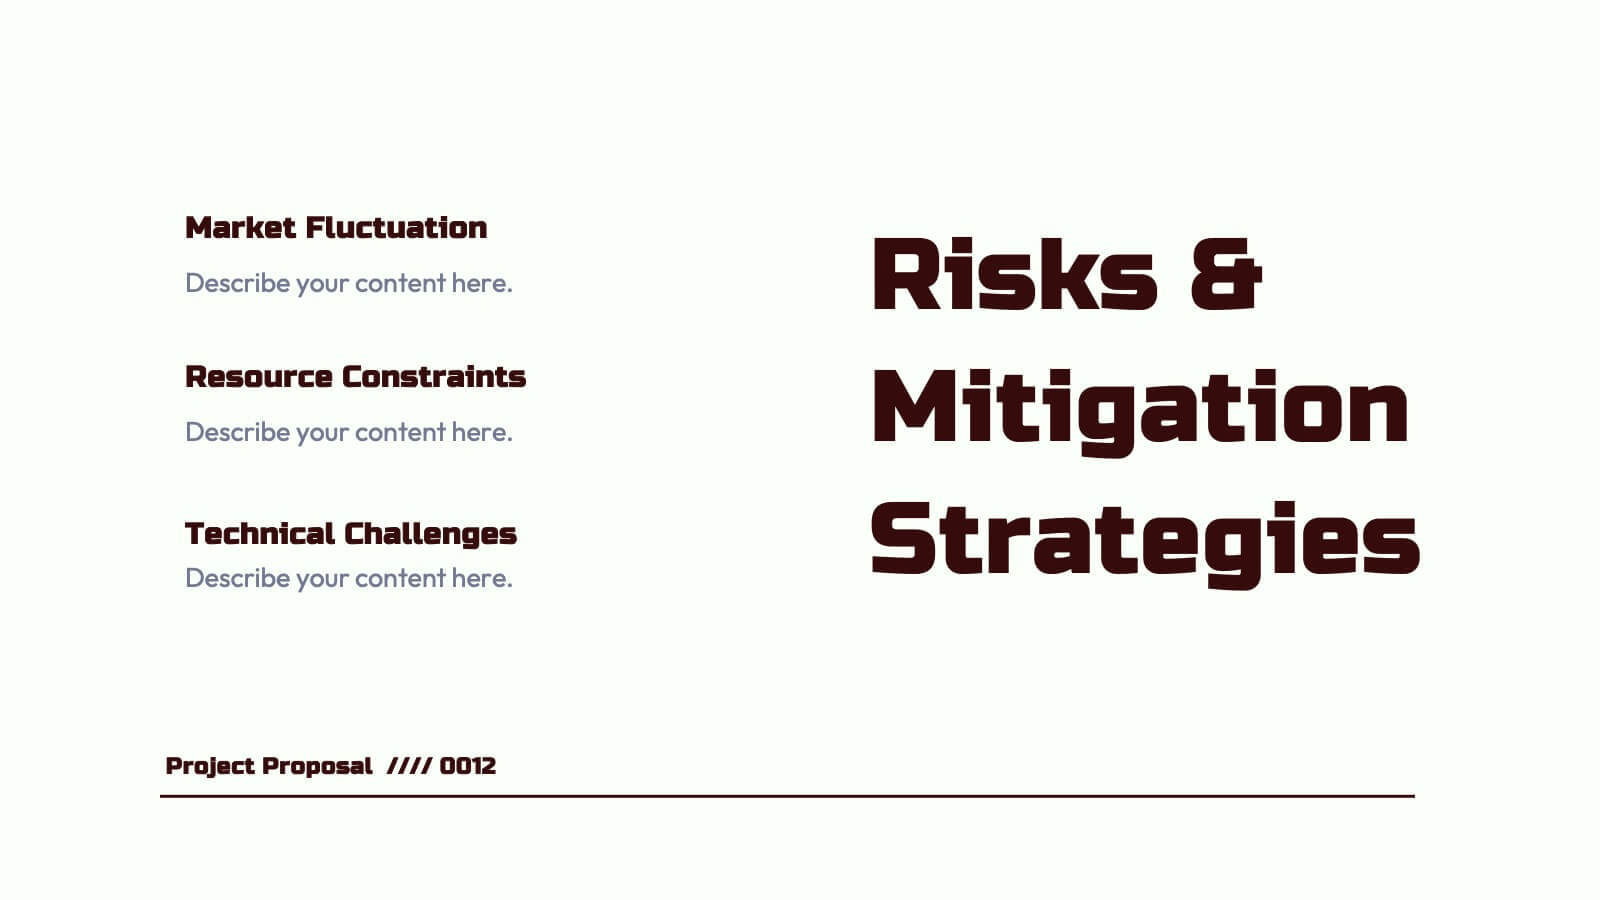
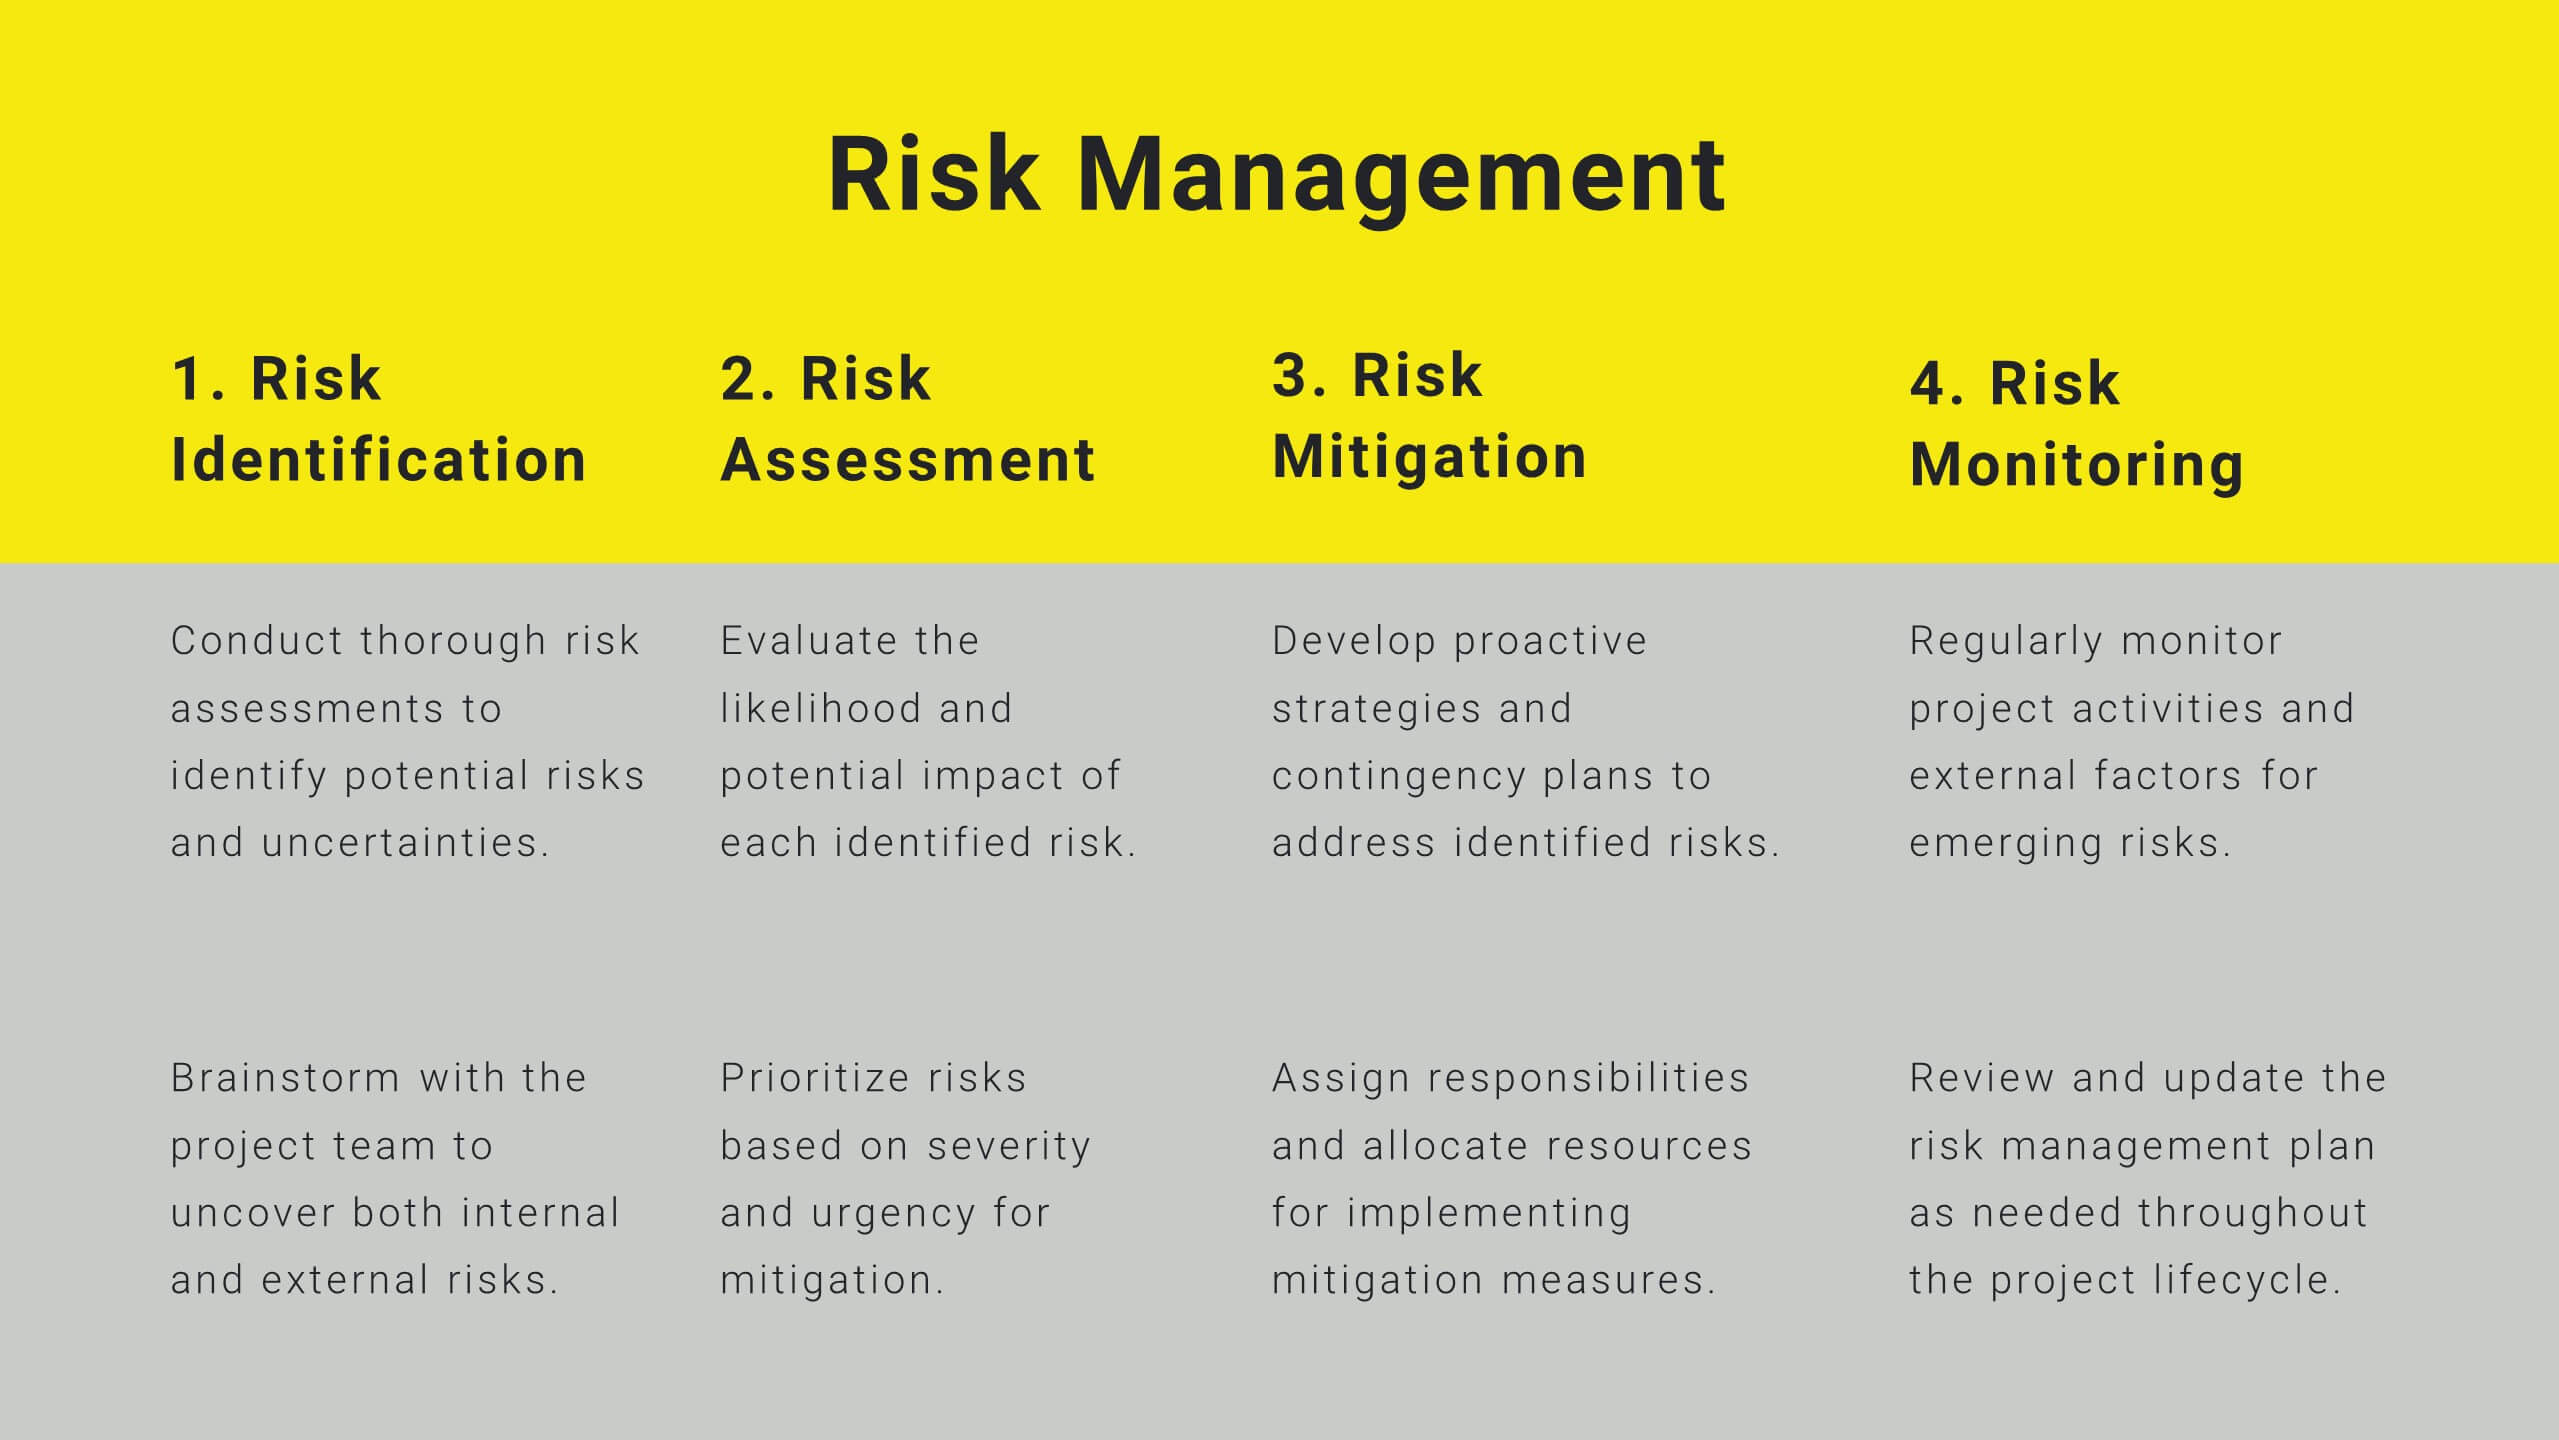
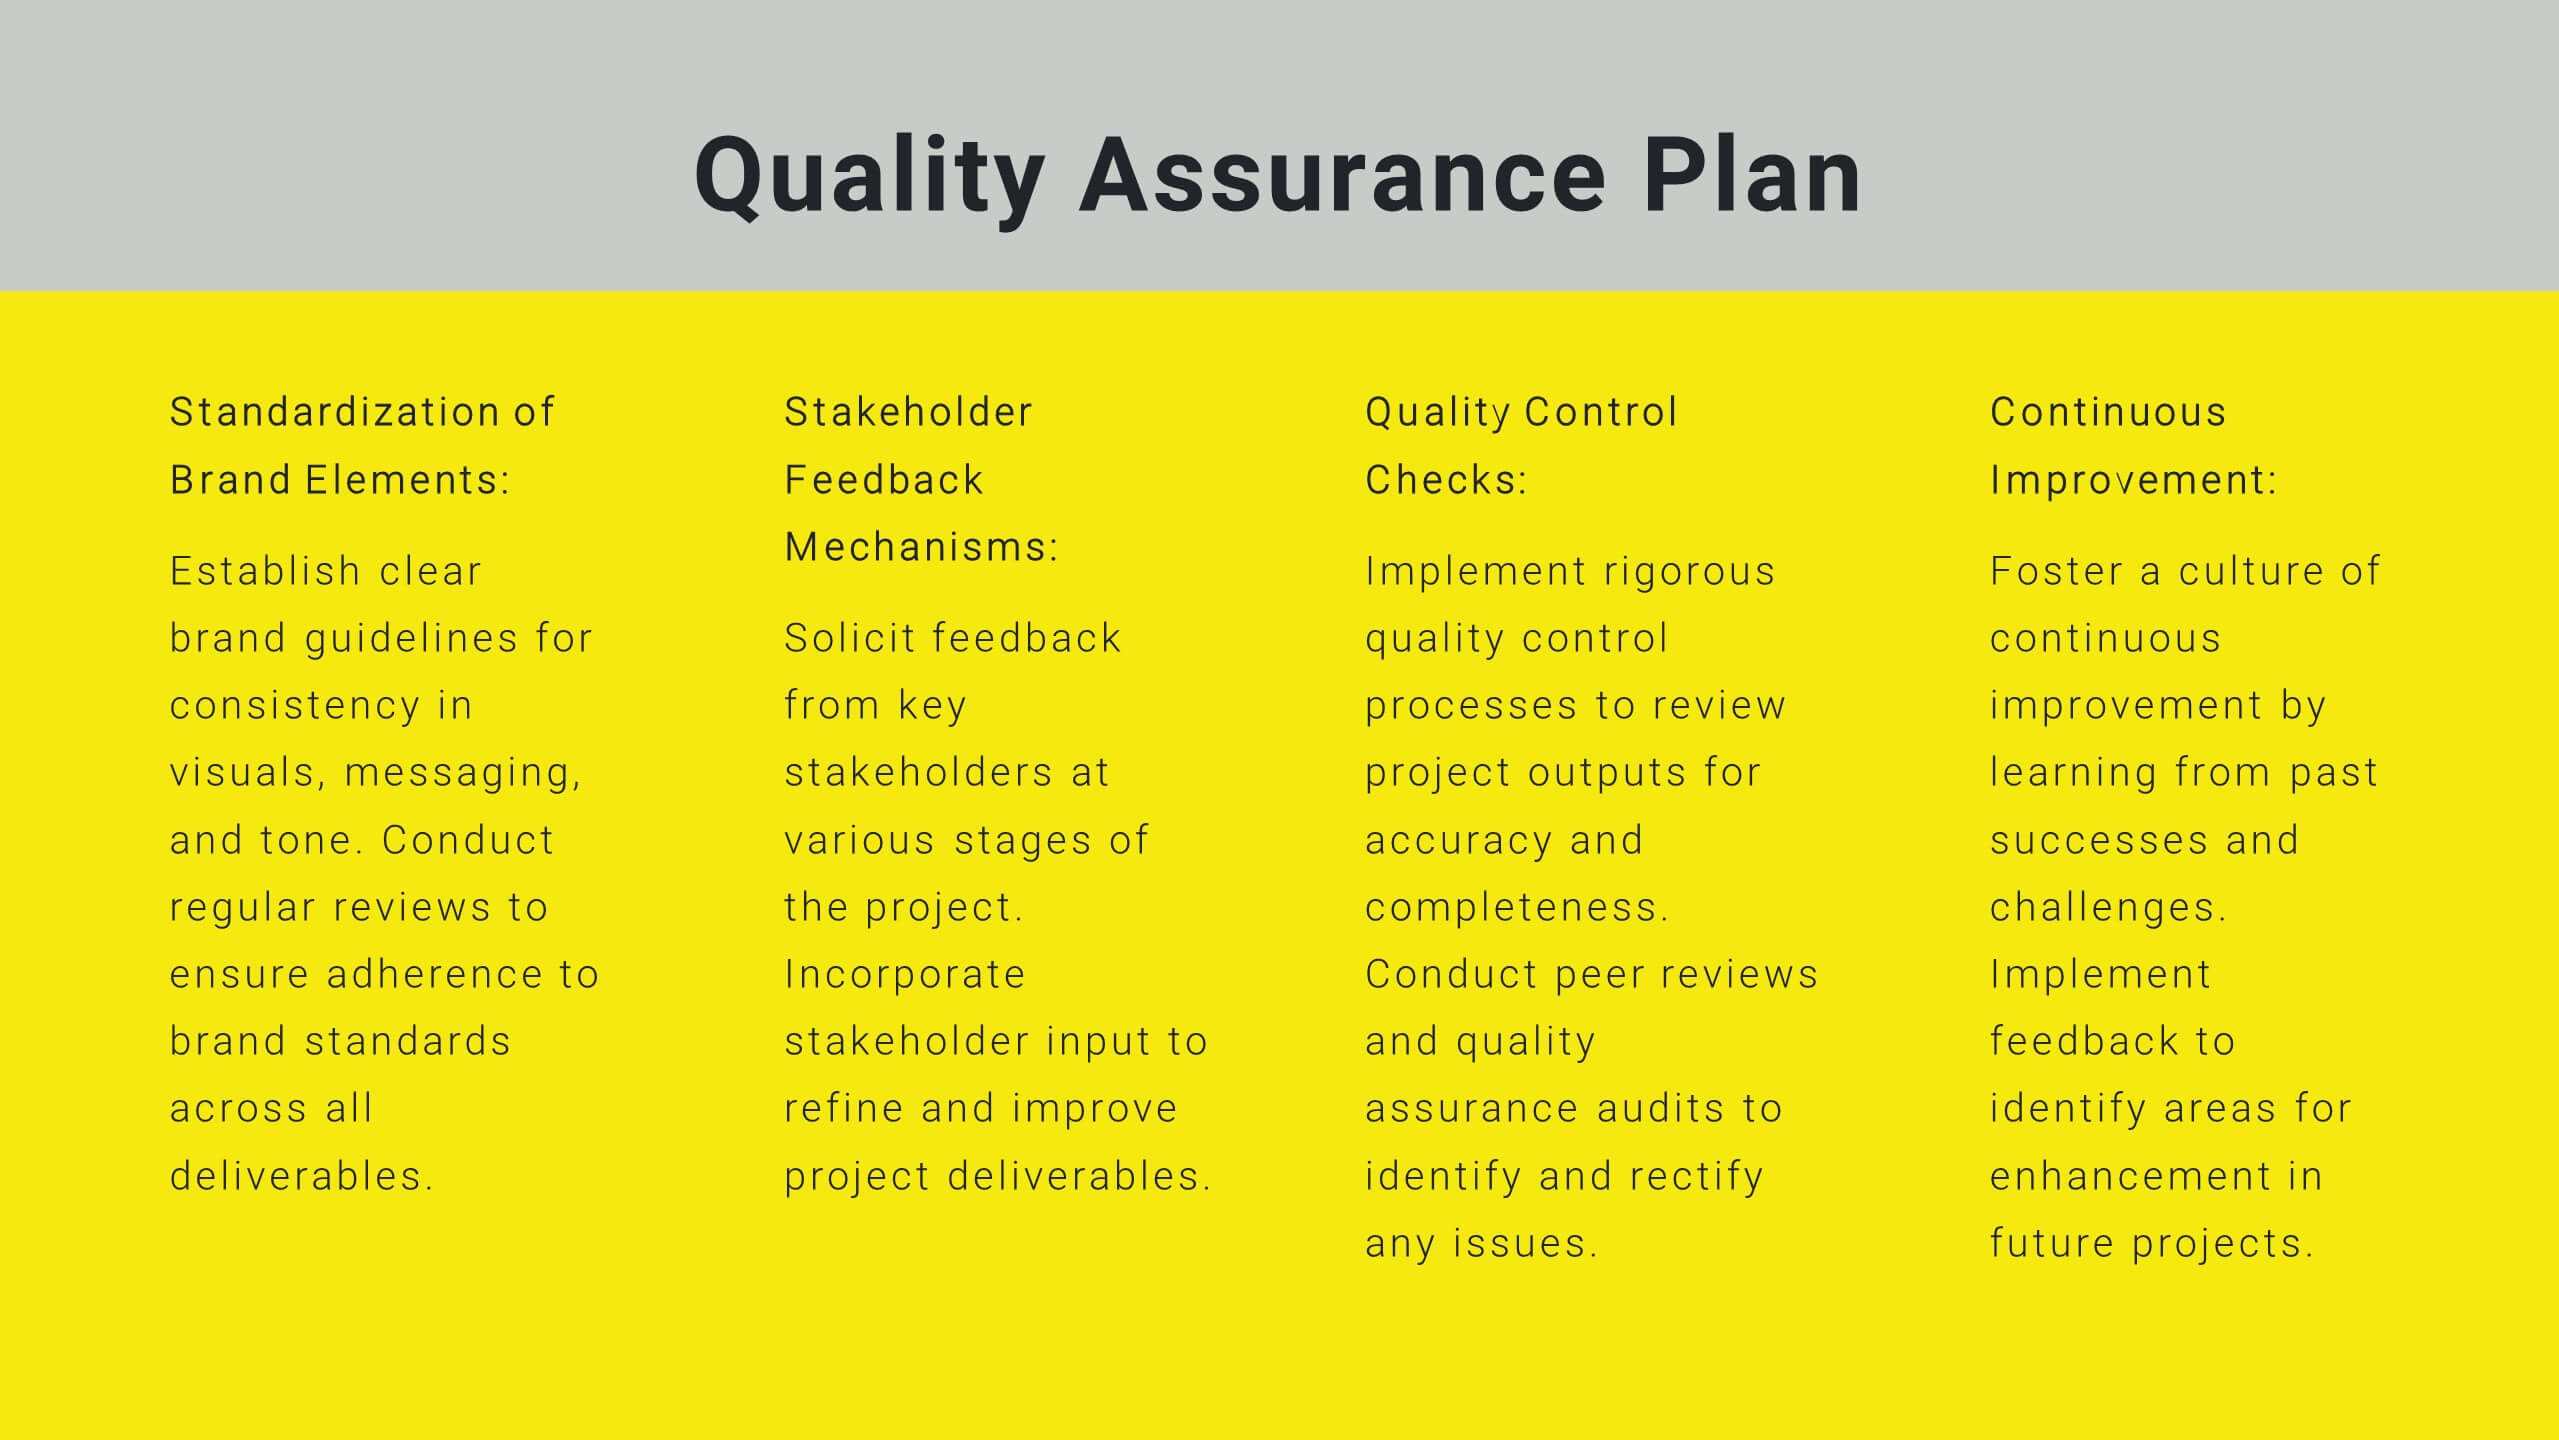
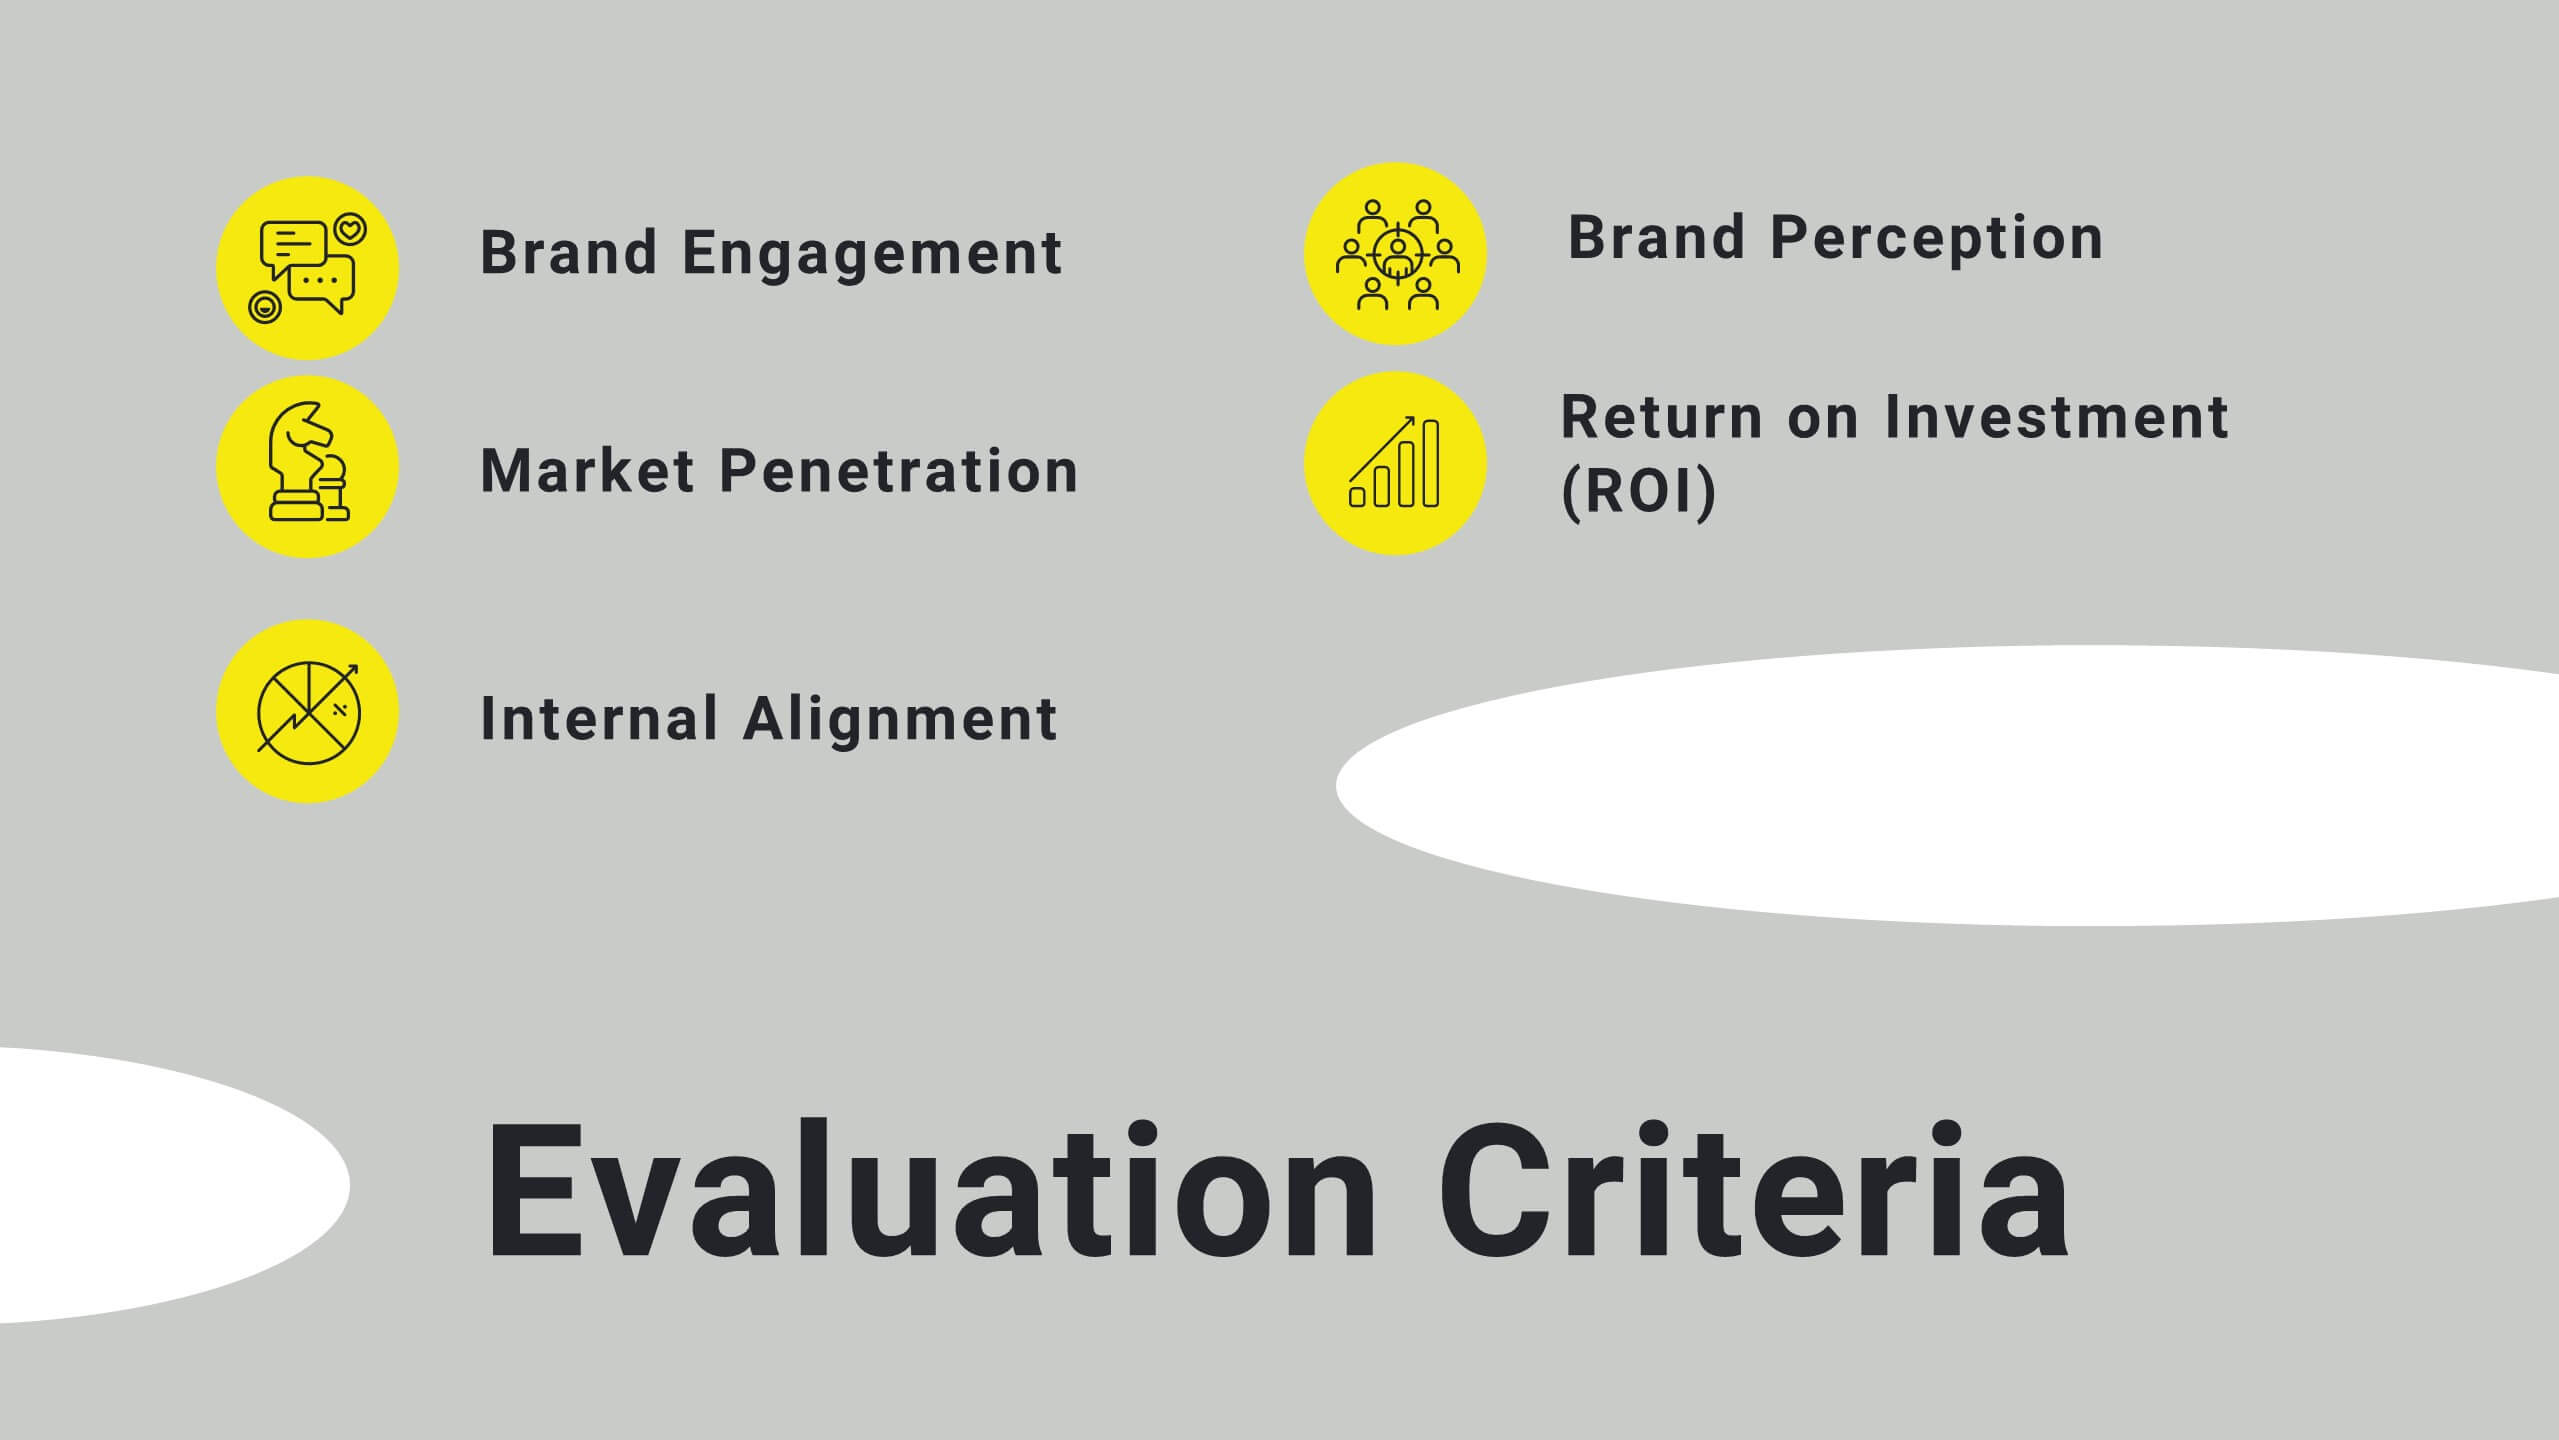
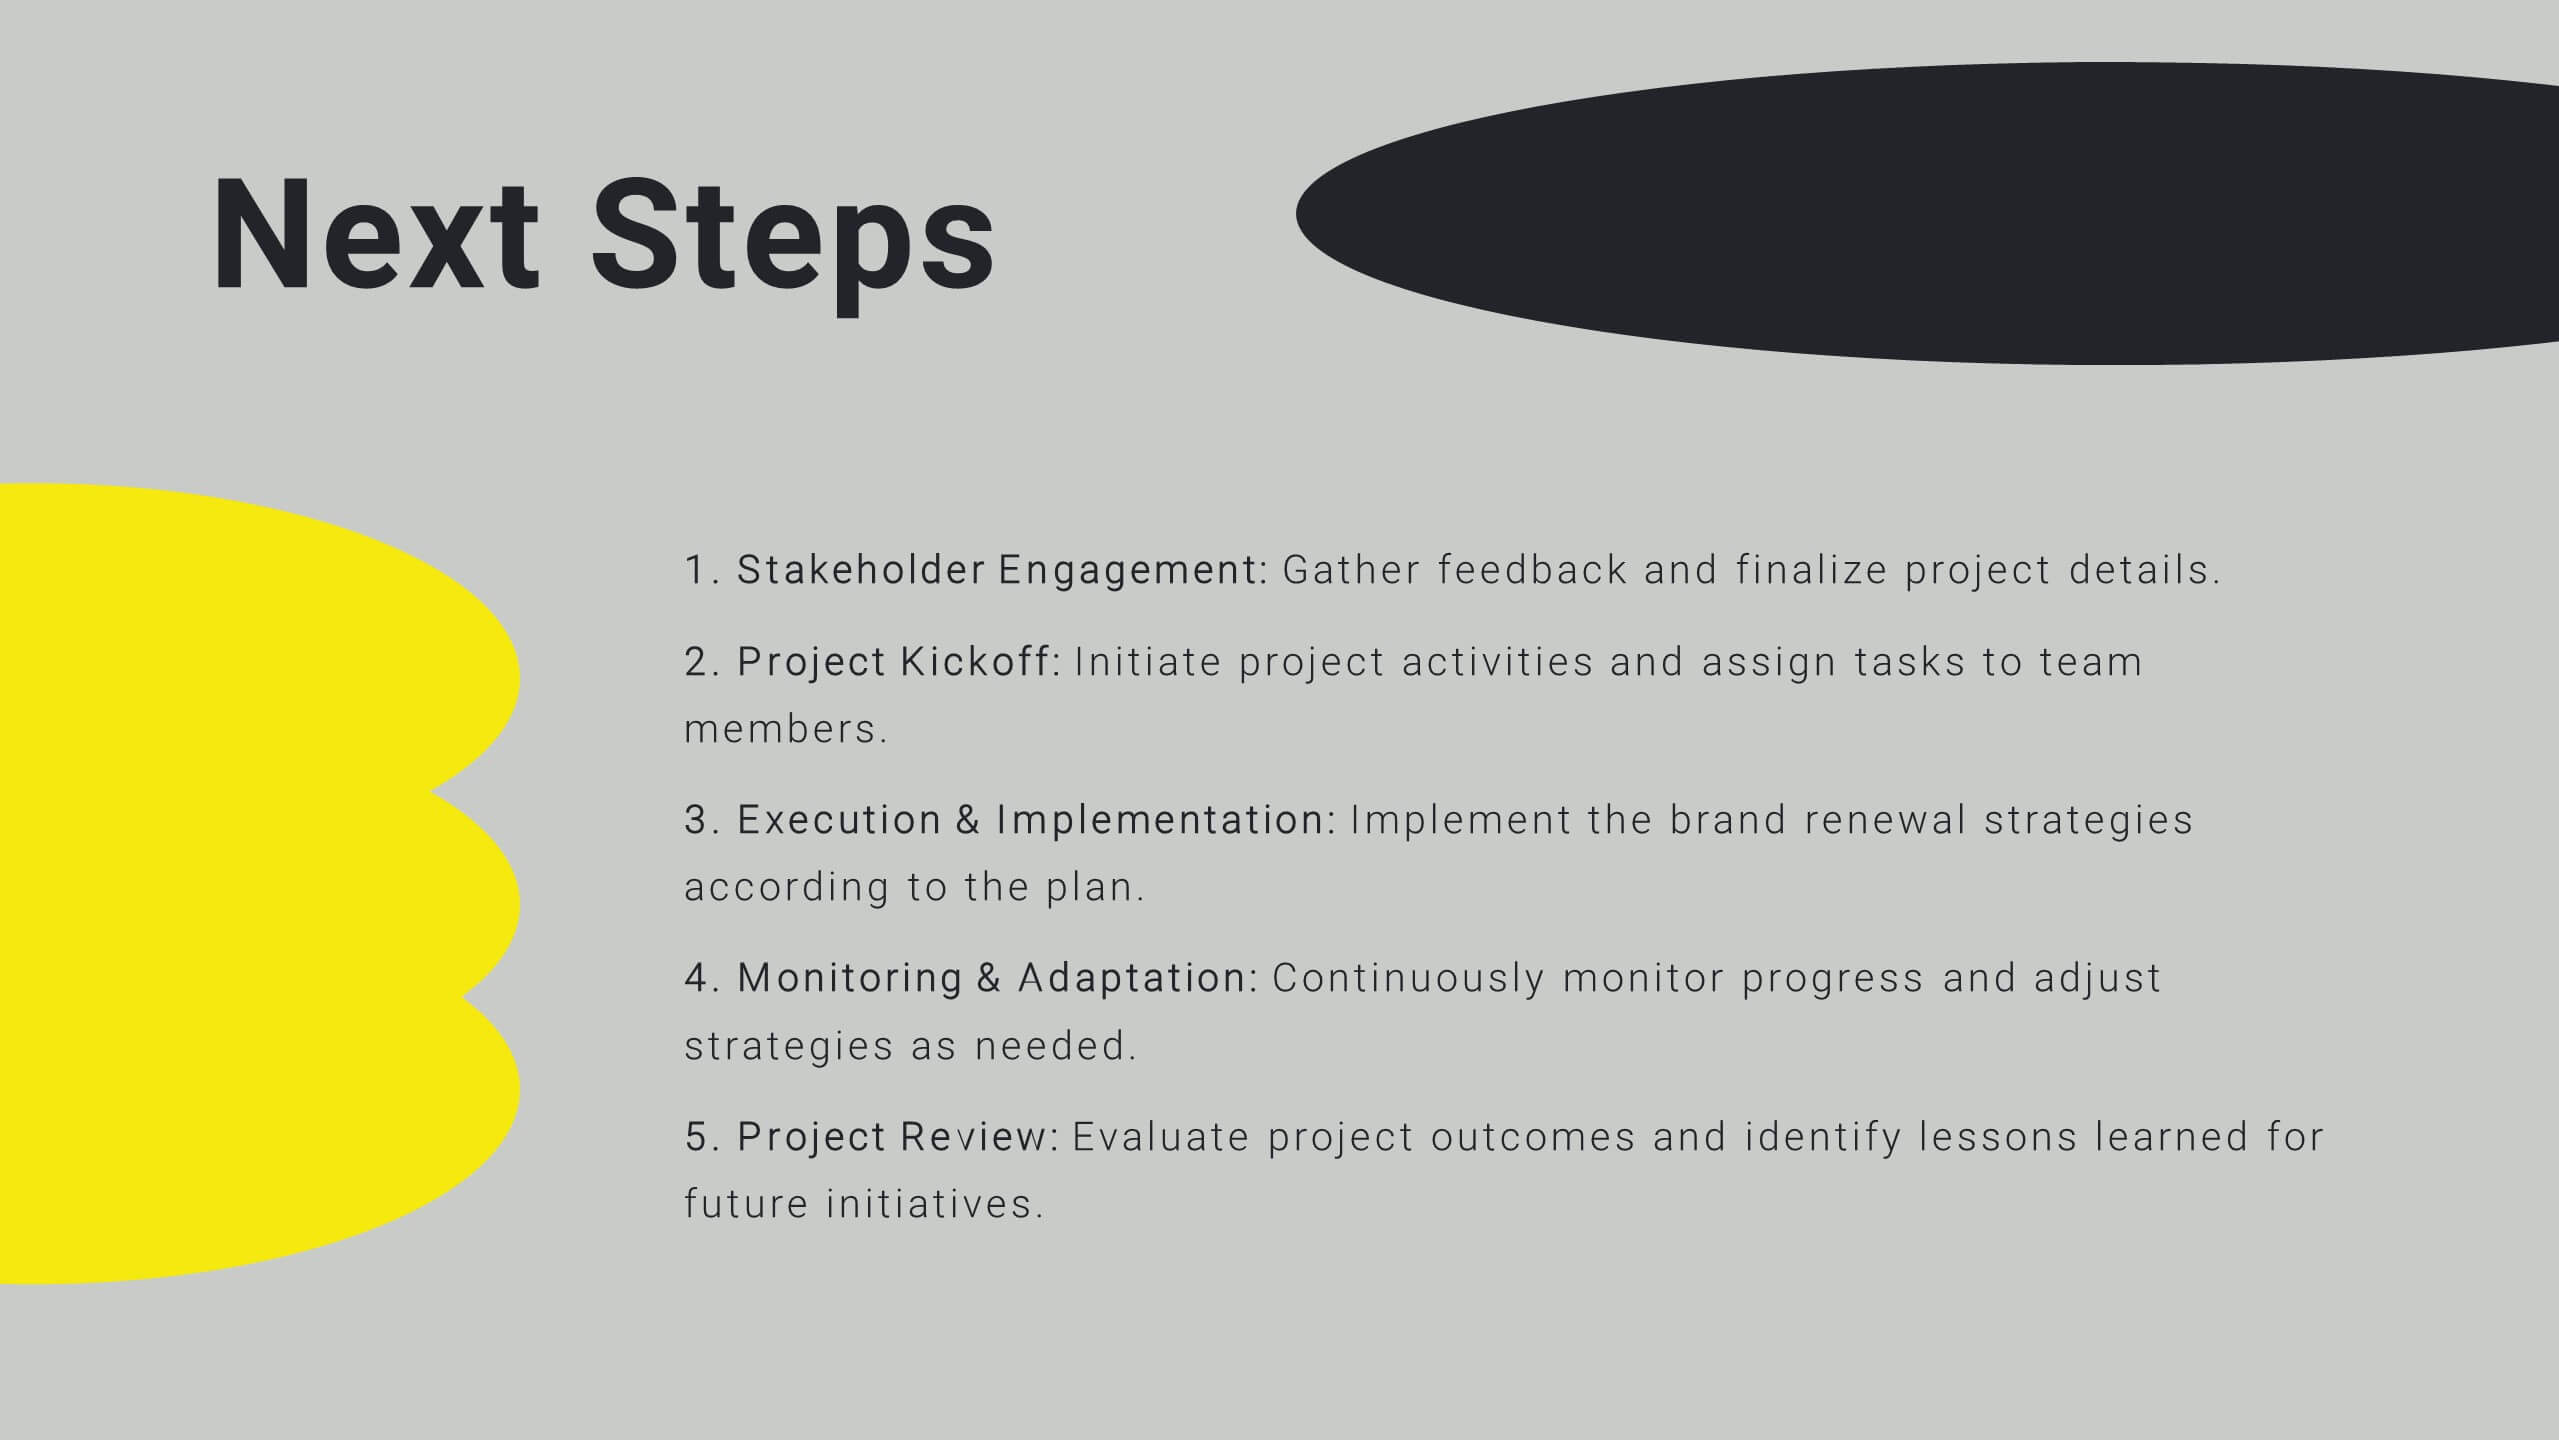
Strategic Risk Assessment and Control Presentation
Highlight layered risk priorities with the Strategic Risk Assessment and Control Presentation. This visual template uses a 3D concentric model (D to A) to illustrate escalating risk levels or control measures. Ideal for risk managers and compliance teams. Fully editable in PowerPoint, Google Slides, and Canva for seamless customization.


5 diapositivas
Business Revenue and Expense Analysis Presentation
Present your financial growth and cost breakdowns with this 3D bar chart layout. Each bar is paired with clearly labeled sections to explain key revenue sources, expense categories, or profit margins. Ideal for business reviews, financial proposals, or investor reports. Fully editable in PowerPoint, Keynote, and Google Slides.


8 diapositivas
Effective Task Delegation with RACI Presentation
Streamline task ownership and team collaboration using this Effective Task Delegation with RACI template. Featuring a bold, visually segmented layout, this slide helps clearly define who is Responsible, Accountable, Consulted, and Informed for each step of your workflow. Perfect for project managers, HR leaders, and operations teams seeking to enhance clarity, reduce bottlenecks, and boost productivity. Fully customizable in PowerPoint, Keynote, and Google Slides to match your team structure and brand style.

21 diapositivas
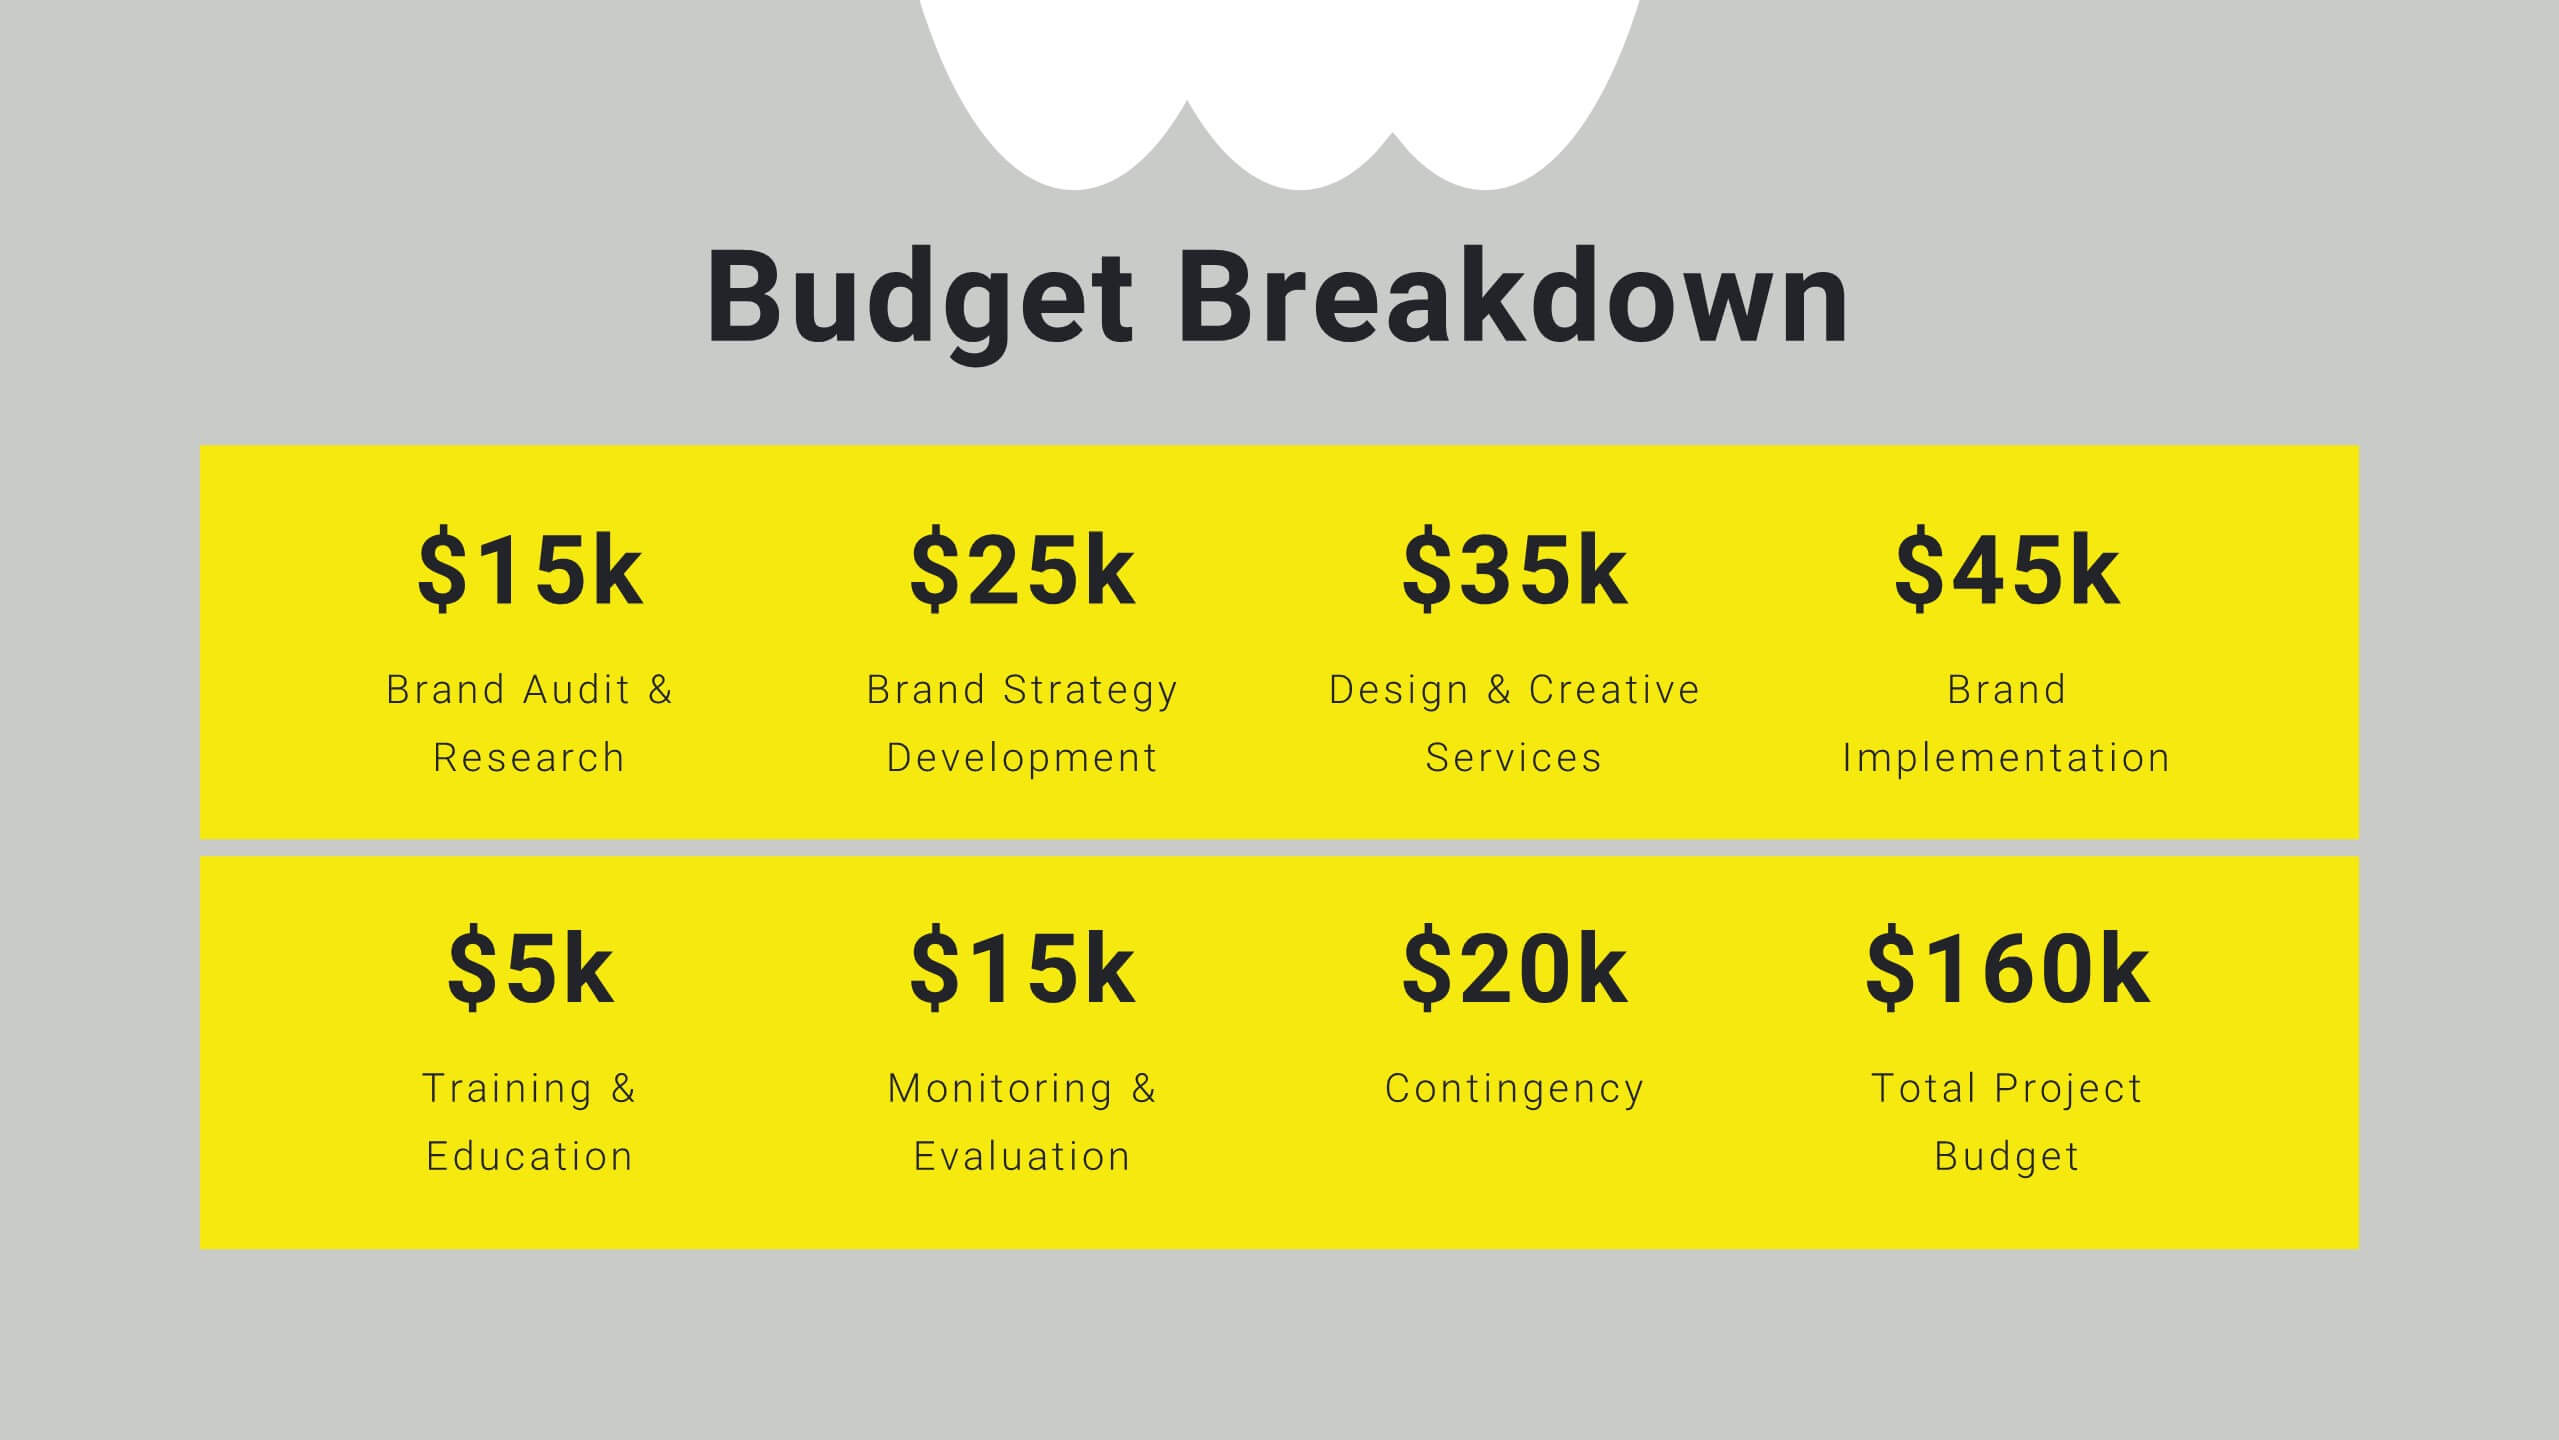
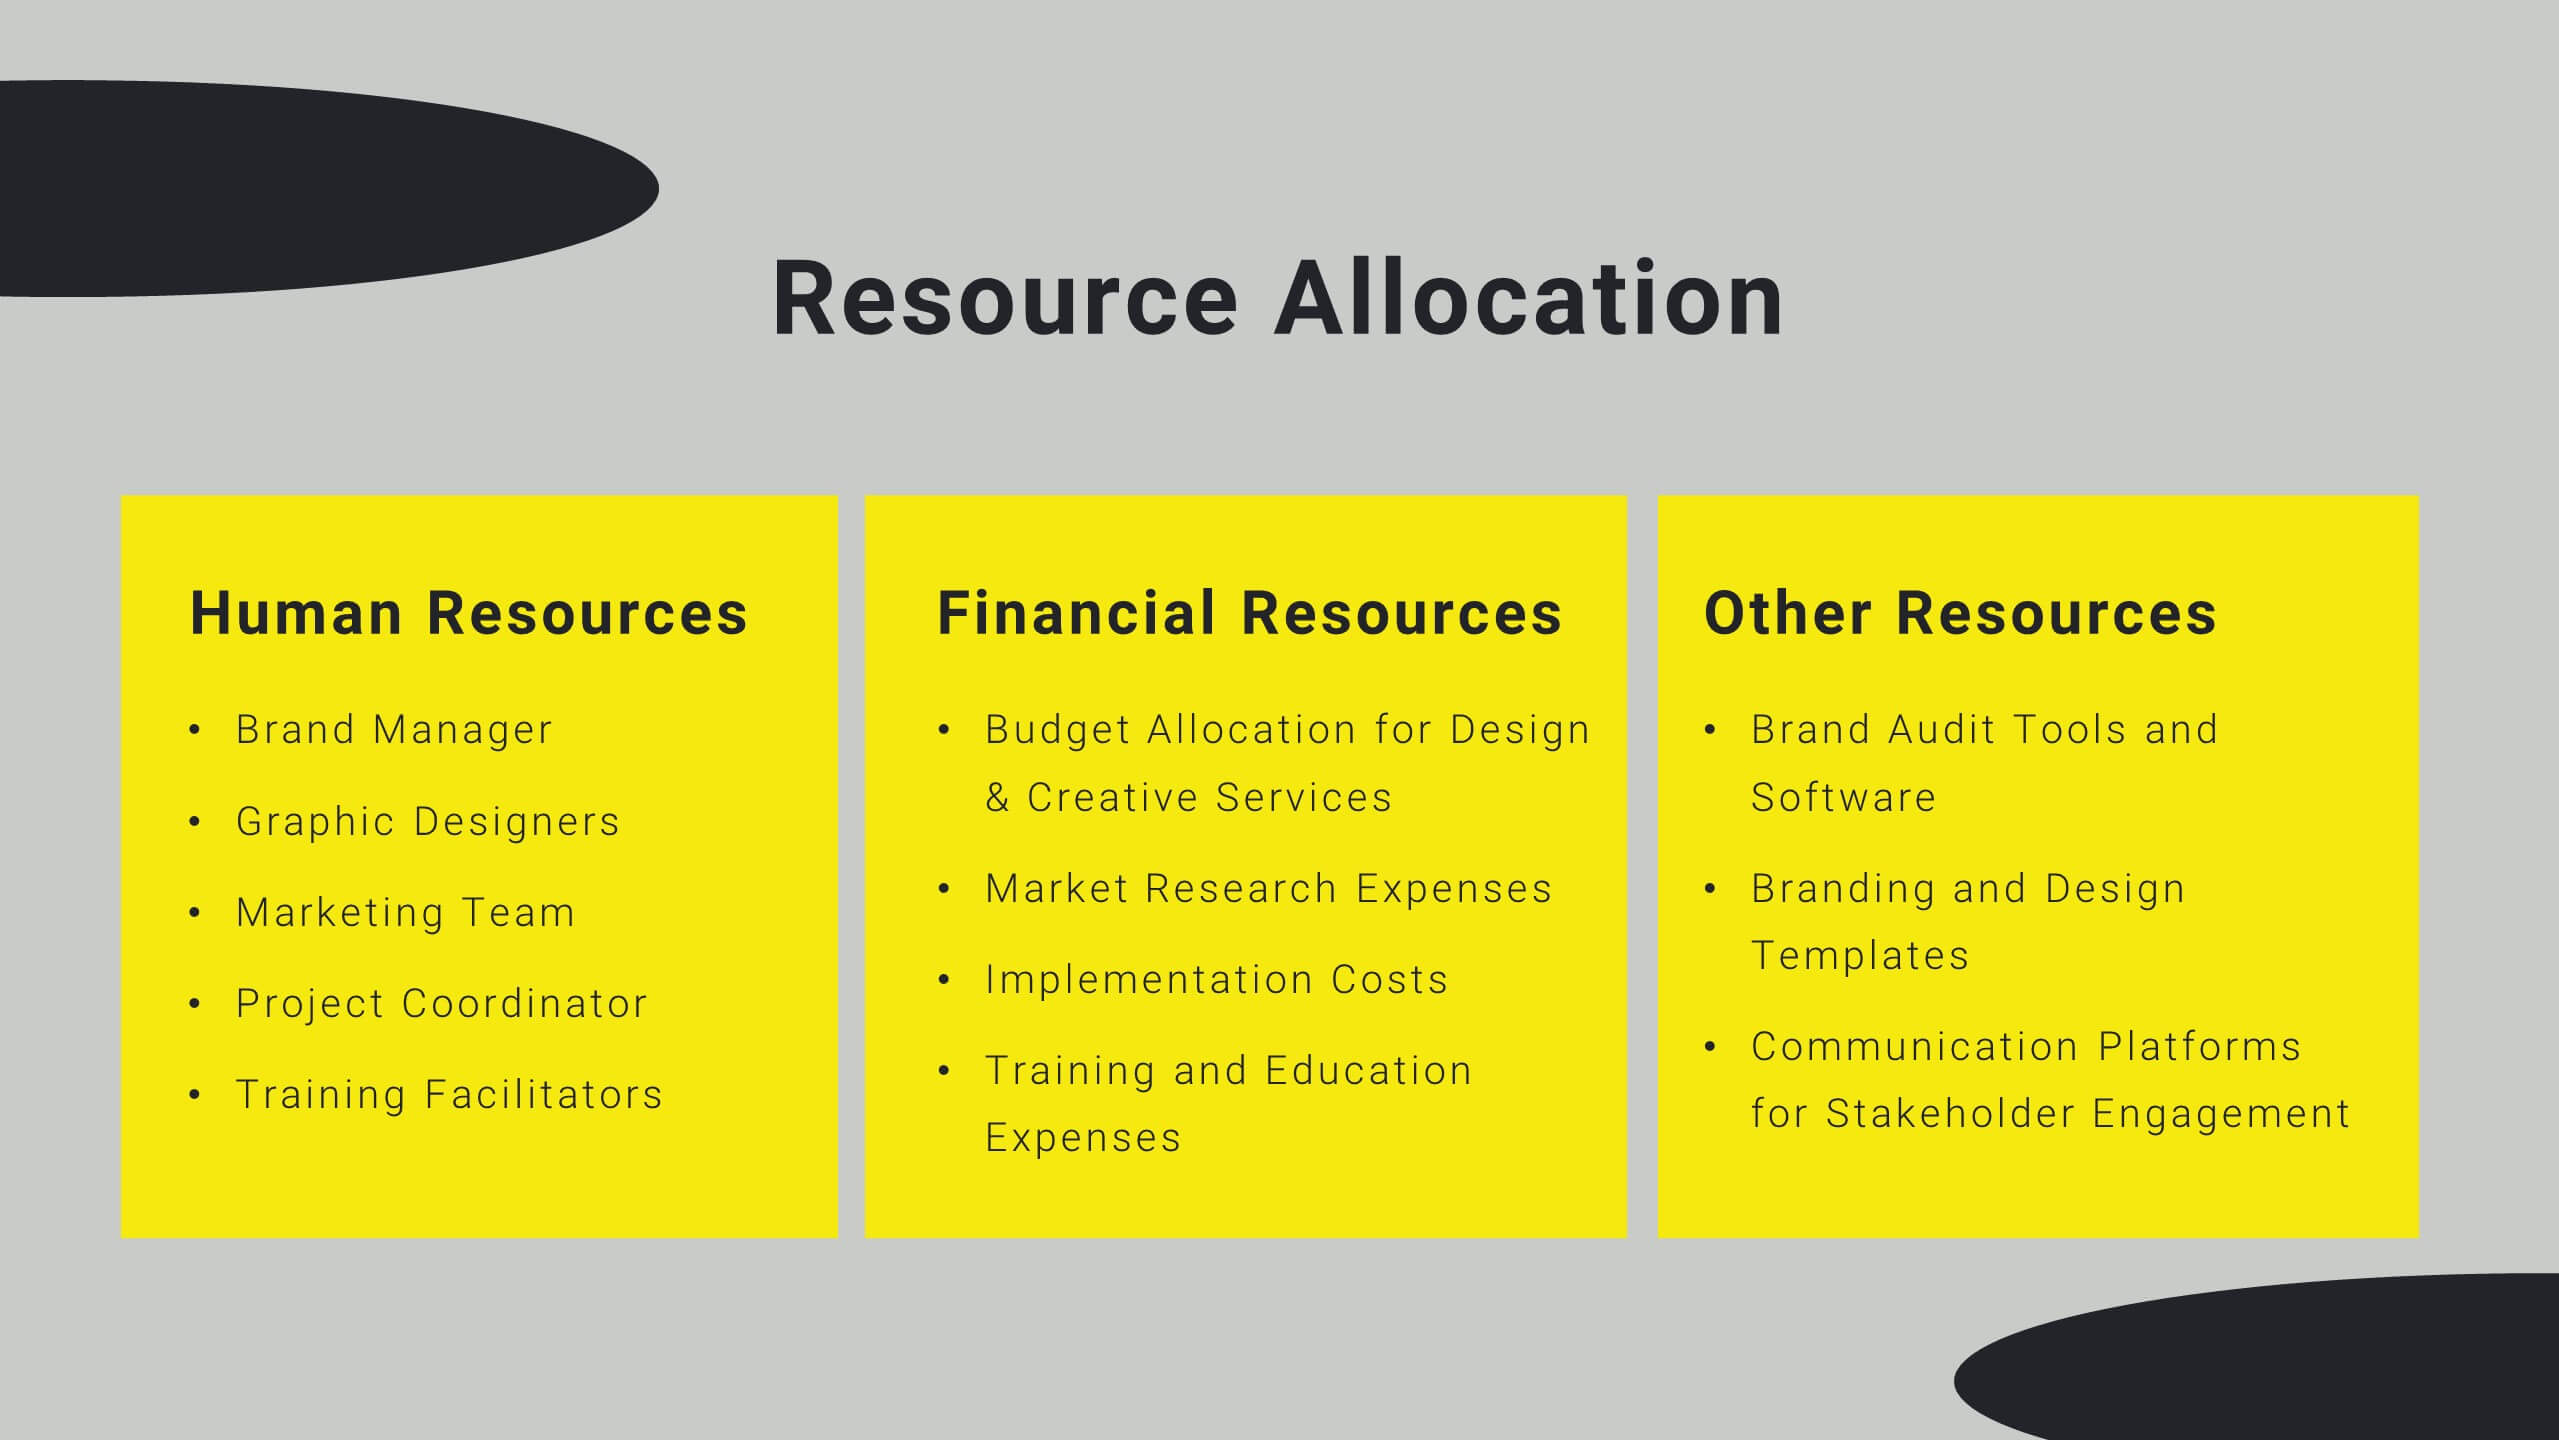
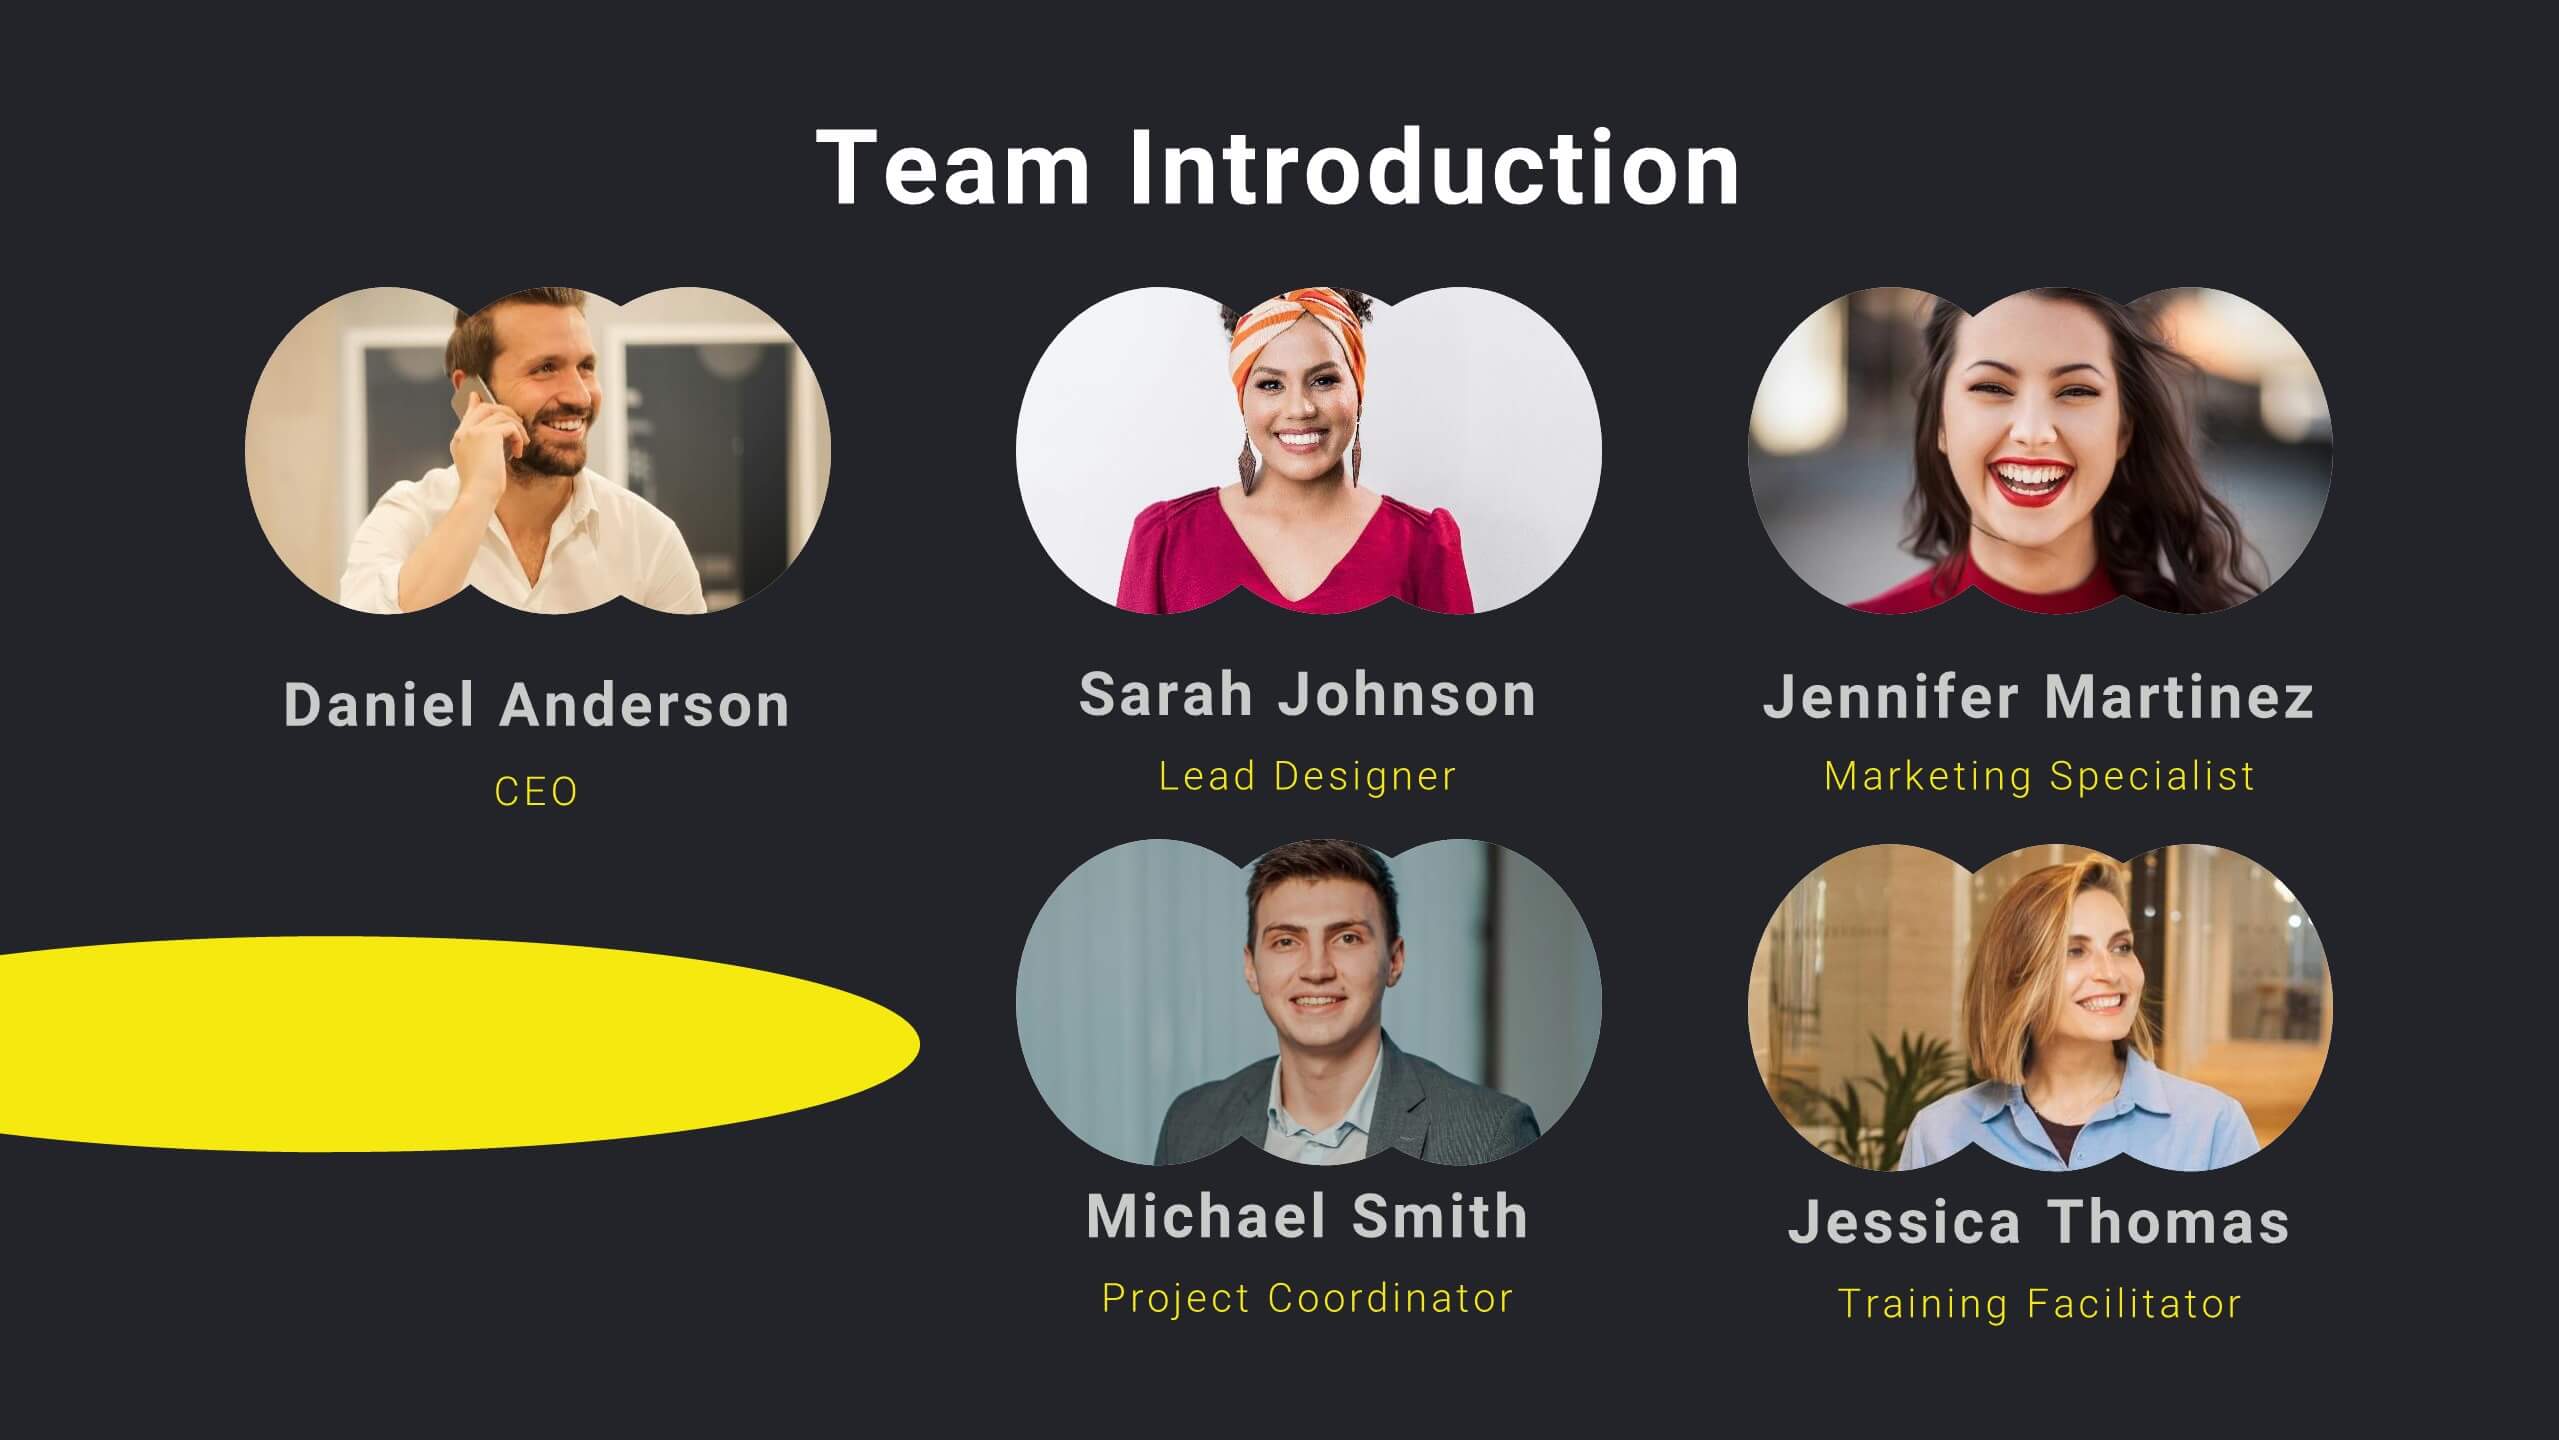
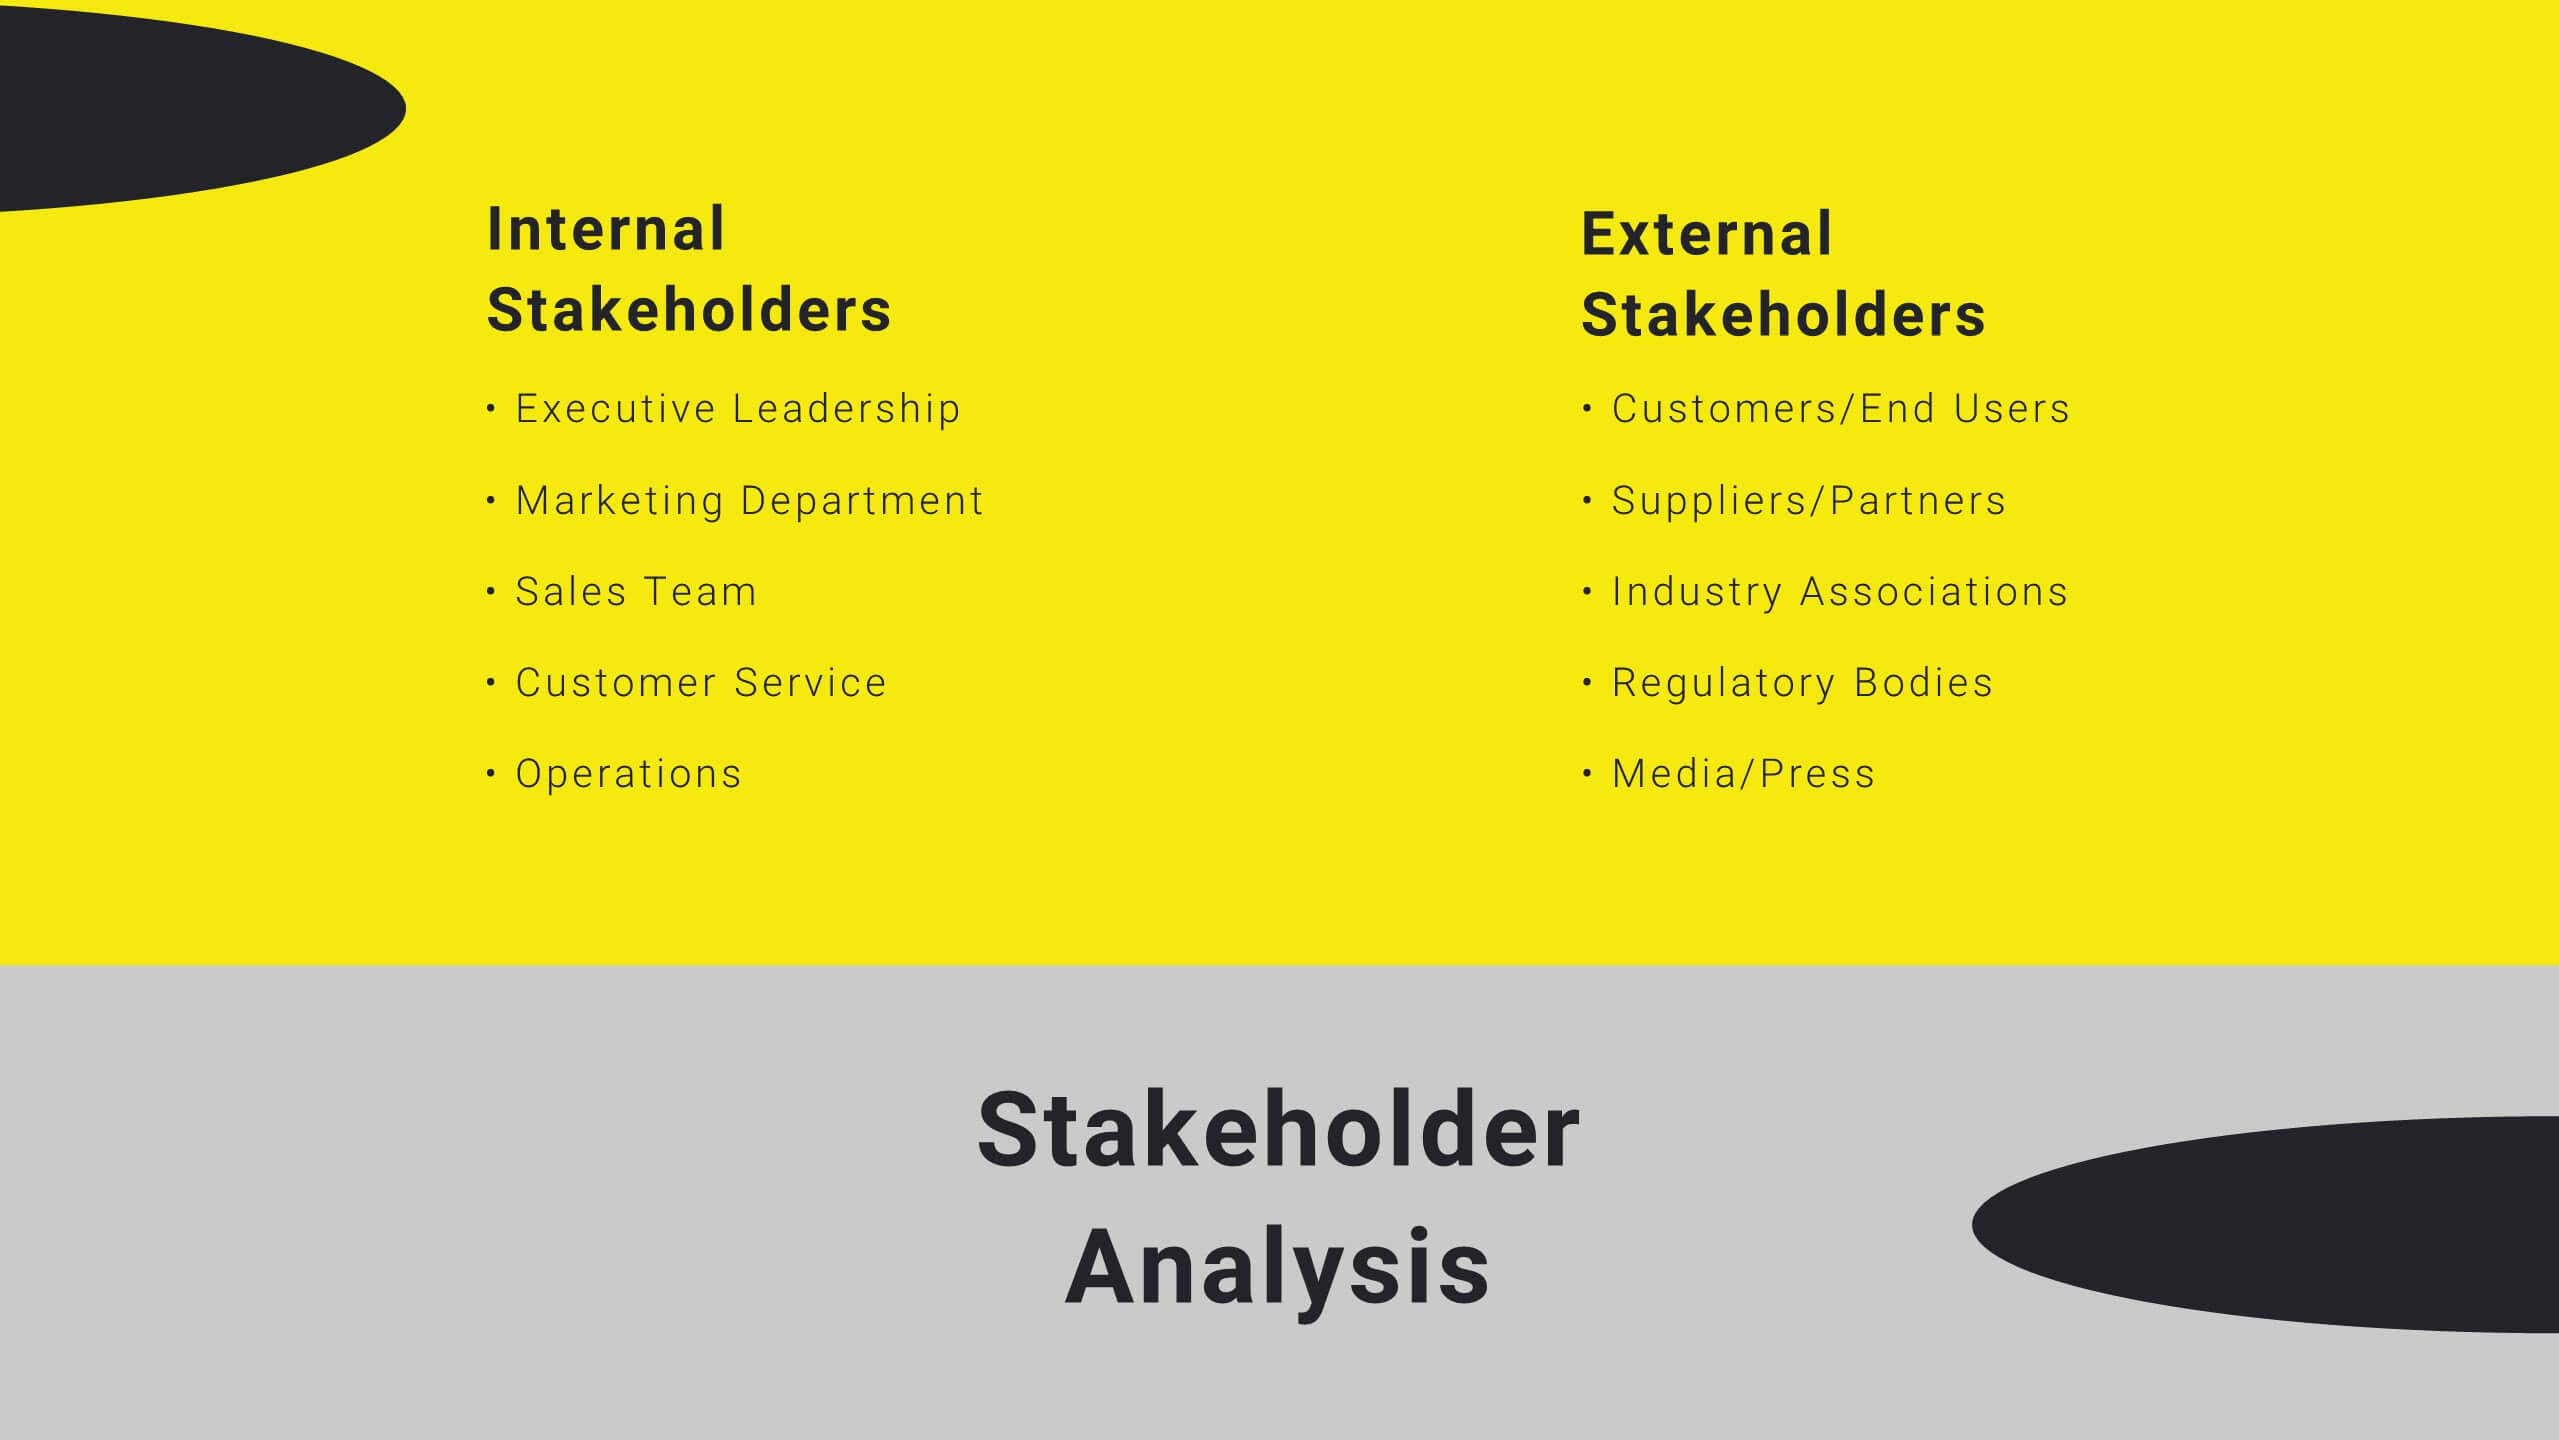
Sable Detailed Project Execution Plan Presentation
Master your project planning with this comprehensive execution plan template! Perfect for detailing project overviews, objectives, and timelines, it includes slides for budget breakdowns, resource allocation, and risk management. Ensure every detail is covered with structured content and clear visuals. Compatible with PowerPoint, Keynote, and Google Slides for seamless presentations on any platform.


4 diapositivas
Environmental Sustainability Strategy Presentation
The "Environmental Sustainability Strategy" presentation template is a visually engaging tool designed to outline an organization's approach to integrating sustainable practices into its operations. The template illustrates the journey from social to environmental and corporate sustainability, represented by seedlings growing into mature plants, symbolizing development and growth in sustainable practices. This template is perfect for businesses aiming to communicate their commitment to sustainability, detailing specific strategies and milestones in social, environmental, and corporate domains. It encourages viewers to think about the progressive stages of implementing sustainable actions within a corporate framework.


10 diapositivas
Customer Market Segmentation Strategy Presentation
Define and visualize your audience with the Customer Market Segmentation Strategy Presentation. This slide layout helps you categorize customer types using clean iconography and a central persona model. Ideal for marketing teams, sales strategists, or startup pitches. Customize easily in Canva, PowerPoint, Google Slides, or Keynote.


7 diapositivas
Medical Group Infographic
introducing our medical group infographic, a seamless blend of clinical precision and informative clarity. Designed predominantly in a calming palette of white and healing green, this infographic effectively encapsulates the diverse facets of a medical group. Through a series of graphics, specialized medical icons, and dedicated image placeholders, one can effortlessly convey intricate medical processes or healthcare strategies. This template is ideally suited for healthcare administrators, medical educators, hospital marketing teams, and anyone striving to present complex medical group data in a simplified, digestible manner.
7 diapositivas
Six Arrow Infographic Presentation
A Arrow infographic is an effective visual tool that can help communicate a process or a series of steps in a clear and engaging way. The arrows represent the sequential flow of steps or actions and text boxes are included to further explain each step. This template includes pre-made layouts so all that is left to do is add your own text, images, and colors. This is a perfect way to communicate your message. With a clean, contemporary look, this template will help you raise awareness about your cause and spread your ideas. This is perfect for any of your business or academic projects!


7 diapositivas
Company Insurance Infographic Presentation
An Insurance Infographic is a visual representation of data related to the insurance industry. You can educate consumers on insurance policies, coverage options, and industry trends. This template includes a combination of data, statistics, and graphics that help explain key concepts related to insurance. You can use this infographic to include information on different types of insurance policies, claims, premiums, and industry-specific trends. Designed in Powerpoint, Keynote, and Google Slides this is a powerful tool for communicating complex insurance concepts in a simple and engaging way.


4 diapositivas
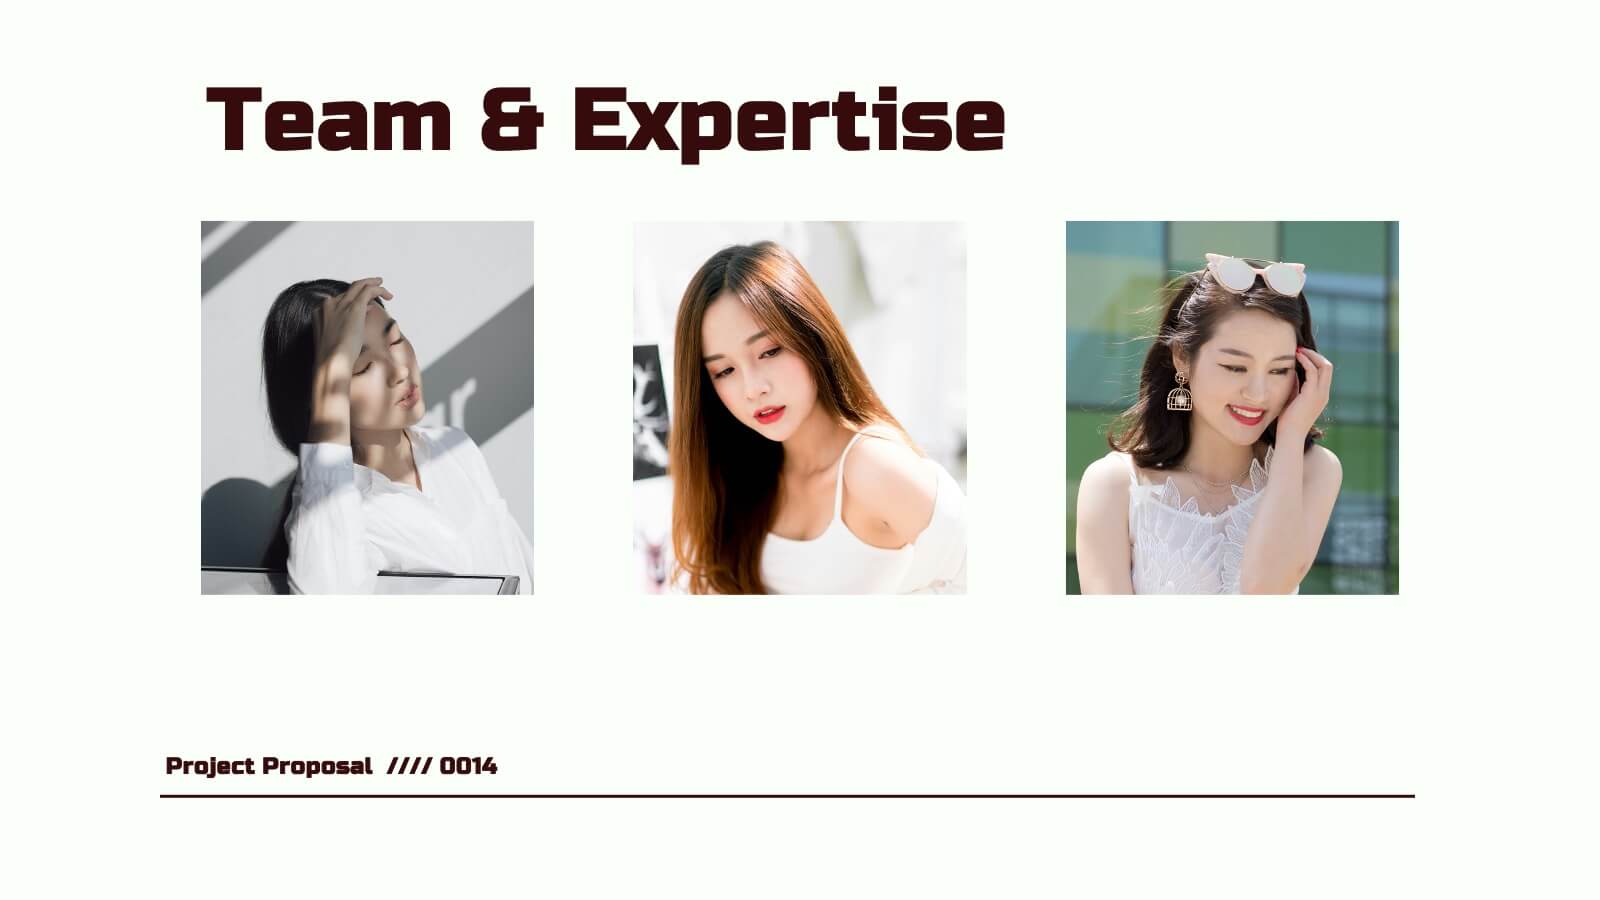
Meet the Business Team Presentation
Ignite curiosity from the start with a clean, modern layout designed to introduce your team with clarity and confidence. This presentation highlights key roles, expertise, and contributions, helping audiences quickly understand who drives the work forward. Fully editable and easy to customize in PowerPoint, Keynote, and Google Slides.


6 diapositivas
Digital Mockup Infographic
This collection of digital mockup templates is expertly designed to showcase your digital products and services with clarity and impact. Whether you are presenting an app, website, or any other digital interface, these templates provide the perfect backdrop, illustrating how your designs perform across different devices such as smartphones, tablets, and desktop computers. The clean, modern aesthetic of each mockup is coupled with a user-friendly layout that emphasizes ease of use and visual appeal. The subtle color palettes and strategic use of space ensure that your product stands out, making these mockups a valuable tool for professionals in software development, digital marketing, and graphic design. Customizable elements allow you to adapt each template to fit your specific project needs, making it straightforward to insert your own screenshots and text. Use these mockups in client presentations, marketing materials, or portfolio showcases to communicate the functionality and aesthetics of your digital products effectively.