


Características


¿Tienes alguna pregunta?
Recomendar


6 diapositivas
Funding Request Project Proposal
Visually communicate your project's financial needs using this tiered Funding Request Project Proposal slide. With a stacked layout ideal for outlining budget categories or funding stages, it’s perfect for grant applications, investor decks, or internal pitches. Fully customizable in PowerPoint, Keynote, and Google Slides.


7 diapositivas
Problem Solving Infographic
Transform your approach to complex challenges with our Infographic Templates, crafted to facilitate effective problem-solving. This set offers a range of designs that make it simple to map out solutions, visualize decision processes, and communicate actionable strategies. With options from hexagonal designs that interlink components to sleek, linear layouts that guide the viewer through each step of the problem-solving journey, these templates are ideal for making complex information accessible and engaging. Customize each template with your choice of colors, fonts, and text to maintain a consistent brand identity. Compatible with PowerPoint, Google Slides, and Keynote, they are perfect for business strategists, project managers, and consultants who need to present solutions clearly and persuasively. Equip yourself with these templates to drive effective problem-solving and decision-making in your presentations.


7 diapositivas
Fishbone Diagram Infographic Presentation Template
A Fishbone diagram, also called a cause-and-effect diagram, is a tool used to identify and analyze the potential causes of a particular problem or issue. It is named for its shape, which looks like a fish skeleton with the problem or effect as the head and the various causes as the bones. This template includes a variety of different fishbone diagrams, which are representations of fish skeletons that help show you the different causes of a problem. This template is easy to use and you can add your own information to make it look just how you want, and show how different causes are connected.


6 diapositivas
Customer Journey Management Infographic
Map out the customer's path to purchase with our intuitive Customer Journey Management Infographic, perfect for Powerpoint, Google Slides, and Keynote. This visual tool helps businesses understand and enhance the customer experience at every touchpoint. Highlight critical stages from awareness to advocacy with distinct, easy-to-follow layouts. Customize it to fit your brand’s journey, showcasing the interactions and emotions customers encounter. Ideal for marketing strategy sessions and client presentations, it simplifies complex consumer behavior into a clear, actionable pathway.


8 diapositivas
Business Growth Strategies Presentation
Take your vision from concept to expansion with a sleek, modern presentation designed to highlight progress and future potential. Ideal for showcasing goals, performance metrics, and market strategies, it keeps your ideas structured and engaging. Fully compatible with PowerPoint, Keynote, and Google Slides for effortless customization and presentation delivery.


6 diapositivas
Social Relationship Infographics
Revitalize your presentations on social dynamics with our Social Relationship infographic, seamlessly compatible with Powerpoint, Keynote, and Google Slides. This infographic is a perfect addition for sociologists, relationship coaches, and educators who aim to discuss the complexities and interconnectedness of social relationships. The infographic offers a visual breakdown of different social relationship types, the dynamics within those relationships, and the factors influencing social interactions. It's designed to help audiences understand the different layers and nuances that make up social connections, whether in personal networks, communities, or professional environments. Incorporating this infographic into your presentations will assist in illustrating how relationships are formed, maintained, and evolved. It serves as an educational tool that can lead to deeper discussions about social bonds, communication patterns, and relationship management. Utilize this infographic to provide a clear and impactful visual representation of the fundamental concepts in social relationship studies.


22 diapositivas
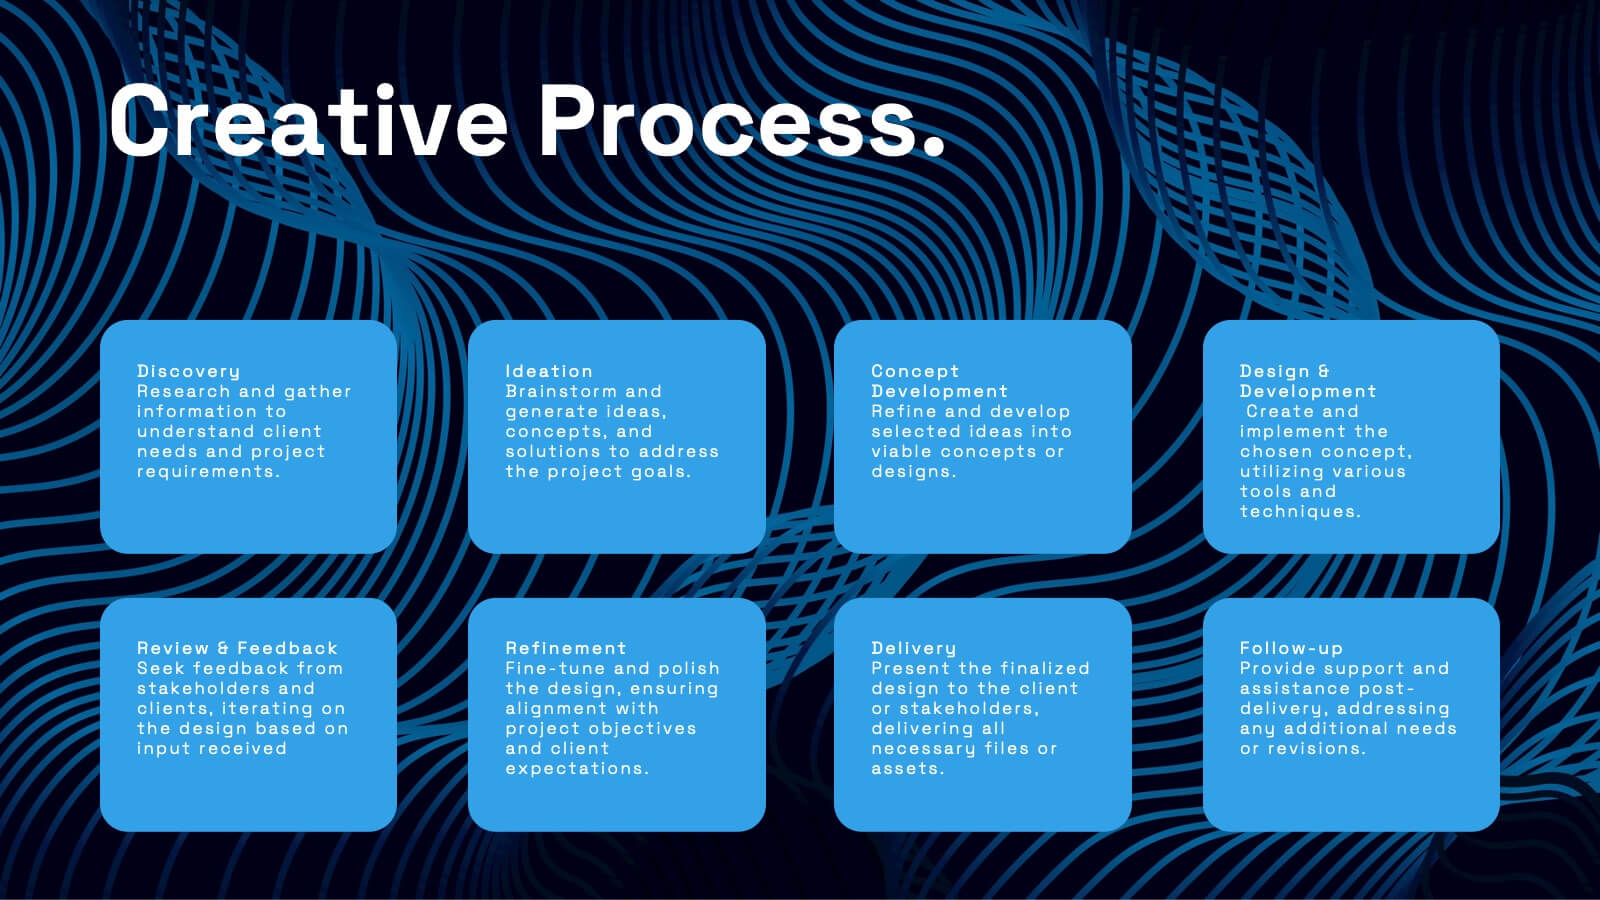
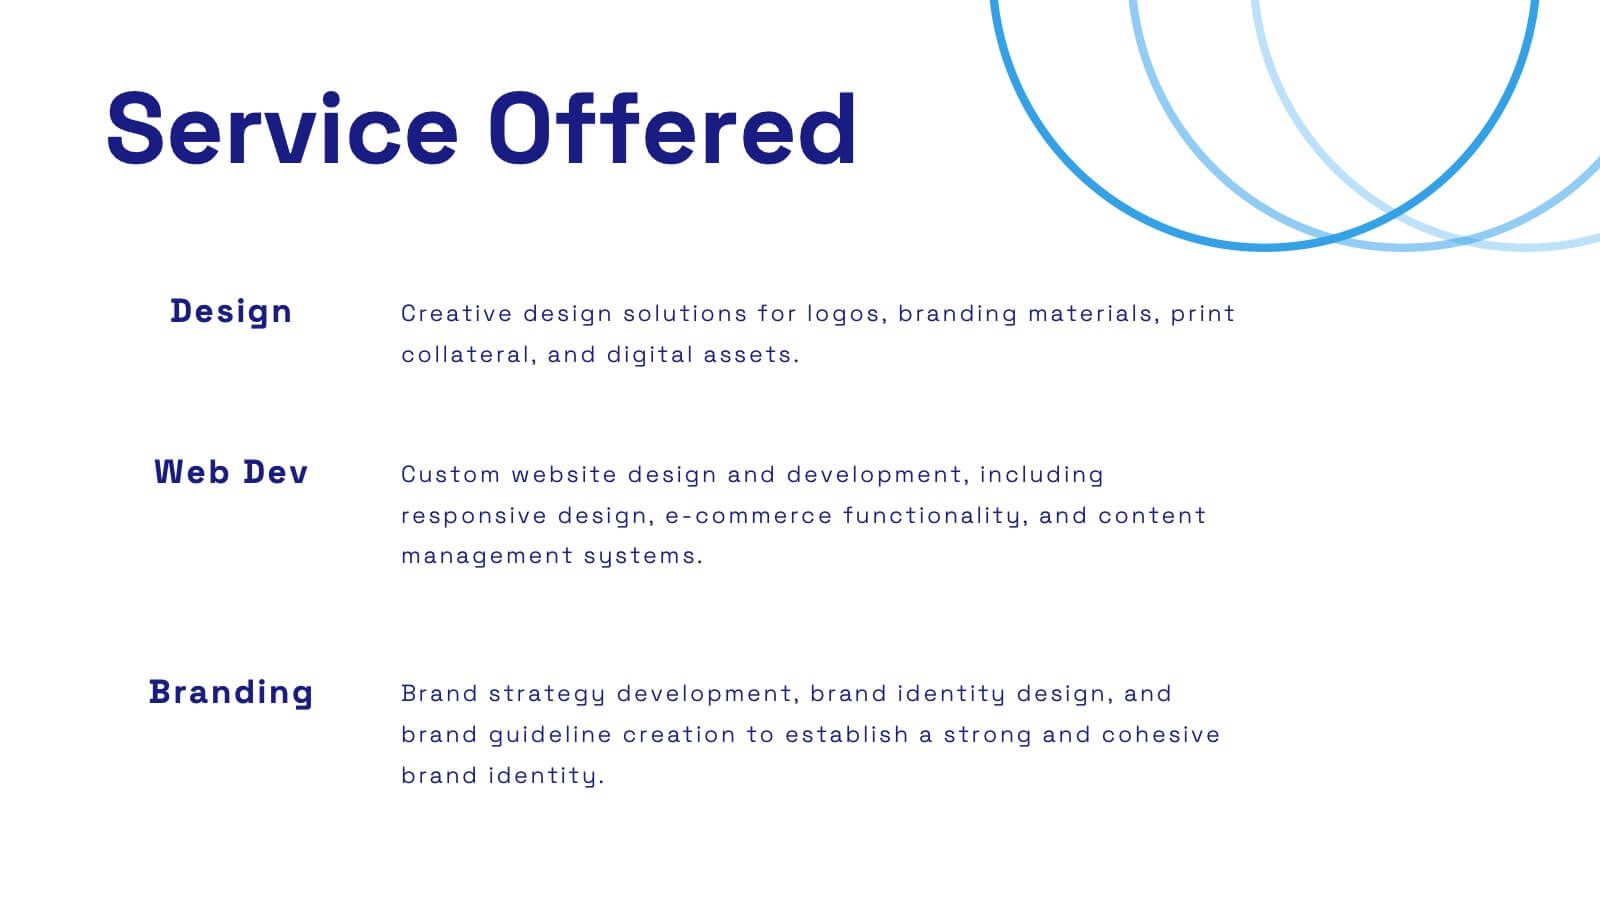
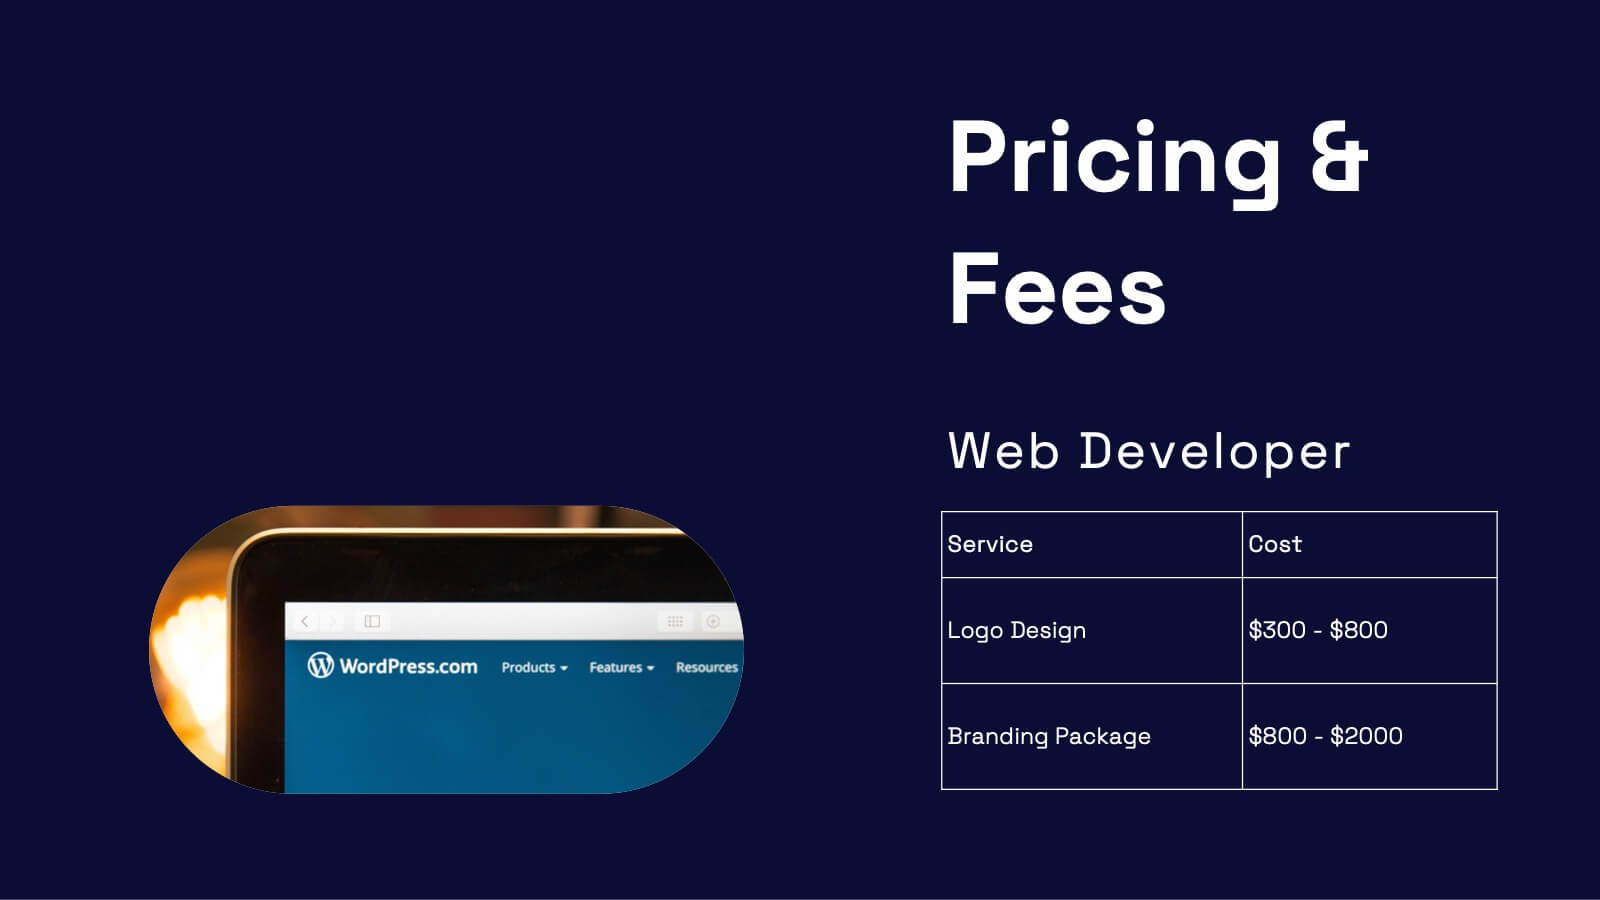
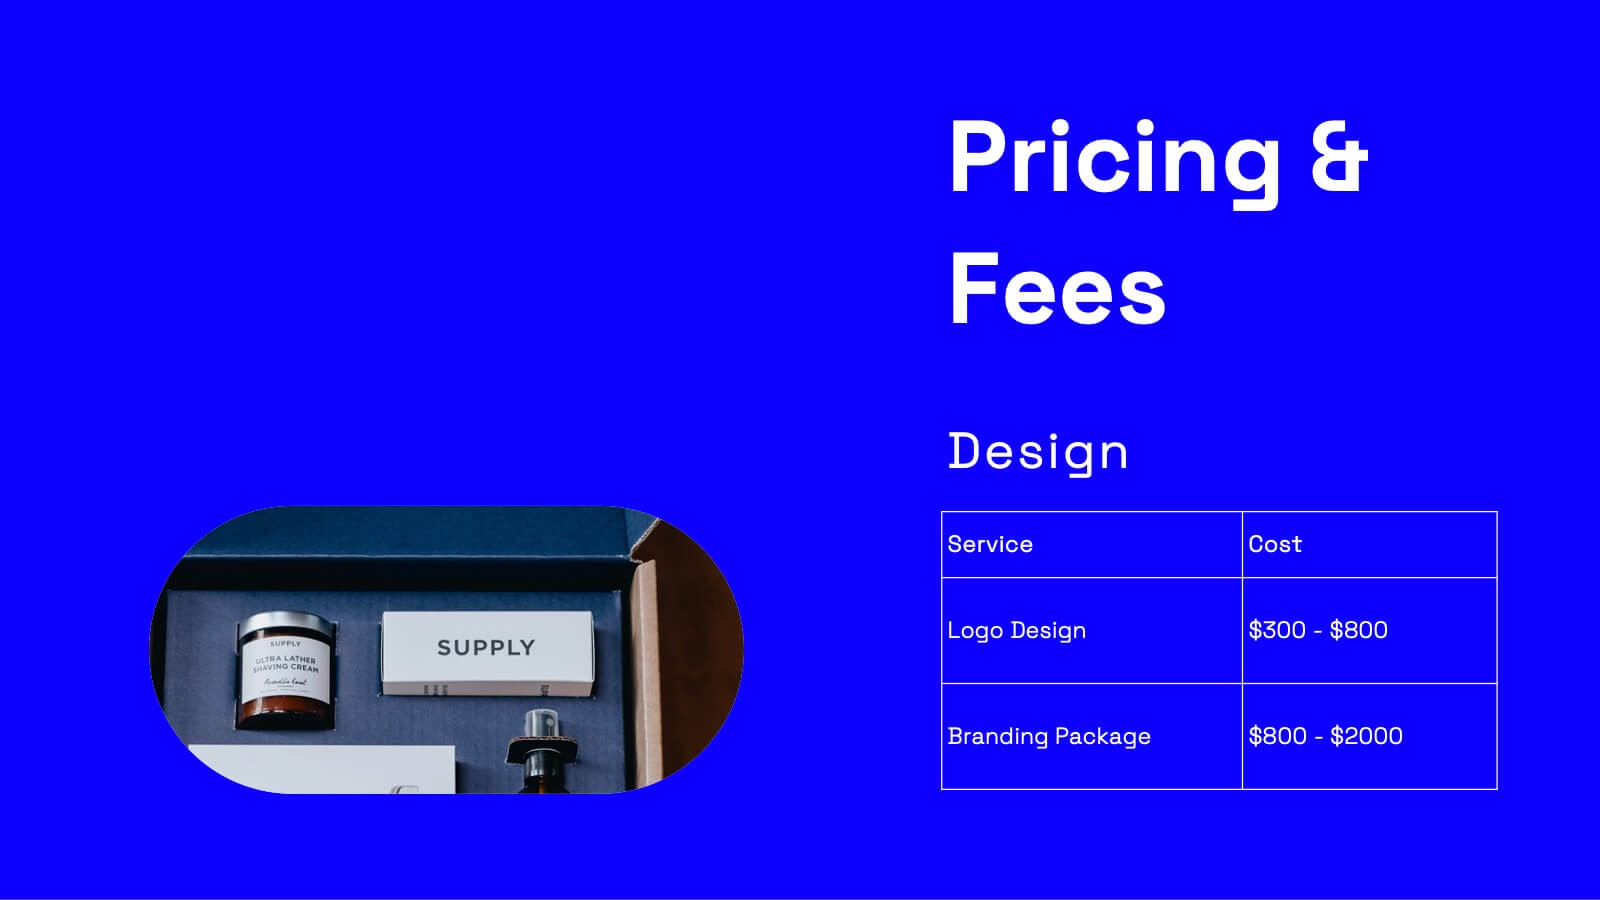
Wanderer Professional Portfolio Showcase Presentation
Showcase your creative work with this sleek, modern portfolio template. Perfect for highlighting your projects, philosophy, and client testimonials, it features a professional design with a dynamic layout. Display your awards, services offered, and pricing clearly to impress potential clients. Compatible with PowerPoint, Keynote, and Google Slides, it ensures seamless presentations on any platform.


6 diapositivas
Strategy Planning with Business Model Canvas Presentation
Streamline your strategy planning with this Business Model Canvas template. Designed to help entrepreneurs, business owners, and teams outline key business elements, this slide organizes essential components like value propositions, customer segments, revenue streams, and cost structures. Fully editable in PowerPoint, Keynote, and Google Slides, allowing seamless customization to match your branding and business needs.


6 diapositivas
SCRUM Framework Infographics
The "SCRUM Framework" infographic template is a dynamic and insightful tool, meticulously crafted for PowerPoint, Keynote, and Google Slides. This template is essential for project managers, agile coaches, and development teams striving to elucidate the intricacies and benefits of the SCRUM methodology in their projects. This template adeptly breaks down the SCRUM framework into its core components: roles, events, and artifacts. It showcases the iterative process of product development, sprint planning, daily stand-ups, sprint reviews, and retrospectives. The visual representation of SCRUM roles – Product Owner, SCRUM Master, and Development Team – along with the flow of activities, makes it an indispensable resource for SCRUM training, agile transformation initiatives, and team workshops. The design is as agile as the methodology it represents, with a color scheme that encourages clarity, focus, and energy. This not only makes the presentation visually compelling but also reinforces the principles of transparency, inspection, and adaptation that are central to SCRUM. Whether used in corporate training, team onboarding, or educational settings, this template ensures that the "SCRUM Framework" is communicated with precision, clarity, and visual flair.


4 diapositivas
Project Responsibility Assignment Matrix Presentation
Visualize team roles and task accountability at a glance with this Project Responsibility Assignment Matrix. This structured layout categorizes assignments using the RACI model—Responsible, Accountable, Consulted, and Informed—organized by team and position. Ideal for project managers, team leads, and operations planners, it helps ensure clarity, reduce overlap, and promote accountability across departments. Easily editable in PowerPoint, Keynote, and Google Slides for seamless customization and cross-platform use.


23 diapositivas
Volt Business Plan Presentation
The Business Plan Presentation Template offers 23 refined slides to convey goals, strategies, achievements, and action plans. Perfect for team updates, resource allocation, and collaboration opportunities. Designed for PowerPoint, Keynote, and Google Slides, its warm, professional layout ensures clarity while fostering effective communication for corporate or project presentations. Fully customizable.


5 diapositivas
Porter's Model of Competitive Strategy Presentation
The Porter's Model of Competitive Strategy Presentation offers a unique and modern take on the classic 5 Forces framework. Each force—Buyers, Suppliers, Competitors, Substitutions, and New Entry—is visually represented in a pentagonal arrangement, making it easy to see how each element interacts. With customizable sections for text and icons, this layout is perfect for strategic analysis, consulting reports, or business planning. Compatible with PowerPoint, Keynote, and Google Slides.


5 diapositivas
Customer Inquiry and Response Strategy Presentation
Streamline your communication flow with this step-by-step layout ideal for showcasing inquiry handling processes, customer service touchpoints, or lead response timelines. The linear design includes five fully editable stages with icons and text areas to clarify each phase of your strategy. Perfect for CRM teams, sales ops, and client support leaders. Fully customizable in PowerPoint, Keynote, and Google Slides.


23 diapositivas
Dragonveil Product Launch Pitch Deck Presentation
The Product Launch Pitch Deck Presentation Template features 23 fully customizable slides designed to outline key aspects such as market opportunity, revenue model, and sales strategy. Ideal for startups and businesses launching new products, it ensures a compelling pitch. Compatible with PowerPoint, Keynote, and Google Slides.


7 diapositivas
World Map Weather Infographic
A world weather map is a graphical representation that displays current weather conditions and forecasts across different regions of the world. Unveil the world's atmospheric tapestry with our world map weather infographic template. This visually stunning and informative infographic is your passport to understanding global weather patterns, giving you a clear view of climate diversity and trends across continents. This template is designed to provide an overview of various meteorological parameters, including temperature, precipitation, wind speed and direction, humidity, and atmospheric pressure.


4 diapositivas
AIDA Marketing Funnel Slide Presentation
Capture attention from the very first slide with a bold, structured layout that turns each stage of your message into a clear, engaging flow. This presentation helps simplify complex decision paths and guide viewers through each step with ease. Fully editable and compatible with PowerPoint, Keynote, and Google Slides.


6 diapositivas
Change Management Model Infographics
Navigate organizational change effectively with our Change Management Model infographic template. This template is fully compatible with popular presentation software like PowerPoint, Keynote, and Google Slides, allowing you to easily customize it to illustrate and communicate the key components of a change management model. The Change Management Model infographic template offers a visually engaging platform to outline the stages, strategies, and best practices for managing change within an organization. Whether you're a change management professional, business leader, or team member involved in change initiatives, this template provides a user-friendly canvas to create informative presentations and educational materials. Optimize your change management processes with this SEO-optimized Change Management Model infographic template, thoughtfully designed for clarity and ease of use. Customize it to showcase the change model you're using, steps involved, communication strategies, and the importance of addressing resistance to change. Ensure that your audience gains valuable insights into effective change management. Start crafting your personalized infographic today to navigate change with confidence.