


Características


¿Tienes alguna pregunta?
Recomendar


8 diapositivas
Responsibility Assignment Overview Presentation
The Responsibility Assignment Overview Presentation is a practical and visually structured RACI matrix layout, ideal for clarifying team roles across multiple tasks. Featuring a clear grid system, it highlights who is Responsible, Accountable, Consulted, and Informed for each task—ensuring project accountability and team alignment. Each letter is color-coded for easy scanning, with editable placeholders for up to six tasks and roles. Perfect for project managers, HR professionals, and operations teams. Fully customizable in PowerPoint, Keynote, and Google Slides.


6 diapositivas
Closing Summary and Key Takeaway Presentation
End your presentation with clarity using this Closing Summary and Key Takeaways Presentation. The segmented half-circle design helps you highlight up to 5 final messages or calls to action. Each section is color-coded for visual emphasis and easy understanding. Ideal for wrap-up slides, final reflections, or summary overviews. Fully editable in PowerPoint, Keynote, Google Slides, and Canva.


4 diapositivas
Executive Business Planning Roadmap Presentation
Outline your strategic initiatives with this Executive Business Planning Roadmap. Ideal for mapping product development, quarterly goals, or department plans, this slide helps visualize key stages across multiple projects. Easy to edit in PowerPoint, Keynote, and Google Slides—perfect for leadership updates, planning meetings, or executive-level presentations.


5 diapositivas
Business Process Checklist Presentation
Ensure smooth workflows with the Business Process Checklist template. This visually structured layout simplifies process tracking, highlighting key steps and completion percentages. Perfect for project managers and teams looking to optimize efficiency. Fully editable and compatible with PowerPoint, Keynote, and Google Slides for easy customization and seamless presentation.


6 diapositivas
Academic Science Infographic Presentation
Bring your scientific insights to life with a clean, engaging slide that turns complex concepts into an easy-to-follow visual story. This presentation highlights key academic data through connected icons and structured text, helping you explain research findings clearly and confidently. Fully compatible with PowerPoint, Keynote, and Google Slides.


4 diapositivas
UX Empathy Map Design Presentation
Spark deeper user understanding with a layout that turns thoughts, feelings, and behaviors into clear visual insights. This presentation helps teams explore customer motivation and improve product decisions through a simple, structured empathy-mapping framework. Fully compatible with PowerPoint, Keynote, and Google Slides.


5 diapositivas
2024 Financial Report Summary Presentation
Turn complex financial data into a clear visual story that’s easy to follow and engaging to present. This clean, data-focused design helps highlight yearly performance, key insights, and budget breakdowns with precision. Fully editable and compatible with PowerPoint, Keynote, and Google Slides for effortless customization and presentation delivery.


5 diapositivas
Framework Diagram Slide Presentation
Bring your ideas to life with a clean, modern layout designed to simplify complex steps and highlight key stages with clarity. This presentation guides your audience through a simple, connected framework, making it easy to explain processes, strategies, or workflows. Fully compatible with PowerPoint, Keynote, and Google Slides.


8 diapositivas
Creative SWOT Breakdown for Business Insight
Analyze your business from every angle with the Creative SWOT Breakdown for Business Insight Presentation. This bold, suitcase-style layout visually separates Strengths, Weaknesses, Opportunities, and Threats with color-coded blocks and percentage highlights for quick comparisons. Designed to simplify strategic analysis, it’s ideal for planning meetings, team workshops, or executive reviews. Fully customizable in PowerPoint, Keynote, and Google Slides.


24 diapositivas
Petricor UX Strategy Plan Presentation
This UX Strategy Presentation offers a structured approach to user experience design, covering key aspects such as user research, wireframing, prototyping, and usability guidelines. With sections on branding, responsive design, and accessibility, this template is ideal for UX professionals. Fully editable and compatible with PowerPoint, Keynote, and Google Slides.


6 diapositivas
Business Success Case Study
Showcase your brand's impact with this clean, image-forward case study slide. Designed for storytelling, it outlines the Problem, Solution, and Approach alongside a product image—perfect for client wins, pitch decks, and brand storytelling. Fully customizable in PowerPoint, Keynote, and Google Slides.


26 diapositivas
Film Industry Vintage Presentation
The film industry, also known as the cinema or movie industry, refers to the collection of companies, professionals, and organizations involved in the production, distribution, and exhibition of films. This presentation template has a nostalgic design tailored for film enthusiasts, filmmakers, historians, or anyone looking to delve into the rich history of cinema. This presentation offers a visually appealing and well-curated journey through the evolution of the film industry, highlighting key milestones, iconic films, and the pioneers who shaped its development. Utilize the vintage illustrations and diagrams to illustrate film advancements.


4 diapositivas
30 60 90 Day Plan Goals Presentation
Set your roadmap in motion with a clean, visual timeline that makes each milestone easy to follow and present with confidence. This presentation helps you outline priorities, track progress, and communicate clear goals for the first three months. Fully editable and compatible with PowerPoint, Keynote, and Google Slides.


5 diapositivas
Financial Credit Card Management Presentation
Present credit card processes, workflows, or customer engagement steps with this clean, step-by-step infographic layout. Featuring five clearly defined stages, icons, and space for key insights, it’s perfect for visualizing application journeys, fraud prevention, or usage optimization. Great for banks, fintech presentations, or financial coaching. Fully editable in PowerPoint, Keynote, and Google Slides.


21 diapositivas
Argentis UX Strategy Plan Presentation
Craft a seamless user experience with this professional UX strategy plan presentation. Covering key topics like user research, interaction design, wireframes, and accessibility considerations, this template helps you present a structured and insightful design approach. Fully customizable and compatible with PowerPoint, Keynote, and Google Slides for a smooth and impactful presentation.


21 diapositivas
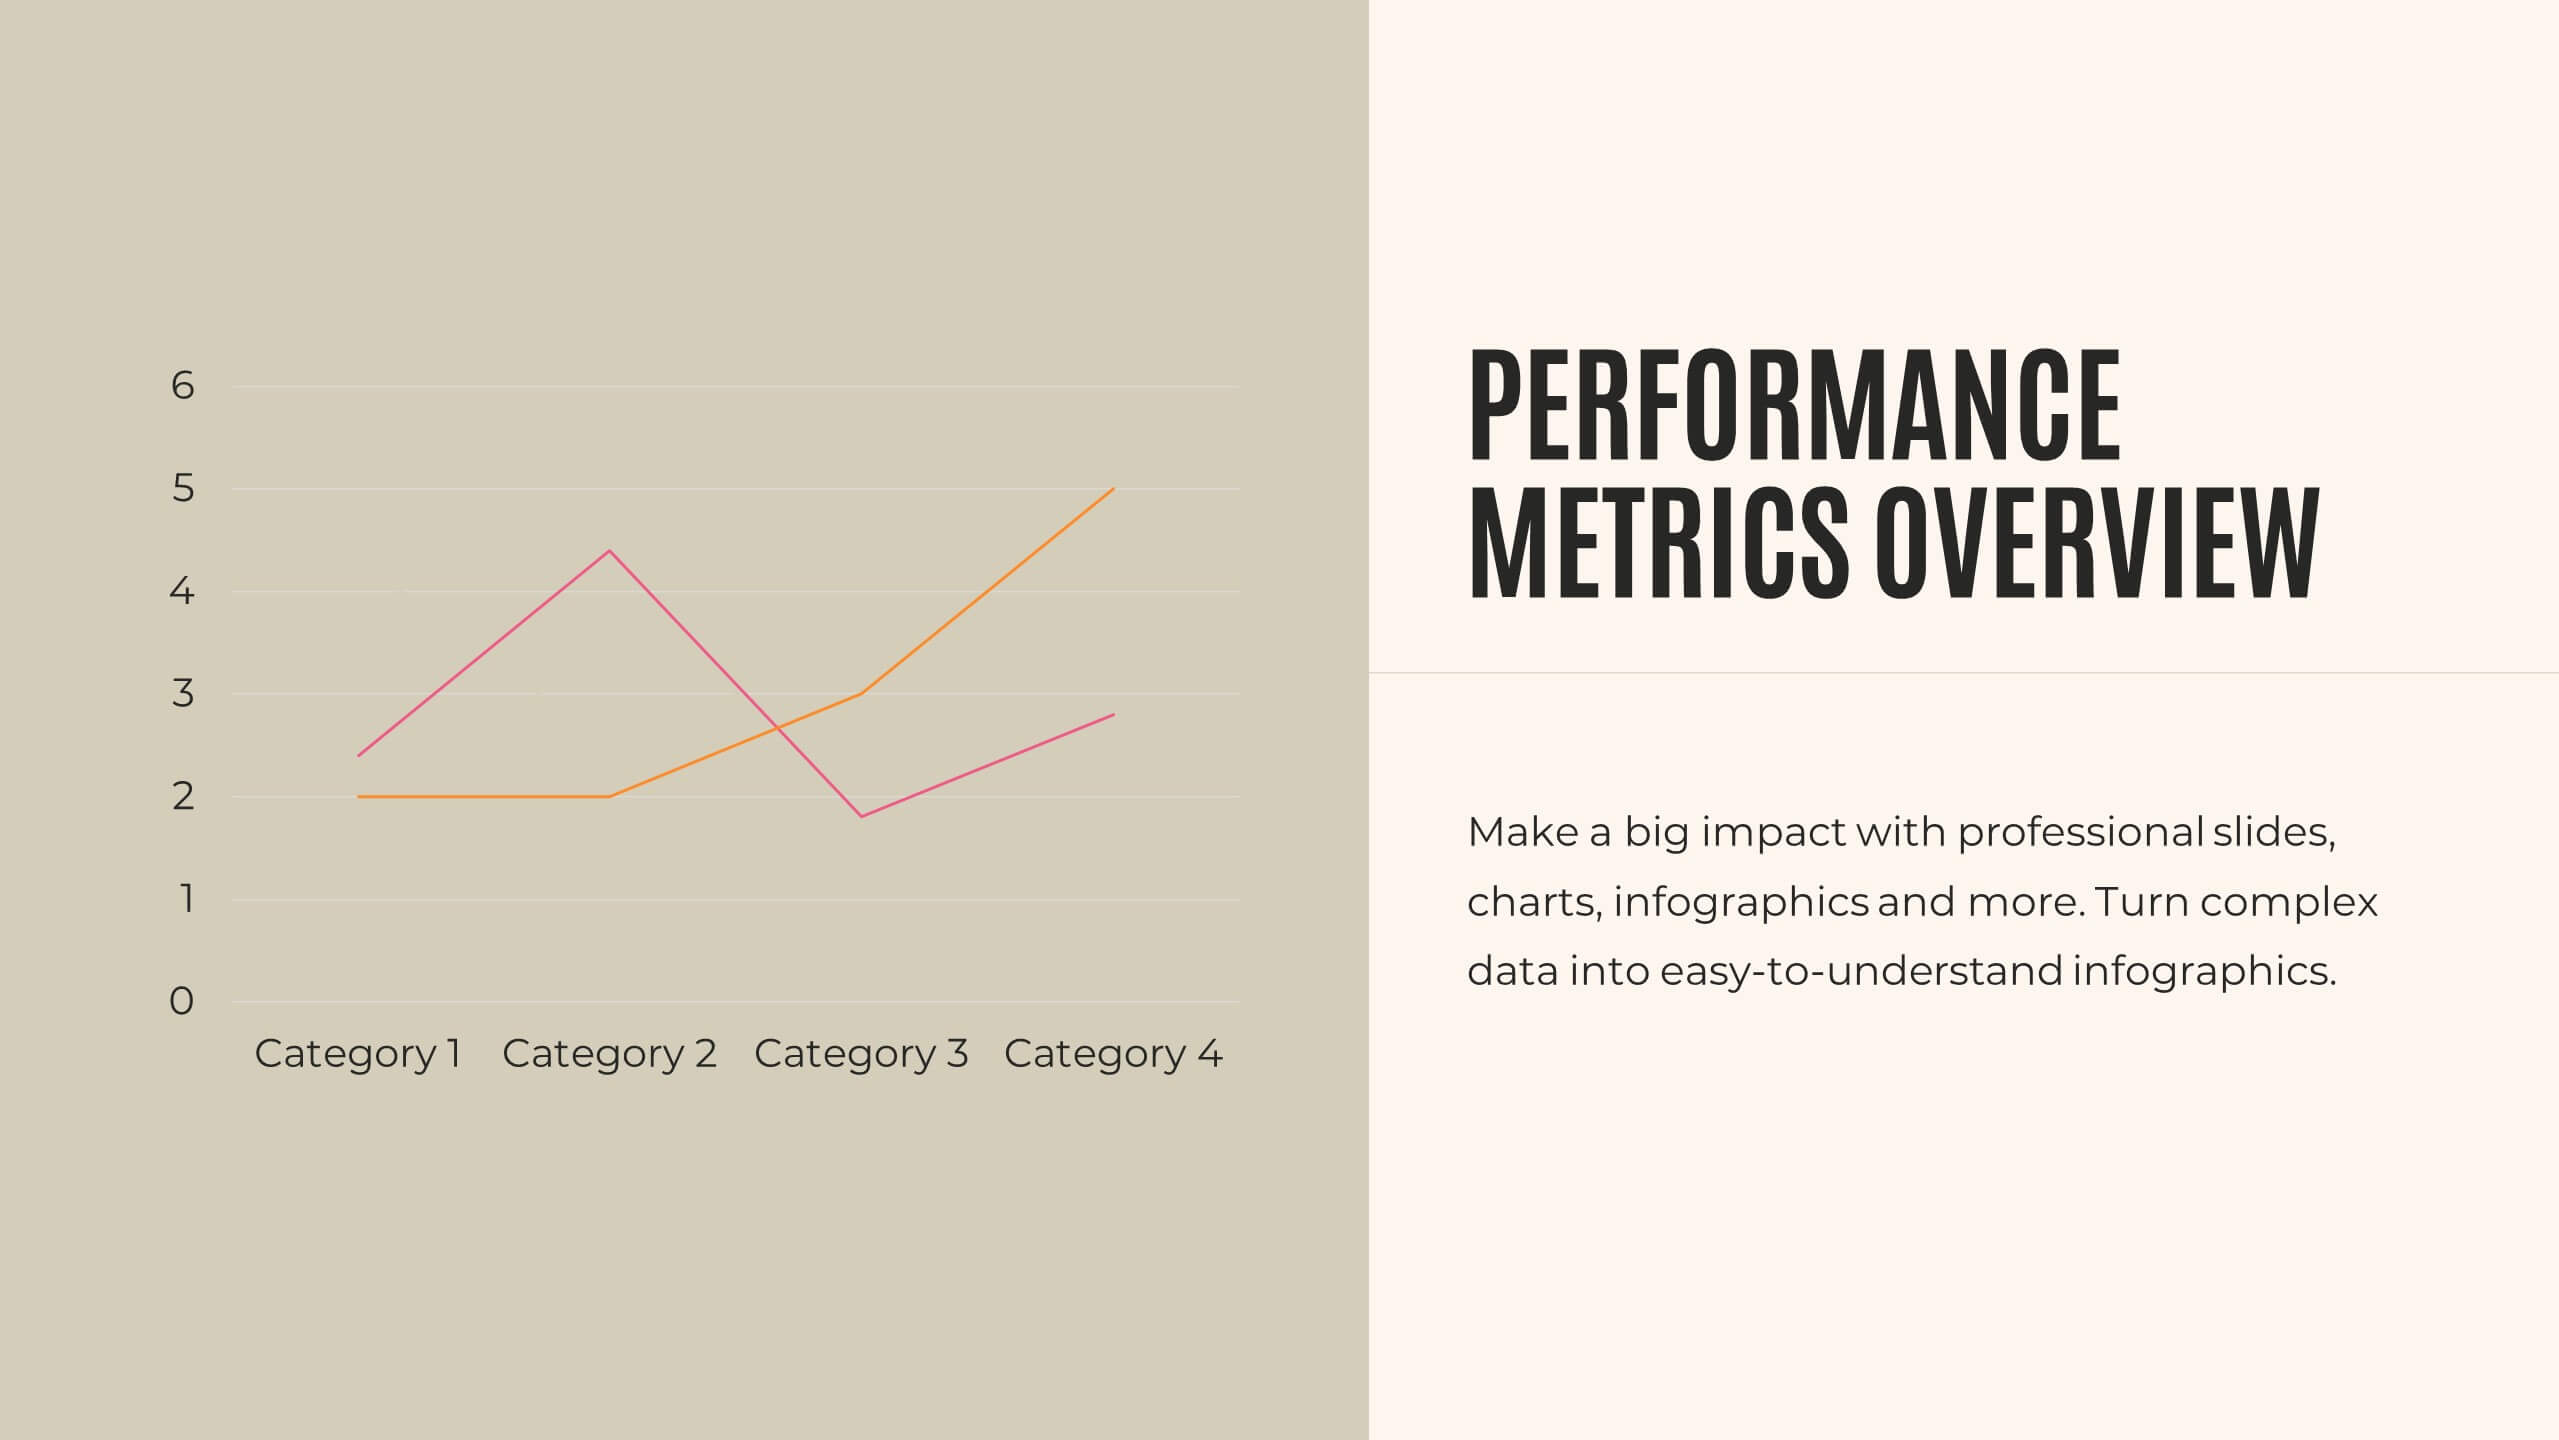
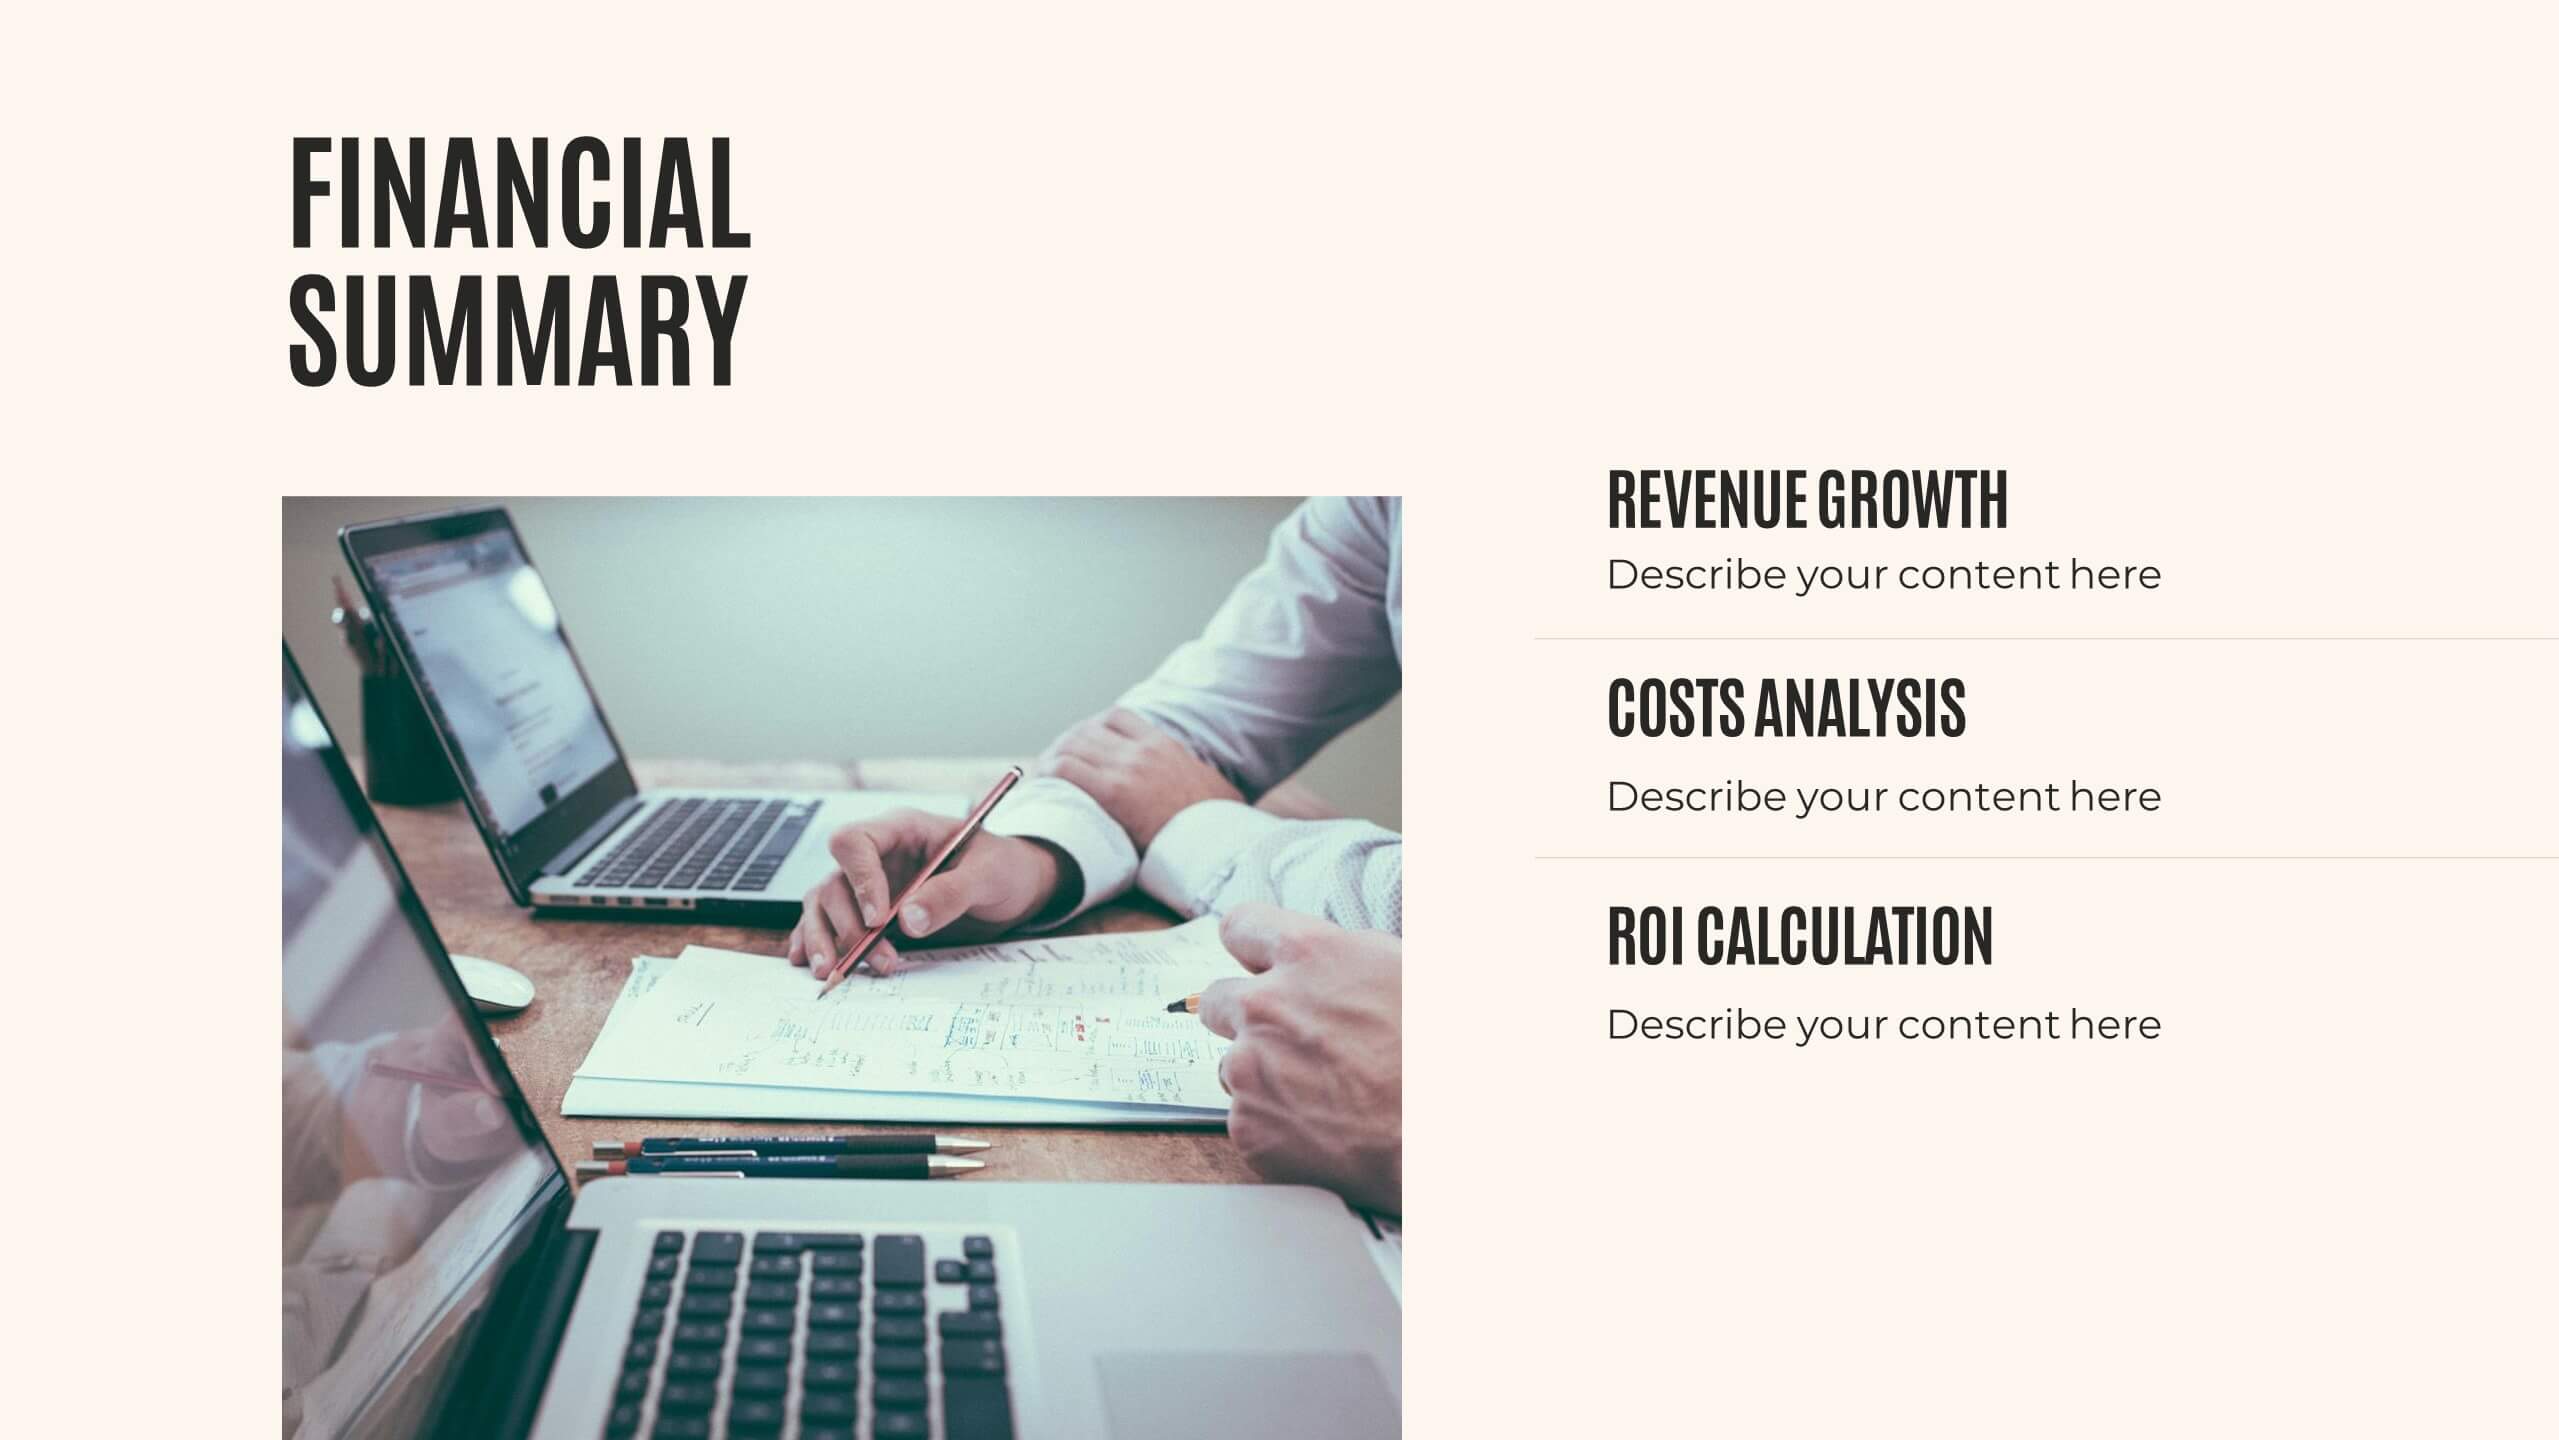
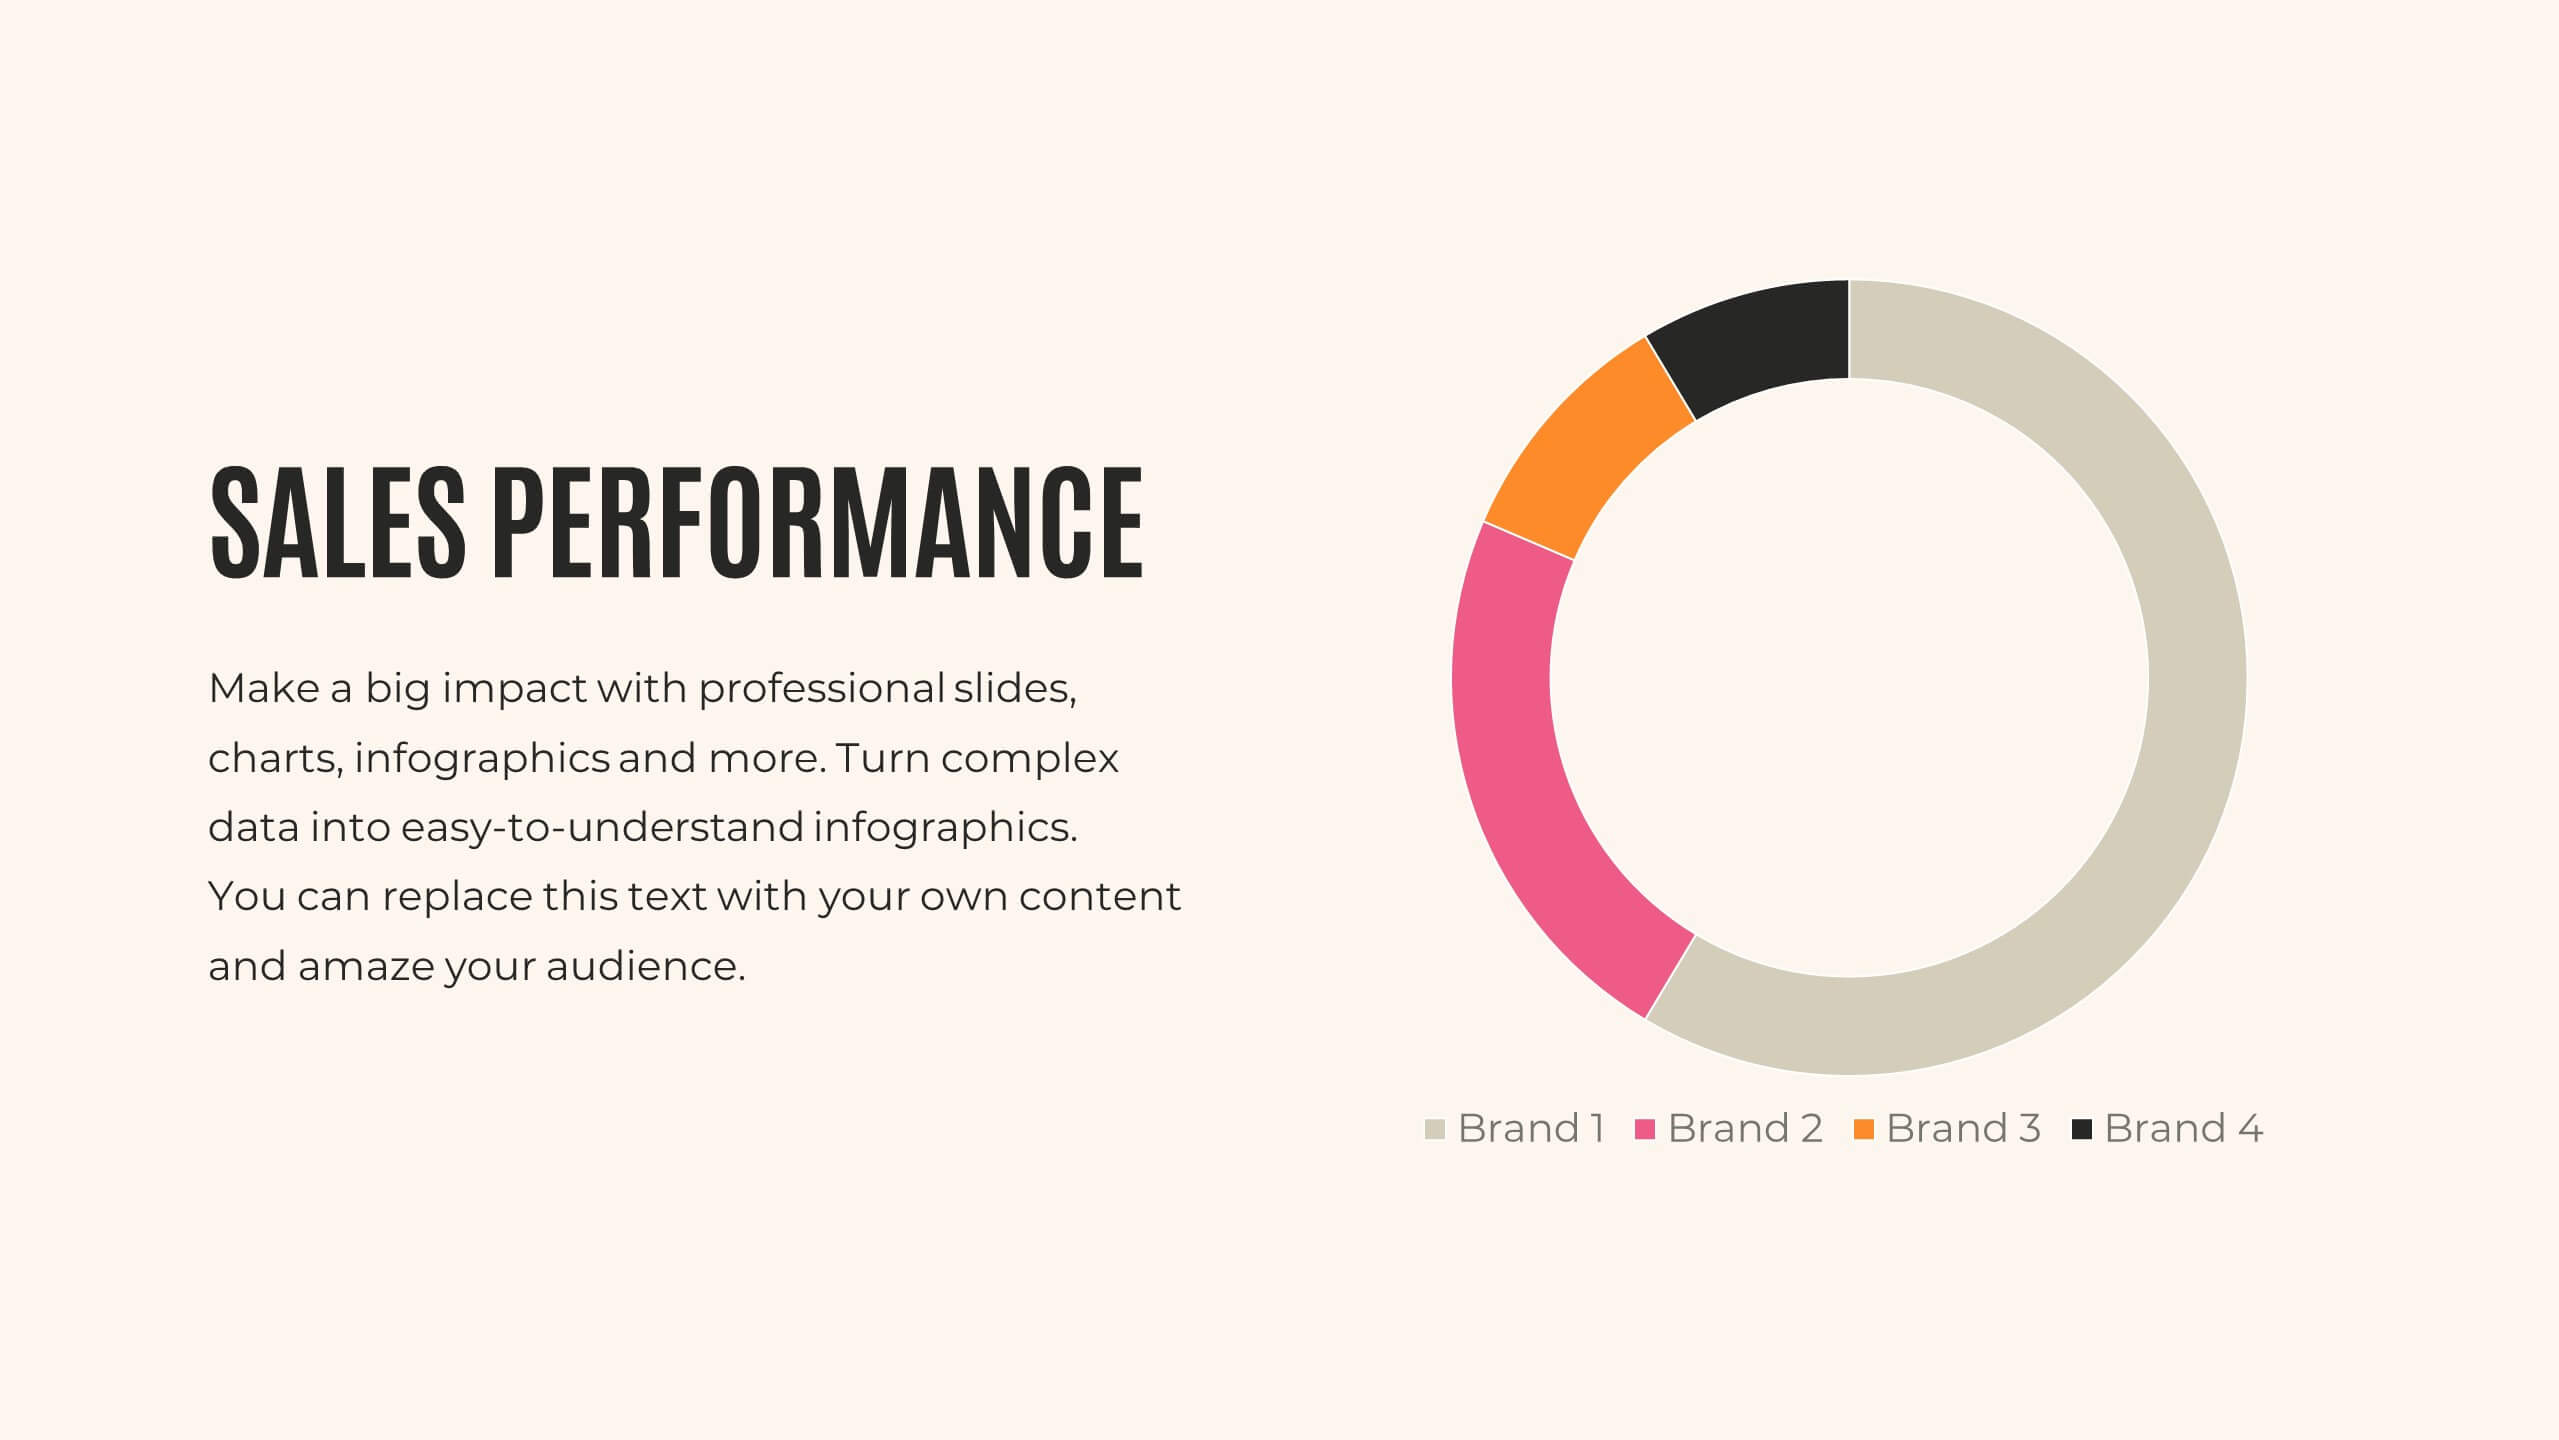
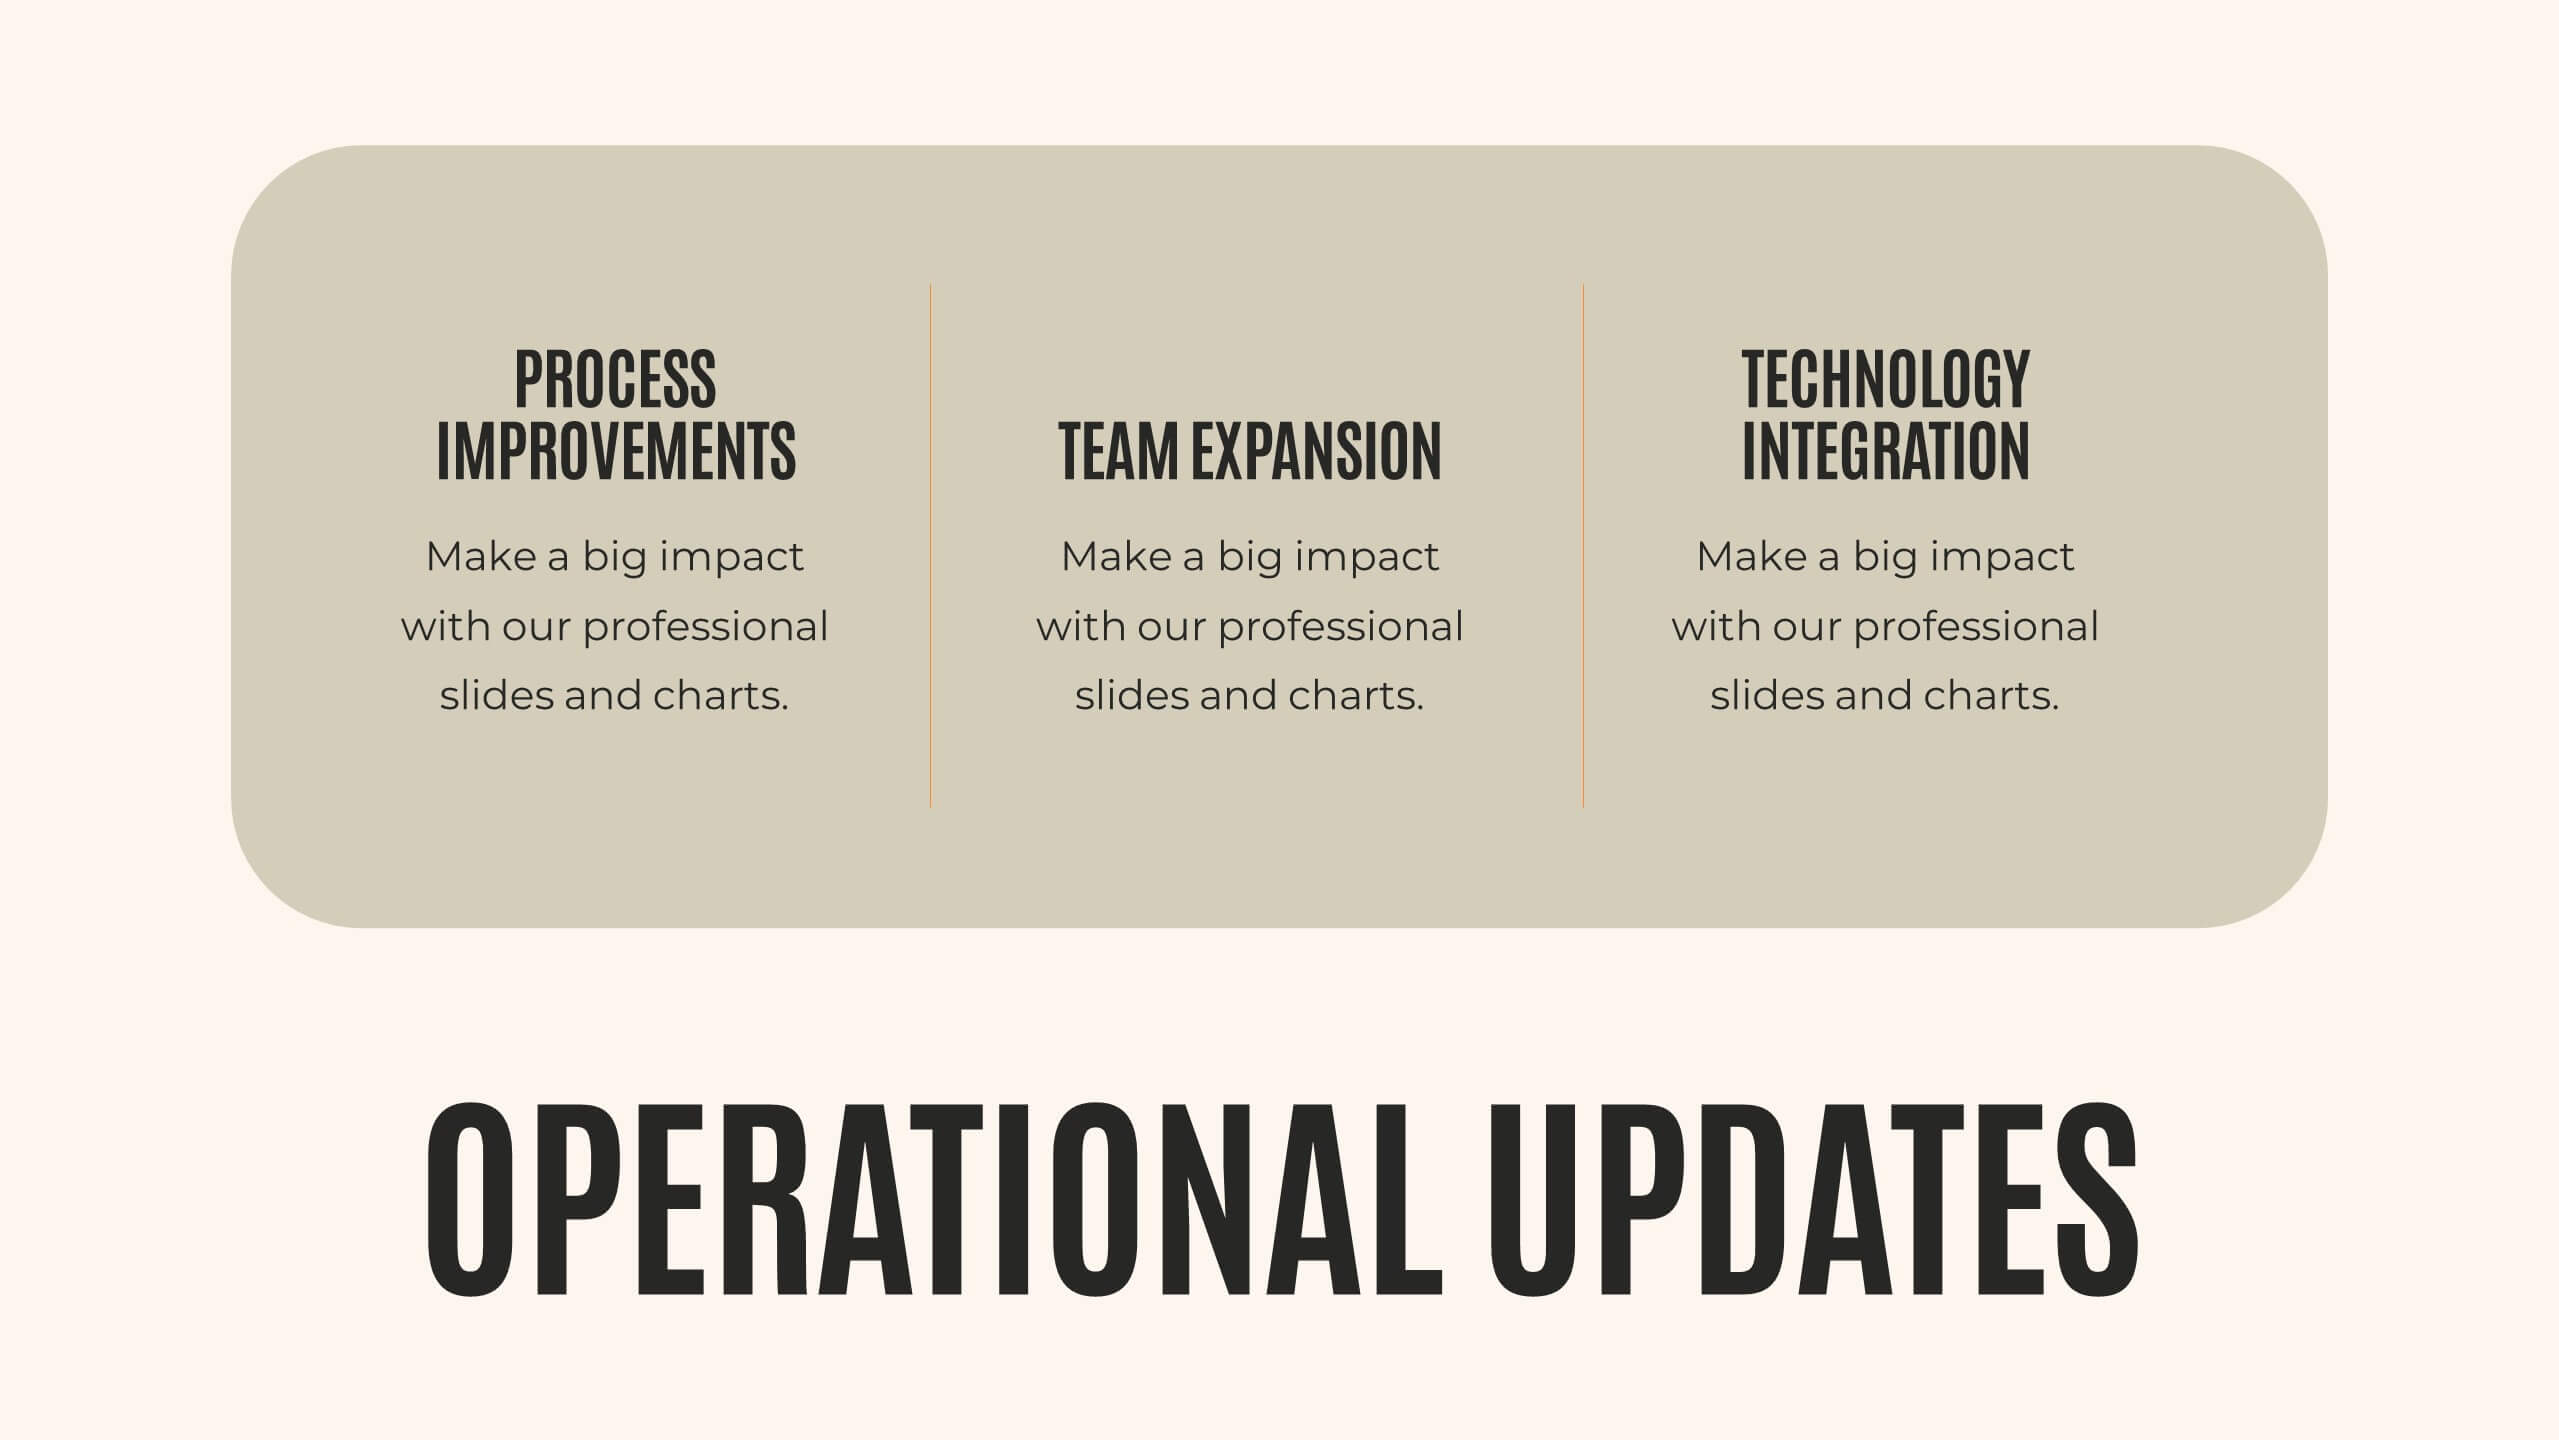
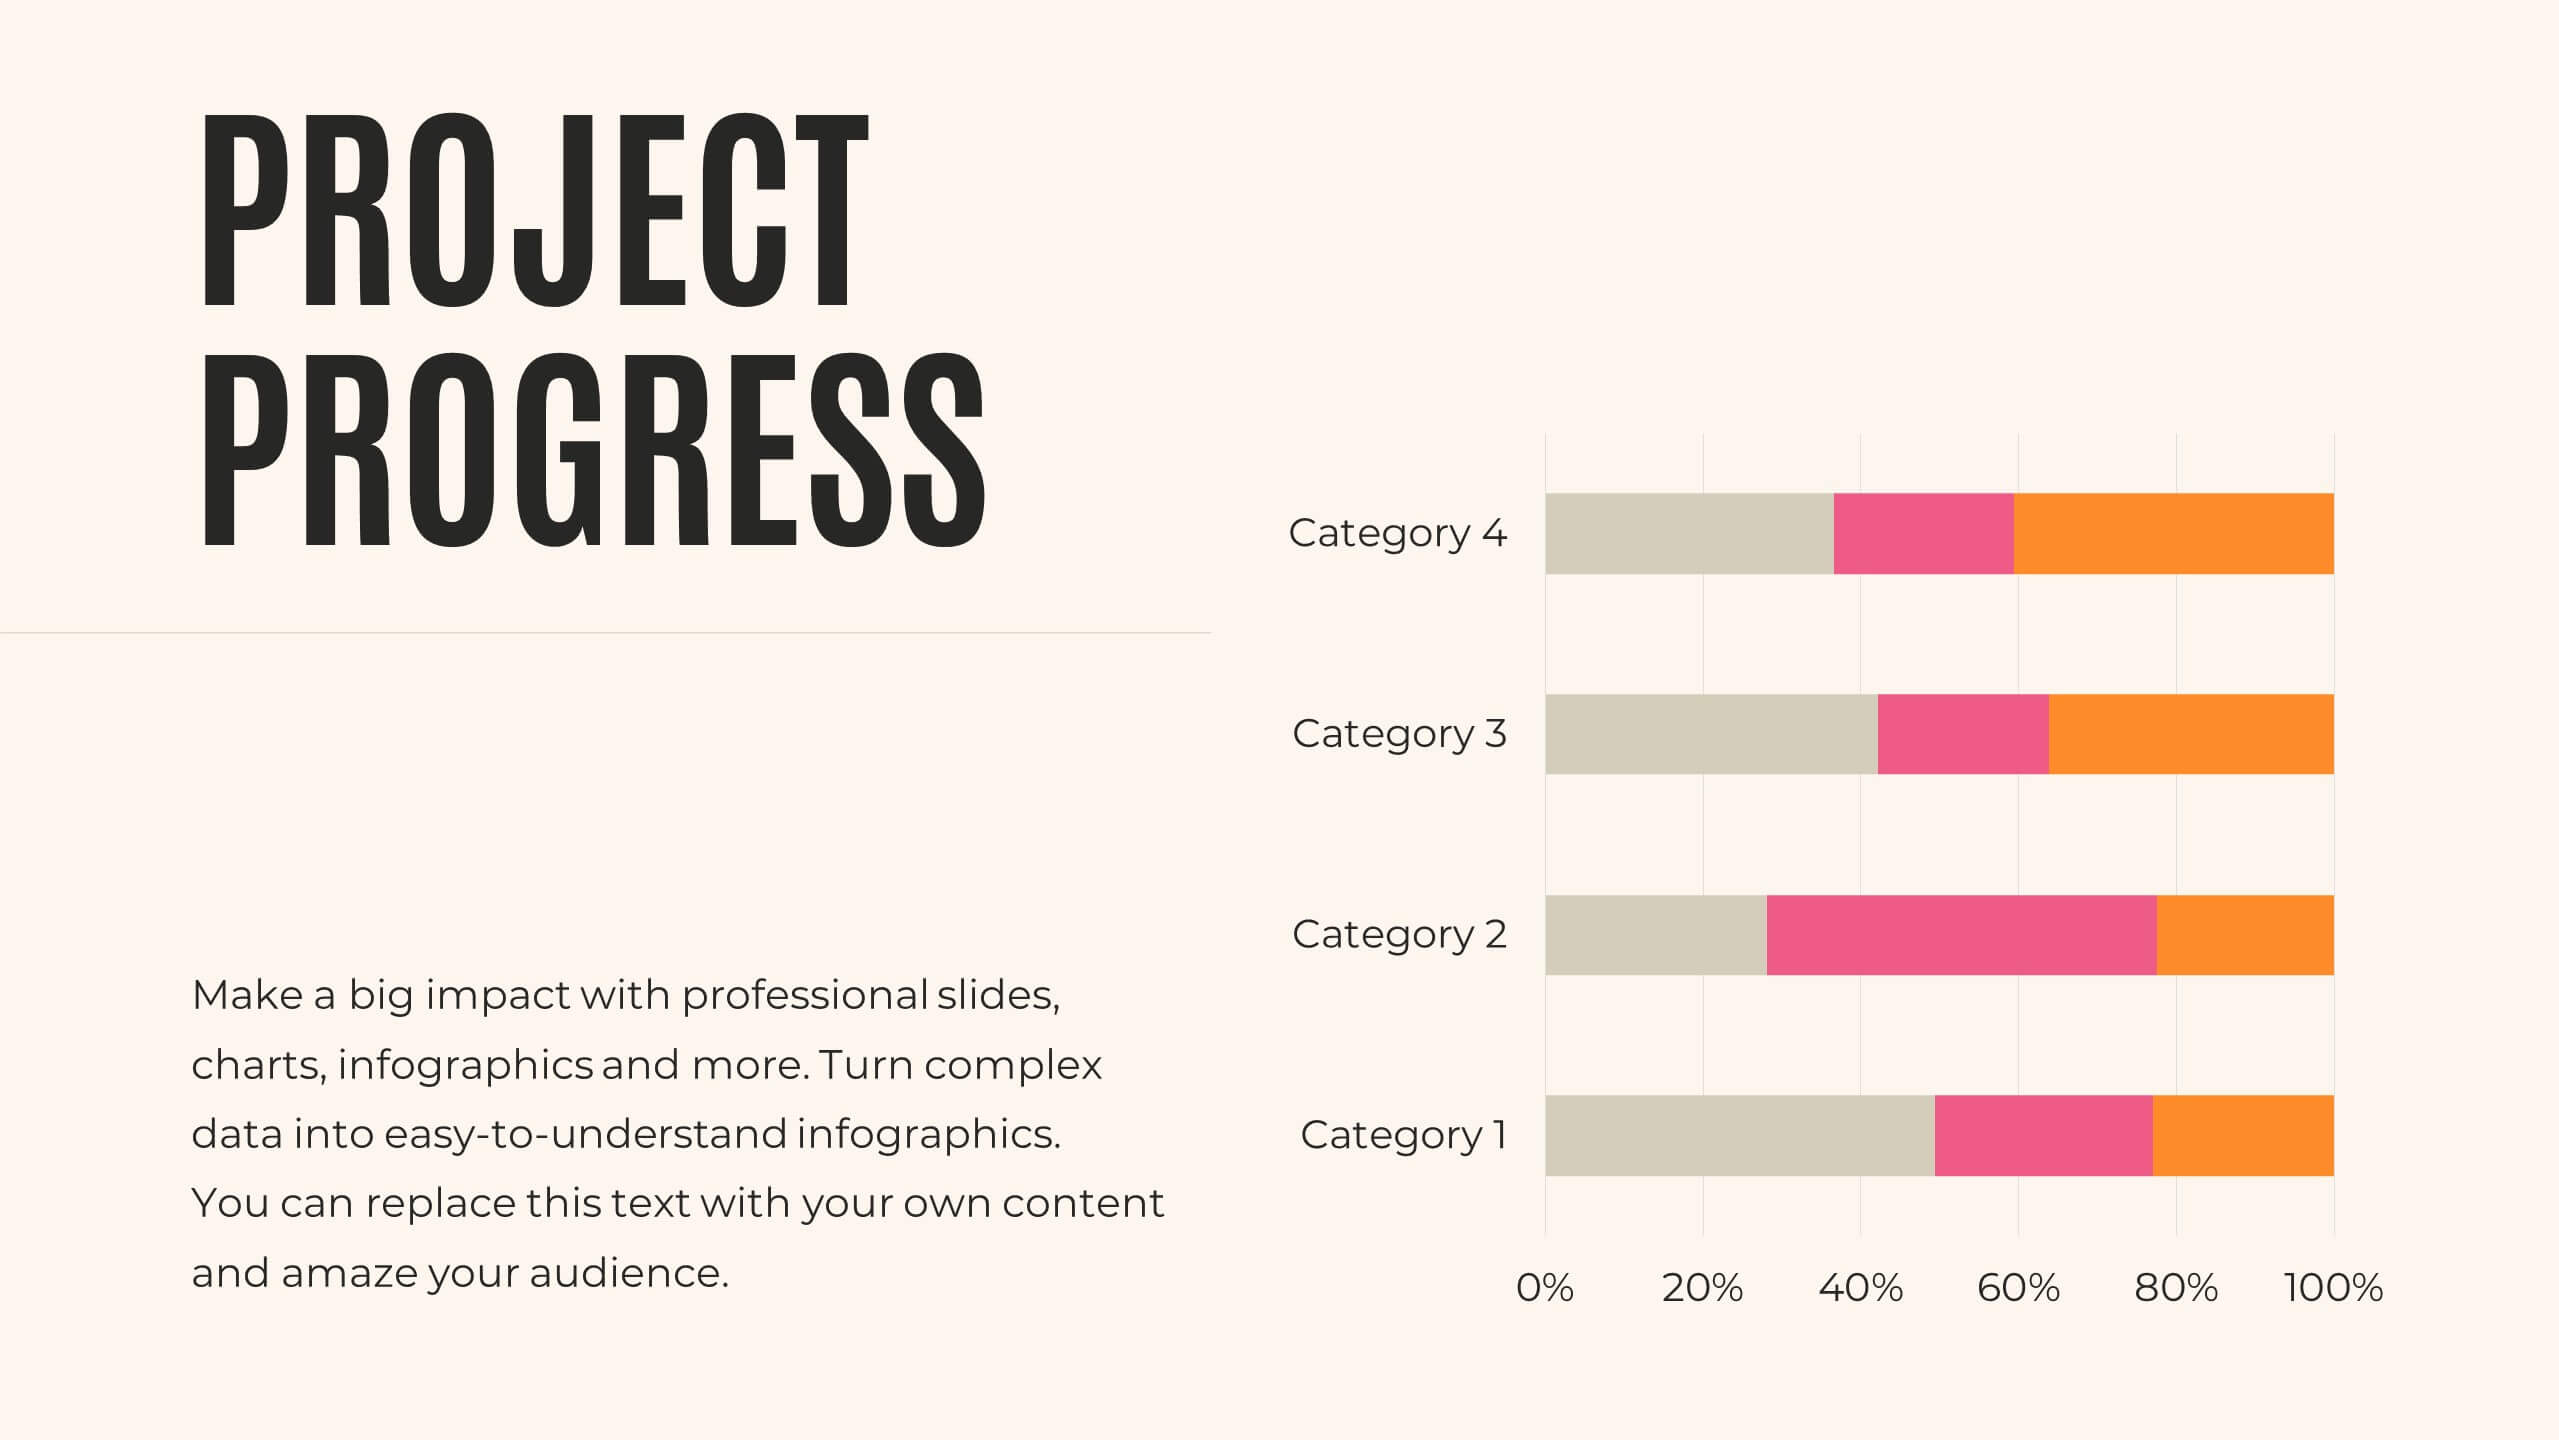
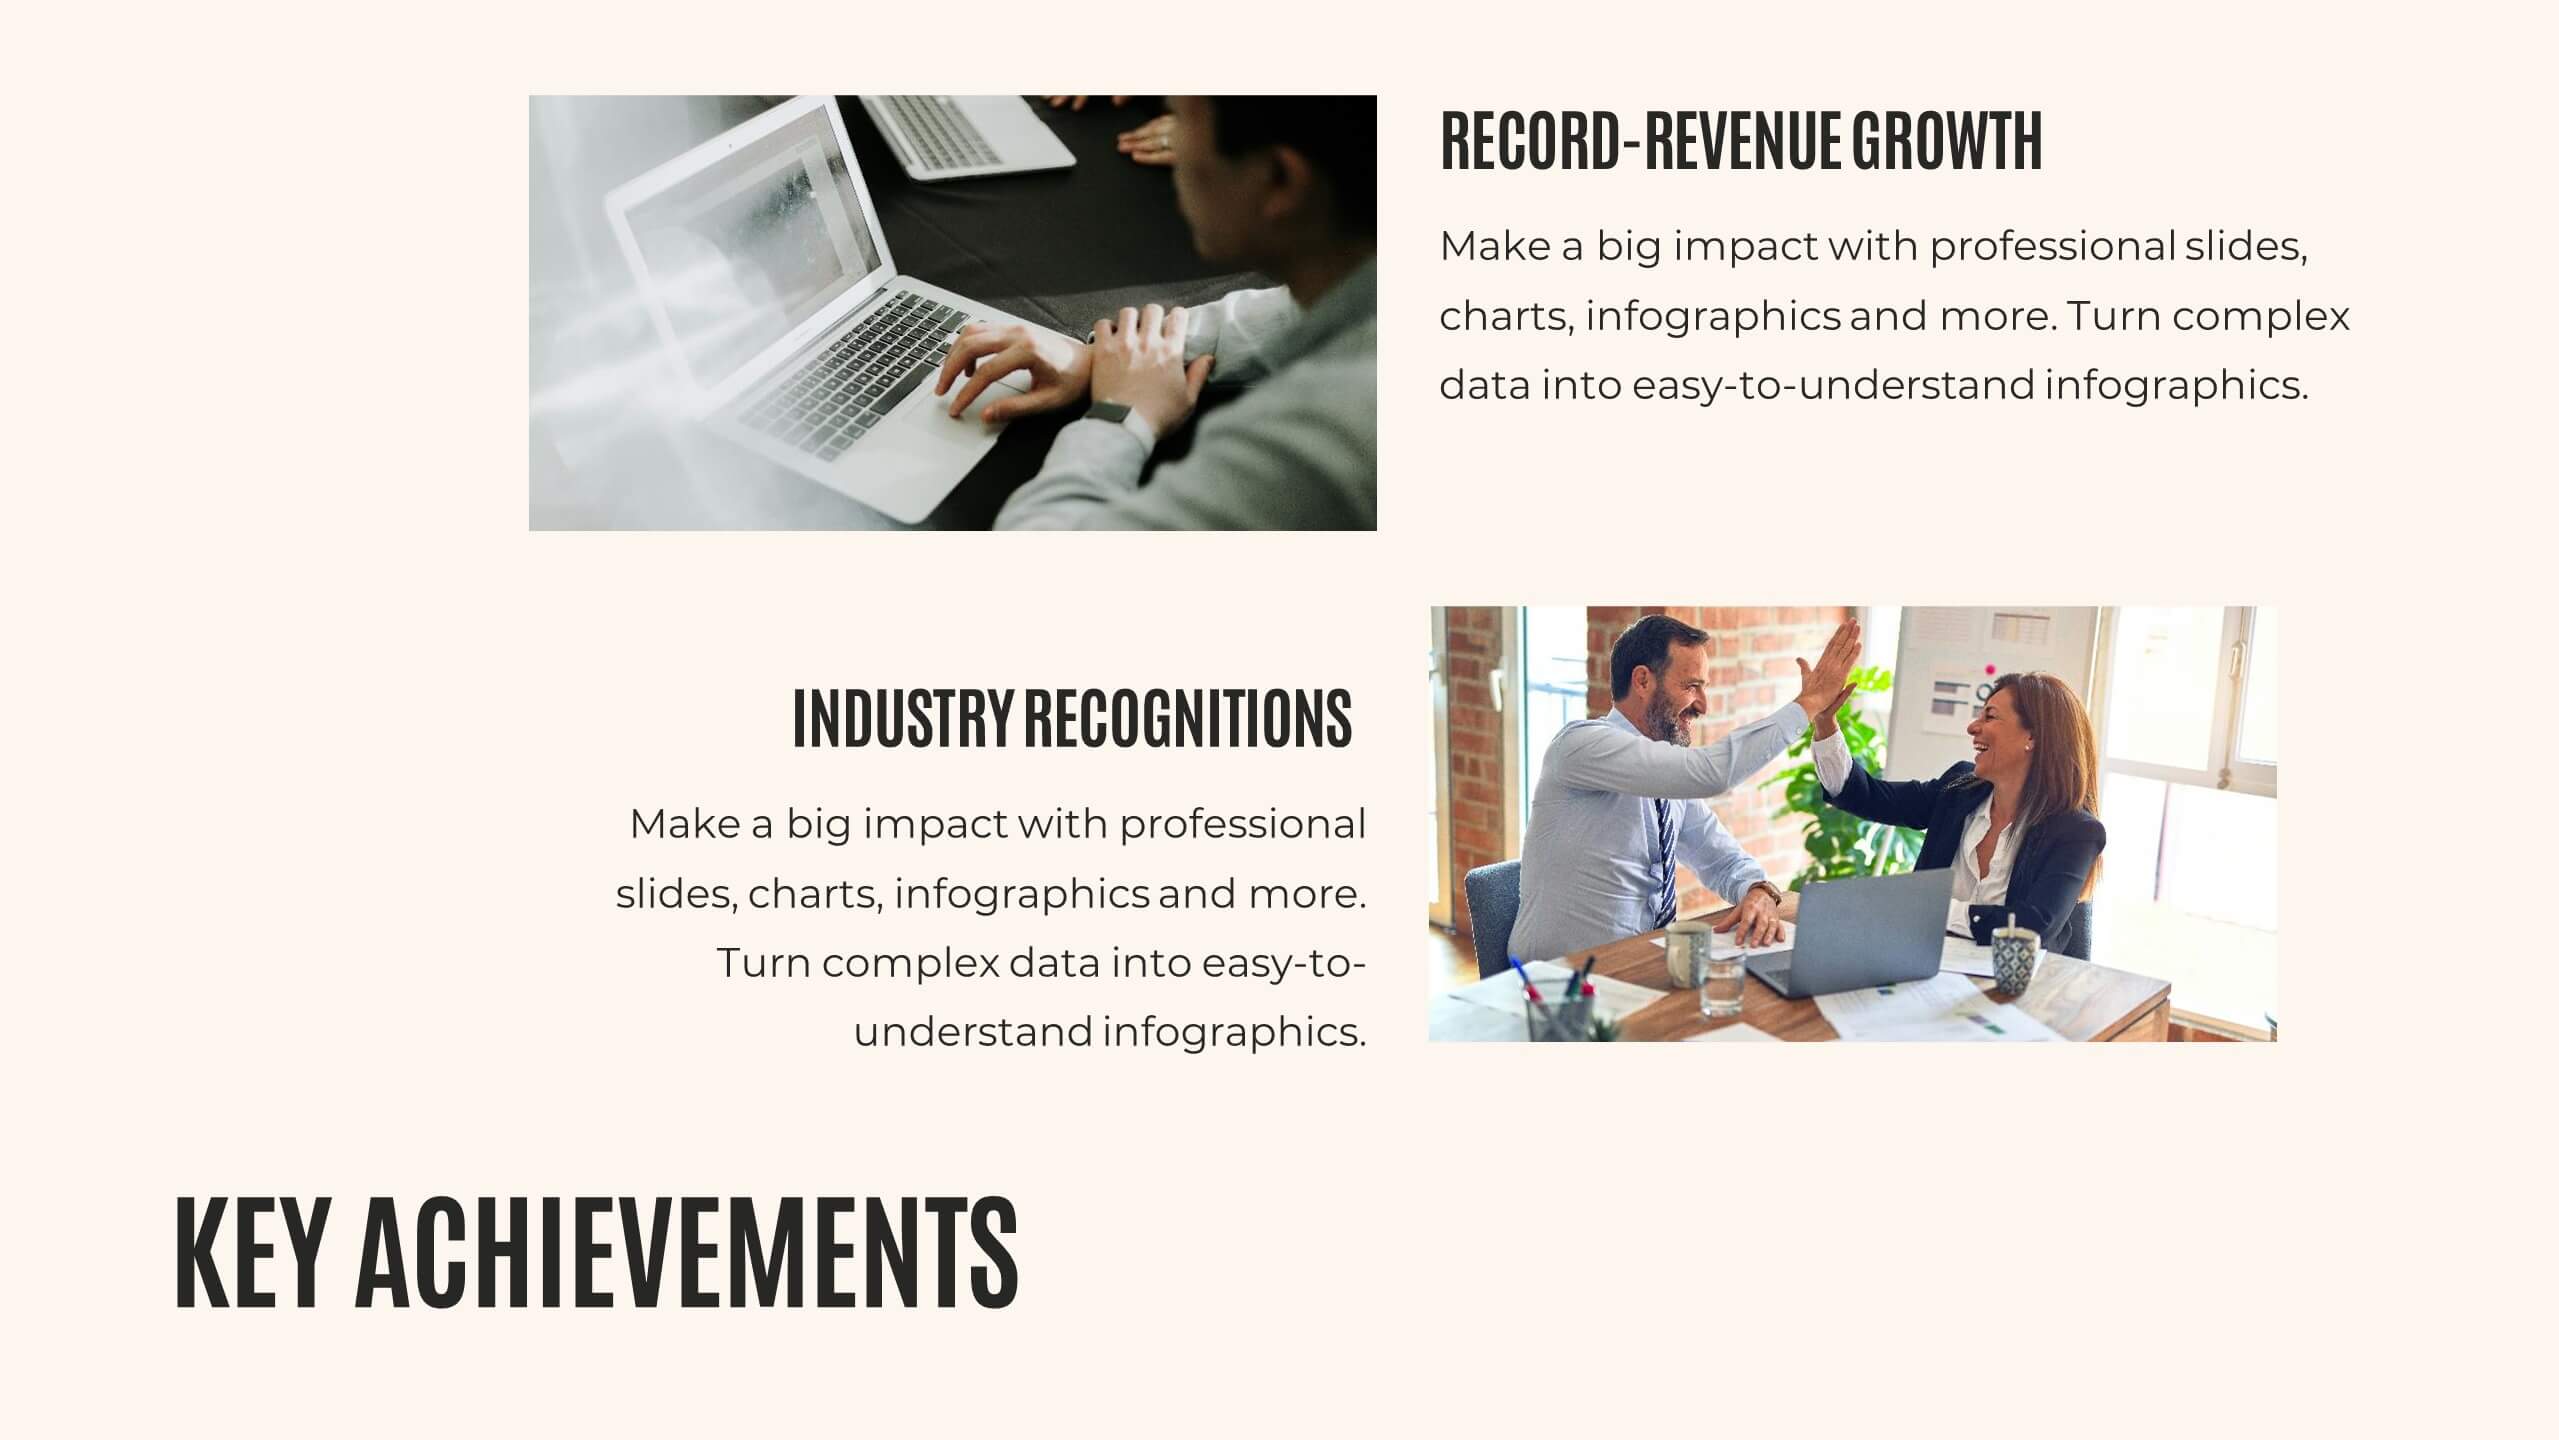
Journey Annual Report Presentation
Present your annual report with clarity and impact! This template covers agenda, key highlights, financial summary, sales performance, and project progress. Ideal for detailing achievements, insights, and future priorities. Compatible with PowerPoint, Keynote, and Google Slides, it ensures your data is visually compelling and easy to understand. Showcase your success effortlessly!


20 diapositivas
Obscuran Sales Performance Report Presentation
Take your sales analysis to the next level with this sleek and professional presentation template. Designed to highlight key areas such as sales objectives, process, performance metrics, competitive analysis, pricing strategy, and future opportunities. This modern layout ensures clarity and impact, making it perfect for sales teams, managers, and stakeholders. Fully customizable and compatible with PowerPoint, Keynote, and Google Slides.